STAFF REPORT FOR THE 2016 ARTICLE IV ... external current account deficit (before official...
18
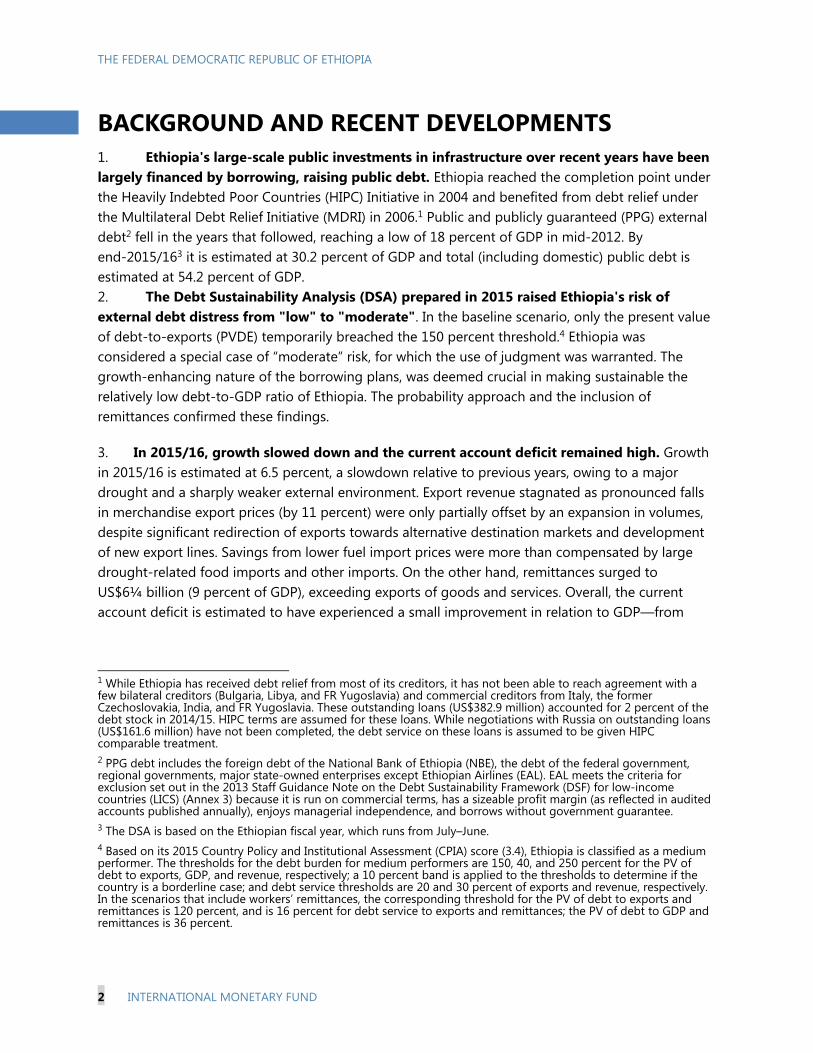
THE FEDERAL DEMOCRATIC REPUBLIC OF ETHIOPIA STAFF REPORT FOR THE 2016 ARTICLE IV CONSULTATION—DEBT SUSTAINABILITY ANALYSIS Ethiopia’s risk of external debt distress remains moderate, although external vulnerabilities have increased. Exports underperformed relative to projections, owing to a weak external environment; and the supply shock from the drought required scaled-up food imports. Despite strong remittances and curtailed public sector imports of investment goods, the current account deficit remains high. Reflecting higher indebtedness and low exports, indicators based on debt-to-exports ratios have deteriorated and (as in the 2015 DSA) breach one standard threshold in the baseline. Key considerations in maintaining the moderate rating are: (i) the envisaged investment-based expansion in re-payment capacity financed by the external borrowing; and (ii) special factors that mitigate the risk of debt/currency distress episodes including capital controls, the large share of debt with official creditors with a significant concessional component, virtual absence of tradeable debt instruments, and limited integration in global markets. The main risks are a potential continuation of export underperformance and failure to rein in project-related imports and refrain from associated new non-concessional borrowing. Should these risks materialize, debt sustainability prospects would deteriorate materially. The projected baseline path of total public sector debt-to-GDP (external plus domestic debt) does not result in additional risks beyond those discussed for the external debt above. Approved by Michael Atingi-Ego (AFR), Bob M. Traa (SPR) and John Panzer (IDA) Prepared by the staffs of the International Monetary Fund (IMF) and the International Development Association (IDA) August 30, 2016
Transcript of STAFF REPORT FOR THE 2016 ARTICLE IV ... external current account deficit (before official...
THE FEDERAL DEMOCRATIC REPUBLIC OF ETHIOPIA STAFF REPORT FOR THE 2016 ARTICLE IV CONSULTATION—DEBT SUSTAINABILITY ANALYSIS
Ethiopia’s risk of external debt distress remains moderate, although external vulnerabilities have increased. Exports underperformed relative to projections, owing to a weak external environment; and the supply shock from the drought required scaled-up food imports. Despite strong remittances and curtailed public sector imports of investment goods, the current account deficit remains high. Reflecting higher indebtedness and low exports, indicators based on debt-to-exports ratios have deteriorated and (as in the 2015 DSA) breach one standard threshold in the baseline. Key considerations in maintaining the moderate rating are: (i) the envisaged investment-based expansion in re-payment capacity financed by the external borrowing; and (ii) special factors that mitigate the risk of debt/currency distress episodes including capital controls, the large share of debt with official creditors with a significant concessional component, virtual absence of tradeable debt instruments, and limited integration in global markets. The main risks are a potential continuation of export underperformance and failure to rein in project-related imports and refrain from associated new non-concessional borrowing. Should these risks materialize, debt sustainability prospects would deteriorate materially. The projected baseline path of total public sector debt-to-GDP (external plus domestic debt) does not result in additional risks beyond those discussed for the external debt above.
Approved by Michael Atingi-Ego (AFR), Bob M. Traa (SPR) and John Panzer (IDA)
Prepared by the staffs of the International Monetary Fund (IMF) and the International Development Association (IDA)
August 30, 2016
THE FEDERAL DEMOCRATIC REPUBLIC OF ETHIOPIA
2 INTERNATIONAL MONETARY FUND
BACKGROUND AND RECENT DEVELOPMENTS 1. Ethiopia's large-scale public investments in infrastructure over recent years have beenlargely financed by borrowing, raising public debt. Ethiopia reached the completion point under the Heavily Indebted Poor Countries (HIPC) Initiative in 2004 and benefited from debt relief under the Multilateral Debt Relief Initiative (MDRI) in 2006.1 Public and publicly guaranteed (PPG) external debt2 fell in the years that followed, reaching a low of 18 percent of GDP in mid-2012. By end-2015/163 it is estimated at 30.2 percent of GDP and total (including domestic) public debt is estimated at 54.2 percent of GDP. 2. The Debt Sustainability Analysis (DSA) prepared in 2015 raised Ethiopia's risk ofexternal debt distress from "low" to "moderate". In the baseline scenario, only the present value of debt-to-exports (PVDE) temporarily breached the 150 percent threshold.4 Ethiopia was considered a special case of “moderate” risk, for which the use of judgment was warranted. The growth-enhancing nature of the borrowing plans, was deemed crucial in making sustainable the relatively low debt-to-GDP ratio of Ethiopia. The probability approach and the inclusion of remittances confirmed these findings.
3. In 2015/16, growth slowed down and the current account deficit remained high. Growthin 2015/16 is estimated at 6.5 percent, a slowdown relative to previous years, owing to a major drought and a sharply weaker external environment. Export revenue stagnated as pronounced falls in merchandise export prices (by 11 percent) were only partially offset by an expansion in volumes, despite significant redirection of exports towards alternative destination markets and development of new export lines. Savings from lower fuel import prices were more than compensated by large drought-related food imports and other imports. On the other hand, remittances surged to US$6¼ billion (9 percent of GDP), exceeding exports of goods and services. Overall, the current account deficit is estimated to have experienced a small improvement in relation to GDP—from
1 While Ethiopia has received debt relief from most of its creditors, it has not been able to reach agreement with a few bilateral creditors (Bulgaria, Libya, and FR Yugoslavia) and commercial creditors from Italy, the former Czechoslovakia, India, and FR Yugoslavia. These outstanding loans (US$382.9 million) accounted for 2 percent of the debt stock in 2014/15. HIPC terms are assumed for these loans. While negotiations with Russia on outstanding loans (US$161.6 million) have not been completed, the debt service on these loans is assumed to be given HIPC comparable treatment. 2 PPG debt includes the foreign debt of the National Bank of Ethiopia (NBE), the debt of the federal government, regional governments, major state-owned enterprises except Ethiopian Airlines (EAL). EAL meets the criteria for exclusion set out in the 2013 Staff Guidance Note on the Debt Sustainability Framework (DSF) for low-income countries (LICS) (Annex 3) because it is run on commercial terms, has a sizeable profit margin (as reflected in audited accounts published annually), enjoys managerial independence, and borrows without government guarantee. 3 The DSA is based on the Ethiopian fiscal year, which runs from July–June. 4 Based on its 2015 Country Policy and Institutional Assessment (CPIA) score (3.4), Ethiopia is classified as a medium performer. The thresholds for the debt burden for medium performers are 150, 40, and 250 percent for the PV of debt to exports, GDP, and revenue, respectively; a 10 percent band is applied to the thresholds to determine if the country is a borderline case; and debt service thresholds are 20 and 30 percent of exports and revenue, respectively. In the scenarios that include workers’ remittances, the corresponding threshold for the PV of debt to exports and remittances is 120 percent, and is 16 percent for debt service to exports and remittances; the PV of debt to GDP and remittances is 36 percent.

THE FEDERAL DEMOCRATIC REPUBLIC OF ETHIOPIA
INTERNATIONAL MONETARY FUND 3
12 percent in 2014/15 to 10.7 percent in 2015/16—while remaining, essentially, unchanged in U.S. dollars.
4. External financing was provided mainly by foreign direct investments (FDI),project-related lending, and the central bank. FDI inflows continued strong gains, reaching over US$3 billion (4.6 percent of GDP). In addition to previously envisaged project financing disbursements, the NBE received from an official bilateral creditor a US$1 billion deposit, which had not been anticipated in the 2015 DSA.5 Its proceeds were used to finance drought relief and other imports and to reinforce foreign exchange reserves.
5. Ethiopia’s non-concessional commitment ceiling under IDA’s non-concessionalborrowing policy, set at US$0.75 billion for 2015/16, was substantively met. In June 2016, IDA reviewed Ethiopia's non-concessional borrowing performance for 2015/16. The review concluded that the limit of US$0.75 billion, which was defined in the previous year, had been substantively met with new Non-concessional borrowing (NCB) contracting amounting to US$0.775 billion in 2015/16.
OUTLOOK AND KEY ASSUMPTIONS 6. Macroeconomic assumptions reflect the 2015/16 adverse supply shock and the lowerstarting base in exports (Box 1). After the 2015/16 slowdown, real GDP growth is projected to recover to 7.5 percent by 2016/17 and the medium term, converging subsequently towards 6 percent in the longer term. Compared to the 2015 DSA, the time profile of the level of exports has shifted downwards, reflecting the lower 2015/16 estimate. The medium-term outlook for export performance will face downside risks if structural reforms lag and competitiveness gains disappoint.
7. During the 2016 Article IV Consultation discussions, the authorities expressed theircommitment to refrain from new NCB for the time being inasmuch as this borrowing might deteriorate debt sustainability—the DSA borrowing assumptions reflect this policy. The DSA includes NCB disbursements of about US$1.5 billion in 2016/17 from existing commitments, but no additional NCB commitments. WB staff is seeking to set a NCB ceiling consistent with these projections—unless exports were to perform better than currently envisaged. Also, IDA decided to continue to provide assistance to Ethiopia on credit terms only in 2016/17, a measure implemented in 2013/14 as a response to Ethiopia's breaches of the NCB ceiling at that time. The continuation of this measure is meant to maintain an incentive to restrain non-concessional borrowing commitments during 2016/17.
5 The US$1 billion deposit has an annual interest rate of 3 percent, a two-year grace period and long-term maturity (equal annual installments after the grace period). This central bank liability has been included in the stock of public sector debt considered in this DSA, as required by current guidelines (“Staff Guidance Note on the Application of the Joint Bank-Fund DSF for LICs,” SM/13/292, section K). It does not fall, however, under the IDA NCB ceiling since IDA considers that as a central bank-to-central bank transaction it does not carry the risk of IDA cross-subsidizing NCB from other donors, a main rationale behind the NCB ceiling.

THE FEDERAL DEMOCRATIC REPUBLIC OF ETHIOPIA
4 INTERNATIONAL MONETARY FUND
8. Projections on new indebtedness are also based on the following assumptions:
Non-concessional loan (NCL) disbursements will average about US$1.1 billion per year in the next five years, and around US$830 million per year over the entire projection period (FY2016/17−FY2035/36).
The maturity on all new external loans will average 29 years, and 13–16 years for new non-concessional loans.
The interest rate on all new external loans will average 1.9 percent, and 3–5 percent on new non-concessional loans.
EXTERNAL DEBT SUSTAINABILITY ANALYSIS A. Baseline scenario
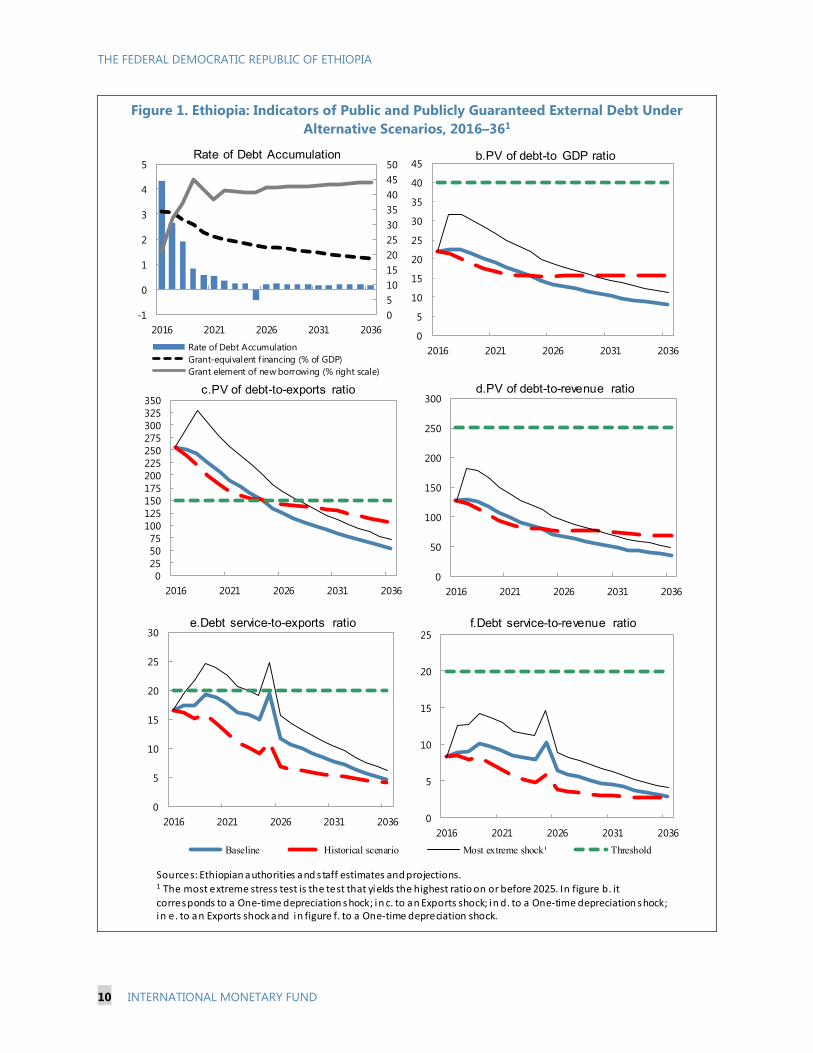
9. The 2016 DSA projects external debt to peak as a share of GDP in 2016/17 (Figure 1). The present value (PV) of PPG external debt increases to 21.9 percent of GDP in 2015/16, and will marginally increase in 2016/17, to start declining gradually to single digits in the long-run. These ratios are within the thresholds.
Box 1. Ethiopia: Macroeconomic Assumptions for the Baseline Scenario
Real GDP growth is projected at 6.5 percent in 2015/16, 7.5 percent in 2016/17, and at 6 percent over the longer term. CPI Inflation is projected at 8 percent in the long run. The government primary deficit is projected to remain at about 2¼ percent of GDP, with gradual progress in tax collection offsetting increased investment and social spending.
The external current account deficit (before official transfers) is estimated at 12.7 percent of GDP in 2015/16. Improved export performance, a slowdown in capital goods imports, and steady remittances (although slowly declining as a ratio to GDP) will lead to a gradual improvement of the deficit over the longer term. Economic transformation is expected to ameliorate external imbalances, with more dynamic and diversified exports and a phase down in the imports of capital goods.
Exports of goods and services are expected to decline by 1.7 percent in 2015/16, with gains in export volumes not enough to compensate lower commodity prices. In future years, a recovery in traditional exports and development of new exports could raise average growth to 13.2 percent over the next three years, and sustain growth in the long run. Investments in hydro-power, industrial parks, export processing zones, and public policies targeting emerging manufactures, food processing, and FDI technology transfers are expected to support export growth and diversification. Imports of goods and services are estimated to have increased by 5.7 percent in 2015/16, and are projected to increase by 5.1 percent in 2016/17 from a high level, due in part to emergency food imports. A slowdown is expected in the longer term but demand for imported capital goods will remain strong during the remaining four years of the GTP II implementation period. In the long run, imports are expected to grow in line with domestic output.
Remittances have recently performed strongly, at an estimated 9 percent of GDP in 2015/16, up 28 percent in dollar terms from the previous year. Projections assume remittances will represent about 3.8 percent of GDP by 2035/36.
FDI is projected to increase from 4.6 percent of GDP in 2015/16 to 6 percent in the medium term, reflecting improved competitiveness and policies to attract foreign investment.
The exchange rate is expected to remain determined by the NBE’s crawl-like arrangement, with the real effective exchange rate remaining constant over time.
THE FEDERAL DEMOCRATIC REPUBLIC OF ETHIOPIA
INTERNATIONAL MONETARY FUND 5
10. Under the baseline scenario, the ratio of the PVDE breaches the indicative threshold(Table 3 and Figure 1). The PVDE ratio is estimated at 255.7 percent in 2015/16. The ratio is projected to remain above the threshold until 2023/24, when export growth and the declining borrowing ratio bring the indicator to the 150 percent threshold. No other indicator breaches its threshold under the baseline scenario, as in the 2015 DSA (Table 1).
B. Alternative scenarios
11. Under the alternative scenarios with extreme shocks the ratios based on exports(PV debt-to exports, and debt service-to-exports) exceed the thresholds under an export shock. In the presence of this shock, the breach of the indicative threshold for the PV debt-to-exports ratio would last three more years than in the baseline. Under the same shock to exports, the debt service-to-exports ratio would breach the threshold in two different periods: in the short term, as exports are still low and Ethiopia has to repay the term-deposit taken by the NBE, and in 2025, when the outstanding US$1 billion Eurobond matures.
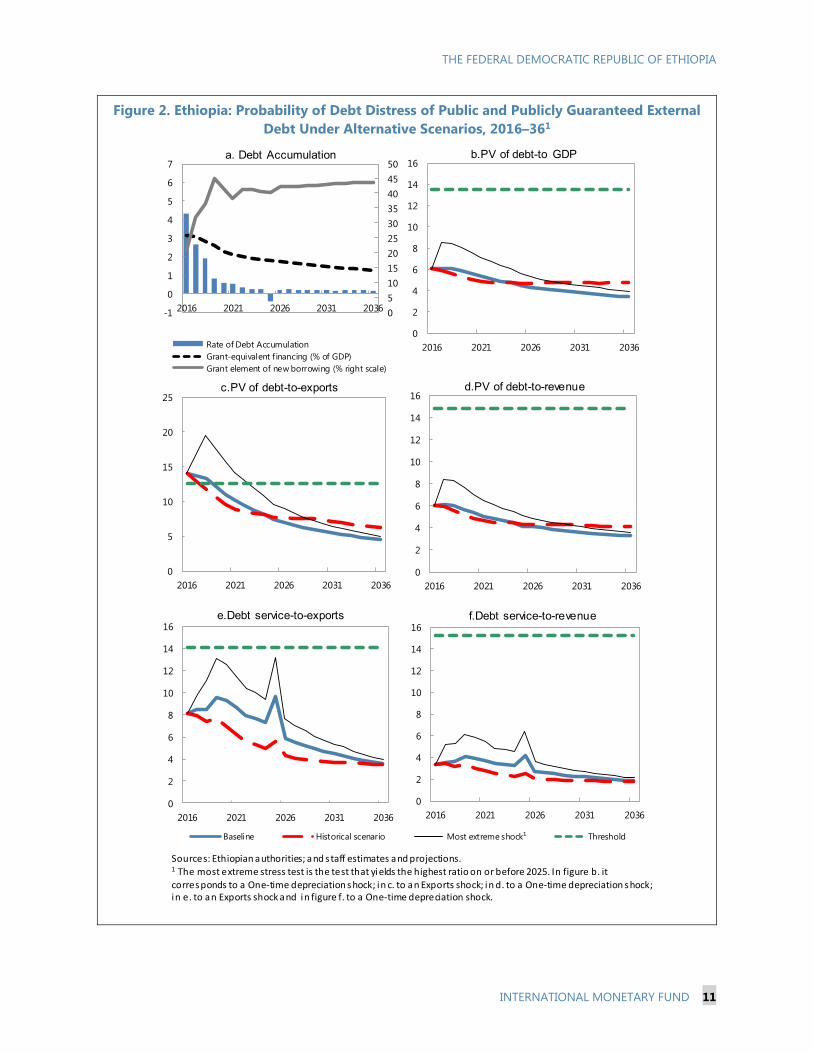
12. Results from the probability approach indicate a similar, although milder, risk than thestandard approach.6 As in the standard approach, the PV debt-to-exports ratio indicator breaches the threshold in the baseline and in the extreme shock alternative scenario—although for a shorter period (three years). The debt service-to-exports indicator does not breach the threshold under the baseline or the most extreme shock scenarios—unlike under the standard approach, where it is breached under the most extreme shock scenario (Figure 2).
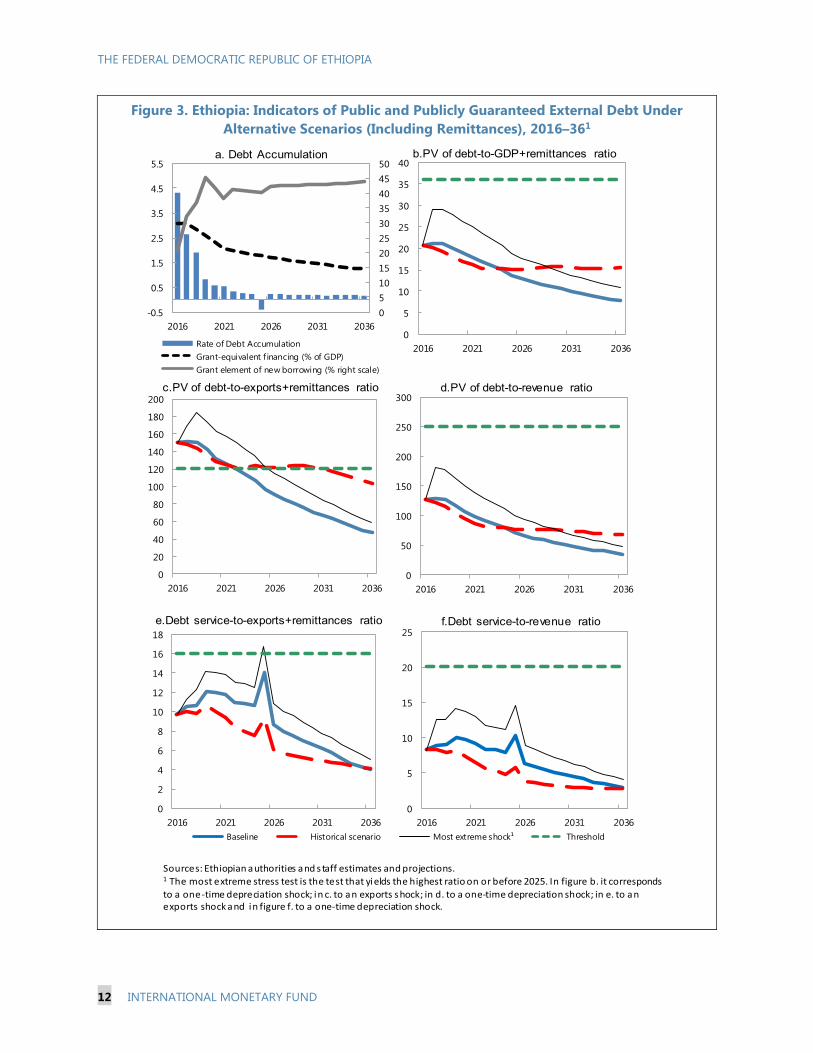
13. The inclusion of remittances also reduces somewhat the severity of threshold breaches.7 InEthiopia, rising remittances already play an important role in bolstering external stability. In 2015/16 they are estimated at 9 percent of GDP, representing 105 percent of exports (goods and services). When remittances are included in the DSA, the breach of the augmented indicator (namely the ratio of the PV of debt to exports of goods and services plus remittances) breaches the threshold for 6 years in the baseline and for 10 years in the extreme shock scenario (Figure 3). The debt service-to-exports (plus remittances) ratio reaches the threshold in 2025, following a terms-of-trade shock (the most extreme one), again prompted by the Eurobond redemption.
6 The probability approach is being reported for additional background information. It is not required from a strictly technical standpoint. The breach of threshold for PV debt-to-exports ratio exceeds the margins established by the guidelines for a borderline case (±5 percent of threshold). 7 The effect of the inclusion of remittances is reported for additional background information. Its reporting is not required from a strictly technical standpoint since the average remittances of the last three years do not exceed 10 percent of GDP as indicated in the guidelines (although in 2015/16, at 9 percent of GDP, they come very close to the threshold). Remittances exceed the threshold indicated in the guidelines of 20 percent of exports.

THE FEDERAL DEMOCRATIC REPUBLIC OF ETHIOPIA
6 INTERNATIONAL MONETARY FUND
C. Assessment
14. The external debt sustainability tests confirm that exports are key to ensure external sustainability. The dollar value of exports (goods and services) has almost tripled in the last decade. But despite this rapid growth, export revenue remains low relative to the indebtedness necessary to finance the level of imports required by the authorities’ far-reaching investment plans. Correspondingly, expanding presence in existing export markets and rapid diversification into new products and markets constitutes the linchpin in the authorities’ development strategy.
15. Several factors mitigate external debt sustainability risks, and argue for retaining the current “moderate” rating. The DSA methodology calls for the use of judgment in interpreting the
Table 1. Ethiopia: Comparison of PPG External Debt Baseline Scenario, 2016–36
(Percent, unless otherwise indicated)
PV of Debt to Exports Ratio2016DSA 150.0 255.6 250.9 243.9 226.0 207.5 190.4 123.7 51.62015DSA 150.0 212.3 220.4 213.9 192.0 174.5 158.2 88.1 …
PV of Debt to GDP Ratio2016DSA 40.0 21.9 22.4 22.3 21.3 20.1 19.0 13.4 7.62015DSA 40.0 21.7 23.8 24.5 23.2 21.8 20.6 13.4 …
PV of Debt to Revenue Ratio2016DSA 250.0 127.0 129.3 126.7 117.6 107.2 99.2 67.0 32.92015DSA 250.0 134.8 144.4 146.0 136.9 128.1 123.7 81.4 …
Debt Service to Exports Ratio2016DSA 20.0 16.6 17.3 17.3 19.3 18.8 17.7 11.7 4.62015DSA 20.0 13.0 13.4 13.0 12.6 12.8 12.1 11.9 …
Memorandum items:Grant Element of New External Borrowing
2016DSA 20.7 31.9 36.9 45.0 41.6 38.1 42.3 52.72015DSA 18.4 19.1 28.0 40.1 40.0 39.5 38.6 …
New Commercial Loan Disbursements (billions of U.S. dollars)2016DSA 4.825 2.612 1.745 1.303 0.828 0.772 0.856 0.2002015DSA 3.104 2.916 1.502 0.589 0.654 0.716 0.720 …
Real GDP Growth (annual percent change)2016DSA 6.5 7.5 7.5 7.5 7.4 7.3 6.3 6.02015DSA 8.1 7.6 7.5 7.5 7.5 7.3 6.5 …
Current Account Balance to GDP Ratio2016DSA -12.0 -10.7 -9.3 -8.9 -8.2 -8.1 -6.0 -3.72015DSA -9.9 -9.1 -8.1 -7.3 -6.6 -5.8 -4.0 …
Sources: Ethiopian authorities; IMF and World Bank staff estimates and projections.
Fiscal year ending July 7
2036Threshold 2016 2017 2018 2019 2020 2021 2026
THE FEDERAL DEMOCRATIC REPUBLIC OF ETHIOPIA
INTERNATIONAL MONETARY FUND 7
mechanical test results. The following considerations mitigate the breach of the export-related thresholds:
The high level of debt relative to exports is directly associated to sizable initial investmentsaimed at boosting export competitiveness and domestic supply, which are expected togenerate high returns. The main sectors benefiting from the debt-financed investment includeenergy supply, merchandise transportation, and other priority infrastructure with largeexpected impact on output. These investments have large up-front costs, but produce sizableand lasting improvements in export competitiveness and hence in Ethiopia’s capacity to repayits debt. In the short term (when the PV of debt-to-exports ratio indicator breaches thethreshold because of the lagged export response) projected debt service is deemedmanageable.
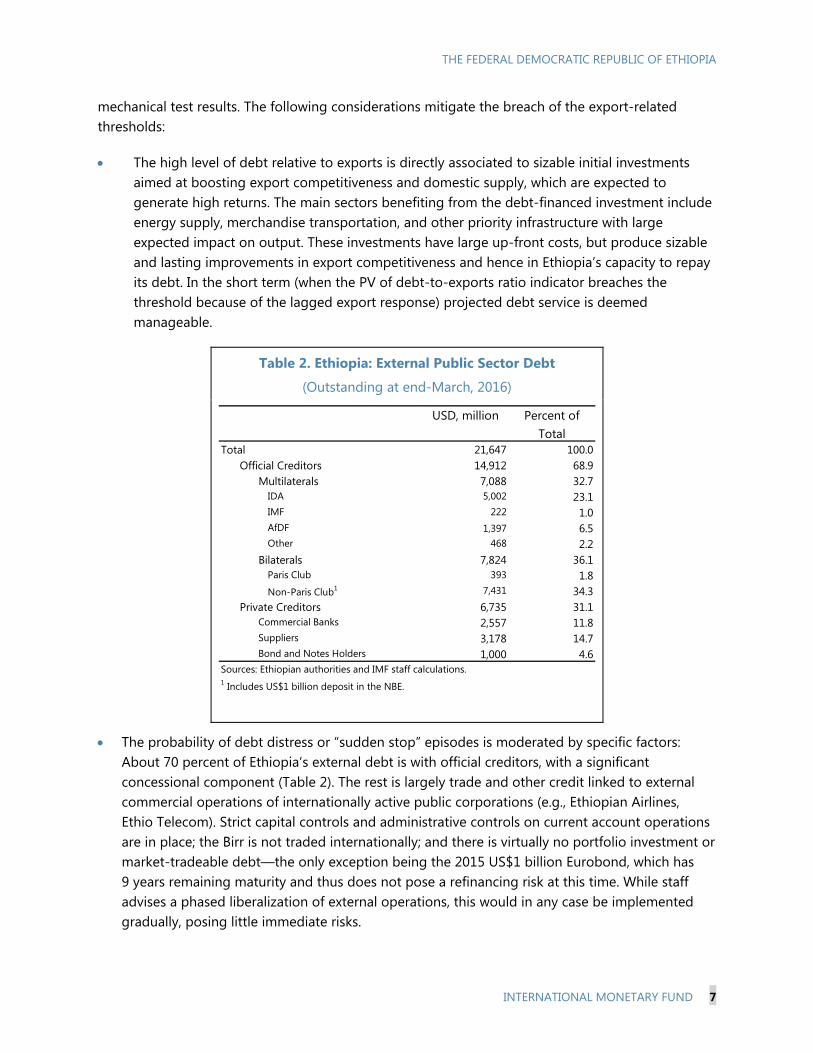
Table 2. Ethiopia: External Public Sector Debt
(Outstanding at end-March, 2016)
The probability of debt distress or “sudden stop” episodes is moderated by specific factors:About 70 percent of Ethiopia’s external debt is with official creditors, with a significantconcessional component (Table 2). The rest is largely trade and other credit linked to externalcommercial operations of internationally active public corporations (e.g., Ethiopian Airlines,Ethio Telecom). Strict capital controls and administrative controls on current account operationsare in place; the Birr is not traded internationally; and there is virtually no portfolio investment ormarket-tradeable debt—the only exception being the 2015 US$1 billion Eurobond, which has9 years remaining maturity and thus does not pose a refinancing risk at this time. While staffadvises a phased liberalization of external operations, this would in any case be implementedgradually, posing little immediate risks.
USD, million Percent of Total
Total 21,647 100.0Official Creditors 14,912 68.9
Multilaterals 7,088 32.7IDA 5,002 23.1IMF 222 1.0AfDF 1,397 6.5Other 468 2.2
Bilaterals 7,824 36.1Paris Club 393 1.8Non-Paris Club1 7,431 34.3
Private Creditors 6,735 31.1Commercial Banks 2,557 11.8Suppliers 3,178 14.7Bond and Notes Holders 1,000 4.6
Sources: Ethiopian authorities and IMF staff calculations.1 Includes US$1 billion deposit in the NBE.
THE FEDERAL DEMOCRATIC REPUBLIC OF ETHIOPIA
8 INTERNATIONAL MONETARY FUND
16. The outlook, however, presents potentially severe risks if exports disappoint relative to projections, and if non-concessional borrowing were to exceed DSA assumptions—which would materially worsen debt sustainability prospects. While the test breached in this DSA was already breached in the 2015 DSA, the extent of the breached has increased. This is mainly the result of a weakening of the external environment (which is expected to stabilize in 2016/17) and of high imports largely due to drought-related external food purchases. This kept the current account deficit wide and raised debt. The assessment above is posited on significant export growth as identified projects with high export potential come on line (electrical railway link to Djibouti, electricity generation capacity, and Hawassa and other industrial parks, among other); prioritization of investment projects with high import content; and strict adherence to the authorities’ borrowing plans described above. Should these projections fail to materialize, debt sustainability prospects and DSA indicators could significantly worsen.
17. The authorities argued for the maintenance of a moderate rating and expressed their intention to refrain from any additional borrowing that could deteriorate debt sustainability. From their standpoint, Ethiopia’s debt sustainability was firmly supported by the use of the borrowed funds exclusively for investment projects with expected high growth returns—rather than for current spending—and by their careful monitoring of public sector indebtedness, among other things to forestall any other uses. The authorities stated their commitment to refrain from pursuing any additional loans that could deteriorate the sustainability of external debt, including some new commercial (non-concessional) loans that had previously been under consideration. Also, the authorities argued that the US$1 billion deposit in the NBE should not be considered debt for the purposes of the DSA—as it was unrelated to fiscal operations—and that the debt of Ethio Telecom should likewise be excluded from the DSA. Staff explained that under current joint IMF/WB guidelines, central bank external liabilities must be included in the DSA public debt,8 as they represent a claim on the country’s external resources not substantially different from government debt for DSA purposes. Regarding the debt of Ethio Telecom, staff stands ready to consider its exclusion if conditions stated in the DSA guidelines are met. However, an essential component for this consideration would be the availability of current financial accounts (only accounts through 2012 are available at this time), audited by commercial financial auditors—since the state audit’s focus is mainly on compliance with the law and not on the company’s underlying financial situation. The availability of such current audited financial accounts would also be a necessary condition for Ethio Telecom to be able to borrow commercially on the strength of its own balance sheet and profitability, and not on explicit or implicit government guarantees.
D. Public Debt Sustainability Analysis
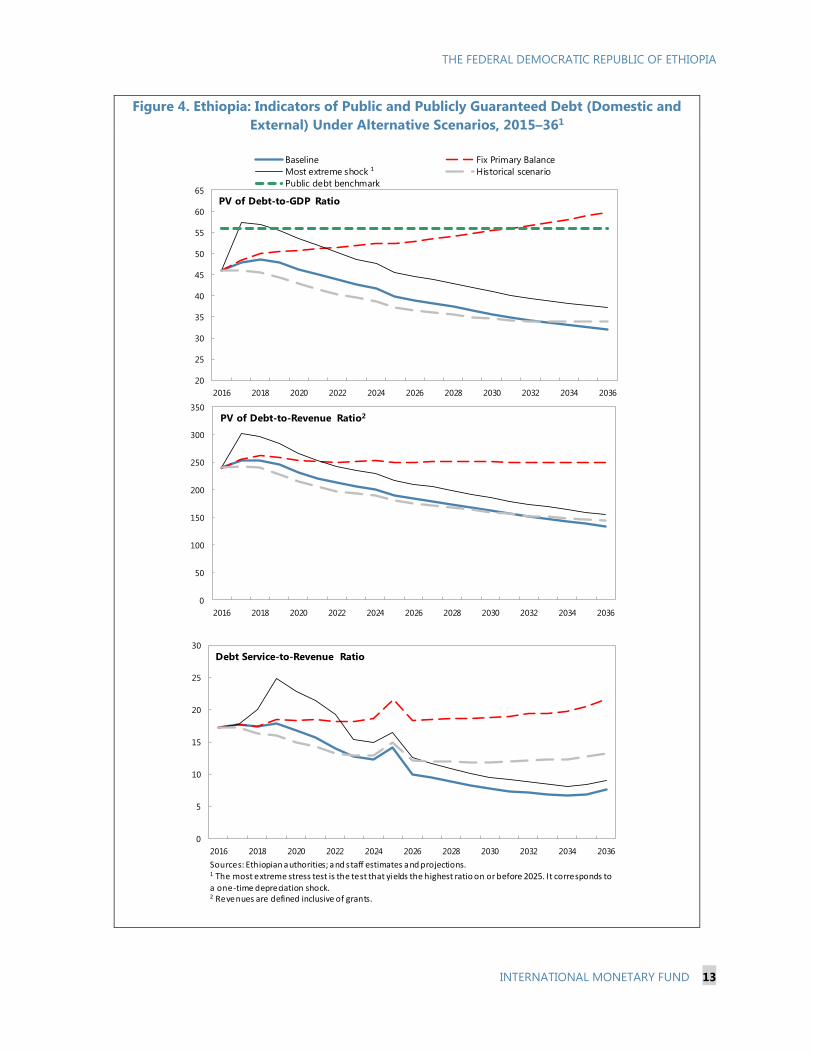
18. In the baseline, the projected path of total public sector debt-to-GDP does not result in additional risks beyond those discussed in the external debt sustainability section (Table 5, Figure 4). As in the 2015 DSA, total public debt remains within the standard thresholds, while declining gradually in the medium and long term. This is the result of output growth and the eventual tapering of large public investment projects after the five-year GTP II. In addition to
8 “Staff Guidance Note on the Application of the Joint Bank-Fund Debt Sustainability Framework for Low-Income Countries,” SM/13/292, section K.
THE FEDERAL DEMOCRATIC REPUBLIC OF ETHIOPIA
INTERNATIONAL MONETARY FUND 9
external debt, discussed above, domestic public debt reached 24 percent of GDP in 2015/16 (from 22.4 percent in 2014/15). About 45 percent of it corresponds to the central government, mostly to the NBE reflecting direct advances to finance the budget (60.5 percent of central government debt), and treasury bills (33.6 percent). State-own enterprises (SOEs) hold 55 percent of total domestic debt which is all issued in the form of bonds and loans provided by the state-owned Commercial Bank of Ethiopia. Financial soundness and stability indicators do not point to domestic debt servicing difficulties by SOEs.
19. The PV of debt-to-GDP ratio remains below the threshold in the baseline. However, as inthe 2015 DSA, there is a three-year threshold breach under the extreme shock (a one-time depreciation) scenario. This is due to the relatively high initial external debt, as discussed above. Nevertheless, the assumed shock of a large sudden depreciation (a “currency crisis”) is unlikely, as discussed above. Also, the historical scenario shows that an indefinite continuation of the past and present public investment drive—which is not currently envisaged by staff or the authorities—would be unsustainable.
20. Over the medium and long term, however, gradual reversal of the favorable interestrate-growth differential would require public sector measures to accommodate higher financial costs. As in most developing countries, the interest rate-growth differential in Ethiopia is negative, reflecting high growth but also distorted interest rates (particularly on domestic liabilities and external concessional borrowing). In Ethiopia, tightly controlled financial markets contribute to these distortions. Financial development and increasing private sector participation will likely result in an upward drift in real interest rates over time. While this process would enhance growth and opportunities to mobilize additional resources, it would also require deliberate public finance policies to create the necessary space for higher financial costs to the budget and broader public sector.
E. Conclusion
21. Despite some deterioration in external debt sustainability indicators, Ethiopia’s risk ofexternal debt distress remains "moderate." The current pace in acquisition of external liabilities and export levels, if maintained over time, would result in an unsustainable external position. This risk, however, is mitigated by its temporary nature and by the envisaged expansion in productive and exporting capacity as a result of ongoing infrastructure investment with high expected returns—partly financed by the increased indebtedness. The structure of external debt (mainly official credit, often concessional), existing administrative controls on imports and capital controls additionally reduce the risk of severe external stress episodes. The main risks are a potential continuation of export underperformance and failure to rein in project-related imports and refrain from associated new non-concessional borrowing. Should these risks materialize, debt sustainability prospects would deteriorate materially. In the event of tighter external financing conditions, the authorities would need to resort to further import compression—which although less disruptive than an episode of external debt distress, could entail severe negative growth effects.
THE FEDERAL DEMOCRATIC REPUBLIC OF ETHIOPIA
10 INTERNATIONAL MONETARY FUND
Figure 1. Ethiopia: Indicators of Public and Publicly Guaranteed External Debt Under Alternative Scenarios, 2016–361
0
5
10
15
20
25
2016 2021 2026 2031 2036
Baseline Historical scenario Most extreme shock¹ Threshold
f.Debt service-to-revenue ratio
05101520253035404550
-1
0
1
2
3
4
5
2016 2021 2026 2031 2036
Rate of Debt AccumulationGrant-equivalent f inancing (% of GDP)Grant element of new borrowing (% right scale)
Rate of Debt Accumulation
0255075
100125150175200225250275300325350
2016 2021 2026 2031 2036
c.PV of debt-to-exports ratio
0
5
10
15
20
25
30
35
40
45
2016 2021 2026 2031 2036
b.PV of debt-to GDP ratio
0
50
100
150
200
250
300
2016 2021 2026 2031 2036
d.PV of debt-to-revenue ratio
0
5
10
15
20
25
30
2016 2021 2026 2031 2036
e.Debt service-to-exports ratio
Sources: Ethiopian authorities and s taff estimates and projections.1 The most extreme stress test is the test that yields the highest ratio on or before 2025. In figure b. it corresponds to a One-time depreciation shock; in c. to an Exports shock; in d. to a One-time depreciation shock; in e. to an Exports shock and in figure f. to a One-time depreciation shock.
THE FEDERAL DEMOCRATIC REPUBLIC OF ETHIOPIA
INTERNATIONAL MONETARY FUND 11
Figure 2. Ethiopia: Probability of Debt Distress of Public and Publicly Guaranteed External Debt Under Alternative Scenarios, 2016–361
0
2
4
6
8
10
12
14
16
2016 2021 2026 2031 2036
Baseline Historical scenario Most extreme shock¹ Threshold
f.Debt service-to-revenue
05101520253035404550
-1
0
1
2
3
4
5
6
7
2016 2021 2026 2031 2036
Rate of Debt AccumulationGrant-equivalent f inancing (% of GDP)Grant element of new borrowing (% right scale)
a. Debt Accumulation
0
2
4
6
8
10
12
14
16
2016 2021 2026 2031 2036
b.PV of debt-to GDP
0
5
10
15
20
25
2016 2021 2026 2031 2036
c.PV of debt-to-exports
0
2
4
6
8
10
12
14
16
2016 2021 2026 2031 2036
d.PV of debt-to-revenue
0
2
4
6
8
10
12
14
16
2016 2021 2026 2031 2036
e.Debt service-to-exports
Sources: Ethiopian authorities; and s taff estimates and projections.1 The most extreme stress test is the test that yields the highest ratio on or before 2025. In figure b. it
corresponds to a One-time depreciation shock; in c. to an Exports shock; in d. to a One-time depreciation shock; in e. to an Exports shock and in figure f. to a One-time depreciation shock.
THE FEDERAL DEMOCRATIC REPUBLIC OF ETHIOPIA
12 INTERNATIONAL MONETARY FUND
Figure 3. Ethiopia: Indicators of Public and Publicly Guaranteed External Debt Under Alternative Scenarios (Including Remittances), 2016–361
0
5
10
15
20
25
2016 2021 2026 2031 2036Baseline Historical scenario Most extreme shock¹ Threshold
f.Debt service-to-revenue ratio
05101520253035404550
-0.5
0.5
1.5
2.5
3.5
4.5
5.5
2016 2021 2026 2031 2036
Rate of Debt AccumulationGrant-equivalent f inancing (% of GDP)Grant element of new borrowing (% right scale)
a. Debt Accumulation
0
5
10
15
20
25
30
35
40
2016 2021 2026 2031 2036
b.PV of debt-to-GDP+remittances ratio
0
20
40
60
80
100
120
140
160
180
200
2016 2021 2026 2031 2036
c.PV of debt-to-exports+remittances ratio
0
50
100
150
200
250
300
2016 2021 2026 2031 2036
d.PV of debt-to-revenue ratio
0
2
4
6
8
10
12
14
16
18
2016 2021 2026 2031 2036
e.Debt service-to-exports+remittances ratio
Sources: Ethiopian authorities and s taff estimates and projections.1 The most extreme stress test is the test that yields the highest ratio on or before 2025. In figure b. it corresponds
to a one-time depreciation shock; in c. to an exports shock; in d. to a one-time depreciation shock; in e. to anexports shock and in figure f. to a one-time depreciation shock.
THE FEDERAL DEMOCRATIC REPUBLIC OF ETHIOPIA
INTERNATIONAL MONETARY FUND 13
Figure 4. Ethiopia: Indicators of Public and Publicly Guaranteed Debt (Domestic and External) Under Alternative Scenarios, 2015–361
0
50
100
150
200
250
300
350
2016 2018 2020 2022 2024 2026 2028 2030 2032 2034 2036
PV of Debt-to-Revenue Ratio2
20
25
30
35
40
45
50
55
60
65
2016 2018 2020 2022 2024 2026 2028 2030 2032 2034 2036
Baseline Fix Primary BalanceMost extreme shock ¹ Historical scenarioPublic debt benchmark
PV of Debt-to-GDP Ratio
0
5
10
15
20
25
30
2016 2018 2020 2022 2024 2026 2028 2030 2032 2034 2036
Debt Service-to-Revenue Ratio
Sources: Ethiopian authorities; and staff estimates and projections.1 The most extreme stress test is the test that yields the highest ratio on or before 2025. It corresponds to a one-time depreciation shock.2 Revenues are defined inclusive of grants.

THE FEDERAL DEMOCRATIC REPUBLIC OF ETHIOPIA
14 INTERNATIONAL MONETARY FUND
Table 3. Ethiopia: External Debt Sustainability Framework, Baseline Scenario, 2013–361
Historical 6/ Standard 6/
Average Deviation 2016-2021 2022-20362013 2014 2015 2016 2017 2018 2019 2020 2021 Average 2026 2036 Average
External debt (nominal) 1/ 24.1 25.8 31.6 34.5 35.0 35.3 34.7 33.8 32.7 25.5 13.9of which: public and publicly guaranteed (PPG) 21.1 22.5 28.3 30.1 30.9 31.1 30.2 28.9 27.6 21.1 13.5
Change in external debt 3.0 1.7 5.9 2.8 0.5 0.3 -0.6 -0.9 -1.1 -1.3 -0.7Identified net debt-creating flows 1.3 1.9 5.9 4.3 1.2 0.7 0.0 -0.2 -0.5 -1.1 -0.8
Non-interest current account deficit 5.7 7.7 11.6 5.9 3.0 10.1 8.6 8.2 7.5 7.4 7.1 5.2 3.4 4.7Deficit in balance of goods and services 16.4 17.6 21.9 21.3 19.4 18.9 18.4 18.3 18.2 13.3 7.2
Exports 12.4 11.6 9.8 8.6 8.9 9.2 9.4 9.7 10.0 10.9 14.7Imports 28.8 29.2 31.7 29.9 28.3 28.0 27.8 28.0 28.2 24.2 21.9
Net current transfers (negative = inflow) -10.7 -9.9 -10.4 -12.8 2.0 -11.0 -10.7 -10.6 -10.8 -10.8 -11.0 -8.1 -4.7 -7.1of which: official -3.2 -2.6 -2.4 -1.9 -1.7 -1.4 -1.4 -1.3 -1.2 -1.1 -0.9
Other current account flows (negative = net inflow) 0.0 0.0 0.0 -0.2 0.0 -0.1 -0.1 -0.1 -0.1 0.0 0.9Net FDI (negative = inflow) -2.6 -2.6 -3.6 -2.9 0.5 -4.6 -5.8 -5.8 -5.8 -5.9 -6.0 -5.2 -3.7 -4.8Endogenous debt dynamics 2/ -1.7 -3.1 -2.1 -1.2 -1.6 -1.6 -1.7 -1.6 -1.6 -1.1 -0.5
Contribution from nominal interest rate 0.2 0.3 0.4 0.6 0.7 0.8 0.8 0.7 0.7 0.5 0.3Contribution from real GDP growth -1.9 -2.1 -2.4 -1.8 -2.3 -2.4 -2.4 -2.4 -2.3 -1.6 -0.8Contribution from price and exchange rate changes -0.1 -1.3 -0.2 … … … … … … … …
Residual (3-4) 3/ 1.7 -0.2 0.0 -1.5 -0.7 -0.4 -0.6 -0.7 -0.7 -0.1 0.1of which: exceptional financing 0.0 0.0 0.0 0.0 0.0 0.0 0.0 0.0 0.0 0.0 0.0
PV of external debt 4/ ... ... 23.6 26.3 26.5 26.5 25.8 25.0 24.0 17.9 8.4In percent of exports ... ... 240.2 306.5 297.0 289.0 274.1 257.9 240.9 164.2 57.0
PV of PPG external debt ... ... 20.2 21.9 22.4 22.3 21.3 20.1 19.0 13.4 8.1In percent of exports ... ... 206.1 255.6 250.9 243.9 226.0 207.5 190.4 123.7 54.8In percent of government revenues ... ... 129.1 127.0 129.3 126.7 117.6 107.2 99.2 67.0 35.0
Debt service-to-exports ratio (in percent) 8.1 10.5 16.1 22.8 23.5 23.5 25.5 24.9 23.6 14.5 5.4PPG debt service-to-exports ratio (in percent) 6.5 7.0 10.2 16.6 17.3 17.3 19.3 18.8 17.7 11.7 4.7PPG debt service-to-revenue ratio (in percent) 5.5 5.7 6.4 8.2 8.9 9.0 10.1 9.7 9.2 6.3 3.0Total gross financing need (Billions of U.S. dollars) 2.0 3.5 5.9 5.2 3.8 3.8 3.8 3.8 3.8 2.5 1.7Non-interest current account deficit that stabilizes debt ratio 2.7 6.0 5.7 7.3 8.1 7.9 8.1 8.2 8.3 6.5 4.0
Key macroeconomic assumptions
Real GDP growth (in percent) 9.9 10.3 10.2 10.6 0.9 6.5 7.5 7.5 7.5 7.4 7.3 7.3 6.3 6.0 6.3GDP deflator in US dollar terms (change in percent) 0.5 5.6 0.7 6.8 12.4 5.5 3.4 1.6 1.2 1.4 1.4 2.4 1.1 1.2 1.2Effective interest rate (percent) 5/ 1.3 1.4 1.8 1.1 0.3 2.2 2.4 2.4 2.3 2.3 2.2 2.3 1.8 2.2 1.9Growth of exports of G&S (US dollar terms, in percent) -0.5 8.4 -5.9 13.0 11.0 -1.7 15.5 12.0 12.0 12.0 12.0 10.3 10.1 12.0 10.3Growth of imports of G&S (US dollar terms, in percent) 0.7 17.7 20.9 16.7 12.1 5.7 5.1 8.3 8.0 9.5 9.5 7.7 5.4 6.0 5.7Grant element of new public sector borrowing (in percent) ... ... ... ... ... 20.7 31.9 36.9 45.0 41.6 38.1 35.7 42.3 43.9 42.4Government revenues (excluding grants, in percent of GDP) 14.8 14.3 15.7 17.3 17.3 17.6 18.1 18.8 19.1 20.1 23.1 20.9Aid flows (in Billions of US dollars) 7/ 2.8 2.6 2.7 2.6 2.9 3.0 2.9 2.9 2.8 3.3 4.8
of which: Grants 1.5 1.5 1.5 1.3 1.3 1.2 1.3 1.3 1.4 1.7 2.8of which: Concessional loans 1.2 1.2 1.2 1.3 1.6 1.8 1.6 1.6 1.4 1.6 1.9
Grant-equivalent financing (in percent of GDP) 8/ ... ... ... 3.1 3.1 2.8 2.6 2.3 2.1 1.7 1.2 1.6Grant-equivalent financing (in percent of external financing) 8/ ... ... ... 41.0 50.9 54.5 63.8 62.0 60.5 66.9 72.5 68.2
Memorandum items:Nominal GDP (Billions of US dollars) 47.7 55.5 61.6 69.2 76.9 84.0 91.4 99.5 108.3 158.8 319.9Nominal dollar GDP growth 10.5 16.5 11.0 12.3 11.1 9.2 8.8 9.0 8.8 9.9 7.5 7.3 7.5PV of PPG external debt (in Billions of US dollars) 12.2 14.8 16.7 18.1 18.8 19.4 19.9 20.7 24.9(PVt-PVt-1)/GDPt-1 (in percent) 4.3 2.7 1.9 0.8 0.6 0.5 1.8 0.2 0.2 0.2Gross workers' remittances (Billions of US dollars) 2.5 3.0 3.8 4.2 4.5 4.8 5.1 5.5 5.4 6.2 8.1PV of PPG external debt (in percent of GDP + remittances) ... ... 19.1 20.7 21.2 21.1 20.2 19.1 18.1 12.9 7.9PV of PPG external debt (in percent of exports + remittances) ... ... 126.6 149.8 151.7 150.1 141.5 132.1 126.6 90.8 46.8Debt service of PPG external debt (in percent of exports + remittances) ... ... 6.3 9.7 10.5 10.7 12.1 12.0 11.8 8.6 4.0
Sources: Ethiopian authorities; and IMF staff estimates and projections.
1/ Includes both public and private sector external debt.2/ Derived as [r - g - ρ(1+g)]/(1+g+ρ+gρ) times previous period debt ratio, with r = nominal interest rate; g = real GDP growth rate, and ρ = growth rate of GDP deflator in U.S. dollar terms. 3/ Includes exceptional financing (i.e., changes in arrears and debt relief); changes in gross foreign assets; and valuation adjustments. For projections also includes contribution from price and exchange rate changes.4/ Assumes that PV of private sector debt is equivalent to its face value.5/ Current-year interest payments divided by previous period debt stock. 6/ Historical averages and standard deviations are generally derived over the past 10 years, subject to data availability. 7/ Defined as grants, concessional loans, and debt relief.8/ Grant-equivalent financing includes grants provided directly to the government and through new borrowing (difference between the face value and the PV of new debt).
Actual Projections
THE FEDERAL DEMOCRATIC REPUBLIC OF ETHIOPIA
INTERNATIONAL MONETARY FUND 15
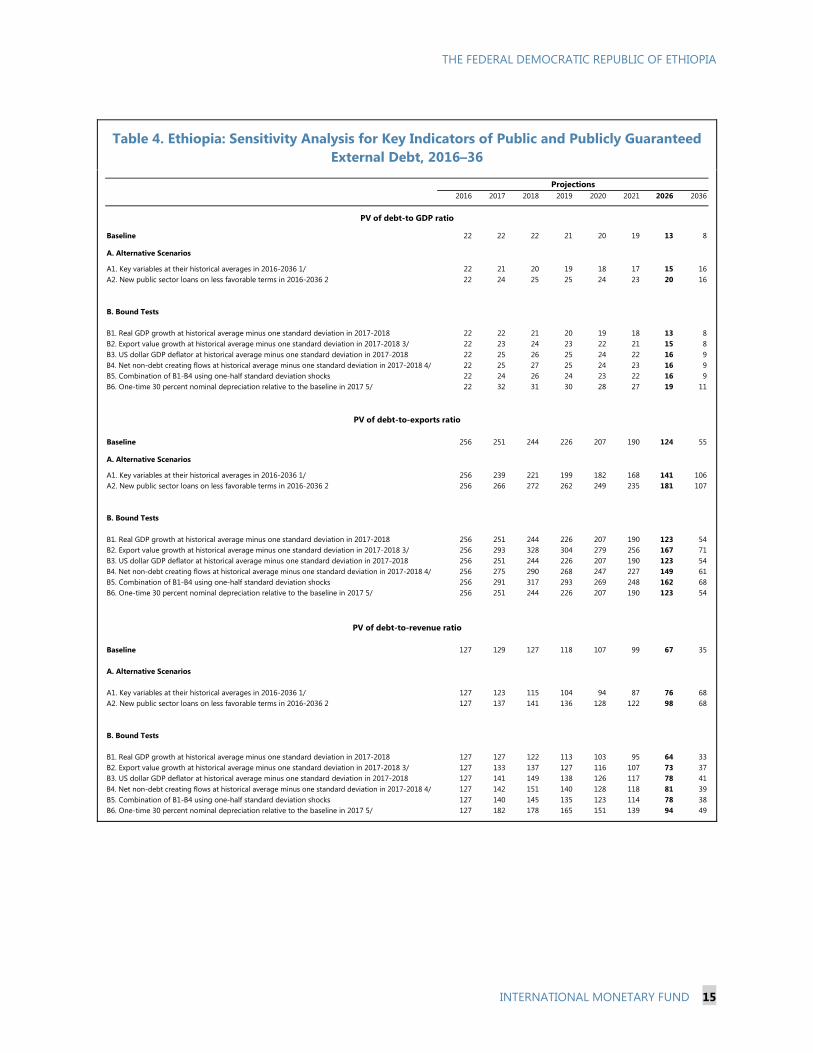
Table 4. Ethiopia: Sensitivity Analysis for Key Indicators of Public and Publicly Guaranteed External Debt, 2016–36
2016 2017 2018 2019 2020 2021 2026 2036
Baseline 22 22 22 21 20 19 13 8
A. Alternative Scenarios
A1. Key variables at their historical averages in 2016-2036 1/ 22 21 20 19 18 17 15 16A2. New public sector loans on less favorable terms in 2016-2036 2 22 24 25 25 24 23 20 16
B. Bound Tests
B1. Real GDP growth at historical average minus one standard deviation in 2017-2018 22 22 21 20 19 18 13 8B2. Export value growth at historical average minus one standard deviation in 2017-2018 3/ 22 23 24 23 22 21 15 8B3. US dollar GDP deflator at historical average minus one standard deviation in 2017-2018 22 25 26 25 24 22 16 9B4. Net non-debt creating flows at historical average minus one standard deviation in 2017-2018 4/ 22 25 27 25 24 23 16 9B5. Combination of B1-B4 using one-half standard deviation shocks 22 24 26 24 23 22 16 9B6. One-time 30 percent nominal depreciation relative to the baseline in 2017 5/ 22 32 31 30 28 27 19 11
Baseline 256 251 244 226 207 190 124 55
A. Alternative Scenarios
A1. Key variables at their historical averages in 2016-2036 1/ 256 239 221 199 182 168 141 106A2. New public sector loans on less favorable terms in 2016-2036 2 256 266 272 262 249 235 181 107
B. Bound Tests
B1. Real GDP growth at historical average minus one standard deviation in 2017-2018 256 251 244 226 207 190 123 54B2. Export value growth at historical average minus one standard deviation in 2017-2018 3/ 256 293 328 304 279 256 167 71B3. US dollar GDP deflator at historical average minus one standard deviation in 2017-2018 256 251 244 226 207 190 123 54B4. Net non-debt creating flows at historical average minus one standard deviation in 2017-2018 4/ 256 275 290 268 247 227 149 61B5. Combination of B1-B4 using one-half standard deviation shocks 256 291 317 293 269 248 162 68B6. One-time 30 percent nominal depreciation relative to the baseline in 2017 5/ 256 251 244 226 207 190 123 54
Baseline 127 129 127 118 107 99 67 35
A. Alternative Scenarios
A1. Key variables at their historical averages in 2016-2036 1/ 127 123 115 104 94 87 76 68A2. New public sector loans on less favorable terms in 2016-2036 2 127 137 141 136 128 122 98 68
B. Bound Tests
B1. Real GDP growth at historical average minus one standard deviation in 2017-2018 127 127 122 113 103 95 64 33B2. Export value growth at historical average minus one standard deviation in 2017-2018 3/ 127 133 137 127 116 107 73 37B3. US dollar GDP deflator at historical average minus one standard deviation in 2017-2018 127 141 149 138 126 117 78 41B4. Net non-debt creating flows at historical average minus one standard deviation in 2017-2018 4/ 127 142 151 140 128 118 81 39B5. Combination of B1-B4 using one-half standard deviation shocks 127 140 145 135 123 114 78 38B6. One-time 30 percent nominal depreciation relative to the baseline in 2017 5/ 127 182 178 165 151 139 94 49
PV of debt-to-exports ratio
PV of debt-to-revenue ratio
PV of debt-to GDP ratio
Projections
THE FEDERAL DEMOCRATIC REPUBLIC OF ETHIOPIA
16 INTERNATIONAL MONETARY FUND
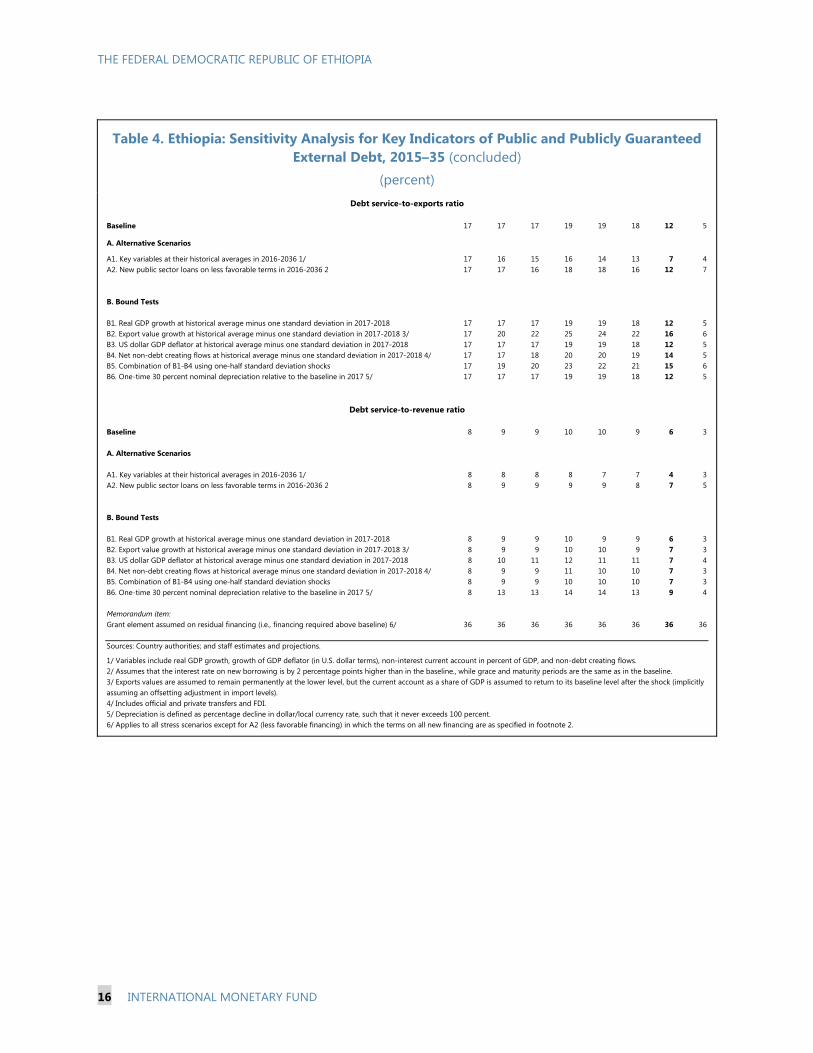
Table 4. Ethiopia: Sensitivity Analysis for Key Indicators of Public and Publicly Guaranteed External Debt, 2015–35 (concluded)
(percent)
Baseline 17 17 17 19 19 18 12 5
A. Alternative Scenarios
A1. Key variables at their historical averages in 2016-2036 1/ 17 16 15 16 14 13 7 4A2. New public sector loans on less favorable terms in 2016-2036 2 17 17 16 18 18 16 12 7
B. Bound Tests
B1. Real GDP growth at historical average minus one standard deviation in 2017-2018 17 17 17 19 19 18 12 5B2. Export value growth at historical average minus one standard deviation in 2017-2018 3/ 17 20 22 25 24 22 16 6B3. US dollar GDP deflator at historical average minus one standard deviation in 2017-2018 17 17 17 19 19 18 12 5B4. Net non-debt creating flows at historical average minus one standard deviation in 2017-2018 4/ 17 17 18 20 20 19 14 5B5. Combination of B1-B4 using one-half standard deviation shocks 17 19 20 23 22 21 15 6B6. One-time 30 percent nominal depreciation relative to the baseline in 2017 5/ 17 17 17 19 19 18 12 5
Baseline 8 9 9 10 10 9 6 3
A. Alternative Scenarios
A1. Key variables at their historical averages in 2016-2036 1/ 8 8 8 8 7 7 4 3A2. New public sector loans on less favorable terms in 2016-2036 2 8 9 9 9 9 8 7 5
B. Bound Tests
B1. Real GDP growth at historical average minus one standard deviation in 2017-2018 8 9 9 10 9 9 6 3B2. Export value growth at historical average minus one standard deviation in 2017-2018 3/ 8 9 9 10 10 9 7 3B3. US dollar GDP deflator at historical average minus one standard deviation in 2017-2018 8 10 11 12 11 11 7 4B4. Net non-debt creating flows at historical average minus one standard deviation in 2017-2018 4/ 8 9 9 11 10 10 7 3B5. Combination of B1-B4 using one-half standard deviation shocks 8 9 9 10 10 10 7 3B6. One-time 30 percent nominal depreciation relative to the baseline in 2017 5/ 8 13 13 14 14 13 9 4
Memorandum item:Grant element assumed on residual financing (i.e., financing required above baseline) 6/ 36 36 36 36 36 36 36 36
Sources: Country authorities; and staff estimates and projections.
1/ Variables include real GDP growth, growth of GDP deflator (in U.S. dollar terms), non-interest current account in percent of GDP, and non-debt creating flows. 2/ Assumes that the interest rate on new borrowing is by 2 percentage points higher than in the baseline., while grace and maturity periods are the same as in the baseline.3/ Exports values are assumed to remain permanently at the lower level, but the current account as a share of GDP is assumed to return to its baseline level after the shock (implicitlyassuming an offsetting adjustment in import levels). 4/ Includes official and private transfers and FDI.5/ Depreciation is defined as percentage decline in dollar/local currency rate, such that it never exceeds 100 percent.6/ Applies to all stress scenarios except for A2 (less favorable financing) in which the terms on all new financing are as specified in footnote 2.
Debt service-to-revenue ratio
Debt service-to-exports ratio

THE FEDERAL DEMOCRATIC REPUBLIC OF ETHIOPIA
INTERNATIONAL MONETARY FUND 17
Table 5. Ethiopia: Public Sector Debt Sustainability Framework, Baseline Scenario, 2013–36 (percent of GDP, unless otherwise indicated)
Estimate
2013 2014 2015 Average5/ Standard
Deviation
5/
2016 2017 2018 2019 2020 20212016-21 Average 2026 2036
2022-36 Average
Public sector debt 1/ 37.7 41.3 50.7 54.1 56.5 57.3 56.6 55.1 53.7 46.7 37.5of which: foreign-currency denominated 21.1 22.5 28.3 30.1 30.9 31.1 30.2 28.9 27.6 21.1 13.5
Change in public sector debt 4.2 3.7 9.3 3.4 2.4 0.8 -0.6 -1.5 -1.5 -1.1 -0.7Identified debt-creating flows 3.0 2.3 3.3 0.4 0.2 -0.7 -1.0 -1.8 -1.7 -1.1 -0.7
Primary deficit 5.9 7.3 7.1 4.3 2.3 5.6 5.3 4.2 3.9 3.3 3.2 4.3 2.9 2.1 2.7Revenue and grants 18.0 16.9 18.1 19.2 19.0 19.1 19.5 20.0 20.4 21.2 23.9
of which: grants 3.2 2.6 2.4 1.9 1.7 1.4 1.4 1.3 1.2 1.1 0.9Primary (noninterest) expenditure 23.9 24.2 25.2 24.9 24.3 23.3 23.4 23.3 23.6 24.0 26.1
Automatic debt dynamics -2.7 -5.0 -3.8 -5.2 -5.0 -5.0 -4.9 -5.0 -4.9 -4.0 -2.8Contribution from interest rate/growth differential -3.2 -4.5 -3.9 -4.3 -4.9 -5.0 -5.1 -5.2 -5.0 -4.1 -2.9
of which: contribution from average real interest rate -0.2 -0.9 -0.1 -1.2 -1.1 -1.1 -1.1 -1.3 -1.3 -1.3 -0.8of which: contribution from real GDP growth -3.0 -3.5 -3.8 -3.1 -3.8 -3.9 -4.0 -3.9 -3.7 -2.8 -2.2
Contribution from real exchange rate depreciation 0.5 -0.5 0.2 -0.9 -0.1 0.1 0.2 0.1 0.1 ... ...Other identified debt-creating flows -0.1 0.0 0.0 0.0 0.0 0.0 0.0 0.0 0.0 0.0 0.0
Privatization receipts (negative) -0.1 0.0 0.0 0.0 0.0 0.0 0.0 0.0 0.0 0.0 0.0Recognition of implicit or contingent liabilities 0.0 0.0 0.0 0.0 0.0 0.0 0.0 0.0 0.0 0.0 0.0Debt relief (HIPC and other) 0.0 0.0 0.0 0.0 0.0 0.0 0.0 0.0 0.0 0.0 0.0Other (specify, e.g. bank recapitalization) 0.0 0.0 0.0 0.0 0.0 0.0 0.0 0.0 0.0 0.0 0.0
Residual, including asset changes 1.2 1.3 6.1 3.0 2.2 1.5 0.4 0.3 0.2 0.0 0.0
Other Sustainability IndicatorsPV of public sector debt ... ... 42.6 45.9 48.0 48.4 47.8 46.3 45.1 39.0 32.0
of which: foreign-currency denominated ... ... 20.2 21.9 22.4 22.3 21.3 20.1 19.0 13.4 8.1of which: external ... ... 20.2 21.9 22.4 22.3 21.3 20.1 19.0 13.4 8.1
PV of contingent liabilities (not included in public sector debt) ... ... ... ... ... ... ... ... ... ... ...Gross financing need 2/ 8.0 9.3 9.6 8.9 8.6 7.5 7.4 6.6 6.4 5.0 3.9PV of public sector debt-to-revenue and grants ratio (in percent) … … 235.0 239.1 252.3 254.1 244.9 231.1 220.9 184.4 133.8PV of public sector debt-to-revenue ratio (in percent) … … 271.7 265.9 276.9 274.8 263.8 247.1 235.3 194.4 138.9
of which: external 3/ … … 129.1 127.0 129.3 126.7 117.6 107.2 99.2 67.0 35.0Debt service-to-revenue and grants ratio (in percent) 4/ 12.1 11.9 13.7 17.2 17.7 17.4 17.8 16.7 15.7 10.0 7.6Debt service-to-revenue ratio (in percent) 4/ 14.7 14.1 15.8 19.1 19.4 18.8 19.1 17.9 16.7 10.6 7.9Primary deficit that stabilizes the debt-to-GDP ratio 1.7 3.7 -2.3 2.2 2.9 3.4 4.5 4.8 4.7 4.0 2.8
Key macroeconomic and fiscal assumptionsReal GDP growth (in percent) 9.9 10.3 10.2 10.6 0.9 6.5 7.5 7.5 7.5 7.4 7.3 7.3 6.3 6.0 6.3Average nominal interest rate on forex debt (in percent) 1.4 1.2 1.6 1.0 0.4 2.2 2.3 2.3 2.3 2.2 2.2 2.3 1.8 1.4 1.7Average real interest rate on domestic debt (in percent) 0.9 -4.5 -0.7 -9.7 8.4 -6.1 -5.6 -5.2 -5.0 -5.5 -5.5 -5.5 -5.3 -3.0 -5.0Real exchange rate depreciation (in percent, + indicates depreciation) 2.7 -2.9 0.8 -2.8 11.0 -3.4 ... ... ... ... ... ... ... ... ...Inflation rate (GDP deflator, in percent) 5.5 10.9 5.8 15.9 10.4 10.7 9.6 8.7 8.2 8.5 8.5 9.0 8.2 8.3 8.2Growth of real primary spending (deflated by GDP deflator, in percent) 22.7 11.9 14.6 5.0 8.3 5.1 5.1 3.1 8.1 6.9 8.6 6.1 6.9 6.5 7.0Grant element of new external borrowing (in percent) ... ... ... … … 20.7 31.9 36.9 45.0 41.6 38.1 35.7 42.3 43.9 ...
Sources: Ethiopian authorities and staff estimates and projections.1/ Reffers to nonfinancial public sector gross debt.2/ Gross financing need is defined as the primary deficit plus debt service plus the stock of short-term debt at the end of the last period. 3/ Revenues excluding grants.4/ Debt service is defined as the sum of interest and amortization of medium and long-term debt.5/ Historical averages and standard deviations are generally derived over the past 10 years, subject to data availability.
Actual Projections
THE FEDERAL DEMOCRATIC REPUBLIC OF ETHIOPIA
18 INTERNATIONAL MONETARY FUND
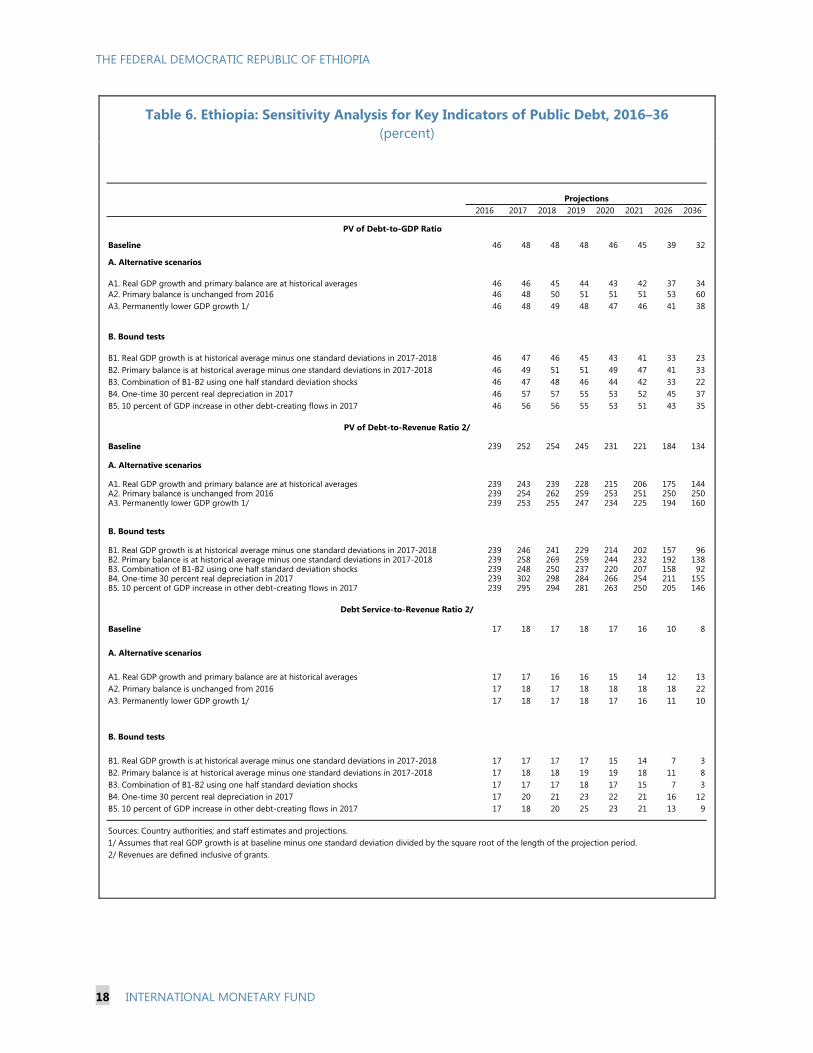
Table 6. Ethiopia: Sensitivity Analysis for Key Indicators of Public Debt, 2016–36 (percent)
2016 2017 2018 2019 2020 2021 2026 2036
Baseline 46 48 48 48 46 45 39 32
A. Alternative scenarios
A1. Real GDP growth and primary balance are at historical averages 46 46 45 44 43 42 37 34A2. Primary balance is unchanged from 2016 46 48 50 51 51 51 53 60A3. Permanently lower GDP growth 1/ 46 48 49 48 47 46 41 38
B. Bound tests
B1. Real GDP growth is at historical average minus one standard deviations in 2017-2018 46 47 46 45 43 41 33 23B2. Primary balance is at historical average minus one standard deviations in 2017-2018 46 49 51 51 49 47 41 33B3. Combination of B1-B2 using one half standard deviation shocks 46 47 48 46 44 42 33 22B4. One-time 30 percent real depreciation in 2017 46 57 57 55 53 52 45 37B5. 10 percent of GDP increase in other debt-creating flows in 2017 46 56 56 55 53 51 43 35
Baseline 239 252 254 245 231 221 184 134
A. Alternative scenarios
A1. Real GDP growth and primary balance are at historical averages 239 243 239 228 215 206 175 144A2. Primary balance is unchanged from 2016 239 254 262 259 253 251 250 250A3. Permanently lower GDP growth 1/ 239 253 255 247 234 225 194 160
B. Bound tests
B1. Real GDP growth is at historical average minus one standard deviations in 2017-2018 239 246 241 229 214 202 157 96B2. Primary balance is at historical average minus one standard deviations in 2017-2018 239 258 269 259 244 232 192 138B3. Combination of B1-B2 using one half standard deviation shocks 239 248 250 237 220 207 158 92B4. One-time 30 percent real depreciation in 2017 239 302 298 284 266 254 211 155B5. 10 percent of GDP increase in other debt-creating flows in 2017 239 295 294 281 263 250 205 146
Baseline 17 18 17 18 17 16 10 8
A. Alternative scenarios
A1. Real GDP growth and primary balance are at historical averages 17 17 16 16 15 14 12 13A2. Primary balance is unchanged from 2016 17 18 17 18 18 18 18 22A3. Permanently lower GDP growth 1/ 17 18 17 18 17 16 11 10
B. Bound tests
B1. Real GDP growth is at historical average minus one standard deviations in 2017-2018 17 17 17 17 15 14 7 3B2. Primary balance is at historical average minus one standard deviations in 2017-2018 17 18 18 19 19 18 11 8B3. Combination of B1-B2 using one half standard deviation shocks 17 17 17 18 17 15 7 3B4. One-time 30 percent real depreciation in 2017 17 20 21 23 22 21 16 12B5. 10 percent of GDP increase in other debt-creating flows in 2017 17 18 20 25 23 21 13 9
Sources: Country authorities; and staff estimates and projections.1/ Assumes that real GDP growth is at baseline minus one standard deviation divided by the square root of the length of the projection period.2/ Revenues are defined inclusive of grants.
PV of Debt-to-GDP Ratio
Projections
PV of Debt-to-Revenue Ratio 2/
Debt Service-to-Revenue Ratio 2/