STAFF PAPER SERIES
33
University of Wisconsin-Madison Department of Agricultural & Applied Economics Staff Paper No. 536 May 2009 The Construction of a Tax and Expenditure Limitation Index for the U.S. By Lindsay Amiel, Steven Deller and Judith Stallmann __________________________________ AGRICULTURAL & APPLIED ECONOMICS ____________________________ STAFF PAPER SERIES Copyright © 2009 Lindsay Amiel, Steven Deller & Judith Stallmann. All rights reserved. Readers may make verbatim copies of this document for non-commercial purposes by any means, provided that this copyright notice appears on all such copies.
Transcript of STAFF PAPER SERIES

University of Wisconsin-Madison Department of Agricultural & Applied Economics
Staff Paper No. 536 May 2009
The Construction of a Tax and Expenditure Limitation
Index for the U.S.
By
Lindsay Amiel, Steven Deller and Judith Stallmann
__________________________________ AGRICULTURAL &
APPLIED ECONOMICS ____________________________
STAFF PAPER SERIES
Copyright © 2009 Lindsay Amiel, Steven Deller & Judith Stallmann. All rights reserved. Readers may make verbatim copies of this document for non-commercial purposes by any means, provided that this copyright notice appears on all such copies.
1
Version 1.5
May 6, 2009
The Construction of a Tax and Expenditure Limitation Index for the US1
Lindsay Amiel, University of Wisconsin-Madison Steven Deller, University of Wisconsin-Madison
Judith Stallmann, University of Missouri, Columbia
Abstract
This report provides detail on the construction of an index of tax and expenditure limitations (TELs) for the 50 US states for the time-frame 1969 to 2005. Separate annual indices are constructed for TELs on state and on local governments. The goal of constructing the indices is to provide a means to test a range of hypotheses concerning the impact of TELs on economic performance and on state and local government fiscal policies. This report documents the construction of the index. The data are provided in Excel spreadsheets so that others may construct alternative indices. 2
Introduction
In the name of forcing “fiscal discipline” on state and local government officials in 46 states have imposed some form of tax and expenditure limitation (TEL) (Mullins and Wallin 2004). A commonly known TEL is California’s Proposition 13, passed by popular vote in 1978, which limits the property tax rate to 1 percent and limits increases in assessments to 2 percent or the rate of inflation, whichever is less, unless the property has been improved. Another is Massachusetts’ Proposition 2½ passed by referendum in 1980. Local property taxes were capped at 2.5 percent of real property value, a tax break of $550 million--$347 1 This research was supported by the Wisconsin Agricultural Experiment Station, University of Wisconsin-Madison. We appreciate the helpful comments of Rebecca Hendrick, Craig Maher and Mark Skidmore. 2 The data are available on the Department of Agricultural and Applied Economics website under Department Staff Papers at: http://www.aae.wisc.edu/pubs/sps/

2
million in property taxes and $200 million in car excise taxes. Cities and towns above the limit were given three years to cut their rates. Nominal annual growth in property tax revenues is limited to 2.5%, unless a vote of the residents allows a greater increase. Others include Michigan’s Headlee amendment passed in 1978 and Colorado’s Taxpayer’s Bill of Rights (TABOR) passed in 1992 (Kornhauser 2002).
Lowery and Sigelman (1981) identify eight potential reasons why tax revolts, particularly against the property tax, have been so popular in the U.S. For practical purposes these eight can be classified into two broad areas. First, for reasons ranging from the lack of competitive market forces to self-interested bureaucratic behavior, government tends to be bloated and taxes are unnecessarily high. Within the literature this is referred to as Leviathan-Niskanen-Buchanan hypothesis and the approach is often studied within the area of public choice theory. Following this hypothesis, in the name of imposing fiscal discipline many states have amended their state constitutions or passed statutory limits on how fast taxation and/or expenditure levels can increase. In political circles this view would be most closely related to libertarian political ideals. Second, taxes are a drain on the economy because government spending diverts that money from other uses and retards economic growth. Based on this hypothesis, in the name of economic growth and development states have limited the level of taxation, and correspondingly government spending.
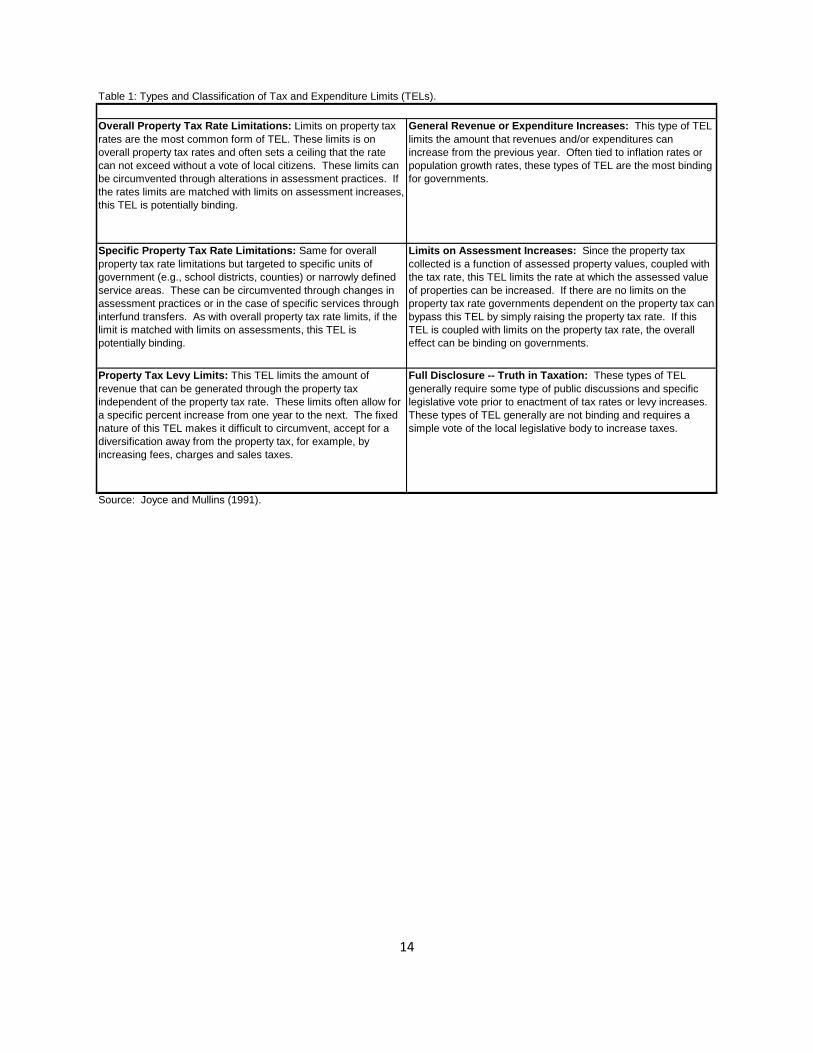
One of the primary difficulties for a systematic study of the impact tax and expenditure limitations have on fiscal policies and/or economic performance is the unique nature of each state’s particular tax and expenditure limitation. Joyce and Mullins (1991) place tax and expenditure limitations into six broad classifications ranging from simple full disclosure–truth in taxation rules--to strict general revenue or expenditure increases (Table 1). Full disclosure rules generally require some type of public discussions and a specific legislative vote prior to enactment of tax rate increases. These types of tax and expenditure limitations generally are not fiscally binding (that is it is usually possible to work around the limit) and require a majority vote of the legislative body to increase taxes and spending. The most restrictive tax and expenditure limitations limit the amount or the percentage by which revenues and/or expenditures can increase from the previous year. Often tied to inflation rates, population growth rates or growth in per capita income, these types of tax and expenditure limitations are the most binding for governments (Poulson 2005).
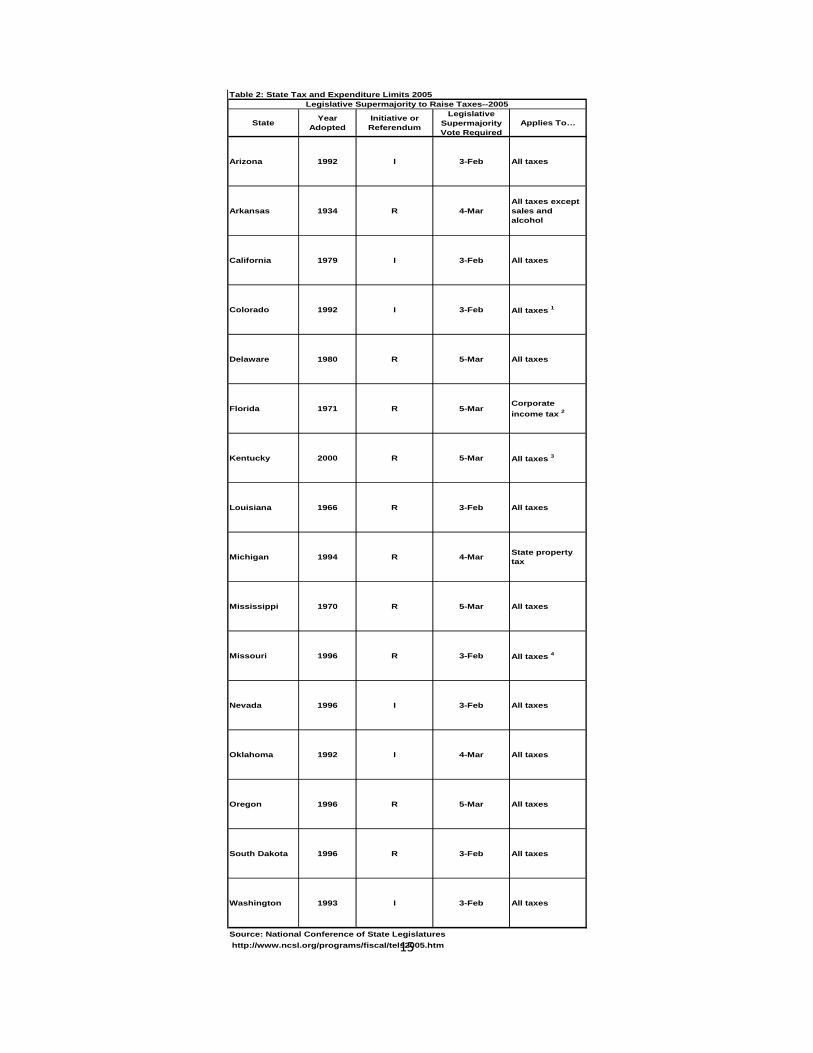
Another complicating factor for research is the timeframe over which tax and expenditure limitations have been in place. West Virginia has had an overall local property tax rate limit in place since 1939 and Missouri placed its first focused property tax rate limit on local government in 1875 (Mullins and Wallin 2004). Arkansas passed a supermajority requirement to raise taxes in 1934 (NCSL 2005). Florida adopted limits on corporate income taxes in 1971 (NCSL 2005). California’s Proposition 13 was enacted in 1979, Colorado’s Taxpayer’s Bill of Rights (TABOR) in 1992, Massachusetts’s Proposition 2½ in 1980 (Kornhauser 2002), and Wisconsin’s limit on the ability of local governments to raise property taxes in 1993 (Deller and Stallmann 2007). This significant heterogeneity across the states in terms of how the TELs are structured and the timeframe in which they were enacted create a significant problem in modeling the dynamics of the interplay between the tax and expenditure limitation and subsequent fiscal policies and government performance as well as economic performance. How this heterogeneity has been addressed within the empirical literature has been to study individual states in isolation almost within a case-study approach or the adoption of simplistic dummy variables in multivariate regression (for example, Cutler, et.al 1999; Mason 2005; McGuire and Rueben 2006; Deller and Stallmann 2007; Stallmann and Deller (forthcoming)). This almost default approach has severely limited the depth and generalizability of the TEL literature.

3
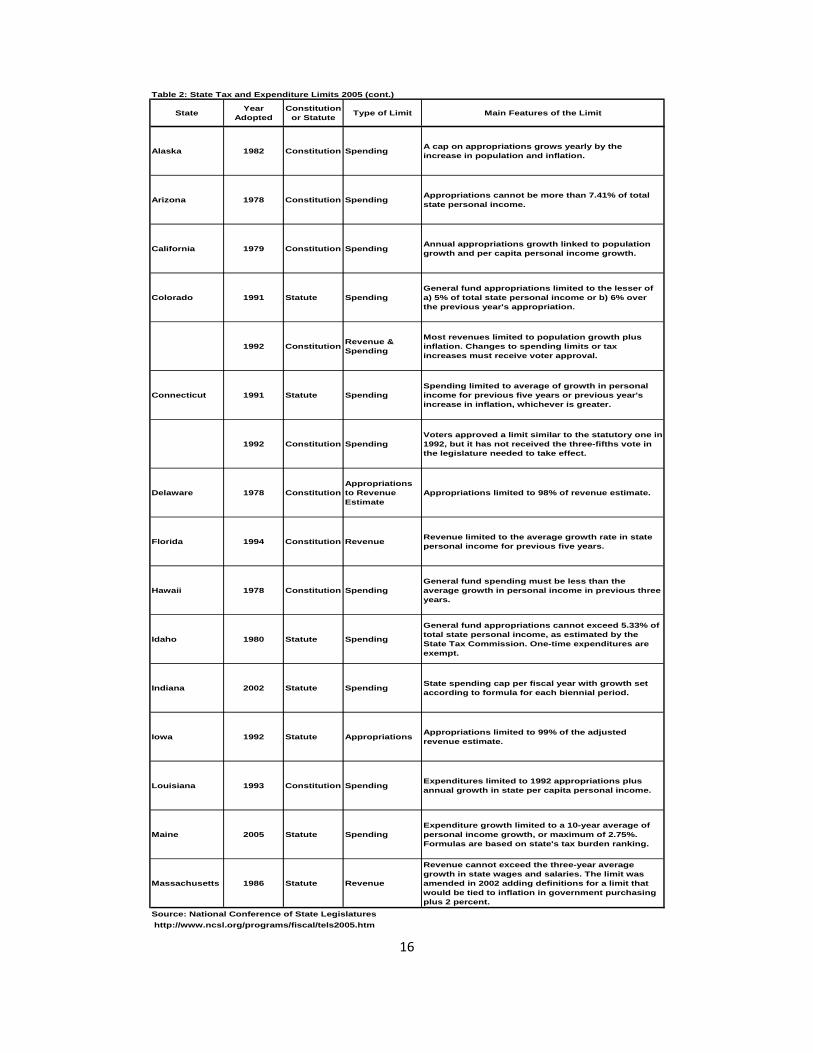
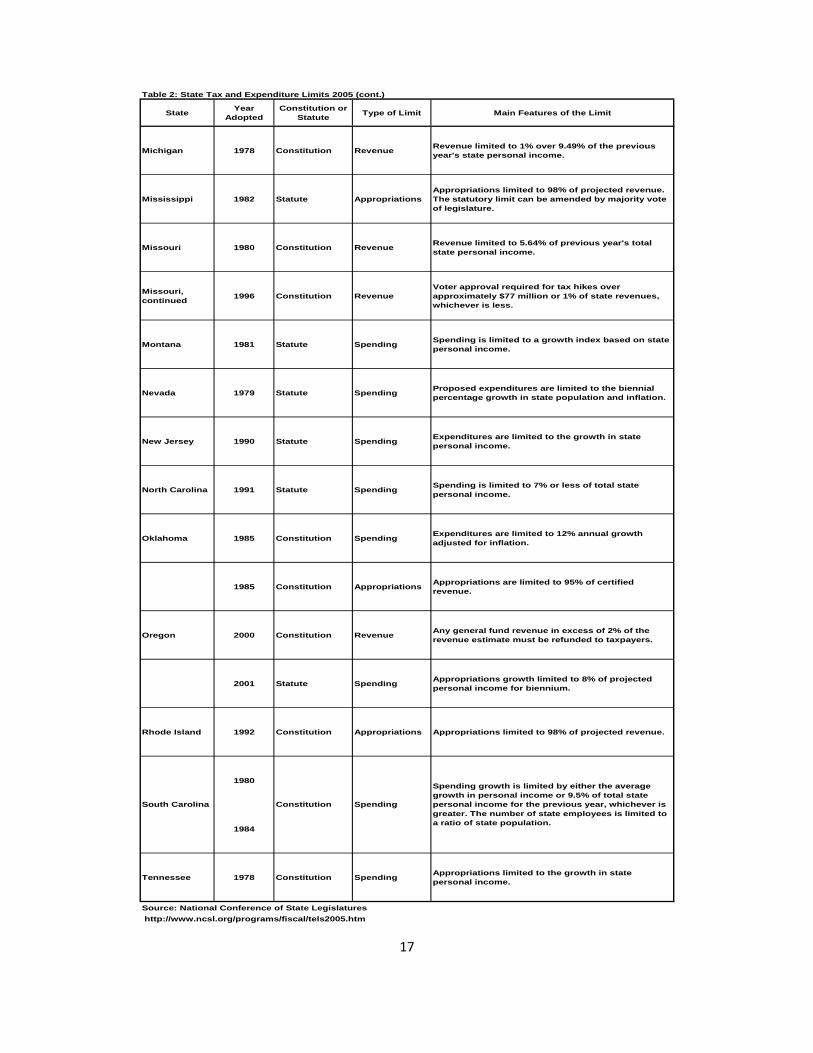
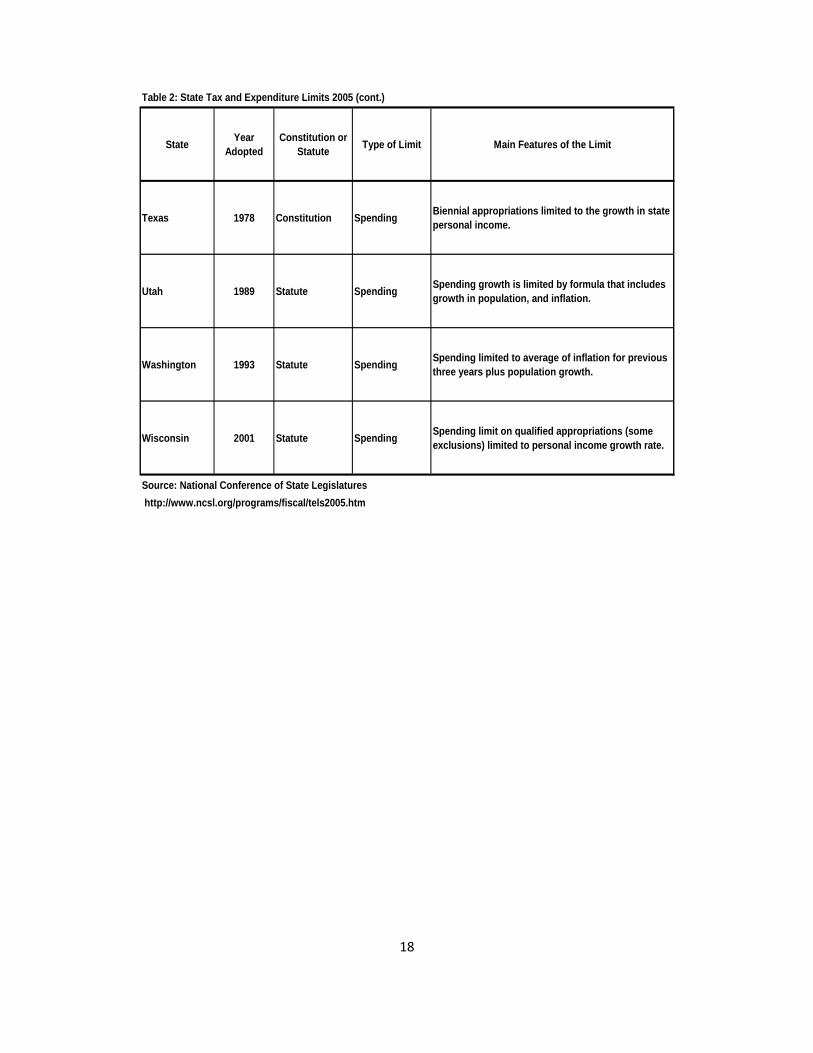
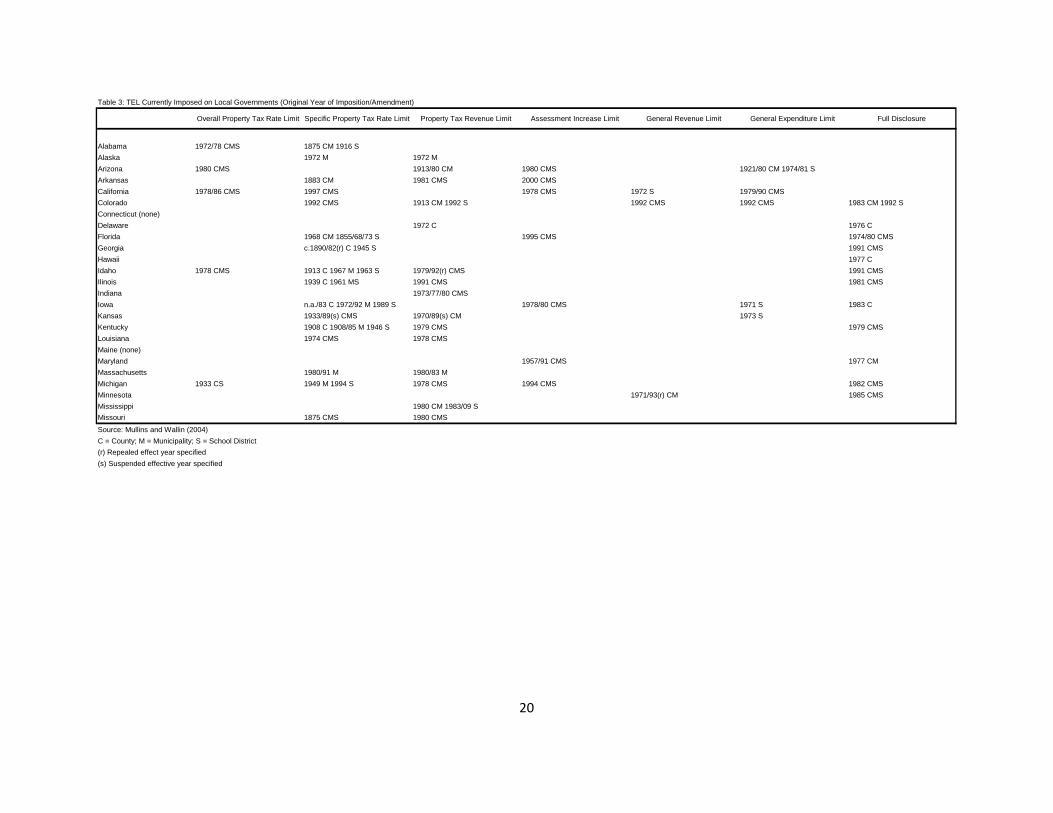
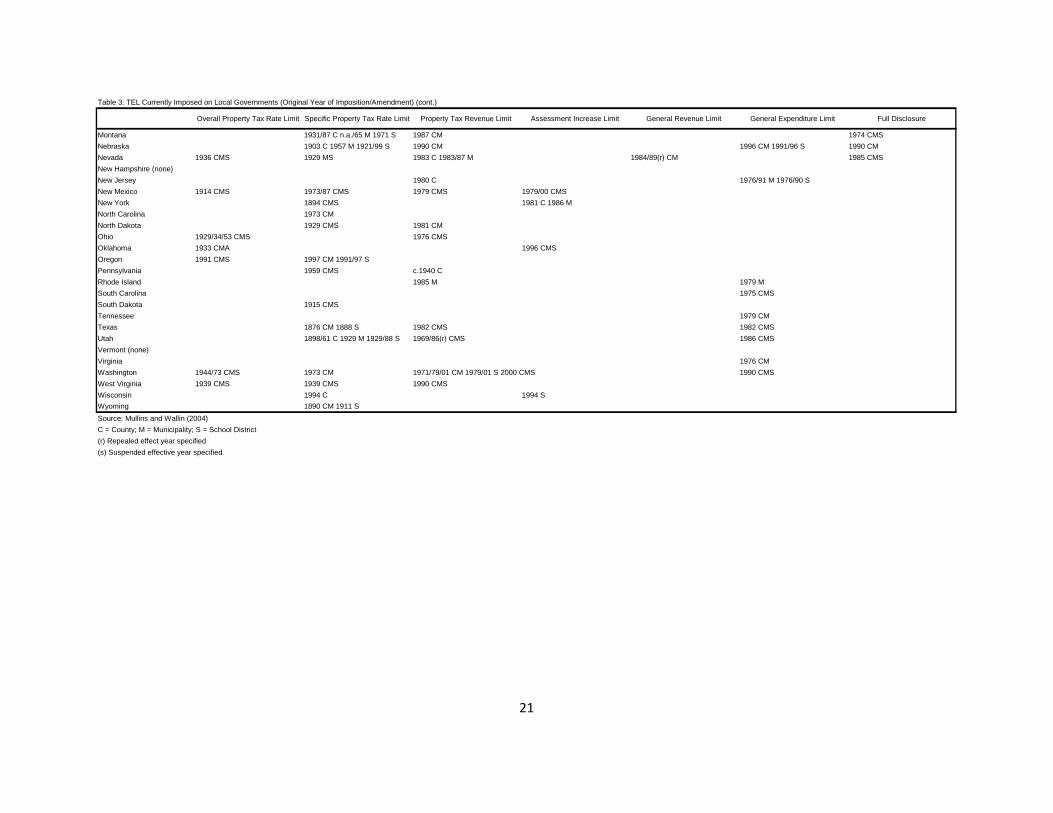
As noted above, 46 of the 50 states have some form of tax and expenditure limitation (TEL) in place on state or local governments with the oldest being a 1875 limit on the growth in property tax rates in Missouri (Mullins and Wallin 2004). But as noted by Poterba and Rueben (1999) no two states are alike and TELs range from limits on how fast specific taxes can increase for specific units of government to strict limits on how much government spending can increase from one year to the next. Using the work of Mullins and Wallin (2004) and the National Conference of State Legislatures (NCSL) (2005) we provide a summary of TELs aimed at state governments in Table 2, and a summary of TELs targeting local governments in Table 3.
Modeled on the work of Poulson (2005), the intent of this study is to offer a TEL Index that quantifies the severity of the TEL of individual states on both state and on local governments. By constructing such an index we are able to conduct more consistent cross state analysis ranging from broad questions on economic growth, development and performance and fiscal policy responses to TEL to more narrow questions such as the impact of TELs on the credit worthiness of state governments. We also hope that by compiling a national date-base characterizing several dimensions of state and local TELs and making that data-base available to researchers others can explore the creation of their own indices. As in the creation of any index, our TEL indices include normative value judgments of how each characteristic of the TEL is entered into the index and the weighting assigned to each characteristic. We provide the data on-line to make our judgments transparent and to facilitate construction of alternative indices by others.
This report is composed of three parts beyond the introductory comments. In the next sections we provide a discussion of how we constructed our TEL indices for both state and local governments. We then provide a brief summary of our indices for a several states. The report closes with a summary and a challenge to those interested in examining the impact of TELs to explore alternative ways to construct an index and expand the research into the impact of TELs.
Construction of the State Index
Based on a review of the literature (Joyce and Mullins 1991, Poulson 2005, Mullins and Wallin 2004, NCSL 2005, Skidmore 1999, Waisanen 2007) we describe tax and expenditure limits using six characteristics, each of which effects how strict or binding a TEL is: 1) the type of TEL; 2) if the TEL is statutory or constitutional; 3) growth restrictions; 4) method of TEL approval; 5) override provisions; and 6) exemptions.
Type of TEL: In general, the types of TELs on state governments can be broken down into four major categories: revenue and/or expenditure, appropriations, tax revenue, and general fund expenditure limits. General revenue and expenditure TELs limit how much revenue and expenditures can increase from year to year. This type of TEL is the most binding on state governments. Some states have either a revenue or an expenditure limit while others have both. Because governments with only expenditure limits can theoretically hold-over excess revenue from one year to the next, revenue limits are generally seen as more restrictive than expenditure limits.(Whether this is allowed is covered in the exemptions.) In addition, TELs often only restrict certain types of government revenue and expenditure; appropriations, tax revenue, and/or general fund expenditures. TELs that only limit specific types of revenue and expenditures are less restrictive than TELs that restrict all sources of government revenue and expenditures.
4
Statutory or constitutional: One important element of individual TELs that is not addressed in Joyce and Mullins’ classifications is whether the limits are statutory or constitutional amendments in nature. As discussed in detail by Fino (2003) the distinction between statutory and constitutional limits is significant. Statutory limits can be more easily modified or rescinded than constitutional limits in times of fiscal or economic emergencies. Fino does note, however, that unlike the US Constitution which is seldom modified, state constitutions are more easily modified, often to reflect short-term political winds. Even though state constitutions are often modified, constitutional provisions tend to be difficult to remove no matter how dated the amendment or how forgotten the predicament that initiated the provision’s original adoption.
Growth restriction: Likewise, growth restrictions built into the structure of the TEL determine the maximum amount of allowable growth. Several factors determine citizen demands and changes in demand for public services and the costs of providing public services: population change, personal income changes (and income elasticity of demand), changing preferences and inflation. Limitations that do not take all of these factors into account will be limiting. The most limiting growth restriction ties allowable growth to changes in inflation and/or population growth. Tying the growth rate of the TEL to inflation insures only that there are adequate resources to maintain the current provision of public goods and services but they may have to be spread across more people. Similarly, tying the growth restriction to population growth insures only that the government is able to accommodate the additional demands for public goods and services associated with population growth, provided that inflation does not increase. The least restrictive type of growth restrictions are those that simply prevent new taxes from being levied, since this type of growth restriction does not prevent current taxes from increasing.
Method of Approval: Each state has its own rules and regulations as to how a TEL, whether statutory or constitutional, must be both introduced and approved. The more difficult it is to introduce a TEL statute or constitutional amendment, the harder it is to change it in the future. Unfortunately, nuances in individual state procedures make it very difficult to quantify and compare methods across states. The most restrictive is a constitutional convention and the least restrictive is a legislative vote, which only requires a majority vote of the legislative body. The other two methods of approval—legislative referendum and citizen initiative are much more difficult to classify and are discussed below.
Legislative referendums are measures that are referred to the ballot by at least a majority vote of the legislature. Citizens must approve the measure with a fifty-percent majority in the next general election for the measure to become law. Since the process of legislative referendums is relatively consistent between states, and requires a majority vote by both the legislative branch and the general population, it was ranked higher than citizen initiatives. Citizen initiatives are measures that are placed on the ballot through citizen petition. Only 24 states permit this type of method. It depends state by state as to how difficult it is for citizens to propose new legislation through this method. Some states, such as California, require signatures equal to a percentage of votes cast in the last gubernatorial election; other states, such as Nebraska, require signatures equal to a percentage of registered voters. The latter is obviously much more restrictive than the former. In addition to the variation among states in the percentage of signatures needed is the variation in the time allotted to collect the necessary signatures. As a consequence, in some states, statutes or constitutional amendments that must be proposed and approved using this method may be more restrictive than legislative referendums. In other states, it is the opposite. Ideally, the ranking scheme would reflect these differences, and allow citizen initiatives to out rank legislative referendum (and vise versa) on a state by state basis. Unfortunately, without a deep understanding of individual state laws and procedures, it is not possible for the ranking scheme to take this into account. In addition, policies and procedures constantly change. As a result, it would necessary to not only consider the time frame of the TEL, but also the structure of the government at the time the TEL was passed.
5
Overrides and Exemptions: Override provisions and exemptions are mechanisms through which a TEL can be circumvented. The strictest TELs do not permit overrides, or require voter approval in addition to a legislative vote in order to increase taxes. The least restrictive TELs simply require the declaration of an emergency or a majority vote in the legislature. TELs often exempt certain types of taxes and levies from the TEL. This includes, but is not limited to the exclusion of debt service, court mandates or capital projects. Each exemption weakens the TEL. It is also important to distinguish between constitutional and statutory TELs. TELs that are written into the state constitution are significantly more difficult to change or repeal and are thus more restrictive than statutory TELs.
It is clear, that TELs are extremely heterogeneous. As a consequence, a traditional dummy variable for the presence of a TEL in econometric analysis of tax expenditure limits does not sufficiently represent the heterogeneity of TELs. In order to account for the differences between TELs in different states, we create a TEL index that assigns a numerical value to each state reflecting the strictness of the TELs. Our method for constructing a state TEL index follows the work Poulson (2005).3 The Poulson index, however, is static and does not take into account that TEL’s are dynamic; states regularly modify the constraints placed on tax revenue and government expenditures. Therefore, the index constructed here provides a state TEL value that may change annually to reflect the tax and expenditure environment for each year from 1969 to 2005.
In order to create the TEL index, states received point values in each of the six categories described above: 1) the type of TEL; 2) if the TEL is statutory or constitutional; 3) growth restrictions; 4) method of TEL approval; 5) override provisions; and 6) exemptions. Data regarding specific TEL’s in each state were compiled from the Wausanen (2007), Skidmore (1999), Mullins and Wallin (2004) and Sokolow (2004). High point values in each category correspond to stricter limitations, while lower point values correspond to more lenient limitations. The rankings in each category are ordinal, and do not reflect magnitude. For example, in our index, a revenue and expenditure limit is worth six possible points while a tax revenue limit is worth two points. This does not mean that the former is three times more restrictive than the latter. Rather, it simply indicates that a TEL that restricts both revenue and expenditures is more severe than a TEL that limits only tax revenue. Each possible exemption to the TEL is assigned a point value of negative one as they each make the TEL less restrictive. The sum of the points received in each category creates the TEL value for that state. TEL values were calculated for each year during our study period. Thus, it is possible to examine how the tax and expenditure environment in each state changes over time. States without tax expenditure limits received a value of zero.
The state TEL Index has a mean value of 5.2 with a standard deviation of 7.2 and a range from 0 to 30. The weighting scheme used in this index is:
3 Poulson uses five dimensions to evaluate and rate the 50 states on tax and expenditure limitations: 1) type of limit and method of approval, 2) what the tax and expenditure limitation limits, 3) the size of the tax and expenditure limitation limits, 4) treatment of surpluses, and 5) provisions for voter approval of tax and expenditure increases and waiver of the tax and expenditure limitation. Within each of these dimensions states are ranked on a scale of one to five depending on the strictness of their law on that particular dimension. For example, for the category “type of limit and method of approval,” states that have statutory tax and expenditure limitations enacted through legislative votes receive one point while states with tax and expenditure limitations that originated through citizen initiatives and are embodied in the constitution receive five points. Using this scaling method, states with no tax and expenditure limitation in place receive a score of zero and the maximum score possible is 25. See Appendix Tables 1 & 2 for a summary of the characteristics of the Poulson index along with the scores of each US state.

6
PointsType of TEL Revenue and Expenditure 6
Revenue (all) 5Expenditure 4Appropriations 3Tax Revenues (only) 2General Fund Expenditure 1
Statutory/Constitutional Constitutional=1 1
Growth Restriction Less than or equal to inflation and/or population growth rate 7Less than or equal to the rate of personal income growth 6Limited to the rate of growth in the state economy 5Less than seven percent of state income 4Restricted to a percent greater than or equal to seven percent of state income 3Equal to a share of total revenue or expenditures 2No new taxes or fees 1
Method of Approval Constitutional Convention 4Legislative referendum 3Citizen Initiative 2Legislative vote 1
Override Provisions No override allowed 4Voter approval to raise taxes and expenditure of surplus wages 3Supermajority vote 2Declaration of emergency funds 1
Exemptions Budget reserves -1Grants -1Capital Projects -1Debt Service -1Court Mandates -1Non-recurring general fund appropriations -1
State TEL Index
Construction of the Local Index
Because of the unpopularity of the property tax, most local TELs focus on the property tax. Typical local TELs limit the rate of growth in the property tax rate (mill rate), growth in property assessments or some combination of the two. The combination is often called a property tax levy limit where the rate of growth in total property tax revenues is limited. Generally, increases are tied to the inflation rate or an arbitrary annual rate (e.g. 2 percent). When the TEL applies just to property tax, local governments can often side-step the limits by diversifying revenue streams through imposing user fees or charges or expanding the sales tax if one is in place. The rapid acceleration in the use of these alternative sources of revenue in many states can be explained in part by the limitations imposed on property taxes (Mullins 2004). Because the property tax is predominately used by local governments and in particular public school districts, these types of TELs tend to disproportionately impact local governments. School districts in particular tend to have only property taxes and state revenues for funding.
The TEL index for local governments was constructed in a similar fashion to the state TEL. There are six main types of local tax limits: 1)the type of TEL, 2) specific restrictions 3)statutory or constitutional, 4)scope—which local governments are included, 5)overrides and exemptions and 6)method of override (Mullins, 1995; Mullins, 2004; Mullins and Wallin, 2004).
Type of TEL: The most restrictive types of TELs are those that limit property tax rates or revenues. Less restrictive are those that limit assessments. Full disclosure limits are the least restrictive, as they are
7
limited to making taxpayers aware of levy increase proposals and providing them with an opportunity to voice their opinions in public hearings. Limits on assessments are relatively new, but extremely important, as they can make property tax limits more binding.
Restrictions: For each type of restriction the level of the restriction is coded. In addition, between the different levels of government and the different types of local TEL’s, there are many different combinations possible. The most restrictive TELs are those that limit the growth of revenues and expenditures to the rate of inflation or population growth. The least restrictive are those that arbitrarily set a limit between five and ten percent. Property tax rate limits generally place a restriction on the mill rate. The mill rate varies considerably, depending on the level government the TEL is targeting. As a consequence, restrictions for the specific property tax rate limit were not included.
Scope: The scope of the TEL is the specific levels of government included. The most restrictive apply to each level of local government; the county, municipality, and school levels. The least restrictive only apply to only one. As a consequence, in this index, the TEL receives one point for each level government that is included under the limit. For instance, if a limit applies to all levels of government, it receives a score of four for this section. If it only applies to school districts, it receives a score of one.
Overrides and Exemptions: There are many different exemptions and override provisions in local TEL’s. Exemptions on expenditures allow the local government to increase overall expenditures despite the limit. Many local TELs exclude debt service, special levies, capital improvements and construction expenditures from the expenditure limit. The sales tax option allows local governments to supplement property tax revenue using an alternative source that is not restricted. Since it is not possible to determine the magnitude of the effect of each exemption on the strictness of the TEL, they have all been given a ranking of negative one.
Override Method; Similarly, override provisions in TELs permit local governments to circumvent the limit by authorizing rate or levy increases. The method of override affects the restrictiveness of the TEL. The two most restrictive are those that do not allow overrides. Most overrides are through popular referenda, which require a majority vote by the citizens. In a few cases, the provision may require a supermajority, two-thirds vote, by citizens in order to increase the levy or rate. This type of override provision is the most restrictive. In rare cases, the override provision allows an appeal to the state board or to the courts. .
The local TEL Index has a mean of about 12.5, standard deviation of 9.5 and a range of 0 to 38.0. The weighting scheme used in this index is:

8
Local TEL Index PointsType of TEL Overall Property Tax Rate Limit 7
Limited to more than or equal to 2.5% 2Limited to more than 2.5 percent 1
Specific Property Tax Rate Limit 6
Property Tax Revenue (Levy) Limit 5Limit less than or equal to inflation or 5% whichever is less 3Limit less than or equal to 5% 2Limit more than 5% 1
Assessment Increase 4No approved increases 4Lower of 5%(0r less) or CPI 3Limit less than or equal to 5% 2Limit more than 5% 1
General Revenue Limit 3No new tax or rate increase 4Limit equal to inflation and or population growth 3Limit is less than or equal to five percent 2Limit is between five and ten percent 1
General Expenditure Limit 2Limit equal to inflation and or population growth 4Limit is equal to the change in per capita income 3Limit is less than or equal to five percent 2Limit is between five and ten percent 1
Statutory/Constitutional Full Disclosure 1
Scope Constitutional=1 1
County 1Municipality 1Special District 1Other 1
Overrides/Exemptions Sales Tax OptionOther taxes -1Debt Service -1Home Rule -1Special Levies -1Capital Improvements -1Emergency -1Construction -1Other -1
Methode of override No approved overrides 4Super majority Referendum 2Majority vote by local representatives 1Simple Majority Referndum 1Appeal to Courts 1Appeal to state board 1
9
Examples of the Indices
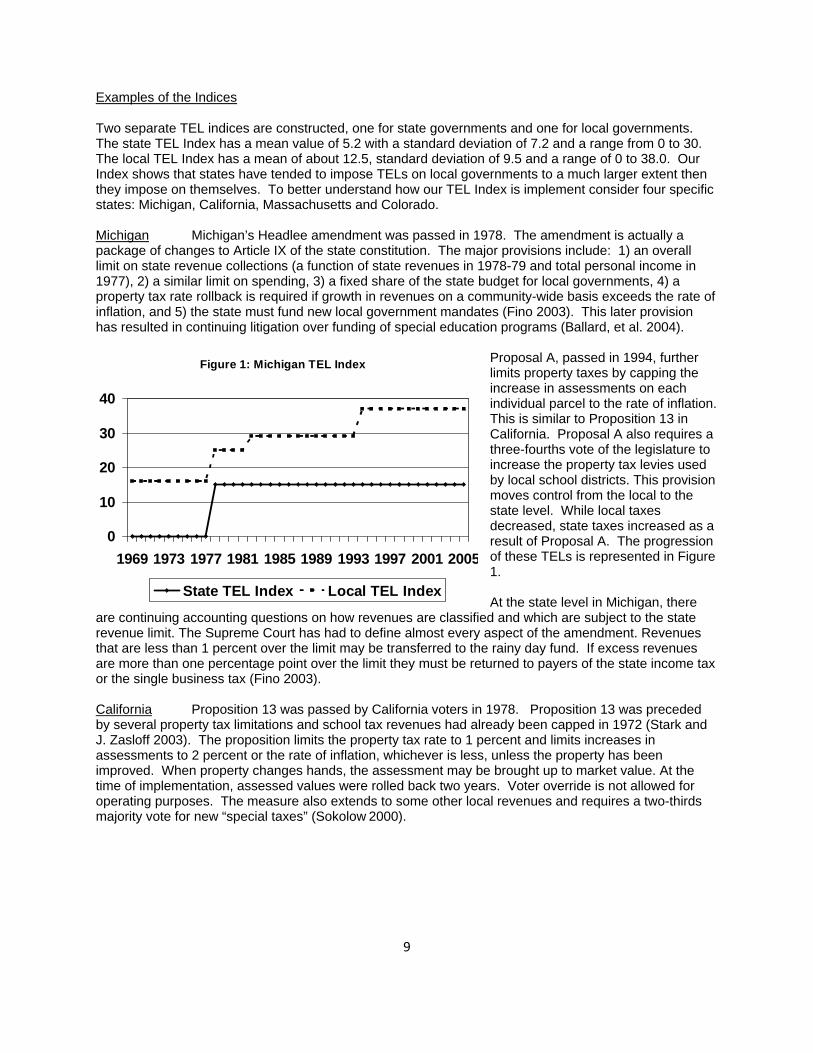
Two separate TEL indices are constructed, one for state governments and one for local governments. The state TEL Index has a mean value of 5.2 with a standard deviation of 7.2 and a range from 0 to 30. The local TEL Index has a mean of about 12.5, standard deviation of 9.5 and a range of 0 to 38.0. Our Index shows that states have tended to impose TELs on local governments to a much larger extent then they impose on themselves. To better understand how our TEL Index is implement consider four specific states: Michigan, California, Massachusetts and Colorado. Michigan Michigan’s Headlee amendment was passed in 1978. The amendment is actually a package of changes to Article IX of the state constitution. The major provisions include: 1) an overall limit on state revenue collections (a function of state revenues in 1978-79 and total personal income in 1977), 2) a similar limit on spending, 3) a fixed share of the state budget for local governments, 4) a property tax rate rollback is required if growth in revenues on a community-wide basis exceeds the rate of inflation, and 5) the state must fund new local government mandates (Fino 2003). This later provision has resulted in continuing litigation over funding of special education programs (Ballard, et al. 2004).
Proposal A, passed in 1994, further limits property taxes by capping the increase in assessments on each individual parcel to the rate of inflation. This is similar to Proposition 13 in California. Proposal A also requires a three-fourths vote of the legislature to increase the property tax levies used by local school districts. This provision moves control from the local to the state level. While local taxes decreased, state taxes increased as a result of Proposal A. The progression of these TELs is represented in Figure 1. At the state level in Michigan, there
are continuing accounting questions on how revenues are classified and which are subject to the state revenue limit. The Supreme Court has had to define almost every aspect of the amendment. Revenues that are less than 1 percent over the limit may be transferred to the rainy day fund. If excess revenues are more than one percentage point over the limit they must be returned to payers of the state income tax or the single business tax (Fino 2003). California Proposition 13 was passed by California voters in 1978. Proposition 13 was preceded by several property tax limitations and school tax revenues had already been capped in 1972 (Stark and J. Zasloff 2003). The proposition limits the property tax rate to 1 percent and limits increases in assessments to 2 percent or the rate of inflation, whichever is less, unless the property has been improved. When property changes hands, the assessment may be brought up to market value. At the time of implementation, assessed values were rolled back two years. Voter override is not allowed for operating purposes. The measure also extends to some other local revenues and requires a two-thirds majority vote for new “special taxes” (Sokolow 2000).
Figure 1: Michigan TEL Index
0
10
20
30
40
1969 1973 1977 1981 1985 1989 1993 1997 2001 2005
State TEL Index Local TEL Index

10
In addition Proposition 13 gave the state government complete control over property tax rates and the authority to allocate local property tax revenues in order to equalize school funding. It thus eroded local control according to many observers. Local budgeting became a process little understood by either citizens or local officials. Local governments began competing for the local sales tax base. Local governments subsequently turned to greater reliance on local sales taxes and user fees (Douglas 2003). In 1996 voters passed proposition 218, which limits local governments’ use of service charges and assessments
(Sokolow 2000). How these limits are measured over time for our TEL Index is presented in Figure 2. Massachusetts Proposition 2½ was passed by referendum in Massachusetts in 1980. Local property taxes were capped at 2.5 percent of real property value, a tax break of $550 million--$347 million in property taxes and $200 million in car excise taxes. Cities and towns above the limit were given three years to cut their rates (Mullins 2004). Nominal annual growth in property tax revenues is limited to 2.5%, unless a vote of the residents allows a greater increase. Proposition 2½ has been amended several times. In 1981 the legislature allowed property taxes on new construction to be added to the allowed annual 2.5 percent increase in assessments. Originally a two-thirds majority vote was required to increase the 2.5 percent limit. This was reduced to a majority vote. To clarify, citizens may vote to allow the assessments to increase by more than 2.5 percent, but property taxes cannot exceed 2.5 percent of market value (Mullins 2004). In 1986 a cap on state revenues was approved. Growth in revenues was capped at the rate of growth in wages and salaries. Excess revenues, up to five percent of state revenues, are directed to a rainy day fund and additional revenues
are returned to taxpayers (Bradbury, Mayer and Case 2001). To make up for the anticipated (and actual) loss in revenues, many localities that had resisted assessing at full market value, reassessed. Municipalities also increased their reliance on fees. At the same time, public school enrollments dropped, somewhat easing the constraints on schools. While the state originally increased aid to local governments, when Massachusetts went into recession in the early 1990s, state aid was cut 30 percent in two years. During the recovery state aid rose, but fell again in the recession of 2002
(Mullins 2004). When investigating the impacts of Proposition 2½ Bradbury, Mayer and Case (2001 p.289) found that “…house prices performed worse in communities that had slower increases in
Figure 2: California TEL Index
0
10
20
30
40
1969
1972
1975
1978
1981
1984
1987
1990
1993
1996
1999
2002
2005
State TEL Index Local TEL Index
Figure 3: Massachusetts TEL Index
0
5
10
15
1969
1972
1975
1978
1981
1984
1987
1990
1993
1996
1999
2002
2005
State TEL Index Local TEL Index

11
spending, suggesting that Proposition 2 ½ led communities to spend ‘too little’ on services.” The progression of the TEL in Massachusetts can be quantified and tracked as in Figure 3. Colorado Colorado has a history of increasing restrictions on public budgets. In 1977, growth in Colorado's general fund spending was limited to seven percent over the prior year's spending. Excess revenue was allocated first to a reserve fund and then to property tax relief. This spending limit was amended in 1991 (the Arveschoug-Bird provision) to limit annual appropriations to the lesser of five percent of Colorado personal income or six percent over the prior year's general fund appropriations (McGuire and Rueben 2006). The Taxpayer’s Bill of Rights (TABOR) passed in 1992 imposed additional constraints: 1) any new tax or tax rate increase must be approved by voters; 2) revenue collections are tied to the collections of the previous year plus the growth in population and the inflation rate (local governments can include new construction); 3) spending is limited to a percentage growth (based on the Arveshoug-Bird provision above) and 4) taxation options such as new tax structures like local income tax and state property tax, among others are also limited (Bell Policy Center 2003). Excess revenues of up to three percent of the general fund are allowed for reserves. Their use, however, must be repaid in the following fiscal year. This provision effectively means that the reserves are less of a rainy day fund and more of a cash-flow reserve (National Council of State Legislators 2006). The rapid repayment provision makes the use of a reserve fund difficult during a recession because there is no assurance that recovery would be sufficient to repay the fund in the next fiscal year. The mandated refund of surpluses went predominantly to the highest income taxpayers; the maximum refund allowed for low income individuals and families was $388 due to the structure of the earned income tax credit from
federal income tax law. Taxpayers reporting annual income less than $26,000 received an average refund of $256 while the average refund for those reporting annual income of more than $126,000 received $1,630 (Bell Policy Center 2003). In 2000 voters passed Amendment 23, which earmarked revenue equal to one-third of 1 percent of Colorado taxable income for a State Education Fund. In general, the interaction between Amendment 23 and TABOR resulted in more required spending on education and less revenue for other categories of spending. As a result of severe state budget constraints
imposed by TABOR, in November, 2005, voters approved Referendum C. Referendum C suspends the TABOR revenue limit for five years (excess revenues do not need to be returned to taxpayers) and changes the growth factor to apply to the prior year's limit on revenue growth rather than actual revenue collected in the prior year (McGuire and Rueben 2006). Our quantitative representation of Colorado’s TABOR is presented in Figure 4. Conclusions The primary objective has been the creation of an index of tax and expenditure limitation (TEL) strength. The heterogeneity of TELs has made systematic analysis of the impact of TELs on state and local government fiscal policies and level of services, economic performance and fiscal health of governments
Figure 4: Colorado TEL Index
0
10
20
30
40
1969
1972
1975
1978
1981
1984
1987
1990
1993
1996
1999
2002
2005
State TEL Index Local TEL Index

12
almost impossible. Most studies have either taken a case-study approach of examining a single state or have treated TELs in a naïve manner (e.g., simple dummy variables). The construction of an index in the spirit of Poulson (2005) allows for a more systematic examination of the impact of TELs. By building an annual index over a long time-frame we can also account for lags in how governments are able to respond to the imposition of change in a TEL. While we have tried to be objective in how we constructed our index in terms of the characteristics of the TEL to consider along with weighting scheme, there are numerous normative judgment calls. For example, should a TEL placed in a state’s constitution have a weight of one, two, three or ten? By making the core data set that we have constructed available to researchers we hope that others can experiment with alternative weighting schemes. We are convinced that if we are to fully understand the impacts of TELs we must be able to systematically look across all the 50 states. The construction of indices, such as the ones reported in this study, we believe, move us one step closer to better understanding the impact of TELs. References Cutler, D.M., et al. (1999). “Restraining the Leviathan: Property Tax Limitations in Massachusetts.” 71 Journal of Public Economics. 71:313-327.
Deller, S.C. and J. Stallmann, Judith. (2007). “Tax and Expenditure Limitations and Economic Growth.” Marquette Law Review. 90(3):497-554.
Fino, S.P., (2003) “A Cure Worse than the Disease? Taxation and Finance Provisions in State Constitutions,” Rutgers Law Journal, 34, pp.959 Joyce, P.G. and D. R. Mullins, (1991). “The Changing Fiscal Structure of the State and Local Public,” Public Administration Review, 51(3), pp. 240-253. Kornhauser, M. E., (2002”. “Legitimacy and the Right of Revolution: The Role of Tax Protests and Anti-Tax Rhetoric in America. Buffalo Law Review. 50(Fall): Mason, K.C. (2005). “Panel’s Report: Tax Limitations Jeopardize State’s Economic Future.” State Tax Notes. Aug. 15: 487- 488 McGuire, T.J. and K.S. Rueben. (2006) “The Colorado Revenue Limit: The Economic Effects of TABOR.” State Tax Notes, May 8, 2006 at 459. Mullins. D.R. (2004). “Tax and Expenditure Limitation and the Fiscal Response of Local Government: Asymmetric Intra-Local Fiscal Effects”, Public Budgeting and Finance, Winter, pp. 111-147. Mullins, Daniel R. (1995). Tax Expenditure Limits on Local Governments. Center for Urban Policy and the Environment, Indianapolis Advisory Commission on Intergovernmental Relations. Washington, DC : Advisory Commission on Intergovernmental Relations, Mullins, D.R. and B.A. Wallin, (2004) “Tax and Expenditure Limitations: Introduction and Overview,” Public Budgeting and Finance, Winter, pp.2-15. National Conference of State Legislatures http://www.ncsl.org/programs/fiscal/tels2005.htm Poterba, J.M. and K.S. Rueben, Fiscal Rules and State Borrowing Costs: Evidence from California and Other States, Public Policy Institute of California: San Francisco, CA, 1999.

13
Poulson, B. (2005). Grading the States’ Tax and Expenditure Limits: A Fiscal Discipline Report Card. Americans for Prosperity Foundation. June. Pp. 15. http://www.americansforprosperity.org/includes/filemanager/files/pdf/afp_telrank_0705.pdf Skidmore, M. (1999). “Tax and Expenditure Limitations and the Fiscal Relationships between State and Local Governments.” Public Choice 99(1-2) Pg. 77. Sokolow, A.D., (2000). “The Changing Property Tax in the West: State Centralization of Local Finances.” Public Budgeting and Finance. Spring 2004. Pg. 85-104. Stallmann, J.I. and S.C. Deller. (forthcoming) “Impact of State and Local Tax and Expenditure Limits on Economic Growth.” Applied Economic Letters. (forthcoming) Waisanen, B., (2007) “State Tax and Expenditure Limits –2007.” National Conference of State Legislatures. http://www.ncls.org/programs/ fiscal/telsabout.htm
14
Table 1: Types and Classification of Tax and Expenditure Limits (TELs).
Overall Property Tax Rate Limitations: Limits on property tax rates are the most common form of TEL. These limits is on overall property tax rates and often sets a ceiling that the rate can not exceed without a vote of local citizens. These limits can be circumvented through alterations in assessment practices. If the rates limits are matched with limits on assessment increases, this TEL is potentially binding.
General Revenue or Expenditure Increases: This type of TEL limits the amount that revenues and/or expenditures can increase from the previous year. Often tied to inflation rates or population growth rates, these types of TEL are the most binding for governments.
Specific Property Tax Rate Limitations: Same for overall property tax rate limitations but targeted to specific units of government (e.g., school districts, counties) or narrowly defined service areas. These can be circumvented through changes in assessment practices or in the case of specific services through interfund transfers. As with overall property tax rate limits, if the limit is matched with limits on assessments, this TEL is potentially binding.
Limits on Assessment Increases: Since the property tax collected is a function of assessed property values, coupled with the tax rate, this TEL limits the rate at which the assessed value of properties can be increased. If there are no limits on the property tax rate governments dependent on the property tax can bypass this TEL by simply raising the property tax rate. If this TEL is coupled with limits on the property tax rate, the overall effect can be binding on governments.
Property Tax Levy Limits: This TEL limits the amount of revenue that can be generated through the property tax independent of the property tax rate. These limits often allow for a specific percent increase from one year to the next. The fixed nature of this TEL makes it difficult to circumvent, accept for a diversification away from the property tax, for example, by increasing fees, charges and sales taxes.
Full Disclosure -- Truth in Taxation: These types of TEL generally require some type of public discussions and specific legislative vote prior to enactment of tax rates or levy increases. These types of TEL generally are not binding and requires a simple vote of the local legislative body to increase taxes.
Source: Joyce and Mullins (1991).
15
Table 2: State Tax and Expenditure Limits 2005
State Year Adopted
Initiative or Referendum
Legislative Supermajority Vote Required
Applies To…
Arizona 1992 I 3-Feb All taxes
Arkansas 1934 R 4-MarAll taxes except sales and alcohol
California 1979 I 3-Feb All taxes
Colorado 1992 I 3-Feb All taxes 1
Delaware 1980 R 5-Mar All taxes
Florida 1971 R 5-MarCorporate income tax 2
Kentucky 2000 R 5-Mar All taxes 3
Louisiana 1966 R 3-Feb All taxes
Michigan 1994 R 4-Mar State property tax
Mississippi 1970 R 5-Mar All taxes
Missouri 1996 R 3-Feb All taxes 4
Nevada 1996 I 3-Feb All taxes
Oklahoma 1992 I 4-Mar All taxes
Oregon 1996 R 5-Mar All taxes
South Dakota 1996 R 3-Feb All taxes
Washington 1993 I 3-Feb All taxes
Source: National Conference of State Legislatures http://www.ncsl.org/programs/fiscal/tels2005.htm
Legislative Supermajority to Raise Taxes--2005
16
State Year Adopted
Constitution or Statute Type of Limit Main Features of the Limit
Alaska 1982 Constitution Spending A cap on appropriations grows yearly by the increase in population and inflation.
Arizona 1978 Constitution Spending Appropriations cannot be more than 7.41% of total state personal income.
California 1979 Constitution Spending Annual appropriations growth linked to population growth and per capita personal income growth.
Colorado 1991 Statute SpendingGeneral fund appropriations limited to the lesser of a) 5% of total state personal income or b) 6% over the previous year's appropriation.
1992 Constitution Revenue & Spending
Most revenues limited to population growth plus inflation. Changes to spending limits or tax increases must receive voter approval.
Connecticut 1991 Statute SpendingSpending limited to average of growth in personal income for previous five years or previous year's increase in inflation, whichever is greater.
1992 Constitution SpendingVoters approved a limit similar to the statutory one in 1992, but it has not received the three-fifths vote in the legislature needed to take effect.
Delaware 1978 ConstitutionAppropriations to Revenue Estimate
Appropriations limited to 98% of revenue estimate.
Florida 1994 Constitution Revenue Revenue limited to the average growth rate in state personal income for previous five years.
Hawaii 1978 Constitution SpendingGeneral fund spending must be less than the average growth in personal income in previous three years.
Idaho 1980 Statute Spending
General fund appropriations cannot exceed 5.33% of total state personal income, as estimated by the State Tax Commission. One-time expenditures are exempt.
Indiana 2002 Statute Spending State spending cap per fiscal year with growth set according to formula for each biennial period.
Iowa 1992 Statute Appropriations Appropriations limited to 99% of the adjusted revenue estimate.
Louisiana 1993 Constitution Spending Expenditures limited to 1992 appropriations plus annual growth in state per capita personal income.
Maine 2005 Statute SpendingExpenditure growth limited to a 10-year average of personal income growth, or maximum of 2.75%. Formulas are based on state's tax burden ranking.
Massachusetts 1986 Statute Revenue
Revenue cannot exceed the three-year average growth in state wages and salaries. The limit was amended in 2002 adding definitions for a limit that would be tied to inflation in government purchasing plus 2 percent.
Source: National Conference of State Legislatures http://www.ncsl.org/programs/fiscal/tels2005.htm
Table 2: State Tax and Expenditure Limits 2005 (cont.)
17
State Year Adopted
Constitution or Statute Type of Limit Main Features of the Limit
Michigan 1978 Constitution Revenue Revenue limited to 1% over 9.49% of the previous year's state personal income.
Mississippi 1982 Statute AppropriationsAppropriations limited to 98% of projected revenue. The statutory limit can be amended by majority vote of legislature.
Missouri 1980 Constitution Revenue Revenue limited to 5.64% of previous year's total state personal income.
Missouri, continued 1996 Constitution Revenue
Voter approval required for tax hikes over approximately $77 million or 1% of state revenues, whichever is less.
Montana 1981 Statute Spending Spending is limited to a growth index based on state personal income.
Nevada 1979 Statute Spending Proposed expenditures are limited to the biennial percentage growth in state population and inflation.
New Jersey 1990 Statute Spending Expenditures are limited to the growth in state personal income.
North Carolina 1991 Statute Spending Spending is limited to 7% or less of total state personal income.
Oklahoma 1985 Constitution Spending Expenditures are limited to 12% annual growth adjusted for inflation.
1985 Constitution Appropriations Appropriations are limited to 95% of certified revenue.
Oregon 2000 Constitution Revenue Any general fund revenue in excess of 2% of the revenue estimate must be refunded to taxpayers.
2001 Statute Spending Appropriations growth limited to 8% of projected personal income for biennium.
Rhode Island 1992 Constitution Appropriations Appropriations limited to 98% of projected revenue.
1980
1984
Tennessee 1978 Constitution Spending Appropriations limited to the growth in state personal income.
Source: National Conference of State Legislatures http://www.ncsl.org/programs/fiscal/tels2005.htm
South Carolina Constitution Spending
Spending growth is limited by either the average growth in personal income or 9.5% of total state personal income for the previous year, whichever is greater. The number of state employees is limited to a ratio of state population.
Table 2: State Tax and Expenditure Limits 2005 (cont.)
18
State Year Adopted
Constitution or Statute Type of Limit Main Features of the Limit
Texas 1978 Constitution Spending Biennial appropriations limited to the growth in state personal income.
Utah 1989 Statute Spending Spending growth is limited by formula that includes growth in population, and inflation.
Washington 1993 Statute Spending Spending limited to average of inflation for previous three years plus population growth.
Wisconsin 2001 Statute Spending Spending limit on qualified appropriations (some exclusions) limited to personal income growth rate.
Source: National Conference of State Legislatures http://www.ncsl.org/programs/fiscal/tels2005.htm
Table 2: State Tax and Expenditure Limits 2005 (cont.)

19
BLANK PAGE
20
Table 3: TEL Currently Imposed on Local Governments (Original Year of Imposition/Amendment)
Overall Property Tax Rate Limit Specific Property Tax Rate Limit Property Tax Revenue Limit Assessment Increase Limit General Revenue Limit General Expenditure Limit Full Disclosure
Alabama 1972/78 CMS 1875 CM 1916 SAlaska 1972 M 1972 MArizona 1980 CMS 1913/80 CM 1980 CMS 1921/80 CM 1974/81 SArkansas 1883 CM 1981 CMS 2000 CMSCalifornia 1978/86 CMS 1997 CMS 1978 CMS 1972 S 1979/90 CMSColorado 1992 CMS 1913 CM 1992 S 1992 CMS 1992 CMS 1983 CM 1992 SConnecticut (none)Delaware 1972 C 1976 CFlorida 1968 CM 1855/68/73 S 1995 CMS 1974/80 CMSGeorgia c.1890/82(r) C 1945 S 1991 CMSHawaii 1977 CIdaho 1978 CMS 1913 C 1967 M 1963 S 1979/92(r) CMS 1991 CMSIlinois 1939 C 1961 MS 1991 CMS 1981 CMSIndiana 1973/77/80 CMSIowa n.a./83 C 1972/92 M 1989 S 1978/80 CMS 1971 S 1983 CKansas 1933/89(s) CMS 1970/89(s) CM 1973 SKentucky 1908 C 1908/85 M 1946 S 1979 CMS 1979 CMSLouisiana 1974 CMS 1978 CMSMaine (none)Maryland 1957/91 CMS 1977 CMMassachusetts 1980/91 M 1980/83 MMichigan 1933 CS 1949 M 1994 S 1978 CMS 1994 CMS 1982 CMSMinnesota 1971/93(r) CM 1985 CMSMississippi 1980 CM 1983/09 SMissouri 1875 CMS 1980 CMSSource: Mullins and Wallin (2004)C = County; M = Municipality; S = School District(r) Repealed effect year specified(s) Suspended effective year specified
21
Table 3: TEL Currently Imposed on Local Governments (Original Year of Imposition/Amendment) (cont.)
Overall Property Tax Rate Limit Specific Property Tax Rate Limit Property Tax Revenue Limit Assessment Increase Limit General Revenue Limit General Expenditure Limit Full Disclosure
Montana 1931/87 C n.a./65 M 1971 S 1987 CM 1974 CMSNebraska 1903 C 1957 M 1921/99 S 1990 CM 1996 CM 1991/96 S 1990 CMNevada 1936 CMS 1929 MS 1983 C 1983/87 M 1984/89(r) CM 1985 CMSNew Hampshire (none)New Jersey 1980 C 1976/91 M 1976/90 SNew Mexico 1914 CMS 1973/87 CMS 1979 CMS 1979/00 CMSNew York 1894 CMS 1981 C 1986 MNorth Carolina 1973 CMNorth Dakota 1929 CMS 1981 CMOhio 1929/34/53 CMS 1976 CMSOklahoma 1933 CMA 1996 CMSOregon 1991 CMS 1997 CM 1991/97 SPennsylvania 1959 CMS c.1940 CRhode Island 1985 M 1979 MSouth Carolina 1975 CMSSouth Dakota 1915 CMSTennessee 1979 CMTexas 1876 CM 1888 S 1982 CMS 1982 CMSUtah 1898/61 C 1929 M 1929/88 S 1969/86(r) CMS 1986 CMSVermont (none)Virginia 1976 CMWashington 1944/73 CMS 1973 CM 1971/79/01 CM 1979/01 S 2000 CMS 1990 CMSWest Virginia 1939 CMS 1939 CMS 1990 CMSWisconsin 1994 C 1994 SWyoming 1890 CM 1911 SSource: Mullins and Wallin (2004)C = County; M = Municipality; S = School District(r) Repealed effect year specified(s) Suspended effective year specified
22
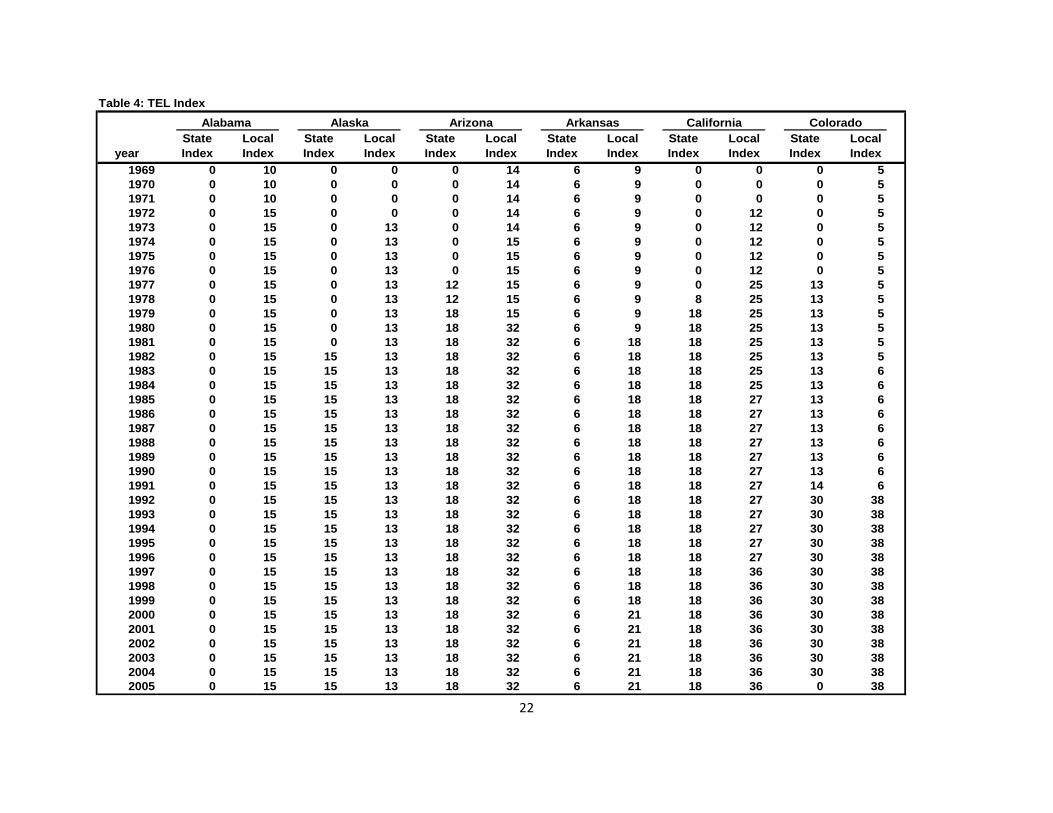
Table 4: TEL IndexAlabama Alaska Arizona Arkansas California Colorado
yearState Index
Local Index
State Index
Local Index
State Index
Local Index
State Index
Local Index
State Index
Local Index
State Index
Local Index
1969 0 10 0 0 0 14 6 9 0 0 0 51970 0 10 0 0 0 14 6 9 0 0 0 51971 0 10 0 0 0 14 6 9 0 0 0 51972 0 15 0 0 0 14 6 9 0 12 0 51973 0 15 0 13 0 14 6 9 0 12 0 51974 0 15 0 13 0 15 6 9 0 12 0 51975 0 15 0 13 0 15 6 9 0 12 0 51976 0 15 0 13 0 15 6 9 0 12 0 51977 0 15 0 13 12 15 6 9 0 25 13 51978 0 15 0 13 12 15 6 9 8 25 13 51979 0 15 0 13 18 15 6 9 18 25 13 51980 0 15 0 13 18 32 6 9 18 25 13 51981 0 15 0 13 18 32 6 18 18 25 13 51982 0 15 15 13 18 32 6 18 18 25 13 51983 0 15 15 13 18 32 6 18 18 25 13 61984 0 15 15 13 18 32 6 18 18 25 13 61985 0 15 15 13 18 32 6 18 18 27 13 61986 0 15 15 13 18 32 6 18 18 27 13 61987 0 15 15 13 18 32 6 18 18 27 13 61988 0 15 15 13 18 32 6 18 18 27 13 61989 0 15 15 13 18 32 6 18 18 27 13 61990 0 15 15 13 18 32 6 18 18 27 13 61991 0 15 15 13 18 32 6 18 18 27 14 61992 0 15 15 13 18 32 6 18 18 27 30 381993 0 15 15 13 18 32 6 18 18 27 30 381994 0 15 15 13 18 32 6 18 18 27 30 381995 0 15 15 13 18 32 6 18 18 27 30 381996 0 15 15 13 18 32 6 18 18 27 30 381997 0 15 15 13 18 32 6 18 18 36 30 381998 0 15 15 13 18 32 6 18 18 36 30 381999 0 15 15 13 18 32 6 18 18 36 30 382000 0 15 15 13 18 32 6 21 18 36 30 382001 0 15 15 13 18 32 6 21 18 36 30 382002 0 15 15 13 18 32 6 21 18 36 30 382003 0 15 15 13 18 32 6 21 18 36 30 382004 0 15 15 13 18 32 6 21 18 36 30 382005 0 15 15 13 18 32 6 21 18 36 0 38

23
Table 4: TEL Index (cont.)Connecticut Delaware Florida Georgia Hawaii Idaho
yearState Index
Local Index
State Index
Local Index
State Index
Local Index
State Index
Local Index
State Index
Local Index
State Index
Local Index
1969 0 0 0 0 0 9 0 8 0 0 0 51970 0 0 0 0 0 9 0 8 0 0 0 51971 0 0 0 0 0 9 0 8 0 0 0 51972 0 0 0 8 0 9 0 8 0 0 0 51973 0 0 0 8 0 9 0 8 0 0 0 51974 0 0 0 8 0 13 0 8 0 0 0 51975 0 0 0 8 0 13 0 8 0 0 0 51976 0 0 0 9 0 13 0 8 0 0 0 51977 0 0 0 9 0 13 0 8 0 2 0 51978 0 0 12 9 0 13 0 8 13 2 0 121979 0 0 12 9 0 13 0 8 13 2 0 241980 0 0 12 9 0 13 0 8 13 2 7 241981 0 0 12 9 0 13 0 8 13 2 7 241982 0 0 12 9 0 13 0 8 13 2 7 241983 0 0 12 9 0 13 0 7 13 2 7 241984 0 0 12 9 0 13 0 7 13 2 7 241985 0 0 12 9 0 13 0 7 13 2 7 241986 0 0 12 9 0 13 0 7 13 2 7 241987 0 0 12 9 0 13 0 7 13 2 7 241988 0 0 12 9 0 13 0 7 13 2 7 241989 0 0 12 9 0 13 0 7 13 2 7 241990 0 0 12 9 0 13 0 7 13 2 7 241991 0 0 12 9 0 13 0 11 13 2 7 281992 12 0 12 9 0 13 0 11 13 2 7 161993 12 0 12 9 0 13 0 11 13 2 7 161994 12 0 12 9 17 13 0 11 13 2 7 161995 12 0 12 9 17 22 0 11 13 2 7 161996 12 0 12 9 25 22 0 11 13 2 7 161997 12 0 12 9 25 22 0 11 13 2 7 161998 12 0 12 9 25 22 0 11 13 2 7 161999 12 0 12 9 25 22 0 11 13 2 7 162000 12 0 12 9 25 22 0 11 13 2 7 162001 12 0 12 9 25 22 0 11 13 2 7 162002 12 0 12 9 25 22 0 11 13 2 7 162003 12 0 12 9 25 22 0 11 13 2 7 162004 12 0 12 9 25 22 0 11 13 2 7 162005 12 0 12 9 25 22 0 11 13 2 7 16

24
Table 4: TEL Index (cont.)Ilinois Indiana Iowa Kansas Kentucky Louisiana
yearState Index
Local Index
State Index
Local Index
State Index
Local Index
State Index
Local Index
State Index
Local Index
State Index
Local Index
1969 0 6 0 0 0 0 0 9 0 11 0 01970 0 6 0 0 0 5 0 17 0 11 0 01971 0 6 0 0 0 8 0 17 0 11 0 01972 0 6 0 0 0 9 0 17 0 11 0 01973 0 6 0 12 0 9 0 15 0 11 0 01974 0 6 0 12 0 9 0 15 0 11 0 91975 0 6 0 12 0 9 0 15 0 11 0 91976 0 6 0 12 0 9 0 15 0 11 0 91977 0 6 0 10 0 9 0 15 0 11 0 91978 0 6 0 10 0 16 0 15 0 11 0 191979 0 6 0 10 0 16 0 15 0 25 8 191980 0 6 0 9 0 16 0 15 0 25 8 191981 0 10 0 9 0 16 0 15 0 25 8 191982 0 10 0 9 0 16 0 15 0 25 8 191983 0 10 0 9 0 18 0 15 0 25 8 191984 0 10 0 9 0 18 0 15 0 25 8 191985 0 10 0 9 0 18 0 15 0 26 8 191986 0 10 0 9 0 18 0 15 0 26 8 191987 0 10 0 9 0 18 0 15 0 26 8 191988 0 10 0 9 0 18 0 15 0 26 8 191989 0 10 0 9 0 19 0 8 0 26 8 191990 0 10 0 9 0 19 0 8 0 26 8 191991 0 20 0 9 0 19 0 8 0 26 8 191992 0 20 0 9 4 19 0 8 0 26 8 191993 0 20 0 9 4 19 0 8 0 26 22 191994 0 20 0 9 4 19 0 8 0 26 22 191995 0 20 0 9 4 19 0 8 0 26 22 191996 0 20 0 9 4 19 0 8 0 26 23 191997 0 20 0 9 4 19 0 8 0 26 23 191998 0 20 0 9 4 19 0 8 0 26 23 191999 0 20 0 9 4 19 0 8 0 26 23 192000 0 20 0 9 4 19 0 8 0 26 23 192001 0 20 0 9 4 19 0 8 0 26 23 192002 0 20 10 9 4 19 0 8 0 26 23 192003 0 20 10 9 4 19 0 8 0 26 23 192004 0 20 10 9 4 19 0 8 0 26 23 192005 0 20 10 9 4 19 0 8 0 26 23 19
25
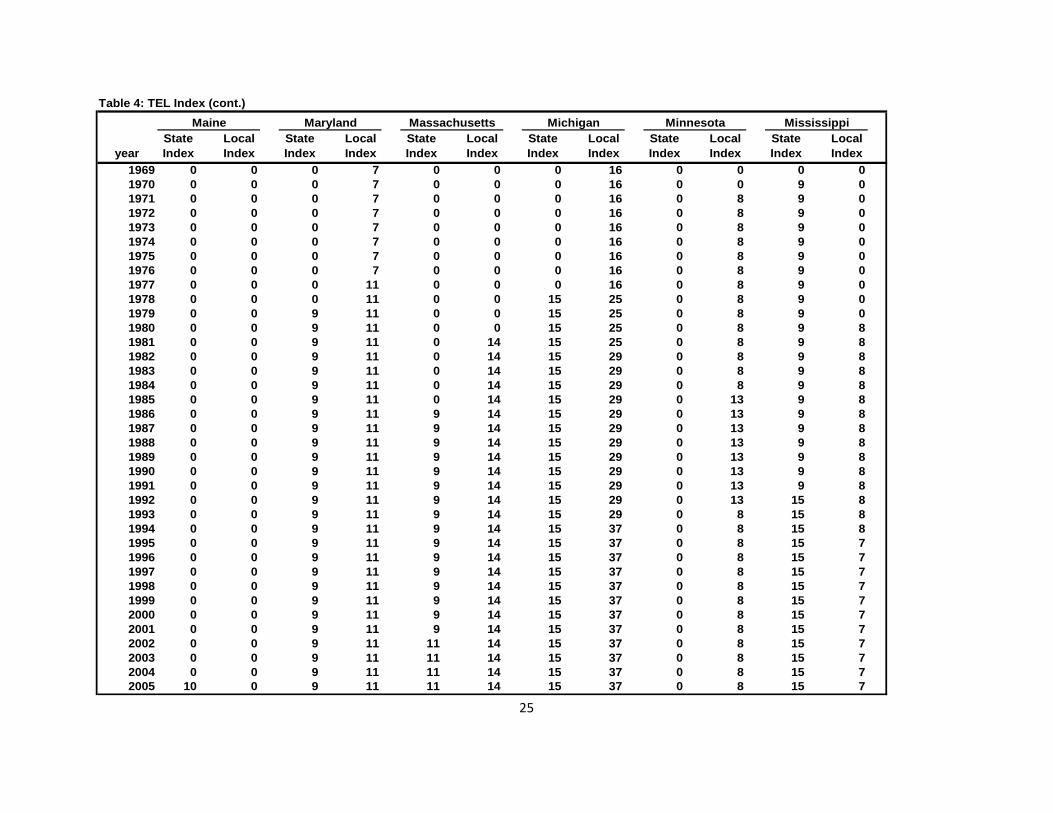
Table 4: TEL Index (cont.)Maine Maryland Massachusetts Michigan Minnesota Mississippi
yearState Index
Local Index
State Index
Local Index
State Index
Local Index
State Index
Local Index
State Index
Local Index
State Index
Local Index
1969 0 0 0 7 0 0 0 16 0 0 0 01970 0 0 0 7 0 0 0 16 0 0 9 01971 0 0 0 7 0 0 0 16 0 8 9 01972 0 0 0 7 0 0 0 16 0 8 9 01973 0 0 0 7 0 0 0 16 0 8 9 01974 0 0 0 7 0 0 0 16 0 8 9 01975 0 0 0 7 0 0 0 16 0 8 9 01976 0 0 0 7 0 0 0 16 0 8 9 01977 0 0 0 11 0 0 0 16 0 8 9 01978 0 0 0 11 0 0 15 25 0 8 9 01979 0 0 9 11 0 0 15 25 0 8 9 01980 0 0 9 11 0 0 15 25 0 8 9 81981 0 0 9 11 0 14 15 25 0 8 9 81982 0 0 9 11 0 14 15 29 0 8 9 81983 0 0 9 11 0 14 15 29 0 8 9 81984 0 0 9 11 0 14 15 29 0 8 9 81985 0 0 9 11 0 14 15 29 0 13 9 81986 0 0 9 11 9 14 15 29 0 13 9 81987 0 0 9 11 9 14 15 29 0 13 9 81988 0 0 9 11 9 14 15 29 0 13 9 81989 0 0 9 11 9 14 15 29 0 13 9 81990 0 0 9 11 9 14 15 29 0 13 9 81991 0 0 9 11 9 14 15 29 0 13 9 81992 0 0 9 11 9 14 15 29 0 13 15 81993 0 0 9 11 9 14 15 29 0 8 15 81994 0 0 9 11 9 14 15 37 0 8 15 81995 0 0 9 11 9 14 15 37 0 8 15 71996 0 0 9 11 9 14 15 37 0 8 15 71997 0 0 9 11 9 14 15 37 0 8 15 71998 0 0 9 11 9 14 15 37 0 8 15 71999 0 0 9 11 9 14 15 37 0 8 15 72000 0 0 9 11 9 14 15 37 0 8 15 72001 0 0 9 11 9 14 15 37 0 8 15 72002 0 0 9 11 11 14 15 37 0 8 15 72003 0 0 9 11 11 14 15 37 0 8 15 72004 0 0 9 11 11 14 15 37 0 8 15 72005 10 0 9 11 11 14 15 37 0 8 15 7

26
Table 4: TEL Index (cont.)Missouri Montana Nebraska Nevada New Hampshire New Jersey
yearState Index
Local Index
State Index
Local Index
State Index
Local Index
State Index
Local Index
State Index
Local Index
State Index
Local Index
1969 0 9 0 8 0 9 0 20 0 0 0 01970 0 9 0 8 0 9 0 20 0 0 0 01971 0 9 0 9 0 9 0 20 0 0 0 01972 0 9 0 9 0 9 0 20 0 0 0 01973 0 9 0 9 0 9 0 20 0 0 0 01974 0 9 0 13 0 9 0 20 0 0 0 01975 0 9 0 13 0 9 0 20 0 0 0 01976 0 9 0 13 0 9 0 20 0 0 9 61977 0 9 0 13 0 9 0 20 0 0 9 61978 0 9 0 13 0 9 0 20 0 0 9 61979 0 9 0 13 0 9 12 20 0 0 9 61980 18 20 0 13 0 9 12 20 0 0 9 91981 18 20 13 13 0 9 12 20 0 0 9 91982 18 20 13 13 0 9 12 20 0 0 9 91983 18 20 13 13 0 9 12 29 0 0 9 91984 18 20 13 13 0 9 12 34 0 0 0 91985 18 20 13 13 0 9 12 38 0 0 0 91986 18 20 13 13 0 9 12 38 0 0 0 91987 18 20 13 20 0 9 12 37 0 0 0 91988 18 20 13 20 0 9 12 37 0 0 0 91989 18 20 13 20 0 9 12 29 0 0 0 91990 18 20 13 20 0 20 12 29 0 0 5 111991 18 20 13 20 0 28 12 29 0 0 5 111992 18 20 13 20 0 28 12 29 0 0 5 111993 18 20 13 20 0 28 12 29 0 0 5 111994 18 20 13 20 0 28 12 29 0 0 5 111995 18 20 13 20 0 28 12 29 0 0 5 111996 22 20 13 20 0 30 20 29 0 0 5 111997 22 20 13 20 0 30 20 29 0 0 5 111998 22 20 19 20 0 30 20 29 0 0 5 111999 22 20 19 20 0 30 20 29 0 0 5 112000 22 20 19 20 0 30 20 29 0 0 5 112001 22 20 19 20 0 30 20 29 0 0 5 112002 22 20 19 20 0 30 20 29 0 0 5 112003 22 20 19 20 0 30 20 29 0 0 5 112004 22 20 19 20 0 30 20 29 0 0 5 112005 22 20 13 20 0 30 20 29 0 0 5 11

27
Table 4: TEL Index (cont.)New Mexico New York North Carolina North Dakota Ohio Oklahoma
yearState Index
Local Index
State Index
Local Index
State Index
Local Index
State Index
Local Index
State Index
Local Index
State Index
Local Index
1969 0 10 0 15 0 0 0 7 0 11 0 111970 0 10 0 15 0 0 0 7 0 11 0 111971 0 10 0 15 0 0 0 7 0 11 0 111972 0 10 0 15 0 0 0 7 0 11 0 111973 0 18 0 15 0 7 0 7 0 11 0 111974 0 18 0 15 0 7 0 7 0 11 0 111975 0 18 0 15 0 7 0 7 0 11 0 111976 0 18 0 15 0 7 0 7 0 11 0 111977 0 18 0 15 0 7 0 7 0 21 0 111978 0 18 0 15 0 7 0 7 0 21 0 111979 0 34 0 15 0 7 0 7 0 21 0 111980 0 34 0 15 0 7 0 7 0 21 0 111981 0 34 0 16 0 7 0 15 0 21 0 111982 0 34 0 16 0 7 0 15 0 21 0 111983 0 34 0 16 0 7 0 16 0 21 0 111984 0 34 0 16 0 7 0 16 0 21 0 111985 0 34 0 16 0 7 0 16 0 21 12 111986 0 34 0 17 0 7 0 16 0 21 12 111987 0 34 0 17 0 7 0 16 0 21 12 111988 0 34 0 17 0 7 0 15 0 21 12 111989 0 34 0 17 0 7 0 15 0 21 12 111990 0 34 0 17 12 7 0 15 0 21 12 111991 0 34 0 17 12 7 0 16 0 21 12 111992 0 34 0 17 12 7 0 16 0 21 18 111993 0 34 0 17 12 7 0 16 0 21 18 111994 0 34 0 17 12 7 0 16 0 21 18 111995 0 34 0 17 12 7 0 16 0 21 18 111996 0 34 0 17 12 7 0 16 0 21 18 181997 0 34 0 17 12 7 0 16 0 21 18 181998 0 34 0 17 12 7 0 16 0 21 18 181999 0 34 0 17 12 7 0 16 0 21 18 182000 0 34 0 17 12 7 0 16 0 21 18 182001 0 34 0 17 12 7 0 16 0 21 18 182002 0 34 0 17 12 7 0 16 0 21 18 182003 0 34 0 17 12 7 0 16 0 21 18 182004 0 34 0 17 12 7 0 16 0 21 18 182005 0 34 0 17 12 7 0 16 0 21 18 18
28
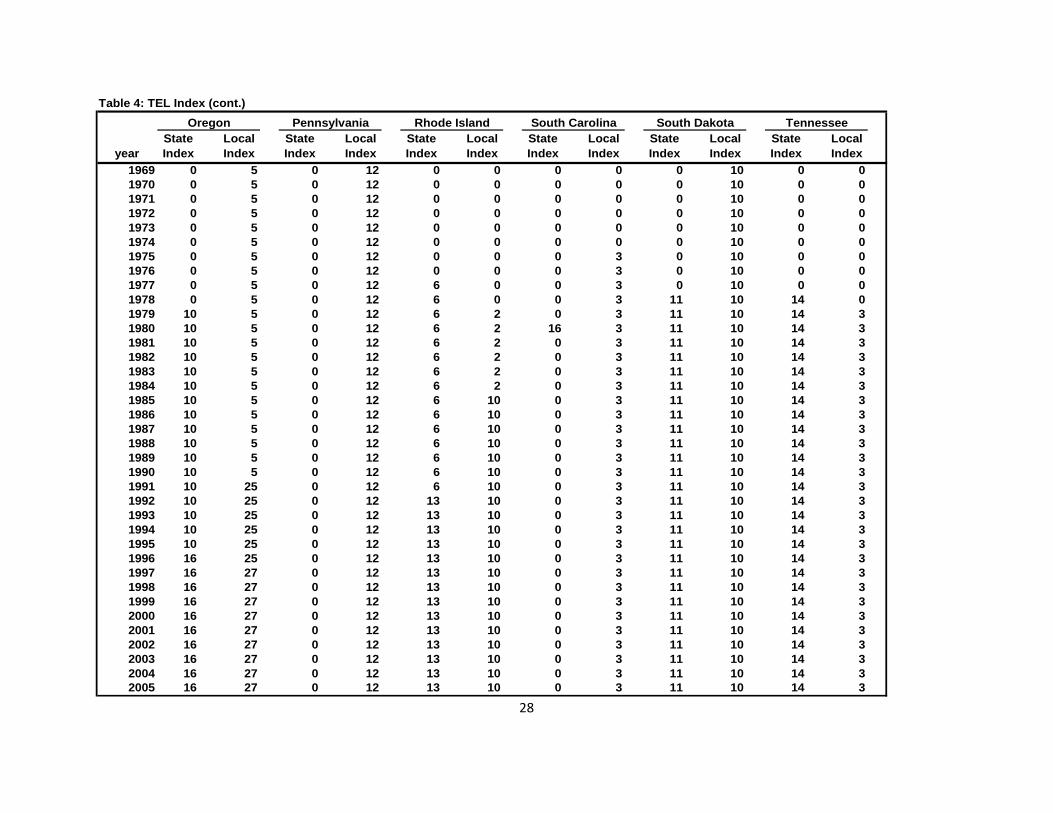
Table 4: TEL Index (cont.)Oregon Pennsylvania Rhode Island South Carolina South Dakota Tennessee
yearState Index
Local Index
State Index
Local Index
State Index
Local Index
State Index
Local Index
State Index
Local Index
State Index
Local Index
1969 0 5 0 12 0 0 0 0 0 10 0 01970 0 5 0 12 0 0 0 0 0 10 0 01971 0 5 0 12 0 0 0 0 0 10 0 01972 0 5 0 12 0 0 0 0 0 10 0 01973 0 5 0 12 0 0 0 0 0 10 0 01974 0 5 0 12 0 0 0 0 0 10 0 01975 0 5 0 12 0 0 0 3 0 10 0 01976 0 5 0 12 0 0 0 3 0 10 0 01977 0 5 0 12 6 0 0 3 0 10 0 01978 0 5 0 12 6 0 0 3 11 10 14 01979 10 5 0 12 6 2 0 3 11 10 14 31980 10 5 0 12 6 2 16 3 11 10 14 31981 10 5 0 12 6 2 0 3 11 10 14 31982 10 5 0 12 6 2 0 3 11 10 14 31983 10 5 0 12 6 2 0 3 11 10 14 31984 10 5 0 12 6 2 0 3 11 10 14 31985 10 5 0 12 6 10 0 3 11 10 14 31986 10 5 0 12 6 10 0 3 11 10 14 31987 10 5 0 12 6 10 0 3 11 10 14 31988 10 5 0 12 6 10 0 3 11 10 14 31989 10 5 0 12 6 10 0 3 11 10 14 31990 10 5 0 12 6 10 0 3 11 10 14 31991 10 25 0 12 6 10 0 3 11 10 14 31992 10 25 0 12 13 10 0 3 11 10 14 31993 10 25 0 12 13 10 0 3 11 10 14 31994 10 25 0 12 13 10 0 3 11 10 14 31995 10 25 0 12 13 10 0 3 11 10 14 31996 16 25 0 12 13 10 0 3 11 10 14 31997 16 27 0 12 13 10 0 3 11 10 14 31998 16 27 0 12 13 10 0 3 11 10 14 31999 16 27 0 12 13 10 0 3 11 10 14 32000 16 27 0 12 13 10 0 3 11 10 14 32001 16 27 0 12 13 10 0 3 11 10 14 32002 16 27 0 12 13 10 0 3 11 10 14 32003 16 27 0 12 13 10 0 3 11 10 14 32004 16 27 0 12 13 10 0 3 11 10 14 32005 16 27 0 12 13 10 0 3 11 10 14 3

29
Table 4: TEL Index (cont.)Texas Utah Vermont Virginia Washington West Virginia
yearState Index
Local Index
State Index
Local Index
State Index
Local Index
State Index
Local Index
State Index
Local Index
State Index
Local Index
1969 0 8 0 16 0 0 0 0 0 14 0 181970 0 8 0 16 0 0 0 0 0 14 0 181971 0 8 0 16 0 0 0 0 0 20 0 181972 0 8 0 16 0 0 0 0 0 20 0 181973 0 8 0 16 0 0 0 0 0 26 0 181974 0 8 0 16 0 0 0 0 0 26 0 181975 0 8 0 16 0 0 0 0 0 26 0 181976 0 8 0 16 0 0 0 1 0 26 0 181977 0 8 0 16 0 0 0 1 0 26 0 181978 14 8 0 16 0 0 0 1 0 26 0 181979 14 8 0 16 0 0 0 1 0 27 0 181980 14 8 0 16 0 0 0 1 0 27 0 181981 14 8 0 16 0 0 0 1 0 27 0 181982 14 18 0 16 0 0 0 1 0 27 0 181983 14 18 0 16 0 0 0 1 0 27 0 181984 14 18 0 16 0 0 0 1 0 27 0 181985 14 18 0 16 0 0 0 1 0 27 0 181986 14 18 0 11 0 0 0 1 0 27 0 181987 14 18 0 11 0 0 0 1 0 27 0 181988 14 18 18 11 0 0 0 1 18 27 0 181989 14 18 18 11 0 0 0 1 18 27 0 181990 14 18 18 11 0 0 0 1 18 30 0 251991 14 18 18 11 0 0 0 1 18 30 0 251992 14 18 18 11 0 0 0 1 18 30 0 251993 14 18 18 11 0 0 0 1 18 30 0 251994 14 18 18 11 0 0 0 1 18 30 0 251995 14 18 18 11 0 0 0 1 18 30 0 251996 14 18 18 11 0 0 0 1 18 30 0 251997 14 18 18 11 0 0 0 1 18 30 0 251998 14 18 18 11 0 0 0 1 18 30 0 251999 14 18 18 11 0 0 0 1 18 30 0 252000 14 18 18 11 0 0 0 1 18 37 0 252001 14 18 18 11 0 0 0 1 18 37 0 252002 14 18 18 11 0 0 0 1 18 37 0 252003 14 18 18 11 0 0 0 1 18 37 0 252004 14 18 18 11 0 0 0 1 18 37 0 252005 14 18 18 11 0 0 0 1 18 37 0 25

30
Table 4: TEL Index (cont.)Wisconsin Wyoming
yearState Index
Local Index
State Index
Local Index
1969 0 0 0 71970 0 0 0 71971 0 0 0 71972 0 0 0 71973 0 0 0 71974 0 0 0 71975 0 0 0 71976 0 0 0 71977 0 0 0 71978 0 0 0 71979 0 0 0 71980 0 0 0 71981 0 0 0 71982 0 0 0 71983 0 0 0 71984 0 0 0 71985 0 0 0 71986 0 0 0 71987 0 0 0 71988 0 0 0 71989 0 0 0 71990 0 0 0 71991 0 0 0 71992 0 0 0 71993 0 0 0 71994 0 13 0 71995 0 13 0 71996 0 13 0 71997 0 13 0 71998 0 13 0 71999 0 13 0 72000 0 13 0 72001 0 13 0 72002 0 13 0 72003 0 13 0 72004 0 13 0 72005 0 13 0 7

31
Appendix Table 1. Poulson Grading Scale for Tax and Expenditure Limits (TEL)Type of Limit and Method of Approval
5 points TELs originating through citizen initiative and embodied in the constitution4 points TELs originating through legislative referendum and embodied in the constitution3 points Statutory TELs enacted through citizen initiative2 points Statutory TELs enacted by legislative vote1 point Statutory TELs enacted through non-binding legislative vote
What the TEL Limits5 points TEL applies to all revenues or appropriations with few exceptions4 points TEL applies to all revenues or appropriations with certain limited exceptions3 points TEL applies to general fund revenues or appropriations2 points TEL applies to general fund revenues or appropriations with limited exceptions1 point TEL applies to tax revenues
The Size of the TEL Limits5 points TEL limit equal to inflation and population growth4 points TEL limit equal to the rate of growth of personal income3 points TEL limit less than 7 percent of state income2 points TEL limit greater than 7 percent of state income1 point TEL limit equal to a share of total revenue or expenditures
Treatment of Surpluses5 points Surplus revenue is allocated into emergency funds and budget stabilization funds
and then to tax cuts/rebates or debt reduction4 points Surplus revenue is allocated to tax cuts/rebates or debt reduction3 points Surplus is allocated to tax cuts/rebates or debt reduction and targeted expenditures2 points Surplus is allocated to emergency and budget stabilization funds1 point Surplus is returned to general fund or other expenditure accounts
The Provisions for Voter Approval of Tax and Expenditure Increases and Waiver of the TEL5 points Voter approval required for increases in taxes, and for expenditure of surplus revenues4 points Supermajority vote required in the legislature to raise all taxes3 points Supermajority vote required in the legislature to raise some taxes2 points Declaration of emergency and/or supermajority legislative vote required to expend
monies in the emergency and reserve funds1 point Majority vote required for the legislature to expend monies in the emergency and reserve funds

32
Appendix Table 2. State Scores Using Poulson TEL Scale
StatePoulson Index
Value StatePoulson Index
ValueAlabama 0 Montana 13Alaska 15 Nebraska 0Arizona 9 Nevada 13Arkansas 7 New Hampshire 0California 18 New Jersey 13Colorado 24 New Mexico 0Connecticut 15 New York 0Delaware 11 North Carolina 12Florida 21 North Dakota 0Georgia 0 Ohio 0Hawaii 18 Oklahoma 16Idaho 9 Oregon 17Illinois 0 Pennsylvania 0Indiana 0 Rhode Island 10Iowa 8 South Carolina 15Kansas 0 South Dakota 8Kentucky 8 Tennessee 11Louisiana 20 Texas 10Maine 0 Utah 10Maryland 0 Vermont 0Massachusetts 14 Virginia 0Michigan 20 Washington 20Minnesota 0 Wisconsin 0Mississippi 9 Wyoming 0Missouri 21