Staff Annual Diversity Report 2012 (Incorporating Equality ... · Staff Annual Diversity Report...
95
Staff Annual Diversity Report 2012 Version 1.0 Last amended: September 2012 Equality & Diversity Staff Annual Diversity Report 2012 (Incorporating Equality Information for publication under the Equality Act 2010)
Transcript of Staff Annual Diversity Report 2012 (Incorporating Equality ... · Staff Annual Diversity Report...
Staff Annual Diversity Report 2012
Version 1.0
Last amended: September 2012
Equality & Diversity
Staff Annual Diversity Report 2012
(Incorporating Equality Information for publication under the Equality Act
2010)

Page 2 of 95
Contents
The University of Nottingham’s Commitment to Diversity ................................................... 4
Purpose .................................................................................................................... 4
Summary of monitoring – key trends and issues ............................................................ 4
Profile ................................................................................................................... 4
Recruitment ........................................................................................................... 4
Recognition and reward ........................................................................................... 5
Diversity Data and Trends .............................................................................................. 6
Employee Profile ........................................................................................................ 6
Gender .................................................................................................................. 6
Ethnicity ................................................................................................................ 7
Disability ............................................................................................................... 9
Age ..................................................................................................................... 10
Mode of Employment – Full/Part-time ......................................................................... 11
Gender ................................................................................................................ 12
Ethnicity .............................................................................................................. 13
Disability ............................................................................................................. 15
Age ..................................................................................................................... 16
Contract Status ........................................................................................................ 17
Gender ................................................................................................................ 18
Ethnicity .............................................................................................................. 19
Disability ............................................................................................................. 21
Age ..................................................................................................................... 22
Level ...................................................................................................................... 23
Gender ................................................................................................................ 24
Ethnicity .............................................................................................................. 25
Disability ......................................................................................................... - 27 -
Occupational Staff Group .......................................................................................... 31
Gender ................................................................................................................ 32
Ethnicity .............................................................................................................. 34
Disability ............................................................................................................. 36
Age ..................................................................................................................... 38
Senior Research and Teaching Posts ........................................................................... 40
Gender ................................................................................................................ 40
Ethnicity .............................................................................................................. 41
Disability ............................................................................................................. 42
Age ..................................................................................................................... 43
Recruitment ............................................................................................................ 44
Gender ................................................................................................................ 44
Ethnicity .............................................................................................................. 45
Disability ............................................................................................................. 47
Activity/Performance Review ..................................................................................... 48
Gender ................................................................................................................ 48
Contract Status .................................................................................................... 49
Ethnicity .............................................................................................................. 50
Disability ............................................................................................................. 50
Position in Salary Range ........................................................................................ 52
Promotions .............................................................................................................. 53
Applicants Grade .................................................................................................. 54
Age Band ............................................................................................................. 55
Gender ................................................................................................................ 55
Contract Type....................................................................................................... 56
Ethnicity .............................................................................................................. 56
Disability ............................................................................................................. 57
Re-grading .............................................................................................................. 58
Gender ................................................................................................................ 59
Disability ............................................................................................................. 59
Age ..................................................................................................................... 60
Ethnicity .............................................................................................................. 60
Page 3 of 95
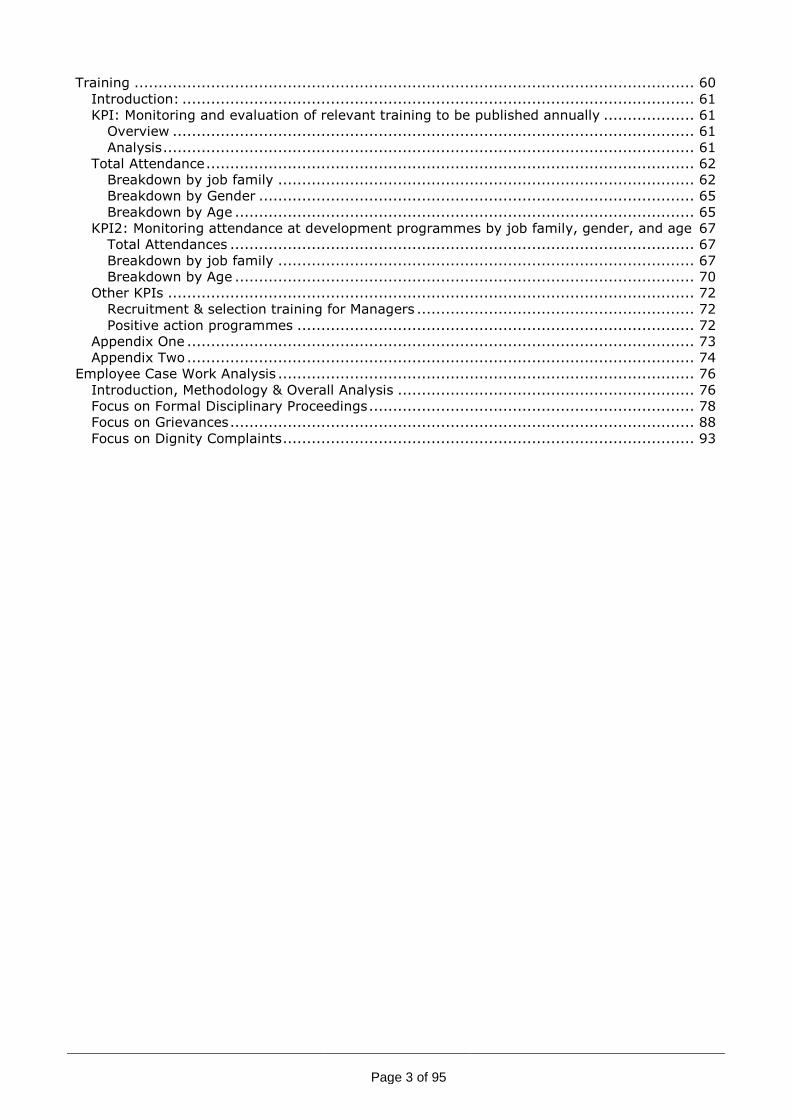
Training ..................................................................................................................... 60
Introduction: ........................................................................................................... 61
KPI: Monitoring and evaluation of relevant training to be published annually ................... 61
Overview ............................................................................................................. 61
Analysis ............................................................................................................... 61
Total Attendance ...................................................................................................... 62
Breakdown by job family ....................................................................................... 62
Breakdown by Gender ........................................................................................... 65
Breakdown by Age ................................................................................................ 65
KPI2: Monitoring attendance at development programmes by job family, gender, and age 67
Total Attendances ................................................................................................. 67
Breakdown by job family ....................................................................................... 67
Breakdown by Age ................................................................................................ 70
Other KPIs .............................................................................................................. 72
Recruitment & selection training for Managers .......................................................... 72
Positive action programmes ................................................................................... 72
Appendix One .......................................................................................................... 73
Appendix Two .......................................................................................................... 74
Employee Case Work Analysis ....................................................................................... 76
Introduction, Methodology & Overall Analysis .............................................................. 76
Focus on Formal Disciplinary Proceedings .................................................................... 78
Focus on Grievances ................................................................................................. 88
Focus on Dignity Complaints ...................................................................................... 93

Page 4 of 95
Staff Annual Diversity Report 2012
The University of Nottingham’s Commitment to Diversity
The University's aim is to attract, retain and motivate high quality individuals and to provide
equality of opportunity in order to maximise the benefit to the University from the diversity of
its workforce and student population. Diversity expresses itself in many ways - by age, gender,
race, culture, physical and mental ability, religion - and these differences are celebrated. We
aim to maximise everyone’s potential by harnessing these differences and creating a
productive environment in which all are valued; where our talents are fully utilised and organisational goals are achieved.
The University’s senior management team is committed to the diversity agenda. Head of
Schools and Departments have been working with Human Resources Advisers on the delivery of a number of diversity targets.
Purpose
In support of this commitment this report documents and summaries key trends in relation to
the University’s performance in the areas of equality and diversity, with an aim of highlighting
successes and informing the planning process to target areas where improvements should be
made. The report focuses on performance trends in four main areas:
University staff profile
Recruitment and selection
Staff recognition and reward
Staff promotion and re-grading
In addition to the trend data described above, this report also presents an opportunity to
summarise the main activities over the previous year and set out broad areas of activity
planned for the coming year (with detailed commitments and targets contained in the various
action plans associated with the equality schemes).
Summary of monitoring – key trends and issues
The detailed data can be found from page 7, but the key findings are:
Profile
There has been a slight increase in the overall number of people employed at the University,
but no major changes in the organisational profile. The university remains a particularly
popular employer for individuals identifying as Chinese/ Chinese British, with 3.3% of staff
identifying this way. This compares with only 0.6% of the Nottingham population (and 0.5% of
England’s) at the 2001 census.
There has been little progress towards increasing the number of declared disabled staff, which
remains significantly below the target of 4%.
Recruitment
Overall the pattern of recruitment is stable, despite the challenging economic climate. As in
previous years, the University appears to be an attractive employer for women, as application
rates remain high; however the success rates of BME and disabled candidates remains an issue
of concern.

Page 5 of 95
Recognition and reward
Although the University hopes that the revised PDPR process will start to change some of the
outcomes of performance related pay, 2013 will be the first year in which new objective setting
and assessment processes will have an impact. As in previous years, the current point on the
scale appears to be the most significant correlation to whether an employee will receive an
‘automatic’ increment rather than any protected characteristic.

Page 6 of 95
Diversity Data and Trends
Employee Profile
Employee profile figures are based on a 1st June census date. This is the latest point in the
academic year when sessional staff remain in post. Figures are given by headcount, unless
otherwise stated. Trends in the employee profile are considered over the last three years.
Gender
The graph below shows that the gender balance of the University is fairly even with the
University employing slightly more women than men. Over the last 3 years the University staff
numbers have continued to grow steadily whilst maintaining its equally balanced gender
distribution.
Gender Profile
Gender
2010 2011 2012
No. % No. % No. %
Female 3,687 52% 3,759 53% 3,825 53%
Male 3,342 48% 3,386 47% 3,399 47%
Total 7,029 100% 7,145 100% 7,224 100%
0%
10%
20%
30%
40%
50%
60%
70%
80%
90%
100%
2010 2011 2012
No
.
Year
Employee Profile by Gender (Headcount)
Male
Female
Page 7 of 95
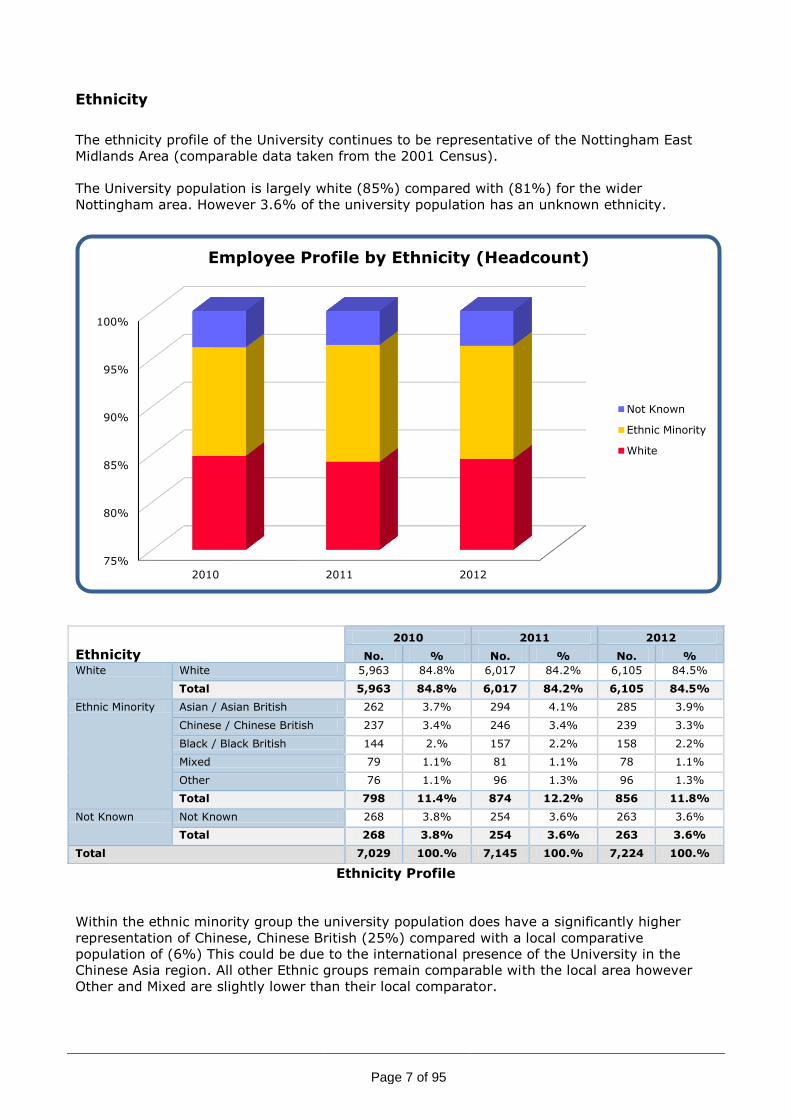
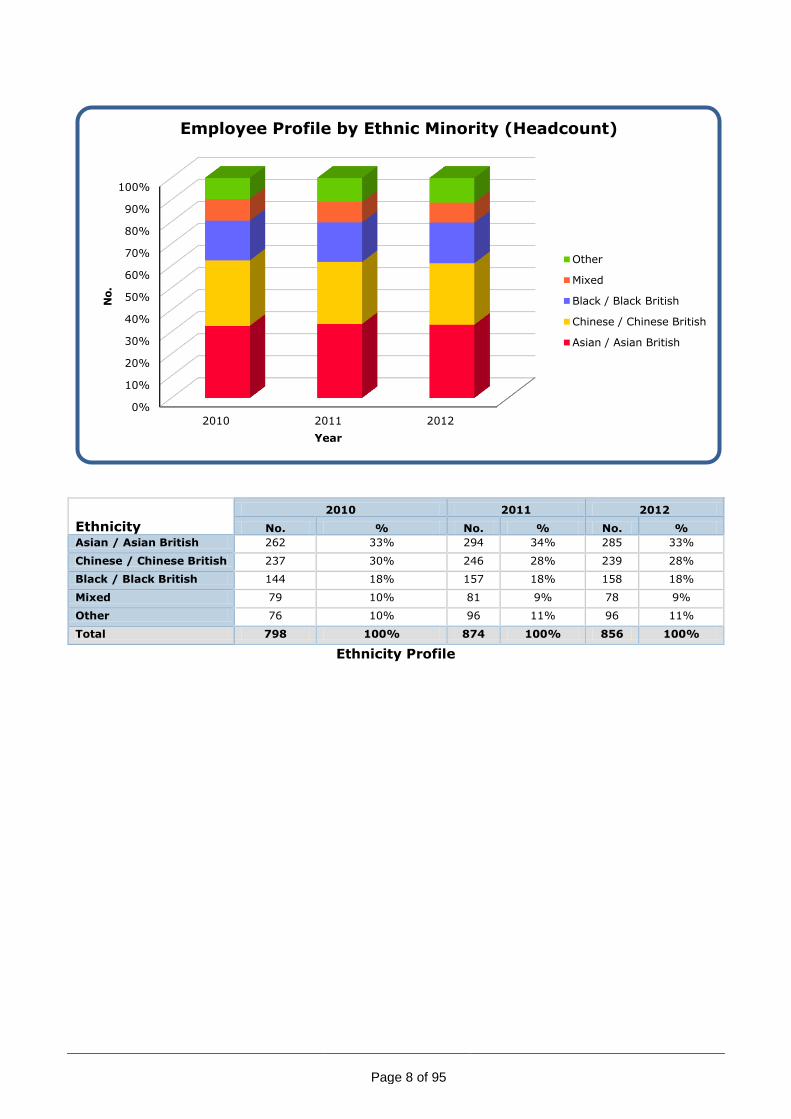
Ethnicity
The ethnicity profile of the University continues to be representative of the Nottingham East
Midlands Area (comparable data taken from the 2001 Census).
The University population is largely white (85%) compared with (81%) for the wider
Nottingham area. However 3.6% of the university population has an unknown ethnicity.
Ethnicity Profile
Within the ethnic minority group the university population does have a significantly higher
representation of Chinese, Chinese British (25%) compared with a local comparative
population of (6%) This could be due to the international presence of the University in the
Chinese Asia region. All other Ethnic groups remain comparable with the local area however
Other and Mixed are slightly lower than their local comparator.
Ethnicity
2010 2011 2012
No. % No. % No. %
White White 5,963 84.8% 6,017 84.2% 6,105 84.5%
Total 5,963 84.8% 6,017 84.2% 6,105 84.5%
Ethnic Minority Asian / Asian British 262 3.7% 294 4.1% 285 3.9%
Chinese / Chinese British 237 3.4% 246 3.4% 239 3.3%
Black / Black British 144 2.% 157 2.2% 158 2.2%
Mixed 79 1.1% 81 1.1% 78 1.1%
Other 76 1.1% 96 1.3% 96 1.3%
Total 798 11.4% 874 12.2% 856 11.8%
Not Known Not Known 268 3.8% 254 3.6% 263 3.6%
Total 268 3.8% 254 3.6% 263 3.6%
Total 7,029 100.% 7,145 100.% 7,224 100.%
75%
80%
85%
90%
95%
100%
2010 2011 2012
Employee Profile by Ethnicity (Headcount)
Not Known
Ethnic Minority
White
Page 8 of 95
Ethnicity Profile
Ethnicity
2010 2011 2012
No. % No. % No. %
Asian / Asian British 262 33% 294 34% 285 33%
Chinese / Chinese British 237 30% 246 28% 239 28%
Black / Black British 144 18% 157 18% 158 18%
Mixed 79 10% 81 9% 78 9%
Other 76 10% 96 11% 96 11%
Total 798 100% 874 100% 856 100%
0%
10%
20%
30%
40%
50%
60%
70%
80%
90%
100%
2010 2011 2012
No
.
Year
Employee Profile by Ethnic Minority (Headcount)
Other
Mixed
Black / Black British
Chinese / Chinese British
Asian / Asian British

Page 9 of 95
Disability
Just fewer than 2% of University employees have declared a disability, showing a minor
increase from 2011. This is still some way short of the 2014/2015 target of 4% referenced in
the 2010-2015 University plan and therefore will require some focus over the coming years.
The University has show a slight improvement from 2011 in reducing the Unknown category
from 6.8% to 6.3%.
Disability Profile
Disability Status
2010 2011 2012
No. % No. % No. %
Declared Disabled 129 1.8% 130 1.8% 138 1.9%
Declared Non-Disabled 6,397 91.% 6,531 91.4% 6,634 91.8%
Not Known 503 7.2% 484 6.8% 452 6.3%
Total 7,029 100.% 7,145 100.% 7,224 100.%
0%
10%
20%
30%
40%
50%
60%
70%
80%
90%
100%
2010 2011 2012
No
.
Year
Employee Profile by Declared Disability (Headcount)
Not Known
Declared Non-Disabled
Declared Disabled

Page 10 of 95
Age
The age profile of University employees continues to show a good balanced distribution
compared to the working population of the local area, As you would expect in an academic
environment 16-24 are underrepresented due to the complexity of the work performed by the
institution. However this proportion of under representation in one area is equally distributed
throughout the other age groups. Future changes in the retirement age legislation may see an
impact in the +65 category compared to previous years.
Age
2010 2011 2012
No. % No. % No. %
16-24 192 3% 197 3% 224 3%
25-34 1,738 25% 1,711 24% 1,648 23%
35-44 1,990 28% 1,982 28% 2,010 28%
45-54 1,840 26% 1,974 28% 2,022 28%
55-64 1,215 17% 1,224 17% 1,238 17%
65+ 54 1% 57 1% 82 1%
Total 7,029 100% 7,145 100% 7,224 100%
Age Profile
0%
10%
20%
30%
40%
50%
60%
70%
80%
90%
100%
2010 2011 2012
No
.
Year
Employee Profile by Age (Headcount)
65+
55-64
45-54
35-44
25-34
16-24
Page 11 of 95
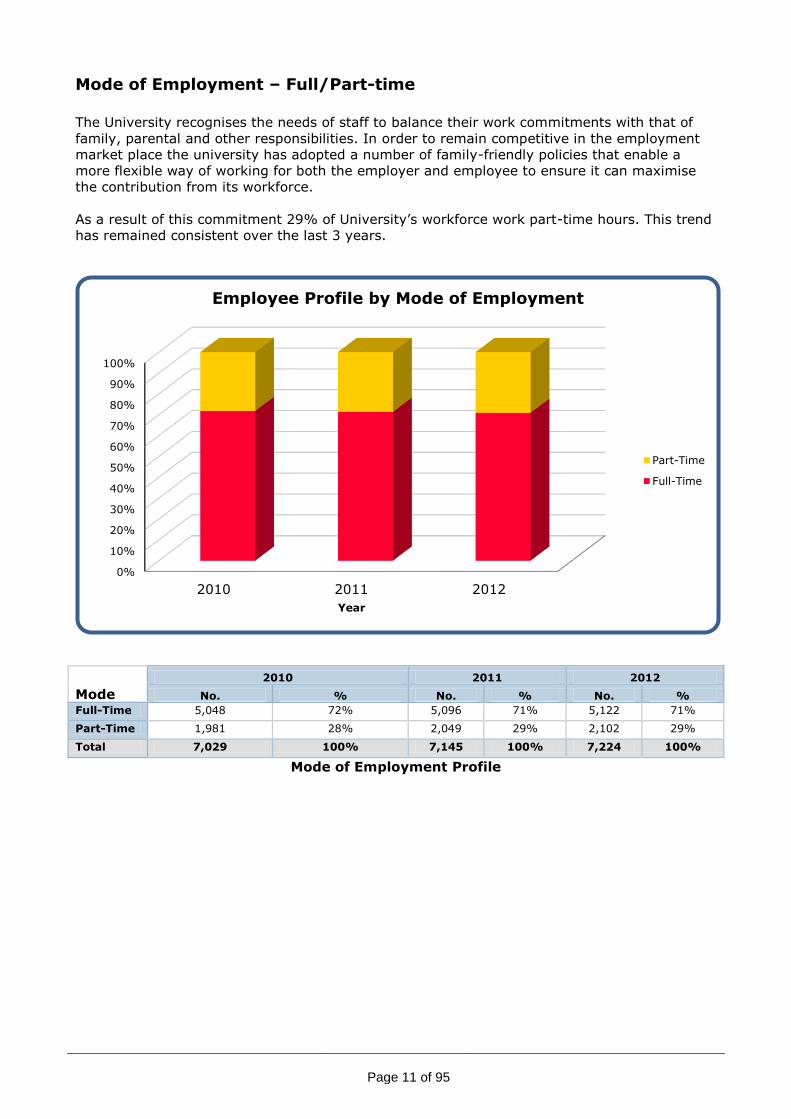
Mode of Employment – Full/Part-time
The University recognises the needs of staff to balance their work commitments with that of
family, parental and other responsibilities. In order to remain competitive in the employment
market place the university has adopted a number of family-friendly policies that enable a
more flexible way of working for both the employer and employee to ensure it can maximise
the contribution from its workforce.
As a result of this commitment 29% of University’s workforce work part-time hours. This trend
has remained consistent over the last 3 years.
Mode
2010 2011 2012
No. % No. % No. %
Full-Time 5,048 72% 5,096 71% 5,122 71%
Part-Time 1,981 28% 2,049 29% 2,102 29%
Total 7,029 100% 7,145 100% 7,224 100%
Mode of Employment Profile
0%
10%
20%
30%
40%
50%
60%
70%
80%
90%
100%
2010 2011 2012
Year
Employee Profile by Mode of Employment
Part-Time
Full-Time

Page 12 of 95
Gender
Although flexible working arrangements are available to both male and female employees, as
with the majority of employers, flexible working arrangements are requested and worked in
the main by female employees. The proportion of part- time workers has remained the same
as in 2011 with a minimal change in the gender breakdown, 42% of women and 15% of men
work part-time.
Gender
Full-Time Part-Time
Total No. % No. %
2010 Female 2,189 59% 1,498 41% 3,687
Male 2,859 86% 483 14% 3,342
Total 5,048 72% 1,981 28% 7,029
2011 Female 2,212 59% 1,547 41% 3,759
Male 2,884 85% 502 15% 3,386
Total 5,096 71% 2,049 29% 7,145
2012 Female 2,227 58% 1,598 42% 3,825
Male 2,895 85% 504 15% 3,399
Total 5,122 71% 2,102 29% 7,224
Gender and Mode of Employment
0%
10%
20%
30%
40%
50%
60%
70%
80%
90%
100%
Female, 2010
Female, 2011
Female, 2012
Male, 2010 Male, 2011 Male, 2012
Percen
tag
e
Gender, Year
Employee Profile by Mode of Employment and Gender
Part-Time
Full-Time
Page 13 of 95
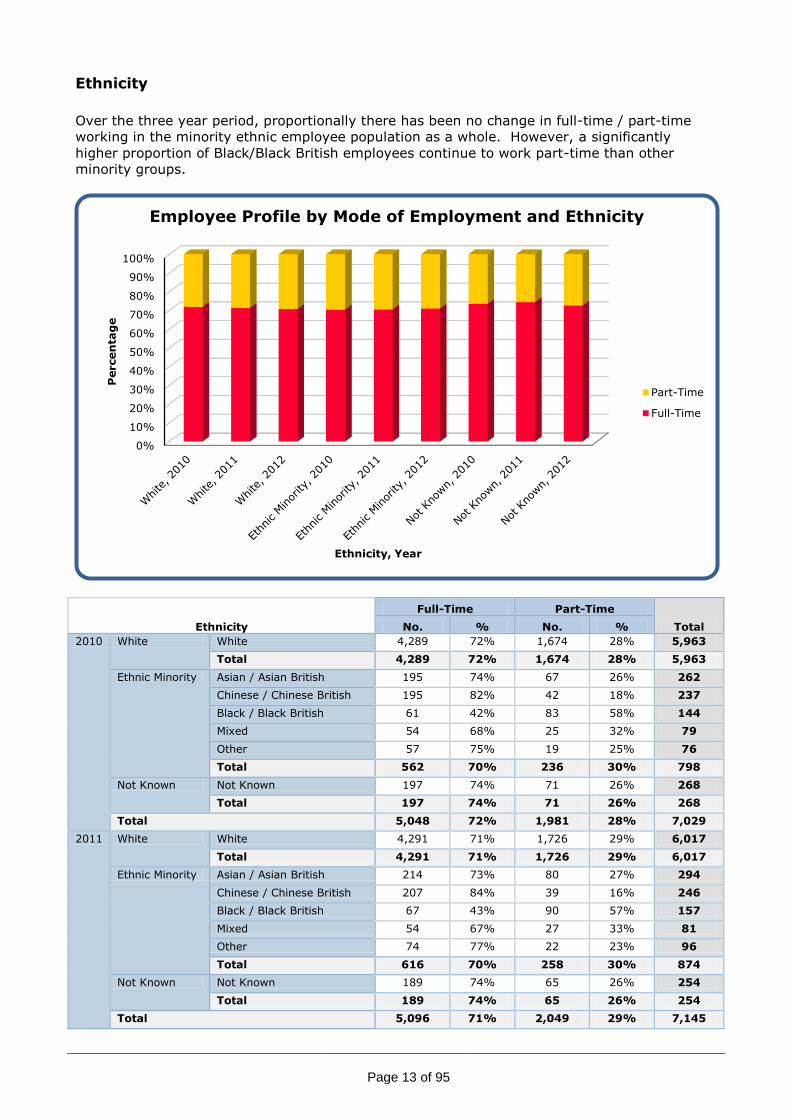
Ethnicity
Over the three year period, proportionally there has been no change in full-time / part-time
working in the minority ethnic employee population as a whole. However, a significantly
higher proportion of Black/Black British employees continue to work part-time than other
minority groups.
Ethnicity
Full-Time Part-Time
Total No. % No. %
2010 White White 4,289 72% 1,674 28% 5,963
Total 4,289 72% 1,674 28% 5,963
Ethnic Minority Asian / Asian British 195 74% 67 26% 262
Chinese / Chinese British 195 82% 42 18% 237
Black / Black British 61 42% 83 58% 144
Mixed 54 68% 25 32% 79
Other 57 75% 19 25% 76
Total 562 70% 236 30% 798
Not Known Not Known 197 74% 71 26% 268
Total 197 74% 71 26% 268
Total 5,048 72% 1,981 28% 7,029
2011 White White 4,291 71% 1,726 29% 6,017
Total 4,291 71% 1,726 29% 6,017
Ethnic Minority Asian / Asian British 214 73% 80 27% 294
Chinese / Chinese British 207 84% 39 16% 246
Black / Black British 67 43% 90 57% 157
Mixed 54 67% 27 33% 81
Other 74 77% 22 23% 96
Total 616 70% 258 30% 874
Not Known Not Known 189 74% 65 26% 254
Total 189 74% 65 26% 254
Total 5,096 71% 2,049 29% 7,145
0%
10%
20%
30%
40%
50%
60%
70%
80%
90%
100%
Percen
tag
e
Ethnicity, Year
Employee Profile by Mode of Employment and Ethnicity
Part-Time
Full-Time

Page 14 of 95
Ethnicity
Full-Time Part-Time
Total No. % No. %
2012 White White 4,323 71% 1,782 29% 6,105
Total 4,323 71% 1,782 29% 6,105
Ethnic Minority Asian / Asian British 209 73% 76 27% 285
Chinese / Chinese British 196 82% 43 18% 239
Black / Black British 72 46% 86 54% 158
Mixed 51 65% 27 35% 78
Other 80 83% 16 17% 96
Total 608 71% 248 29% 856
Not Known Not Known 191 73% 72 27% 263
Total 191 73% 72 27% 263
Total 5,122 71% 2,102 29% 7,224
Ethnicity and Mode of Employment

Page 15 of 95
Disability
Proportionally more staff with a declared disability work part-time than the overall University
working population. The University continues to demonstrate the benefits of its flexible working
and reasonable adjustment policies in demonstrating that working commitments can be
balanced with individual’s personal needs.
Disability
Full-Time Part-Time
Total No. % No. %
2010 Declared Disabled 83 64% 46 36% 129
Declared Non-Disabled 4,609 72% 1,788 28% 6,397
Not Known 356 71% 147 29% 503
Total 5,048 72% 1,981 28% 7,029
2011 Declared Disabled 78 60% 52 40% 130
Declared Non-Disabled 4,680 72% 1,851 28% 6,531
Not Known 338 70% 146 30% 484
Total 5,096 71% 2,049 29% 7,145
2012 Declared Disabled 86 62% 52 38% 138
Declared Non-Disabled 4,733 71% 1,901 29% 6,634
Not Known 303 67% 149 33% 452
Total 5,122 71% 2,102 29% 7,224
Disability and Mode of Employment
0%
10%
20%
30%
40%
50%
60%
70%
80%
90%
100%
Percen
tag
e
Disability, Year
Employee Profile by Mode of Employment and Declared Disability
Part-Time
Full-Time

Page 16 of 95
Age
Apart from the highest age group +65 where there is a significantly smaller data set, part-time
working is evenly distributed throughout the majority of age groups. The lowest proportion of
part-time employment occurs in the 25-34 age bracket at 21% where the majority of staff are
starting their careers. The trend shows that the proportions have remained consistent between
2010 and 2012.
Age and Mode of employment
Age Band
Full-Time Part-Time
Total No. % No. %
2010 16-24 116 60% 76 40% 192
25-34 1,410 81% 328 19% 1,738
35-44 1,432 72% 558 28% 1,990
45-54 1,293 70% 547 30% 1,840
55-64 781 64% 434 36% 1,215
65+ 16 30% 38 70% 54
Total 5,048 72% 1,981 28% 7,029
2011 16-24 104 53% 93 47% 197
25-34 1,372 80% 339 20% 1,711
35-44 1,428 72% 554 28% 1,982
45-54 1,388 70% 586 30% 1,974
55-64 791 65% 433 35% 1,224
65+ 13 23% 44 77% 57
Total 5,096 71% 2,049 29% 7,145
2012 16-24 110 49% 114 51% 224
25-34 1,299 79% 349 21% 1,648
35-44 1,462 73% 548 27% 2,010
45-54 1,420 70% 602 30% 2,022
55-64 808 65% 430 35% 1,238
65+ 23 28% 59 72% 82
Total 5,122 71% 2,102 29% 7,224
0%
10%
20%
30%
40%
50%
60%
70%
80%
90%
100%
Percen
tag
e
Age Band, Year
Employee Profile by Mode of Employment and Age
Full-Time Part-Time

Page 17 of 95
Contract Status
The contract status profile of the university shows that the proportion of permanent/indefinite
and fixed-term contracts has remained consistent for the last 3 years at around 80%
permanent and 20% fixed-term employees.
Contract Status
2010 2011 2012
No. % No. % No. %
Fixed-Term 1,401 20% 1,411 20% 1,346 19%
Permanent 5,628 80% 5,734 80% 5,878 81%
Total 7,029 100% 7,145 100% 7,224 100%
Contract Status and Mode of Employment
0%
10%
20%
30%
40%
50%
60%
70%
80%
90%
100%
2010 2011 2012
No
.
Year
Employee Profile by Contract Status
Permanent
Fixed-Term
Page 18 of 95
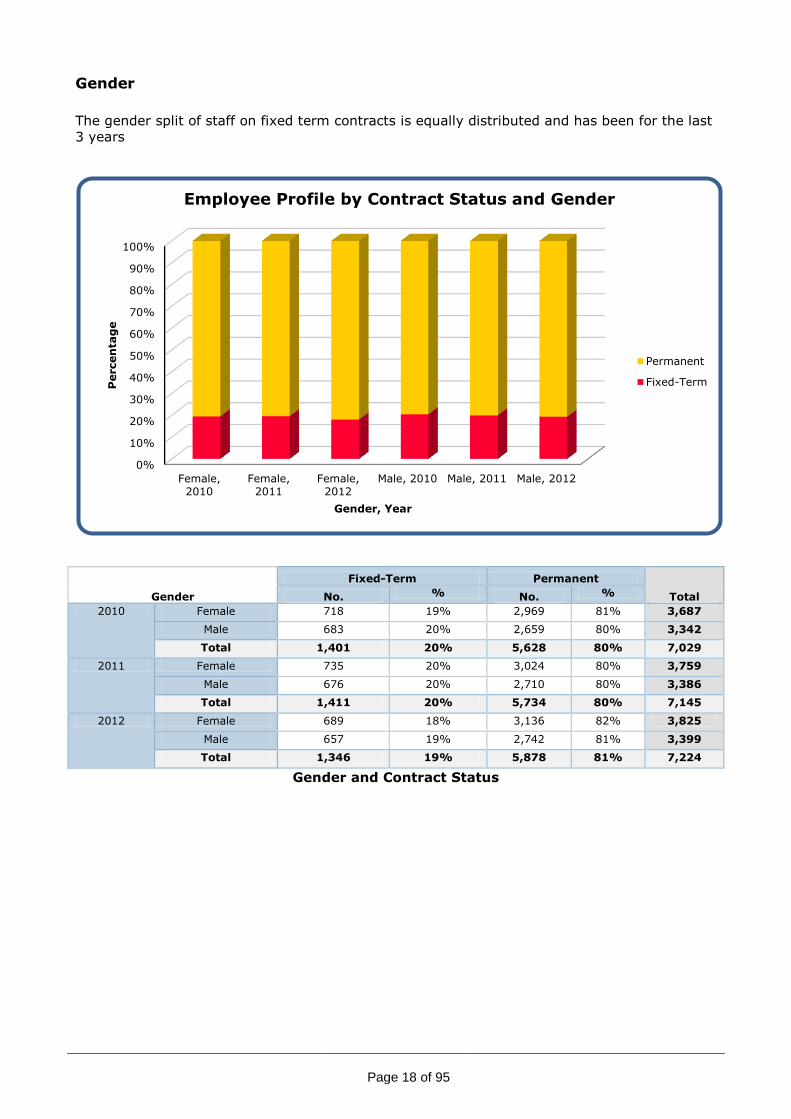
Gender
The gender split of staff on fixed term contracts is equally distributed and has been for the last
3 years
Gender
Fixed-Term Permanent
Total No. % No. %
2010 Female 718 19% 2,969 81% 3,687
Male 683 20% 2,659 80% 3,342
Total 1,401 20% 5,628 80% 7,029
2011 Female 735 20% 3,024 80% 3,759
Male 676 20% 2,710 80% 3,386
Total 1,411 20% 5,734 80% 7,145
2012 Female 689 18% 3,136 82% 3,825
Male 657 19% 2,742 81% 3,399
Total 1,346 19% 5,878 81% 7,224
Gender and Contract Status
0%
10%
20%
30%
40%
50%
60%
70%
80%
90%
100%
Female, 2010
Female, 2011
Female, 2012
Male, 2010 Male, 2011 Male, 2012
Percen
tag
e
Gender, Year
Employee Profile by Contract Status and Gender
Permanent
Fixed-Term

Page 19 of 95
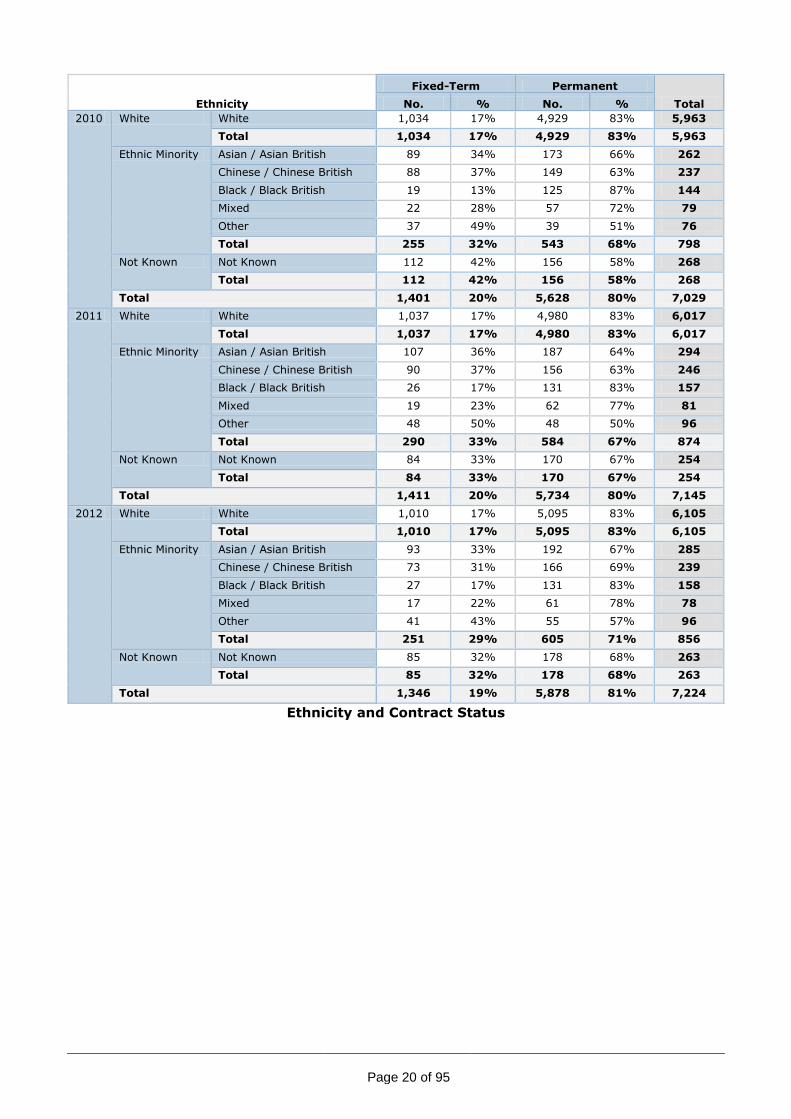
Ethnicity
A significantly higher proportion of ethnic minority / unknown staff are employed on fixed-term
contracts compared to white employees. This reflects the higher use of fixed-term contracts
and higher number of employees from ethnic minority groups in research and teaching
occupations.
0%
10%
20%
30%
40%
50%
60%
70%
80%
90%
100%
Percen
tag
e
Ethnicity, Year
Employee Profile by Contract Status and Ethnicity
Permanent
Fixed-Term
Page 20 of 95
Ethnicity
Fixed-Term Permanent
Total No. % No. %
2010 White White 1,034 17% 4,929 83% 5,963
Total 1,034 17% 4,929 83% 5,963
Ethnic Minority Asian / Asian British 89 34% 173 66% 262
Chinese / Chinese British 88 37% 149 63% 237
Black / Black British 19 13% 125 87% 144
Mixed 22 28% 57 72% 79
Other 37 49% 39 51% 76
Total 255 32% 543 68% 798
Not Known Not Known 112 42% 156 58% 268
Total 112 42% 156 58% 268
Total 1,401 20% 5,628 80% 7,029
2011 White White 1,037 17% 4,980 83% 6,017
Total 1,037 17% 4,980 83% 6,017
Ethnic Minority Asian / Asian British 107 36% 187 64% 294
Chinese / Chinese British 90 37% 156 63% 246
Black / Black British 26 17% 131 83% 157
Mixed 19 23% 62 77% 81
Other 48 50% 48 50% 96
Total 290 33% 584 67% 874
Not Known Not Known 84 33% 170 67% 254
Total 84 33% 170 67% 254
Total 1,411 20% 5,734 80% 7,145
2012 White White 1,010 17% 5,095 83% 6,105
Total 1,010 17% 5,095 83% 6,105
Ethnic Minority Asian / Asian British 93 33% 192 67% 285
Chinese / Chinese British 73 31% 166 69% 239
Black / Black British 27 17% 131 83% 158
Mixed 17 22% 61 78% 78
Other 41 43% 55 57% 96
Total 251 29% 605 71% 856
Not Known Not Known 85 32% 178 68% 263
Total 85 32% 178 68% 263
Total 1,346 19% 5,878 81% 7,224
Ethnicity and Contract Status

Page 21 of 95
Disability
The proportion of declared disabled staff employed on a fixed-term basis has dropped from
32% in 2011 to 26%.
Disability
Fixed-Term Permanent
Total No. % No. %
2010 Declared Disabled 39 30% 90 70% 129
Declared Non-Disabled 1,184 19% 5,213 81% 6,397
Not Known 178 35% 325 65% 503
Total 1,401 20% 5,628 80% 7,029
2011 Declared Disabled 41 32% 89 68% 130
Declared Non-Disabled 1,226 19% 5,305 81% 6,531
Not Known 144 30% 340 70% 484
Total 1,411 20% 5,734 80% 7,145
2012 Declared Disabled 36 26% 102 74% 138
Declared Non-Disabled 1,201 18% 5,433 82% 6,634
Not Known 109 24% 343 76% 452
Total 1,346 19% 5,878 81% 7,224
Disability and Contract Status
0% 10% 20% 30% 40% 50% 60% 70% 80% 90%
100%
Percen
tag
e
Disability, Year
Employee Profile by Contract Status and Declared Disability
Permanent
Fixed-Term
Page 22 of 95
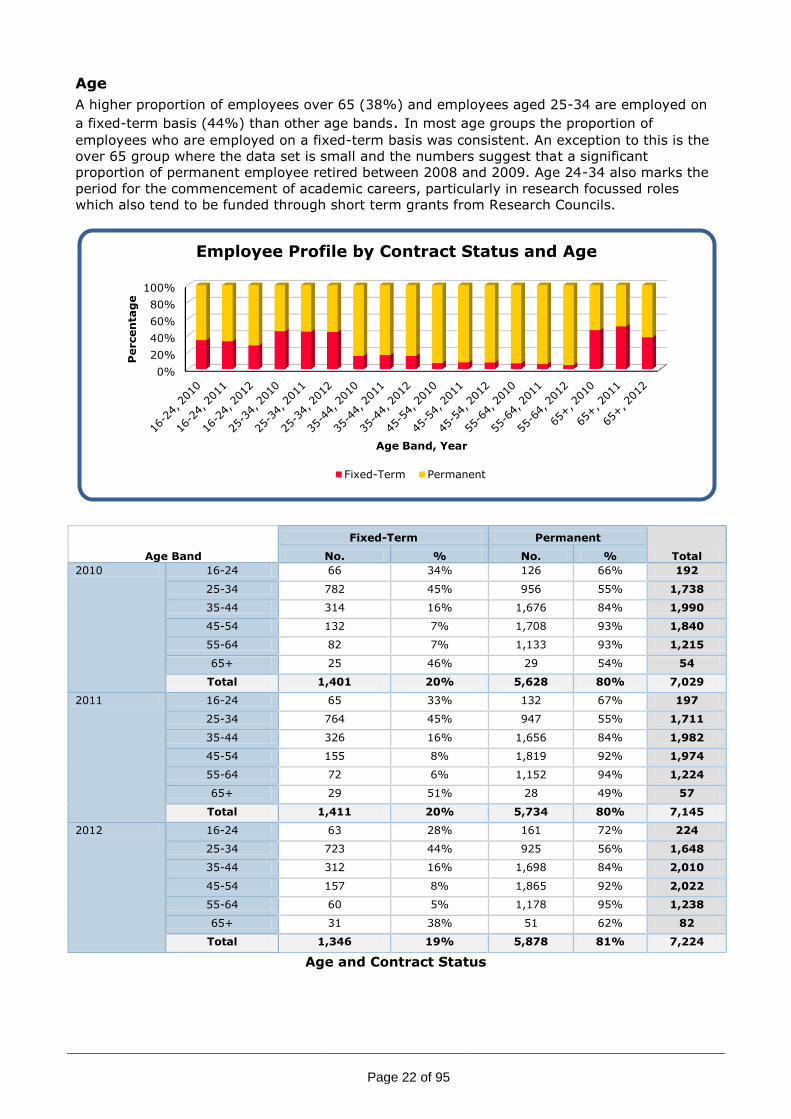
Age
A higher proportion of employees over 65 (38%) and employees aged 25-34 are employed on
a fixed-term basis (44%) than other age bands. In most age groups the proportion of
employees who are employed on a fixed-term basis was consistent. An exception to this is the
over 65 group where the data set is small and the numbers suggest that a significant
proportion of permanent employee retired between 2008 and 2009. Age 24-34 also marks the
period for the commencement of academic careers, particularly in research focussed roles
which also tend to be funded through short term grants from Research Councils.
Age and Contract Status
Age Band
Fixed-Term Permanent
Total No. % No. %
2010 16-24 66 34% 126 66% 192
25-34 782 45% 956 55% 1,738
35-44 314 16% 1,676 84% 1,990
45-54 132 7% 1,708 93% 1,840
55-64 82 7% 1,133 93% 1,215
65+ 25 46% 29 54% 54
Total 1,401 20% 5,628 80% 7,029
2011 16-24 65 33% 132 67% 197
25-34 764 45% 947 55% 1,711
35-44 326 16% 1,656 84% 1,982
45-54 155 8% 1,819 92% 1,974
55-64 72 6% 1,152 94% 1,224
65+ 29 51% 28 49% 57
Total 1,411 20% 5,734 80% 7,145
2012 16-24 63 28% 161 72% 224
25-34 723 44% 925 56% 1,648
35-44 312 16% 1,698 84% 2,010
45-54 157 8% 1,865 92% 2,022
55-64 60 5% 1,178 95% 1,238
65+ 31 38% 51 62% 82
Total 1,346 19% 5,878 81% 7,224
0%
20%
40%
60%
80%
100%
Percen
tag
e
Age Band, Year
Employee Profile by Contract Status and Age
Fixed-Term Permanent

Page 23 of 95
Level
In general the number of staff at most levels in the organisation1 has continued to rise slightly,
between 2011 and 2012, with the overall grade distribution remaining very stable. Growth in
the overall number of employees over the three years has been approximately 2.8%.
Level 1 has enjoyed the highest increase in percentage terms, 7% over the three years. Levels
2 and 6 have reduced in actual numbers, but by very small amounts.
2010 2011 2012
No. % No. % No. %
1 1,081 15% 1,113 16% 1,156 16%
2 832 12% 855 12% 840 12%
3 752 11% 774 11% 775 11%
4 1,761 25% 1,755 25% 1,794 25%
5 1,217 17% 1,259 18% 1,281 18%
6 666 9% 677 9% 665 9%
7 720 10% 712 10% 713 10%
Total 7,029 100% 7,145 100% 7,224 100%
Level Profile
1 Where an employee is not employed on a grade within the University levels the closest equivalent level has been allocated for the purposes of this report according to grade and/or salary. Level 4 includes level 4A and the level 4 training grades and level 5 includes the ‘Extended Lecturer Level 5’ grade.
0
200
400
600
800
1,000
1,200
1,400
1,600
1,800
1 2 3 4 5 6 7
No
.
Level
Employee Profile by Level
2010
2011
2012
Page 24 of 95
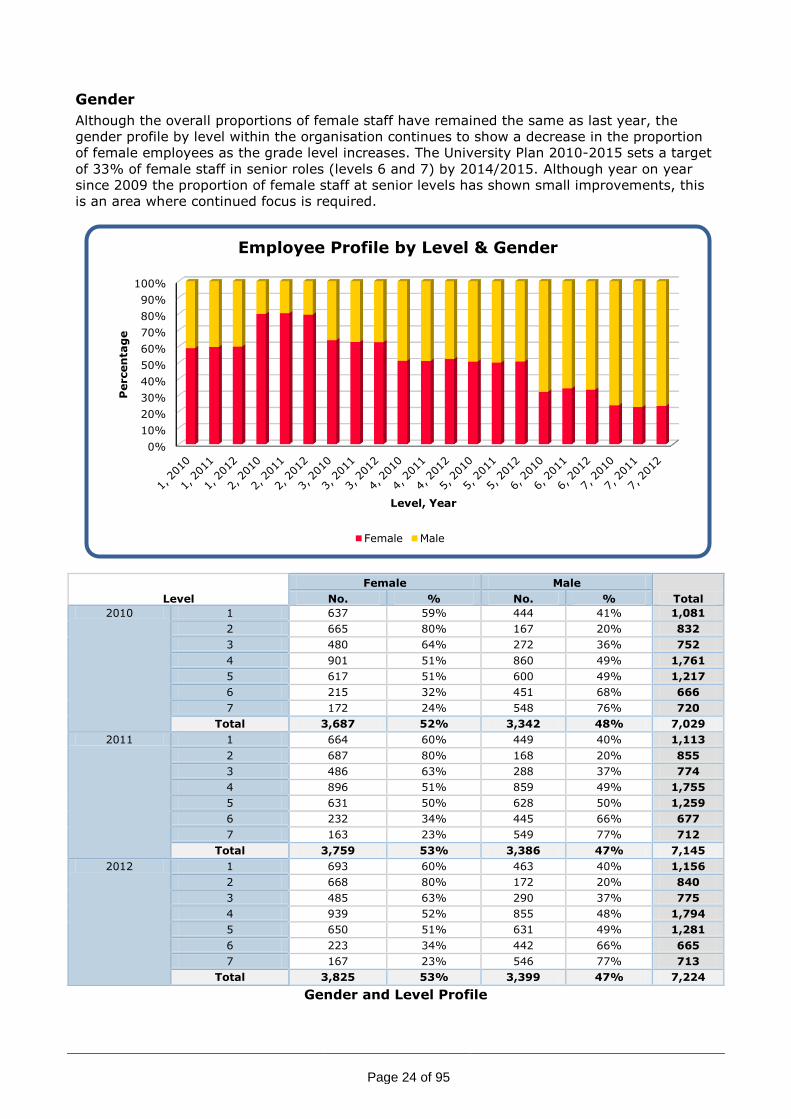
Gender
Although the overall proportions of female staff have remained the same as last year, the
gender profile by level within the organisation continues to show a decrease in the proportion
of female employees as the grade level increases. The University Plan 2010-2015 sets a target
of 33% of female staff in senior roles (levels 6 and 7) by 2014/2015. Although year on year
since 2009 the proportion of female staff at senior levels has shown small improvements, this
is an area where continued focus is required.
Level
Female Male
Total No. % No. %
2010 1 637 59% 444 41% 1,081
2 665 80% 167 20% 832
3 480 64% 272 36% 752
4 901 51% 860 49% 1,761
5 617 51% 600 49% 1,217
6 215 32% 451 68% 666
7 172 24% 548 76% 720
Total 3,687 52% 3,342 48% 7,029
2011 1 664 60% 449 40% 1,113
2 687 80% 168 20% 855
3 486 63% 288 37% 774
4 896 51% 859 49% 1,755
5 631 50% 628 50% 1,259
6 232 34% 445 66% 677
7 163 23% 549 77% 712
Total 3,759 53% 3,386 47% 7,145
2012 1 693 60% 463 40% 1,156
2 668 80% 172 20% 840
3 485 63% 290 37% 775
4 939 52% 855 48% 1,794
5 650 51% 631 49% 1,281
6 223 34% 442 66% 665
7 167 23% 546 77% 713
Total 3,825 53% 3,399 47% 7,224
Gender and Level Profile
0%
10%
20%
30%
40%
50%
60%
70%
80%
90%
100%
Percen
tag
e
Level, Year
Employee Profile by Level & Gender
Female Male

Page 25 of 95
Ethnicity
There continues to be a higher concentration of ethnic minority employees at levels 1 and 4
within the organisation than at the other levels. These anomalies are due to a large proportion
of black and black British staff in level 1 roles and a large proportion of Chinese / Chinese
British staff in Level 4 roles.
0%
10%
20%
30%
40%
50%
60%
70%
80%
90%
100%
1, 2010
1, 2011
1, 2012
2, 2010
2, 2011
2, 2012
3, 2010
3, 2011
3, 2012
4, 2010
4, 2011
4, 2012
5, 2010
5, 2011
5, 2012
6, 2010
6, 2011
6, 2012
7, 2010
7, 2011
7, 2012
Percen
tag
e
Level, Year
Employee Profile by Level & Ethnic Minority
Other
Mixed
Black / Black British
Chinese / Chinese British
Asian / Asian British
0%
10%
20%
30%
40%
50%
60%
70%
80%
90%
100%
1, 2010
1, 2011
1, 2012
2, 2010
2, 2011
2, 2012
3, 2010
3, 2011
3, 2012
4, 2010
4, 2011
4, 2012
5, 2010
5, 2011
5, 2012
6, 2010
6, 2011
6, 2012
7, 2010
7, 2011
7, 2012
Percen
tag
e
Level, Year
Employee Profile by Level & Ethnicity
Not Known
Ethnic Minority
White

Page 26 of 95
Ethnicity
1 2 3 4 5 6 7
Total No. % No. % No. % No. % No. % No. % No. %
2010 White White 873 15% 749 13% 661 11% 1,392 23% 1,055 18% 599 10% 634 11% 5,963
Total 873 15% 749 13% 661 11% 1,392 23% 1,055 18% 599 10% 634 11% 5,963
Ethnic Minority Asian / Asian British 24 9% 28 11% 37 14% 79 30% 48 18% 16 6% 30 11% 262
Chinese / Chinese British 30 13% 10 4% 11 5% 111 47% 39 16% 24 10% 12 5% 237
Black / Black British 82 57% 9 6% 9 6% 23 16% 13 9% 2 1% 6 4% 144
Mixed 18 23% 9 11% 5 6% 19 24% 18 23% 4 5% 6 8% 79
Other 9 12% 7 9% 3 4% 28 37% 10 13% 7 9% 12 16% 76
Total 163 20% 63 8% 65 8% 260 33% 128 16% 53 7% 66 8% 798
Not Known Not Known 45 17% 20 7% 26 10% 109 41% 34 13% 14 5% 20 7% 268
Total 45 17% 20 7% 26 10% 109 41% 34 13% 14 5% 20 7% 268
Total 1,081 15% 832 12% 752 11% 1,761 25% 1,217 17% 666 9% 720 10% 7,029
2011 White White 890 15% 767 13% 681 11% 1,376 23% 1,069 18% 602 10% 632 11% 6,017
Total 890 15% 767 13% 681 11% 1,376 23% 1,069 18% 602 10% 632 11% 6,017
Ethnic Minority Asian / Asian British 33 11% 26 9% 40 14% 89 30% 56 19% 18 6% 32 11% 294
Chinese / Chinese British 27 11% 11 4% 13 5% 111 45% 44 18% 28 11% 12 5% 246
Black / Black British 86 55% 12 8% 9 6% 27 17% 14 9% 2 1% 7 4% 157
Mixed 21 26% 9 11% 6 7% 17 21% 19 23% 5 6% 4 5% 81
Other 12 13% 8 8% 4 4% 40 42% 14 15% 9 9% 9 9% 96
Total 179 20% 66 8% 72 8% 284 32% 147 17% 62 7% 64 7% 874
Not Known Not Known 44 17% 22 9% 21 8% 95 37% 43 17% 13 5% 16 6% 254
Total 44 17% 22 9% 21 8% 95 37% 43 17% 13 5% 16 6% 254
Total 1,113 16% 855 12% 774 11% 1,755 25% 1,259 18% 677 9% 712 10% 7,145
2012 White White 935 15% 762 12% 675 11% 1,425 23% 1,082 18% 600 10% 626 10% 6,105
Total 935 15% 762 12% 675 11% 1,425 23% 1,082 18% 600 10% 626 10% 6,105
Ethnic Minority Asian / Asian British 28 10% 25 9% 43 15% 90 32% 49 17% 18 6% 32 11% 285
Chinese / Chinese British 32 13% 8 3% 11 5% 98 41% 51 21% 21 9% 18 8% 239
Black / Black British 82 52% 12 8% 13 8% 27 17% 15 9% 2 1% 7 4% 158
Mixed 20 26% 5 6% 5 6% 21 27% 19 24% 4 5% 4 5% 78
Other 9 9% 9 9% 5 5% 41 43% 17 18% 8 8% 7 7% 96
Total 171 20% 59 7% 77 9% 277 32% 151 18% 53 6% 68 8% 856
Not Known Not Known 50 19% 19 7% 23 9% 92 35% 48 18% 12 5% 19 7% 263
Total 50 19% 19 7% 23 9% 92 35% 48 18% 12 5% 19 7% 263
Total 1,156 16% 840 12% 775 11% 1,794 25% 1,281 18% 665 9% 713 10% 7,224
Ethnicity and Level

Page - 27 - of 95
Disability
Levels 1 and 4 have both the highest proportions of declared disabled staff and
the highest proportions of staff for whom disability status is unknown. The
proportion of staff with a disability at the higher levels is lower than at the lower
levels.
0%
10%
20%
30%
40%
50%
60%
70%
80%
90%
100%
Percen
tag
e
Level, Year
Employee Profile by Level & Disability
Not Known
Declared Non-Disabled
Declared Disabled
0.
0.5
1.
1.5
2.
2.5
3.
3.5
Percen
tag
e
Level, Year
Employee Profile by Level & Disability
Declared Disabled

Page - 28 - of 95
Level
Declared Disabled
Declared Non-Disabled Not Known
Total No. % No. % No. %
2010 1 33 3.1% 937 86.7% 111 10.3% 1,081
2 13 1.6% 765 91.9% 54 6.5% 832
3 13 1.7% 688 91.5% 51 6.8% 752
4 37 2.1% 1,565 88.9% 159 9.0% 1,761
5 17 1.4% 1,129 92.8% 71 5.8% 1,217
6 8 1.2% 630 94.6% 28 4.2% 666
7 8 1.1% 683 94.9% 29 4.0% 720
Total 129 1.8% 6,397 91.0% 503 7.2% 7,029
2011 1 35 3.1% 968 87.0% 110 9.9% 1,113
2 15 1.8% 786 91.9% 54 6.3% 855
3 12 1.6% 716 92.5% 46 5.9% 774
4 31 1.8% 1,580 90.0% 144 8.2% 1,755
5 19 1.5% 1,162 92.3% 78 6.2% 1,259
6 7 1.0% 642 94.8% 28 4.1% 677
7 11 1.5% 677 95.1% 24 3.4% 712
Total 130 1.8% 6,531 91.4% 484 6.8% 7,145
2012 1 35 3.0% 1,013 87.6% 108 9.3% 1,156
2 18 2.1% 773 92.0% 49 5.8% 840
3 13 1.7% 719 92.8% 43 5.5% 775
4 35 2.0% 1,641 91.5% 118 6.6% 1,794
5 19 1.5% 1,185 92.5% 77 6.0% 1,281
6 9 1.4% 630 94.7% 26 3.9% 665
7 9 1.3% 673 94.4% 31 4.3% 713
Total 138 1.9% 6,634 91.8% 452 6.3% 7,224
Disability and Level
Page - 29 - of 95
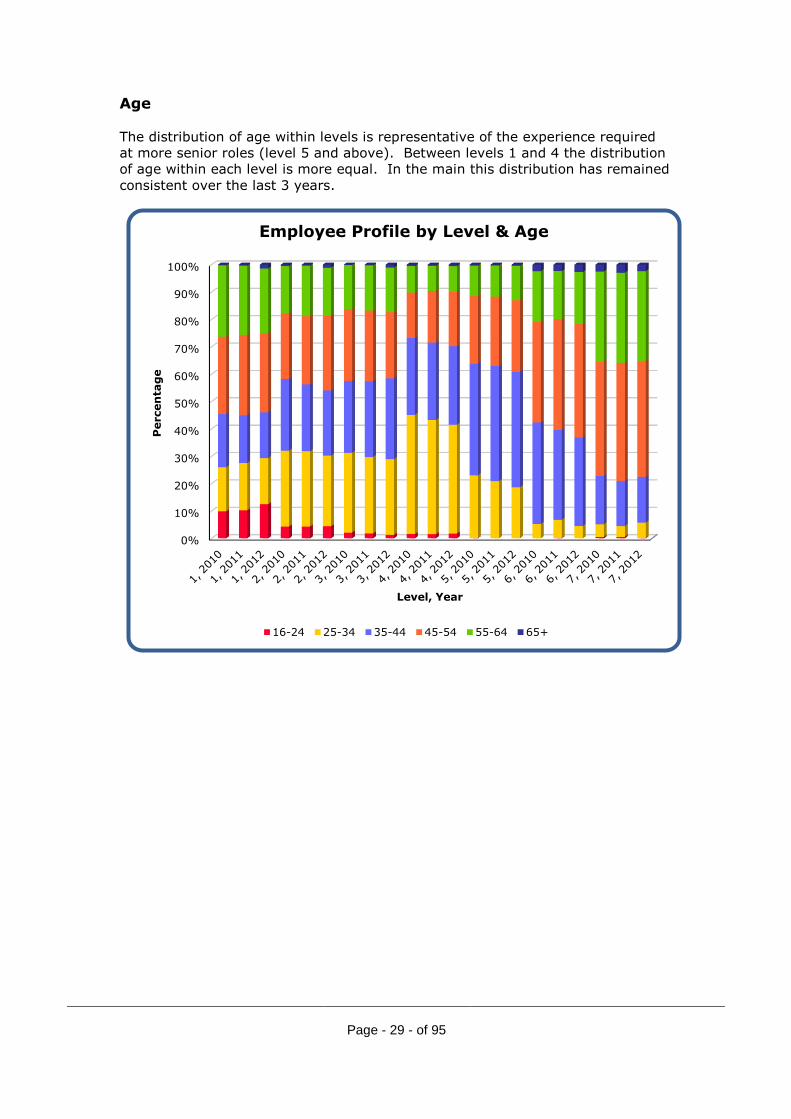
Age
The distribution of age within levels is representative of the experience required
at more senior roles (level 5 and above). Between levels 1 and 4 the distribution
of age within each level is more equal. In the main this distribution has remained
consistent over the last 3 years.
0%
10%
20%
30%
40%
50%
60%
70%
80%
90%
100%
Percen
tag
e
Level, Year
Employee Profile by Level & Age
16-24 25-34 35-44 45-54 55-64 65+

Page - 30 - of 95
Level 16-24 25-34 35-44 45-54 55-64 65+ Total
2010 1 No. 107 174 210 306 281 3 1,081
% 10% 16% 19% 28% 26% 0% 100%
2 No. 36 231 218 199 144 4 832
% 4% 28% 26% 24% 17% 0% 100%
3 No. 16 219 197 197 122 1 752
% 2% 29% 26% 26% 16% 0% 100%
4 No. 28 767 494 293 171 8 1,761
% 2% 44% 28% 17% 10% 0% 100%
5 No. 1 279 497 300 136 4 1,217
% 0% 23% 41% 25% 11% 0% 100%
6 No. 35 247 245 123 16 666
% 5% 37% 37% 18% 2% 100%
7 No. 4 33 127 300 238 18 720
% 1% 5% 18% 42% 33% 3% 100%
No. 192 1,738 1,990 1,840 1,215 54 7,029
% 3% 25% 28% 26% 17% 1% 17%
2011 1 No. 114 192 194 328 281 4 1,113
% 10% 17% 17% 29% 25% 0% 100%
2 No. 37 235 209 213 158 3 855
% 4% 27% 24% 25% 18% 0% 100%
3 No. 14 216 214 200 128 2 774
% 2% 28% 28% 26% 17% 0% 100%
4 No. 27 732 496 332 161 7 1,755
% 2% 42% 28% 19% 9% 0% 100%
5 No. 263 530 319 143 4 1,259
% 21% 42% 25% 11% 0% 100%
6 No. 1 45 222 274 119 16 677
% 0% 7% 33% 40% 18% 2% 100%
7 No. 4 28 117 308 234 21 712
% 1% 4% 16% 43% 33% 3% 100%
No. 197 1,711 1,982 1,974 1,224 57 7,145
% 3% 24% 28% 28% 17% 1% 17%
2012 1 No. 144 195 193 334 274 16 1,156
% 12% 17% 17% 29% 24% 1% 100%
2 No. 37 217 200 230 147 9 840
% 4% 26% 24% 27% 18% 1% 100%
3 No. 10 214 229 187 127 8 775
% 1% 28% 30% 24% 16% 1% 100%
4 No. 32 713 514 357 169 9 1,794
% 2% 40% 29% 20% 9% 1% 100%
5 No. 239 540 335 162 5 1,281
% 19% 42% 26% 13% 0% 100%
6 No. 30 215 276 126 18 665
% 5% 32% 42% 19% 3% 100%
7 No. 1 40 119 303 233 17 713
% 0% 6% 17% 42% 33% 2% 100%
No. 224 1,648 2,010 2,022 1,238 82 7,224
% 3% 23% 28% 28% 17% 1% 17%
Age and level

Page 31 of 95
Occupational Staff Group
The occupational groups for the University are represented as follows:
APM: Administrative, Professional & Managerial
C&M: Clinical & Medical-Related
CCS: Childcare Services
O&F: Operations & Facilities
R&T: Research & Teaching
TS: Technical Services
The occupational groups used are based on the University job families. Where a
member of staff is not in one of the job families, they have been allocated to the
most appropriate job family grouping or the clinical and medical-related staff
group. The largest occupational staff group is research and teaching with 44% of
staff, followed by administrative, professional and managerial staff, who
constitute 30%. The proportion of staff in these staff groups has remained
constant over the past three years. The proportion of staff in the other groups
has remained constant with only minor changes.
2010 2011 2012
No. % No. % No. %
2 0%
APM 2,108 30% 2,133 30% 2,165 30%
C&M 219 3% 231 3% 214 3%
CCS 25 0% 26 0% 27 0%
O&F 972 14% 1,011 14% 1,056 15%
R&T 3,090 44% 3,113 44% 3,128 43%
TS 615 9% 631 9% 632 9%
Total 7,029 100% 7,145 100% 7,224 100%
Occupational Staff Group Profile
0%
10%
20%
30%
40%
50%
60%
70%
80%
90%
100%
2010 2011 2012
No
.
Year
Employee Profile by Occupational Staff Group
TS
R&T
O&F
CCS
C&M
APM
Page 32 of 95
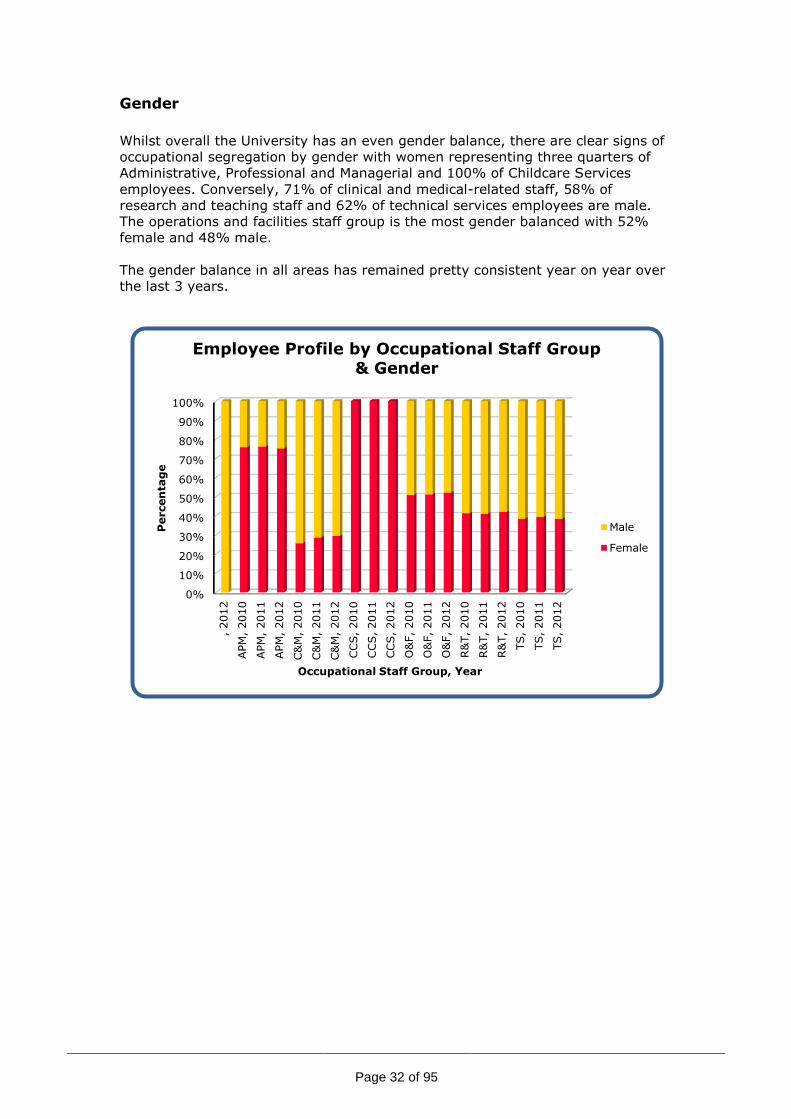
Gender
Whilst overall the University has an even gender balance, there are clear signs of
occupational segregation by gender with women representing three quarters of
Administrative, Professional and Managerial and 100% of Childcare Services
employees. Conversely, 71% of clinical and medical-related staff, 58% of
research and teaching staff and 62% of technical services employees are male.
The operations and facilities staff group is the most gender balanced with 52%
female and 48% male.
The gender balance in all areas has remained pretty consistent year on year over
the last 3 years.
0%
10%
20%
30%
40%
50%
60%
70%
80%
90%
100%
, 2012
APM
, 2010
APM
, 2011
APM
, 2012
C&
M, 2010
C&
M, 2011
C&
M, 2012
CCS, 2010
CCS, 2011
CCS, 2012
O&
F, 2010
O&
F, 2011
O&
F, 2012
R&
T, 2010
R&
T, 2011
R&
T, 2012
TS, 2010
TS, 2011
TS, 2012
Percen
tag
e
Occupational Staff Group, Year
Employee Profile by Occupational Staff Group & Gender
Male
Female
Page 33 of 95
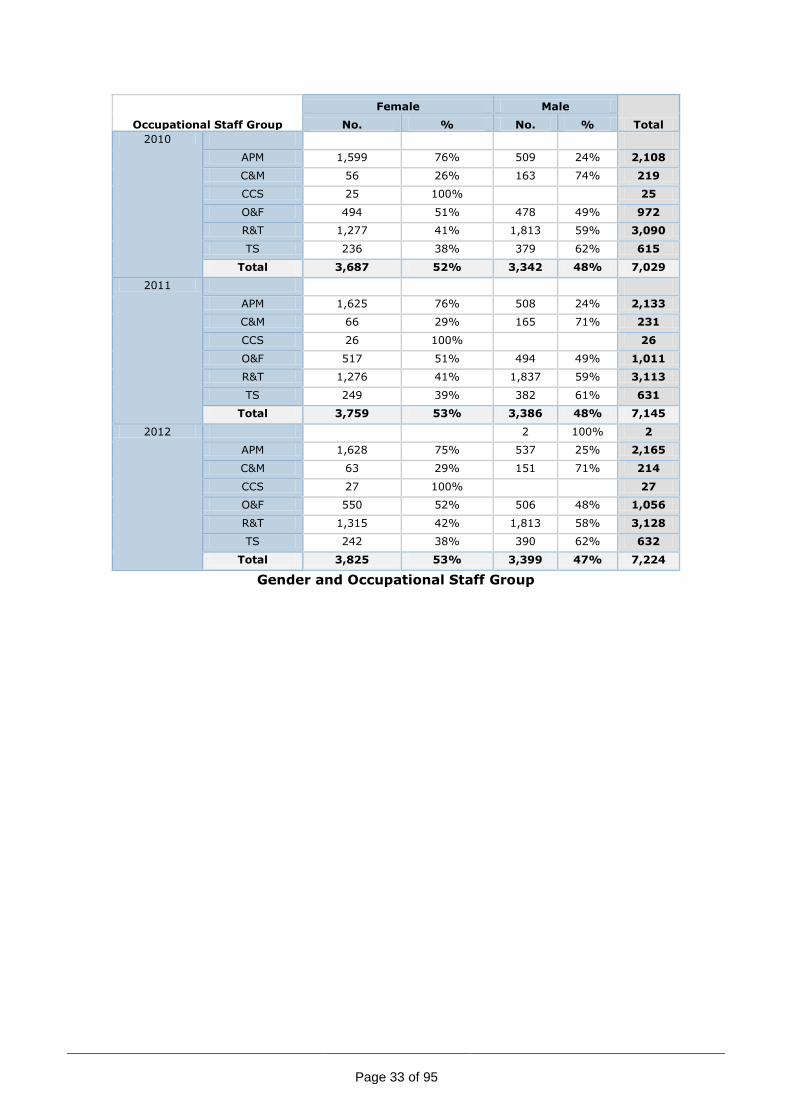
Occupational Staff Group
Female Male
Total No. % No. %
2010 APM 1,599 76% 509 24% 2,108
C&M 56 26% 163 74% 219
CCS 25 100% 25
O&F 494 51% 478 49% 972
R&T 1,277 41% 1,813 59% 3,090
TS 236 38% 379 62% 615
Total 3,687 52% 3,342 48% 7,029
2011 APM 1,625 76% 508 24% 2,133
C&M 66 29% 165 71% 231
CCS 26 100% 26
O&F 517 51% 494 49% 1,011
R&T 1,276 41% 1,837 59% 3,113
TS 249 39% 382 61% 631
Total 3,759 53% 3,386 48% 7,145
2012 2 100% 2
APM 1,628 75% 537 25% 2,165
C&M 63 29% 151 71% 214
CCS 27 100% 27
O&F 550 52% 506 48% 1,056
R&T 1,315 42% 1,813 58% 3,128
TS 242 38% 390 62% 632
Total 3,825 53% 3,399 47% 7,224
Gender and Occupational Staff Group

Page 34 of 95
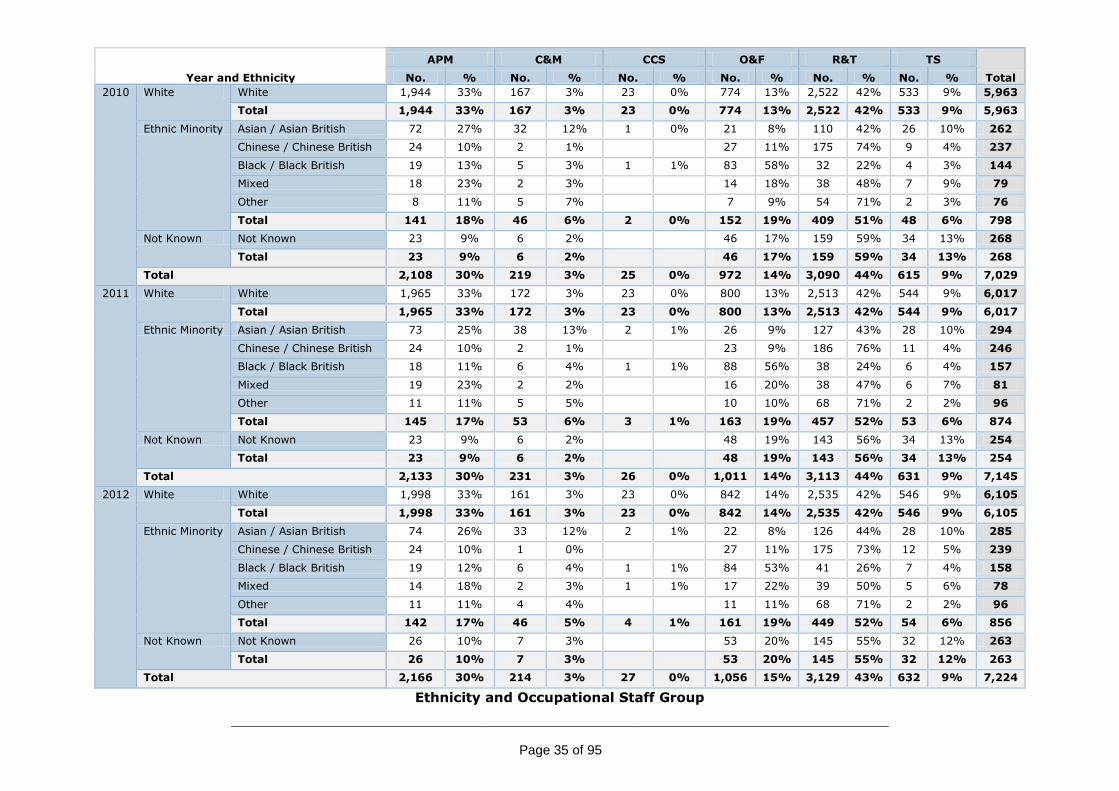
Ethnicity
There is also evidence of occupational segregation by ethnicity, with a
considerably higher proportion of ethnic minority staff in clinical and medical,
research and teaching and operations and facilities roles than in administrative,
professional and managerial or technical services roles. In all of the occupational
staff groups, the proportion of ethnic minority staff between 2010 and 2012
remains quite consistent.
0%
10%
20%
30%
40%
50%
60%
70%
80%
90%
100%
, 2012
APM
, 2010
APM
, 2011
APM
, 2012
C&
M, 2010
C&
M, 2011
C&
M, 2012
CCS, 2010
CCS, 2011
CCS, 2012
O&
F, 2010
O&
F, 2011
O&
F, 2012
R&
T, 2010
R&
T, 2011
R&
T, 2012
TS, 2010
TS, 2011
TS, 2012
Percen
tag
e
Occupational Staff Group, Year
Employee Profile by Occupational Staff Group & Ethnicity
Not Known
Ethnic Minority
White
0%
10%
20%
30%
40%
50%
60%
70%
80%
90%
100%
APM
, 2010
APM
, 2011
APM
, 2012
C&
M, 2010
C&
M, 2011
C&
M, 2012
CCS, 2010
CCS, 2011
CCS, 2012
O&
F, 2010
O&
F, 2011
O&
F, 2012
R&
T, 2010
R&
T, 2011
R&
T, 2012
TS, 2010
TS, 2011
TS, 2012
Pe
rce
nta
ge
Occupational Staff Group, Year
Employee Profile by Occupational Staff Group & Ethnic Minority
Other
Mixed
Black / Black British
Chinese / Chinese British
Asian / Asian British
Page 35 of 95
Year and Ethnicity
APM C&M CCS O&F R&T TS
Total No. % No. % No. % No. % No. % No. %
2010 White White 1,944 33% 167 3% 23 0% 774 13% 2,522 42% 533 9% 5,963
Total 1,944 33% 167 3% 23 0% 774 13% 2,522 42% 533 9% 5,963
Ethnic Minority Asian / Asian British 72 27% 32 12% 1 0% 21 8% 110 42% 26 10% 262
Chinese / Chinese British 24 10% 2 1% 27 11% 175 74% 9 4% 237
Black / Black British 19 13% 5 3% 1 1% 83 58% 32 22% 4 3% 144
Mixed 18 23% 2 3% 14 18% 38 48% 7 9% 79
Other 8 11% 5 7% 7 9% 54 71% 2 3% 76
Total 141 18% 46 6% 2 0% 152 19% 409 51% 48 6% 798
Not Known Not Known 23 9% 6 2% 46 17% 159 59% 34 13% 268
Total 23 9% 6 2% 46 17% 159 59% 34 13% 268
Total 2,108 30% 219 3% 25 0% 972 14% 3,090 44% 615 9% 7,029
2011 White White 1,965 33% 172 3% 23 0% 800 13% 2,513 42% 544 9% 6,017
Total 1,965 33% 172 3% 23 0% 800 13% 2,513 42% 544 9% 6,017
Ethnic Minority Asian / Asian British 73 25% 38 13% 2 1% 26 9% 127 43% 28 10% 294
Chinese / Chinese British 24 10% 2 1% 23 9% 186 76% 11 4% 246
Black / Black British 18 11% 6 4% 1 1% 88 56% 38 24% 6 4% 157
Mixed 19 23% 2 2% 16 20% 38 47% 6 7% 81
Other 11 11% 5 5% 10 10% 68 71% 2 2% 96
Total 145 17% 53 6% 3 1% 163 19% 457 52% 53 6% 874
Not Known Not Known 23 9% 6 2% 48 19% 143 56% 34 13% 254
Total 23 9% 6 2% 48 19% 143 56% 34 13% 254
Total 2,133 30% 231 3% 26 0% 1,011 14% 3,113 44% 631 9% 7,145
2012 White White 1,998 33% 161 3% 23 0% 842 14% 2,535 42% 546 9% 6,105
Total 1,998 33% 161 3% 23 0% 842 14% 2,535 42% 546 9% 6,105
Ethnic Minority Asian / Asian British 74 26% 33 12% 2 1% 22 8% 126 44% 28 10% 285
Chinese / Chinese British 24 10% 1 0% 27 11% 175 73% 12 5% 239
Black / Black British 19 12% 6 4% 1 1% 84 53% 41 26% 7 4% 158
Mixed 14 18% 2 3% 1 1% 17 22% 39 50% 5 6% 78
Other 11 11% 4 4% 11 11% 68 71% 2 2% 96
Total 142 17% 46 5% 4 1% 161 19% 449 52% 54 6% 856
Not Known Not Known 26 10% 7 3% 53 20% 145 55% 32 12% 263
Total 26 10% 7 3% 53 20% 145 55% 32 12% 263
Total 2,166 30% 214 3% 27 0% 1,056 15% 3,129 43% 632 9% 7,224
Ethnicity and Occupational Staff Group

Page 36 of 95
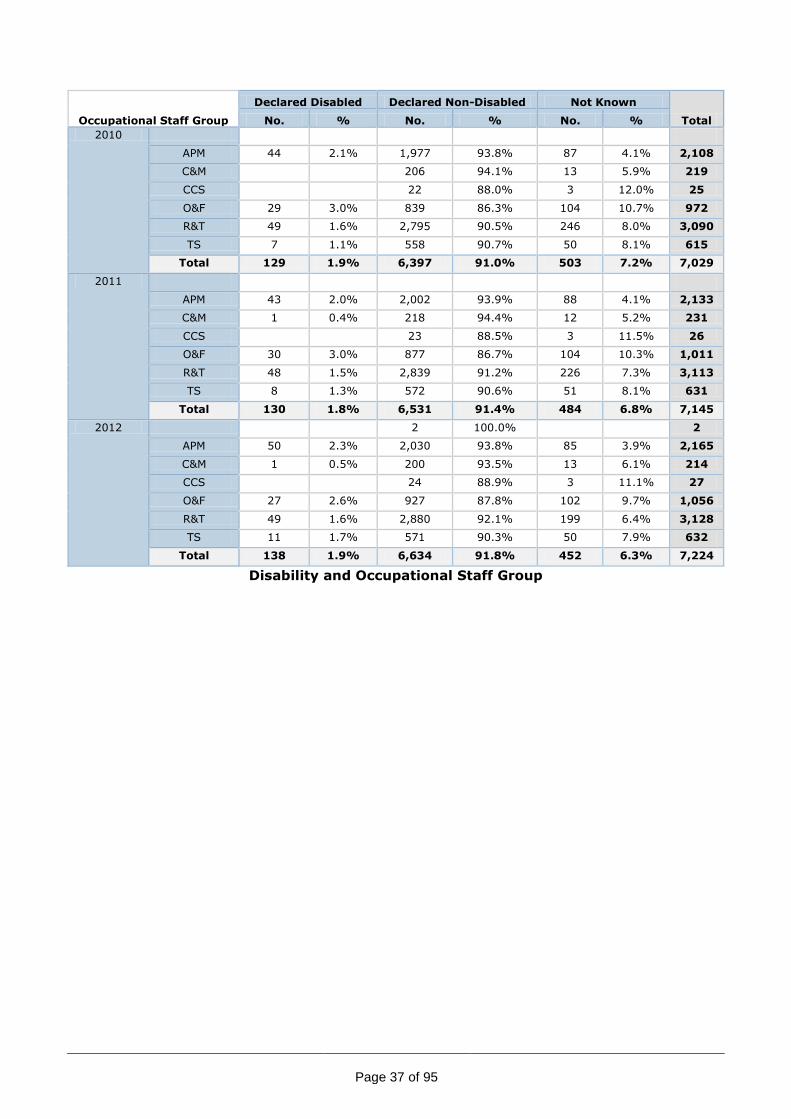
Disability
The largest proportion of declared disabled staff occurs in the operations and facilities and APM
staff groups at 2.6% and 2.3% respectively. There are no declared disabled staff in childcare
services roles. The proportion of staff for whom disability status is unknown is highest in the
childcare services, operations & facilities, research & teaching and technical services staff
groups, all of which have a high proportion of devolved recruitment practices.
0.
0.5
1.
1.5
2.
2.5
3.
APM, 2010
APM, 2011
APM, 2012
C&M, 2011
C&M, 2012
O&F, 2010
O&F, 2011
O&F, 2012
R&T, 2010
R&T, 2011
R&T, 2012
TS, 2010
TS, 2011
TS, 2012
Percen
tag
e
Occupational Staff Group, Year
Employee Profile by Occupational Staff Group & Disability
Declared Disabled
0%
10%
20%
30%
40%
50%
60%
70%
80%
90%
100%
Percen
tag
e
Occupational Staff Group, Year
Employee Profile by Occupational Staff Group & Disability
Declared Disabled Declared Non-Disabled Not Known
Page 37 of 95
Occupational Staff Group
Declared Disabled Declared Non-Disabled Not Known
Total No. % No. % No. %
2010 APM 44 2.1% 1,977 93.8% 87 4.1% 2,108
C&M 206 94.1% 13 5.9% 219
CCS 22 88.0% 3 12.0% 25
O&F 29 3.0% 839 86.3% 104 10.7% 972
R&T 49 1.6% 2,795 90.5% 246 8.0% 3,090
TS 7 1.1% 558 90.7% 50 8.1% 615
Total 129 1.9% 6,397 91.0% 503 7.2% 7,029
2011 APM 43 2.0% 2,002 93.9% 88 4.1% 2,133
C&M 1 0.4% 218 94.4% 12 5.2% 231
CCS 23 88.5% 3 11.5% 26
O&F 30 3.0% 877 86.7% 104 10.3% 1,011
R&T 48 1.5% 2,839 91.2% 226 7.3% 3,113
TS 8 1.3% 572 90.6% 51 8.1% 631
Total 130 1.8% 6,531 91.4% 484 6.8% 7,145
2012 2 100.0% 2
APM 50 2.3% 2,030 93.8% 85 3.9% 2,165
C&M 1 0.5% 200 93.5% 13 6.1% 214
CCS 24 88.9% 3 11.1% 27
O&F 27 2.6% 927 87.8% 102 9.7% 1,056
R&T 49 1.6% 2,880 92.1% 199 6.4% 3,128
TS 11 1.7% 571 90.3% 50 7.9% 632
Total 138 1.9% 6,634 91.8% 452 6.3% 7,224
Disability and Occupational Staff Group

Page 38 of 95
Age
The youngest group is in childcare services where the age band with the largest proportion of
staff is 25 to 34 and 70% of staff are under 35. The APM and research & teaching staff groups
have the largest proportion of staff in the 35 to 44 age band with over 80% of staff aged
between 25 and 54. The clinical and medical-related, operations & facilities and technical
services staff groups have the highest proportion of staff in the 45 to 54 year old age band. In
clinical and medical-related and operations & facilities staff groups over three quarters of staff
are aged 35 to 64, whereas in technical services the age spread is wider with 22% of staff
aged 25 to 34. Across all occupational staff groups the proportion of 16 to 24 year olds has
remained constant over the last 3 years.
0%
10%
20%
30%
40%
50%
60%
70%
80%
90%
100%
Percen
tag
e
Occupational Staff Group, Year
Employee Profile by Occupational Staff Group & Age
16-24 25-34 35-44 45-54 55-64 65+

Page 39 of 95
Occupational Staff Group
16-24 25-34 35-44 45-54 55-64 65+
Total No. % No. % No. % No. % No. % No. %
2010 APM 56 3% 487 23% 643 31% 569 27% 349 17% 4 0% 2,108
C&M 18 8% 54 25% 91 42% 56 26% 219
CCS 5 20% 15 60% 3 12% 2 8% 25
O&F 78 8% 147 15% 202 21% 291 30% 253 26% 1 0% 972
R&T 30 1% 925 30% 943 31% 725 23% 422 14% 45 1% 3,090
TS 23 4% 146 24% 145 24% 162 26% 135 22% 4 1% 615
Total 192 3% 1,738 25% 1,990 28% 1,840 26% 1,215 17% 54 1% 7,029
2011 APM 45 2% 481 23% 640 30% 613 29% 346 16% 8 0% 2,133
C&M 20 9% 61 26% 92 40% 55 24% 3 1% 231
CCS 3 12% 17 65% 4 15% 2 8% 26
O&F 94 9% 153 15% 196 19% 304 30% 264 26% 1,011
R&T 28 1% 895 29% 931 30% 790 25% 427 14% 42 1% 3,113
TS 27 4% 145 23% 150 24% 173 27% 132 21% 4 1% 631
Total 197 3% 1,711 24% 1,982 28% 1,974 28% 1,224 17% 57 1% 7,145
2012 2 100% 2
APM 53 2% 460 21% 647 30% 651 30% 341 16% 13 1% 2,165
C&M 17 8% 57 27% 85 40% 53 25% 2 1% 214
CCS 2 7% 17 63% 6 22% 2 7% 27
O&F 115 11% 156 15% 208 20% 307 29% 258 24% 12 1% 1,056
R&T 26 1% 857 27% 939 30% 816 26% 444 14% 46 1% 3,128
TS 26 4% 141 22% 153 24% 161 25% 142 22% 9 1% 632
Total 224 3% 1,648 23% 2,010 28% 2,022 28% 1,238 17% 82 1% 7,224
Age and Occupational Staff Group
Page 40 of 95
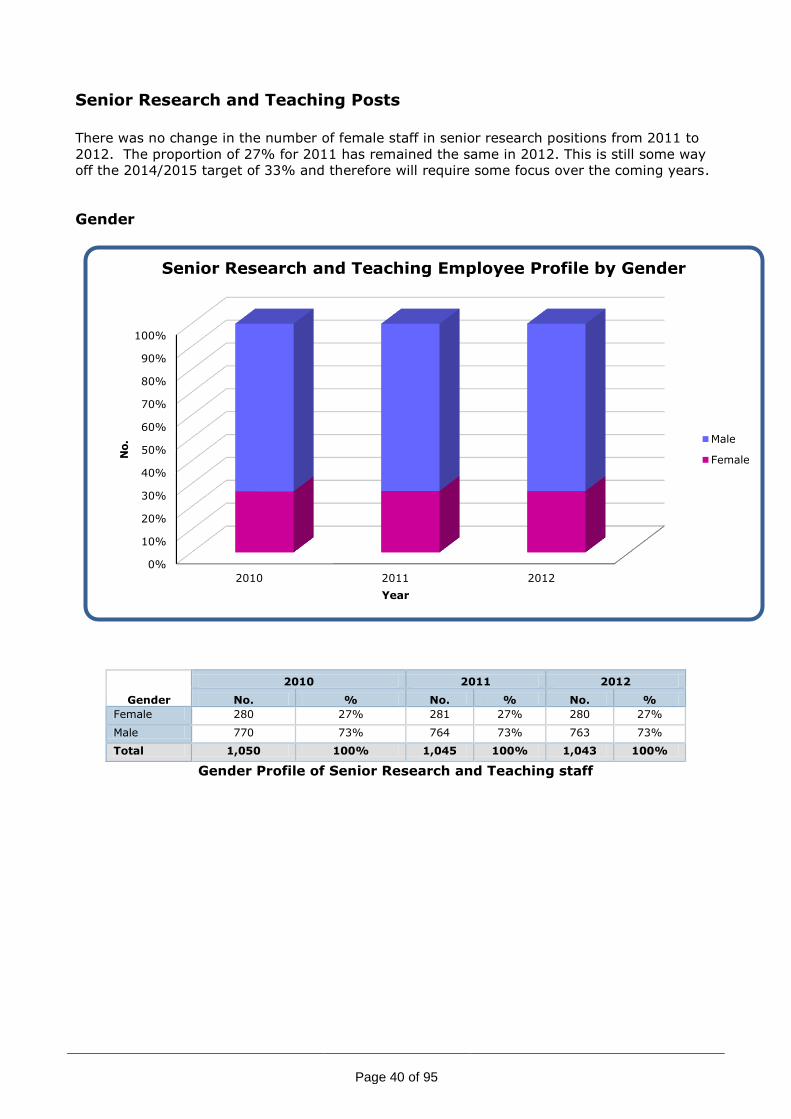
Senior Research and Teaching Posts
There was no change in the number of female staff in senior research positions from 2011 to
2012. The proportion of 27% for 2011 has remained the same in 2012. This is still some way
off the 2014/2015 target of 33% and therefore will require some focus over the coming years.
Gender
Gender
2010 2011 2012
No. % No. % No. %
Female 280 27% 281 27% 280 27%
Male 770 73% 764 73% 763 73%
Total 1,050 100% 1,045 100% 1,043 100%
Gender Profile of Senior Research and Teaching staff
0%
10%
20%
30%
40%
50%
60%
70%
80%
90%
100%
2010 2011 2012
No
.
Year
Senior Research and Teaching Employee Profile by Gender
Male
Female
Page 41 of 95
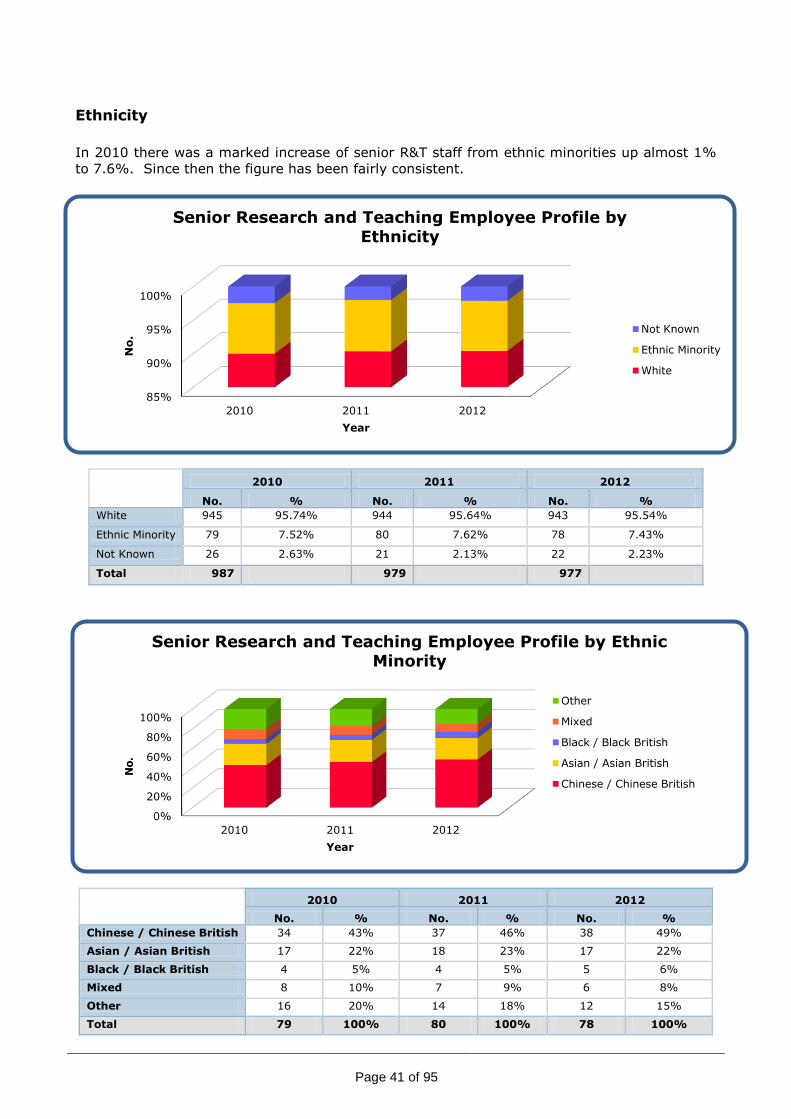
Ethnicity
In 2010 there was a marked increase of senior R&T staff from ethnic minorities up almost 1%
to 7.6%. Since then the figure has been fairly consistent.
2010 2011 2012
No. % No. % No. %
White 945 95.74% 944 95.64% 943 95.54%
Ethnic Minority 79 7.52% 80 7.62% 78 7.43%
Not Known 26 2.63% 21 2.13% 22 2.23%
Total 987 979 977
2010 2011 2012
No. % No. % No. %
Chinese / Chinese British 34 43% 37 46% 38 49%
Asian / Asian British 17 22% 18 23% 17 22%
Black / Black British 4 5% 4 5% 5 6%
Mixed 8 10% 7 9% 6 8%
Other 16 20% 14 18% 12 15%
Total 79 100% 80 100% 78 100%
85%
90%
95%
100%
2010 2011 2012
No
.
Year
Senior Research and Teaching Employee Profile by Ethnicity
Not Known
Ethnic Minority
White
0%
20%
40%
60%
80%
100%
2010 2011 2012
No
.
Year
Senior Research and Teaching Employee Profile by Ethnic Minority
Other
Mixed
Black / Black British
Asian / Asian British
Chinese / Chinese British

Page 42 of 95
Disability
This year there has been a slight fall (0.1%) in the numbers of senior research and teaching
employees declaring themselves as having a disability. This brings the figure back to its 2010
value.
2010 2011 2012
No. % No. % No. %
Declared Disabled 14 1.3% 15 1.4% 14 1.3%
Declared Non-Disabled 997 95.% 995 95.2% 991 95.%
Not Known 39 3.7% 35 3.3% 38 3.6%
Total 1,050 100.% 1,045 100.% 1,043 100.%
Disability Status Profile of Senior Research and Teaching staff
1.28
1.3
1.32
1.34
1.36
1.38
1.4
1.42
1.44
2010 2011 2012
%H
ead
co
un
t fo
r Y
ear
Year
Senior Research and Teaching Employee Profile by Declared Disability (Headcount)
Declared Disabled

Page 43 of 95
Age
As you would expect for senior research and teaching staff the majority of employees are over
35 (94%); this is due to the experience required to achieve this level.
2010 2011 2012
No. % No. % No. %
16-24 4 % 5 % 1 %
25-34 53 5% 58 6% 57 5%
35-44 287 27% 244 23% 236 23%
45-54 398 38% 435 42% 438 42%
55-64 274 26% 272 26% 278 27%
65+ 34 3% 31 3% 33 3%
Total 1,050 100% 1,045 100% 1,043 100%
Age Profile of Senior Research and Teaching staff
0%
10%
20%
30%
40%
50%
60%
70%
80%
90%
100%
2010 2011 2012
No
.
Year
Senior Research and Teaching Employee Profile by Age
65+
55-64
45-54
35-44
25-34
16-24

Page 44 of 95
Recruitment
Recruitment monitoring is based on vacancy closing dates occurring in the University financial
year of 1 August 2011 to 31 July 2012. These figures only refer to centralised recruitment.
Centralised recruitment does not cover most research, operations and facilities and technical
services roles.
Gender
The proportions of male and female applying for roles within the University continues to reflect
the overall proportion of male and female staff currently employed, with a slightly higher
proportion of female applicants at 52%. However it would also appear that, as candidates
progress through the selection process, the proportion of males being shortlisted compared to
the proportion applying decreases slightly from 47% to 44%. Job offered figures are not
available at this time.
Gender
Applied Shortlisted
No. % No. %
Female 17,635 52% 2,683 55%
Male 15,731 47% 2129 44%
Not Known 345 1% 42 1%
Total 33,711 100% 4,854 100%
Proportion of Applicants at Each Recruitment Stage by Gender
0.00
20.00
40.00
60.00
Female Male Not Known
%
Gender
Proportion of Applicants at Each Recruitment Stage by Gender
% Applied
% Shortlisted

Page 45 of 95
Ethnicity
The University continues to attract a higher proportion of applications from ethnic minority
staff compared to the ethnicity demographic for the local area. However, a proportion of these
applications are as a result of online international candidates who do not possess the relevant
qualifications for the post, or who require a work permit and have applied for positions where a
work permit cannot be obtained without first demonstrating that national recruitment has been
unsuccessful. This accounts for the fact that the proportion of ethnic minority candidates drops
significantly from the numbers applied to those shortlisted.
0.00
20.00
40.00
60.00
80.00
Asian /
Asian
British
Black /
Black
British
Chinese /
Chinese
British
Mixed White Other /
Unknown
%
Ethnicity
Proportion of Applicants at Each Recruitment Stage by Ethnicity
% Applied
% Shortlisted
0.00
20.00
40.00
60.00
80.00
White Ethnic Minority Not Known
%
Ethnicity
Proportion of Applicants at Each Recruitment Stage by Ethnicity
% Applied
% Shortlisted

Page 46 of 95
Ethnicity
Applied Shortlisted
No. % No. %
Asian / Asian British 5,547 16.43 463.00 9.52
Black / Black British 1,959 5.80 202.00 4.15
Chinese / Chinese British 1,806 5.35 225.00 4.63
Mixed 856 2.54 114.00 2.34
White 22232 65.86 3,682.00 75.73
Other / Unknown 1355 4.01 176.00 3.62
Total 33,755 100.00 4,862.00 100.00
Page 47 of 95
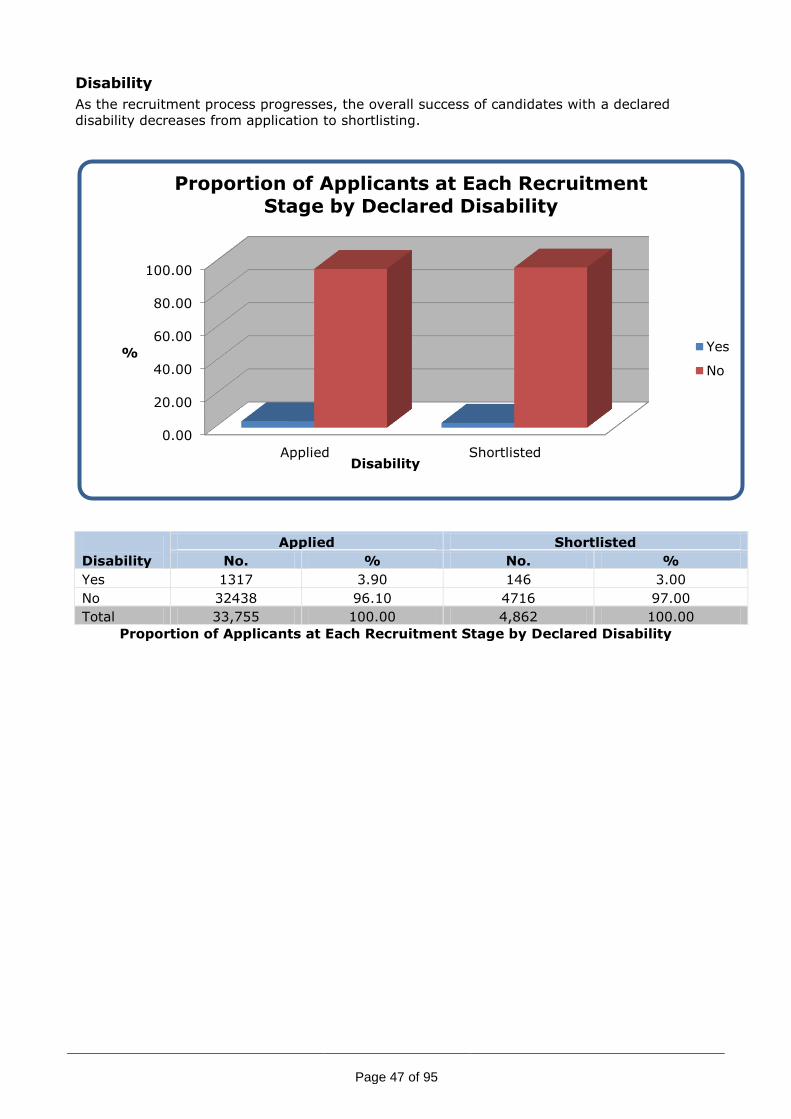
Disability
As the recruitment process progresses, the overall success of candidates with a declared
disability decreases from application to shortlisting.
Disability
Applied Shortlisted
No. % No. %
Yes 1317 3.90 146 3.00
No 32438 96.10 4716 97.00
Total 33,755 100.00 4,862 100.00
Proportion of Applicants at Each Recruitment Stage by Declared Disability
0.00
20.00
40.00
60.00
80.00
100.00
Applied Shortlisted
%
Disability
Proportion of Applicants at Each Recruitment Stage by Declared Disability
Yes
No
Page 48 of 95
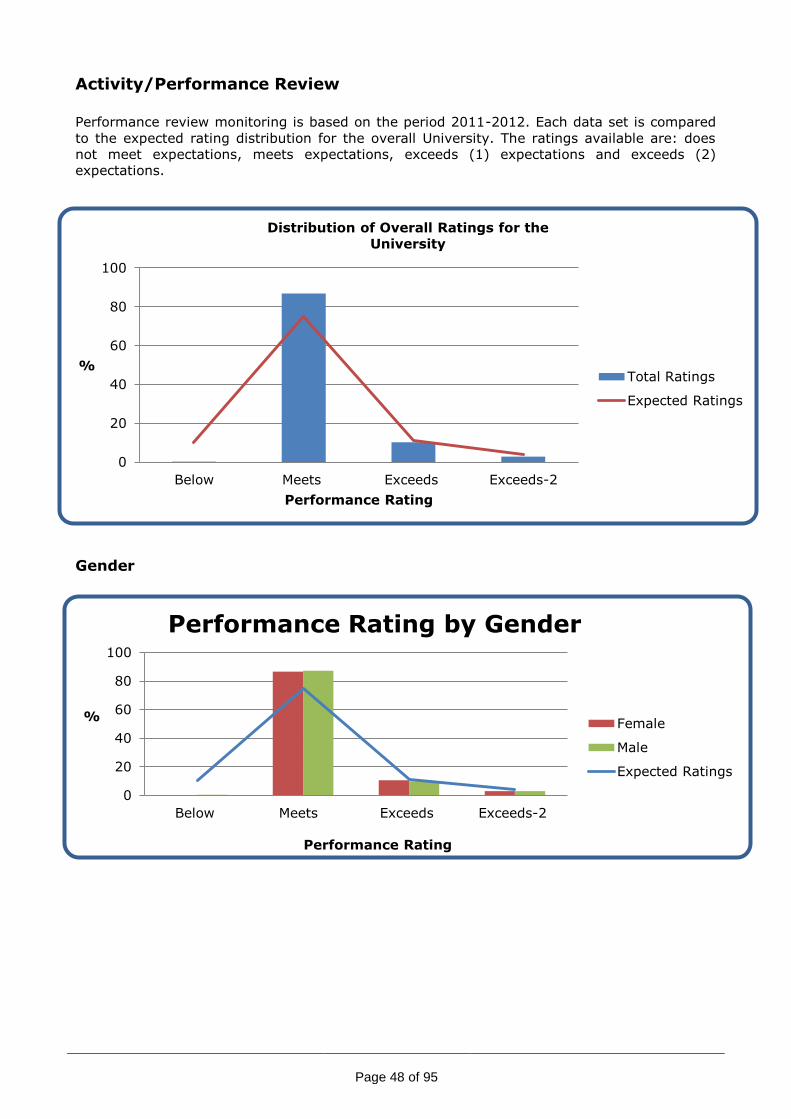
Activity/Performance Review
Performance review monitoring is based on the period 2011-2012. Each data set is compared
to the expected rating distribution for the overall University. The ratings available are: does
not meet expectations, meets expectations, exceeds (1) expectations and exceeds (2)
expectations.
Gender
0
20
40
60
80
100
Below Meets Exceeds Exceeds-2
%
Performance Rating
Distribution of Overall Ratings for the
University
Total Ratings
Expected Ratings
0
20
40
60
80
100
Below Meets Exceeds Exceeds-2
%
Performance Rating
Performance Rating by Gender
Female
Male
Expected Ratings
Page 49 of 95
GENDER Belo
w %
Meets
%
Exceed
s
%
Exceed
s-2
%
Belo
w
No
.
Meets
No
.
Exceed
s
No
.
Exceed
s-2
No
.
TO
TA
L
Expected
Ratings 10 75 11 4
Female 0.1 86.6 10.5 2.8 4 2581 313 82 2980
Male 0.3 87.1 9.8 2.9 6 1911 214 63 2194
Proportion of staff by gender and their performance rating against the University
expected range
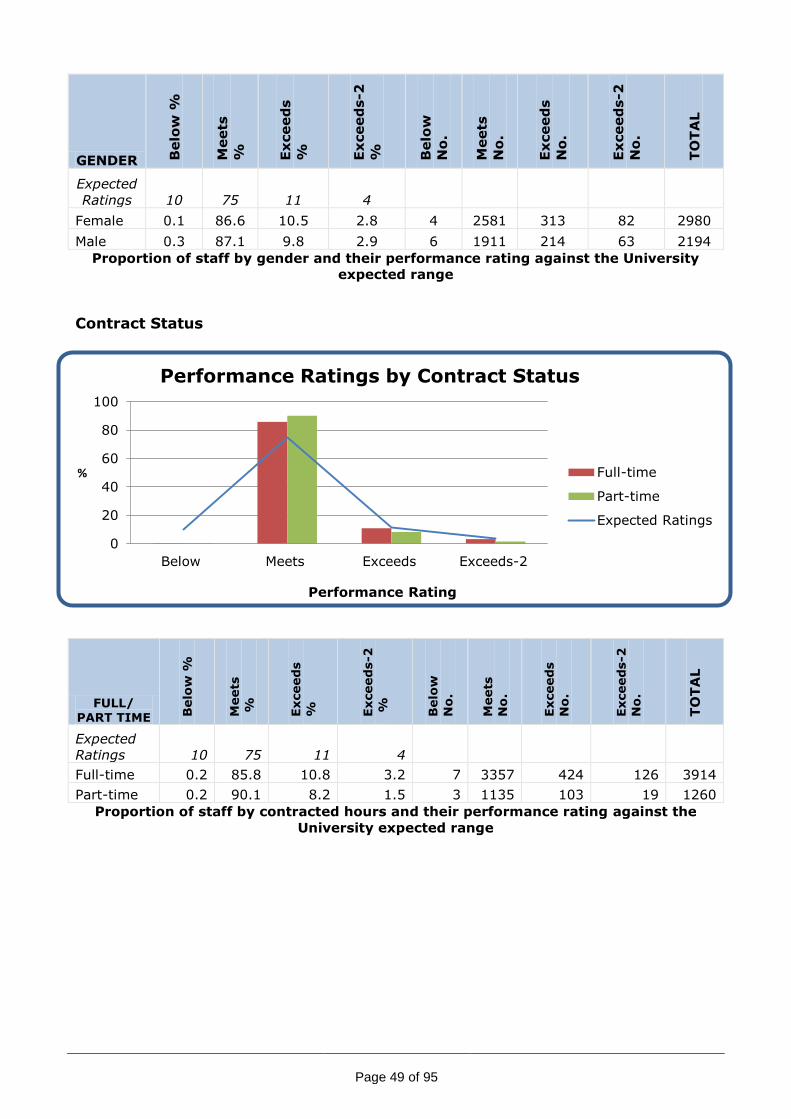
Contract Status
FULL/ PART TIME B
elo
w %
Meets
%
Exceed
s
%
Exceed
s-2
%
Belo
w
No
.
Meets
No
.
Exceed
s
No
.
Exceed
s-2
No
.
TO
TA
L
Expected
Ratings 10 75 11 4
Full-time 0.2 85.8 10.8 3.2 7 3357 424 126 3914
Part-time 0.2 90.1 8.2 1.5 3 1135 103 19 1260
Proportion of staff by contracted hours and their performance rating against the
University expected range
0
20
40
60
80
100
Below Meets Exceeds Exceeds-2
%
Performance Rating
Performance Ratings by Contract Status
Full-time
Part-time
Expected Ratings

Page 50 of 95
Ethnicity
ETHNICITY B
elo
w
%
Meets
%
Exceed
s
%
Exceed
s-2
%
Belo
w
No
.
Meets
No
.
Exceed
s
No
.
Exceed
s-2
No
.
TO
TA
L
Expected
Ratings 10 75 11 4
White 0.1 86 10.9 2.9 6 3841 486 131 4464
BME 0.7 91.7 5.7 1.8 4 496 31 10 541
Unknown 0 91.7 5.9 2.4 0 155 10 4 169
Proportion of staff by ethnicity and their performance rating against the University
expected range
Disability
0
20
40
60
80
100
Below Meets Exceeds Exceeds-2
%
Performance Rating
Performance Rating by Disability
Disabled
Not Disabled
Expected Ratings
0
10
20
30
40
50
60
70
80
90
100
Below Meets Exceeds Exceeds-2
%
Performance Rating
Performance Rating by Ethnicity
White
BME
Unknown
Expected Ratings

Page 51 of 95
DISABILITY Belo
w
%
Meets
%
Exceed
s
%
Exceed
s-2
%
Belo
w
No
.
Meets
No
.
Exceed
s
No
.
Exceed
s-2
No
.
TO
TA
L
Expected Ratings 10 75 11 4
Disabled 0 88 8.7 3.3 0 81 8 3 92
Not Disabled 0.2 86.8 10.2 2.8 10 4411 519 142 5082
Proportion of staff by Disability and their performance rating against the University
expected range
Age
AGE Belo
w
Meets
%
Exceed
s
%
Exceed
s-2
%
Belo
w
No
.
Meets
No
.
Exceed
s
No
.
Exceed
s-2
No
.
TO
TA
L
Expected
Ratings 10 80 11 4
16-25 0 92.9 5.7 1.4 0 131 8 2 141
26-35 0.1 87.4 9.9 2.7 1 1,258 142 39 1,440
36-45 0.4 84.7 11.1 3.8 6 1,361 179 61 1,607
46-55 0.2 86.9 10.6 2.4 2 1,153 140 32 1,327
56-65 0.2 89.3 8.9 1.7 1 582 58 11 652
66+ 0 100 0 0 0 7 0 0 7
0
20
40
60
80
100
120
Below Meets Exceeds Exceeds-2
%
Performance Rating
Performance Rating by Age Distribution
16-25
26-35
36-45
46-55
56-65
66+
Expected Ratings
Page 52 of 95
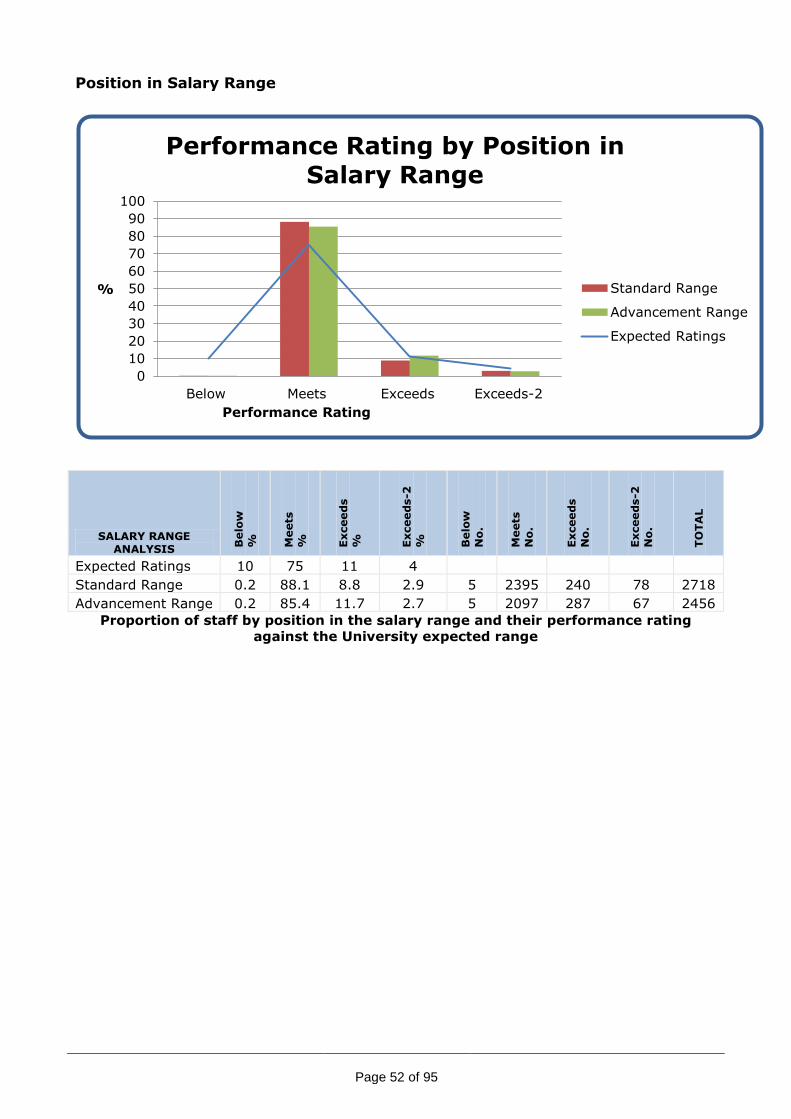
Position in Salary Range
SALARY RANGE ANALYSIS
Belo
w
%
Meets
%
Exceed
s
%
Exceed
s-2
%
Belo
w
No
.
Meets
No
.
Exceed
s
No
.
Exceed
s-2
No
.
TO
TA
L
Expected Ratings 10 75 11 4
Standard Range 0.2 88.1 8.8 2.9 5 2395 240 78 2718
Advancement Range 0.2 85.4 11.7 2.7 5 2097 287 67 2456
Proportion of staff by position in the salary range and their performance rating
against the University expected range
0
10
20
30
40
50
60
70
80
90
100
Below Meets Exceeds Exceeds-2
%
Performance Rating
Performance Rating by Position in Salary Range
Standard Range
Advancement Range
Expected Ratings
Page 53 of 95
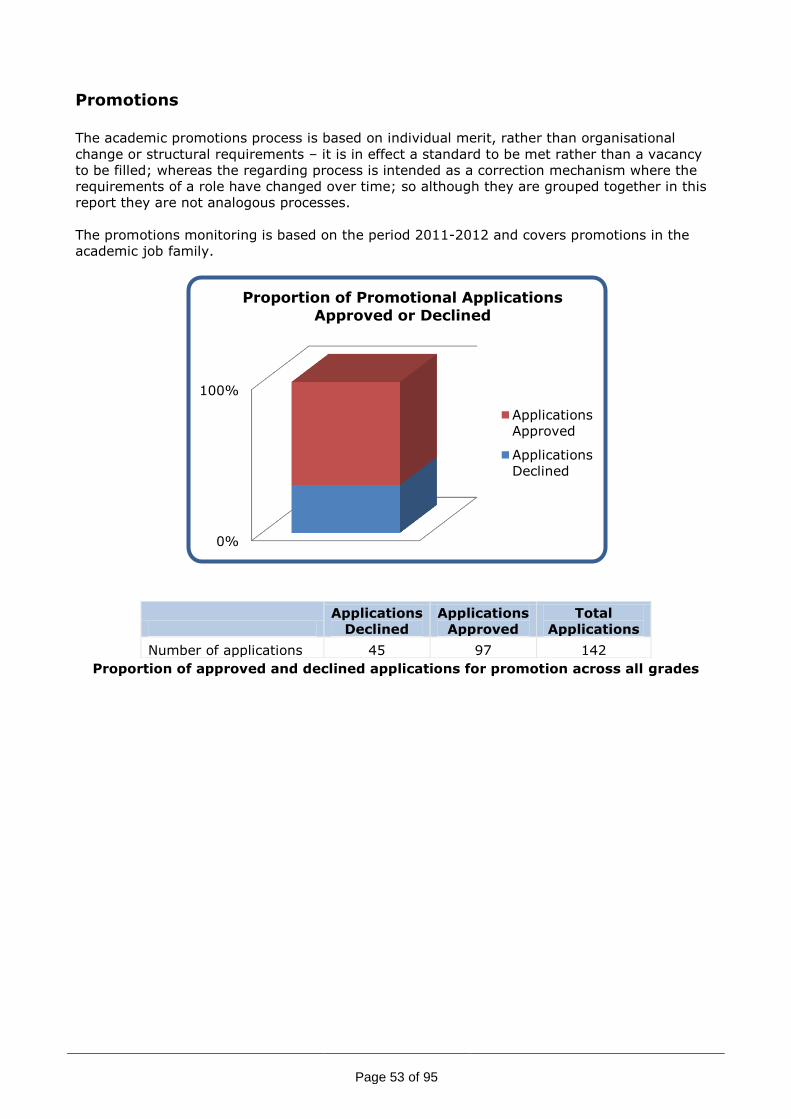
Promotions
The academic promotions process is based on individual merit, rather than organisational
change or structural requirements – it is in effect a standard to be met rather than a vacancy
to be filled; whereas the regarding process is intended as a correction mechanism where the
requirements of a role have changed over time; so although they are grouped together in this
report they are not analogous processes.
The promotions monitoring is based on the period 2011-2012 and covers promotions in the
academic job family.
Proportion of approved and declined applications for promotion across all grades
Applications
Declined
Applications
Approved
Total
Applications
Number of applications 45 97 142
0%
100%
Proportion of Promotional Applications Approved or Declined
Applications
Approved
Applications
Declined

Page 54 of 95
Applicants Grade
Current Grade
Applications
Declined
Applications
Approved Grand Total
Clinical Consultant 0 4 4
R&T Extended Level 5 4 17 21
R&T Level 4 5 15 20
R&T Level 4a 1 2 3
R&T Level 5 17 35 52
R&T Level 6 12 28 40
R&T Level 7 1 0 1
R&T Off scale 0 1 1
Grand Total 40 102 142
Proportion of promotion applications approved or declined by applicant’s grade
0%
50%
100%
%
2012
Proportion of Promotion Applications Approved or Declined by Applicants Grade
Applications Declined
Applications Approved
Page 55 of 95
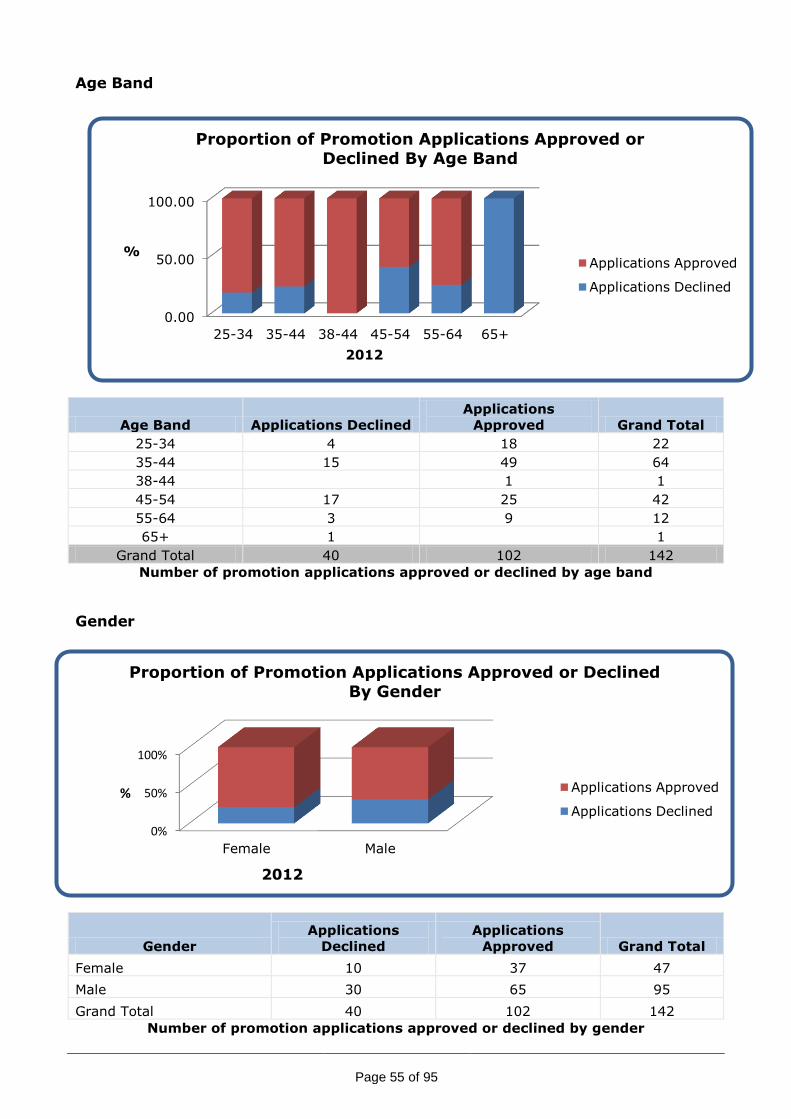
Age Band
Age Band Applications Declined
Applications
Approved Grand Total
25-34 4 18 22
35-44 15 49 64
38-44
1 1
45-54 17 25 42
55-64 3 9 12
65+ 1
1
Grand Total 40 102 142
Number of promotion applications approved or declined by age band
Gender
Gender
Applications
Declined
Applications
Approved Grand Total
Female 10 37 47
Male 30 65 95
Grand Total 40 102 142
Number of promotion applications approved or declined by gender
0.00
50.00
100.00
25-34 35-44 38-44 45-54 55-64 65+
%
2012
Proportion of Promotion Applications Approved or Declined By Age Band
Applications Approved
Applications Declined
0%
50%
100%
Female Male
%
2012
Proportion of Promotion Applications Approved or Declined By Gender
Applications Approved
Applications Declined

Page 56 of 95
Contract Type
Full/Part time Applications Declined
Applications
Approved Grand Total
Full time 40 96 136
Part time 0 6 6
Grand Total 40 102 142
Number of promotion applications approved or declined by contract type
Ethnicity
Ethnic Origin
Applications
Declined
Applications
Approved Grand Total
White 32 82 114
Asian / Asian British 1 8 9
Chinese / Chinese British 4 5 9
Black / Black British 1
1
Mixed 1
1
Unknown 1 7 8
Grand Total 39 95 134
Number of promotion applications approved or declined by ethnic origin
0%
50%
100%
Applications Declined Applications
Approved
%
2012
Proportion of Promotion Applications Approved or Declined By
contract type
Part time
Full time
0%
50%
100%
White Asian /
Asian
British
Chinese
/
Chinese
British
Black /
Black
British
Mixed
%
2012
Proportion of Promotion Applications Approved or Declined By Ethicity
Applications Approved
Applications Declined

Page 57 of 95
Disability
Disability
Applications
Declined
Applications
Approved Grand Total
Disabled 0 1 1
Not Disabled 40 95 135
Unknown 0 6 6
Grand Total 40 102 142
Number of promotion applications approved or declined by disability
0%
50%
100%
Disabled Not Disabled Unknown
%
2012
Proportion of Promotion Applications Approved or Declined By Disability
Applications Approved
Applications Declined

Page 58 of 95
Regrading
The regrading process is available to those staff in the APM and TS job families and is carried
out with reference to the Hay analytical job evaluation scheme implemented at the University.
This process recognises changes in an individual’s role that have already occurred.
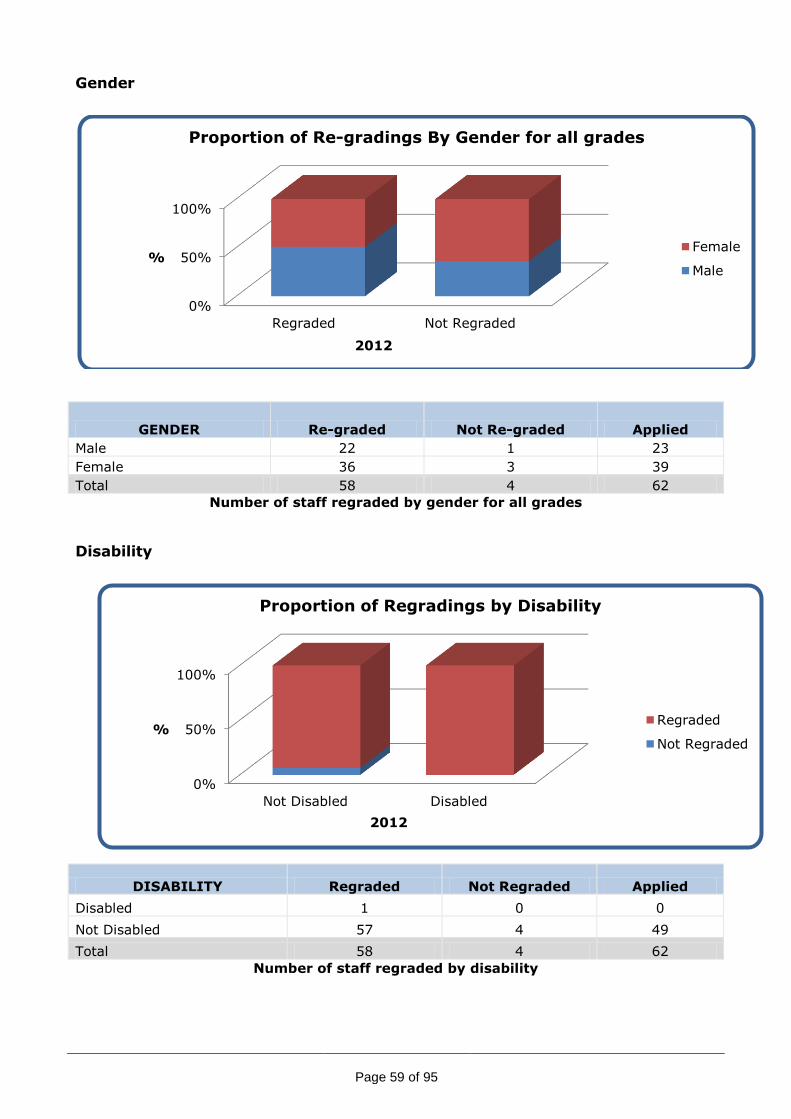
This year, female staff were more successful in the regrading process.
The very small numbers of declared disabled staff make it very difficult to draw meaningful
conclusions from the data.
Re-graded Not Re-graded Applied
All roles considered 58 4 62
Proportion of re-grading for all roles considered
0%
50%
100%
%
2012
All Roles Considered: Approved or Declined
Not Regraded
Regraded
Page 59 of 95
Gender
GENDER Re-graded Not Re-graded Applied
Male 22 1 23
Female 36 3 39
Total 58 4 62
Number of staff regraded by gender for all grades
Disability
DISABILITY Regraded Not Regraded Applied
Disabled 1 0 0
Not Disabled 57 4 49
Total 58 4 62
Number of staff regraded by disability
0%
50%
100%
Regraded Not Regraded
%
2012
Proportion of Re-gradings By Gender for all grades
Female
Male
0%
50%
100%
Not Disabled Disabled
%
2012
Proportion of Regradings by Disability
Regraded
Not Regraded
Page 60 of 95
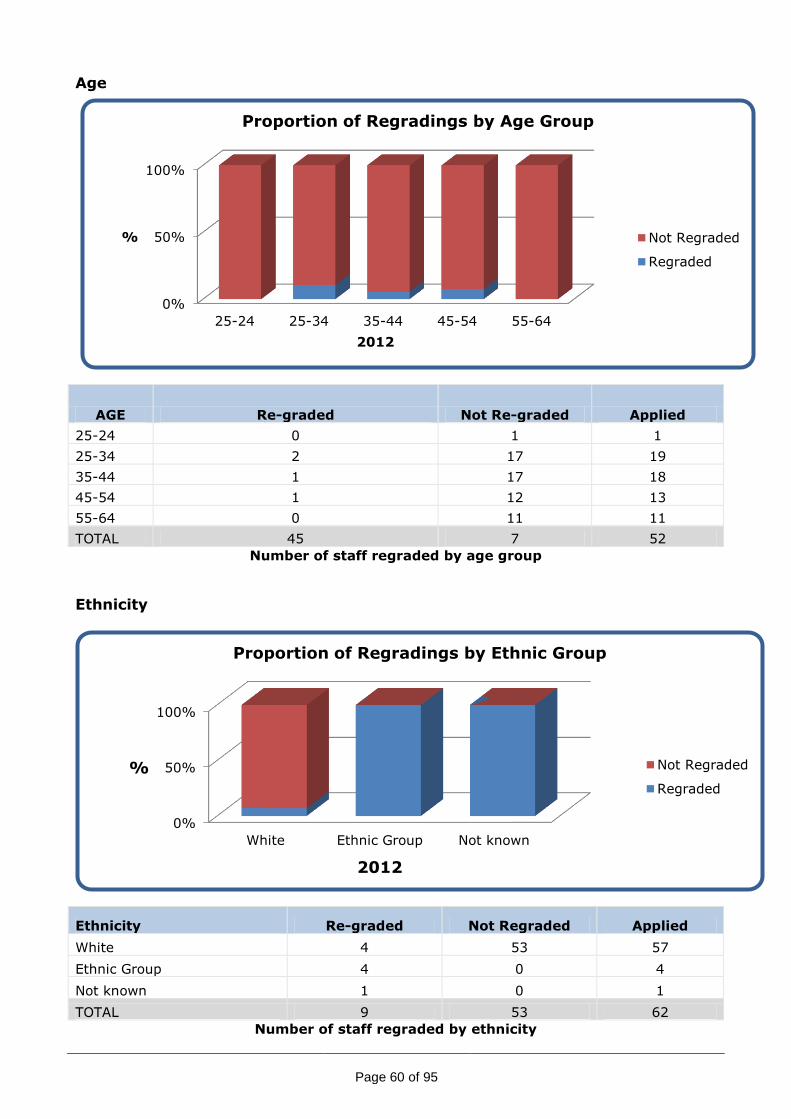
Age
AGE Re-graded Not Re-graded Applied
25-24 0 1 1
25-34 2 17 19
35-44 1 17 18
45-54 1 12 13
55-64 0 11 11
TOTAL 45 7 52
Number of staff regraded by age group
Ethnicity
Ethnicity Re-graded Not Regraded Applied
White 4 53 57
Ethnic Group 4 0 4
Not known 1 0 1
TOTAL 9 53 62
Number of staff regraded by ethnicity
0%
50%
100%
25-24 25-34 35-44 45-54 55-64
%
2012
Proportion of Regradings by Age Group
Not Regraded
Regraded
0%
50%
100%
White Ethnic Group Not known
%
2012
Proportion of Regradings by Ethnic Group
Not Regraded
Regraded
Page 61 of 95
Training
Introduction:
Equality and Diversity training, delivered by the University’s Professional Development Unit,
supports implementation of the University Staff Equality and Diversity Strategy, including the
promotion of good relations, across a wide range of activities. To achieve these aims, the Unit
provides a range of training and development opportunities including:
Equal Opportunity and Disability Workshops offered as part of the Central Short Course
Programme (Appendix 1)
A range of programmes, specialist sessions and central short course programme
workshops with clear equality and diversity content identified through an audit of
provision 2011. This includes ‘Teaching a Diverse Audience’ sessions for Postgraduate
Certificate of Education, Associate Teachers Programme and Intensive Learning and
Teaching Programmes (appendix 2).
Two online learning packages (available to all staff) entitled ‘Managing Diversity’ and a
‘Diversity in Learning and Teaching’.
One hour Equality and Diversity update sessions for schools, delivered by Professional
Development and Funding for ‘Drama for Training’ sessions for specific schools
This report identifies:
1. Attendance, over the period 2010-12, at workshops with a specific equality and
diversity focus by job family, gender and age.
2. Attendance over the period 2010-12 at any central short course programme by job
family, gender and age.
3. Analysis against other relevant KPIs: Recruitment and selection training for managers;
Positive action programmes; NVQs; School-based update sessions.
KPI: Monitoring and evaluation of relevant training to be published annually
Overview
Professional Development offers specific Equal Opportunity and Disability Workshops offered as
part of the Central Short Course Programme (Appendix 1). Additionally in the academic year
2011-2012 has carried out an internal audit of all Central Short Course programmes and
development programmes to identify where equality and diversity-relevant material is included
within the broader provision (Appendix 2).
Both of these sources have been used to identify attendance at relevant training, referred to in
this report as training with an equality and diversity focus. Data has been drawn from a two
year period, 2012-11 and 2011-12, and where possible trends identified. This particular two
year period has been selected as the Central Short Course database went live on 1st October
2010 and so reporting is uniform across this period. Data has been presented from the data
fields within the database.
There is no disaggregation by disability or ethnicity as connection between resource-link and
Dante (central short course programme database) is on the IS development schedule, and not
easily available. PD intend to publish data in these categories in future reports.
Analysis
This section identifies attendance, over the 2010-2012 period, at workshops with a specific
equality and diversity focus by:
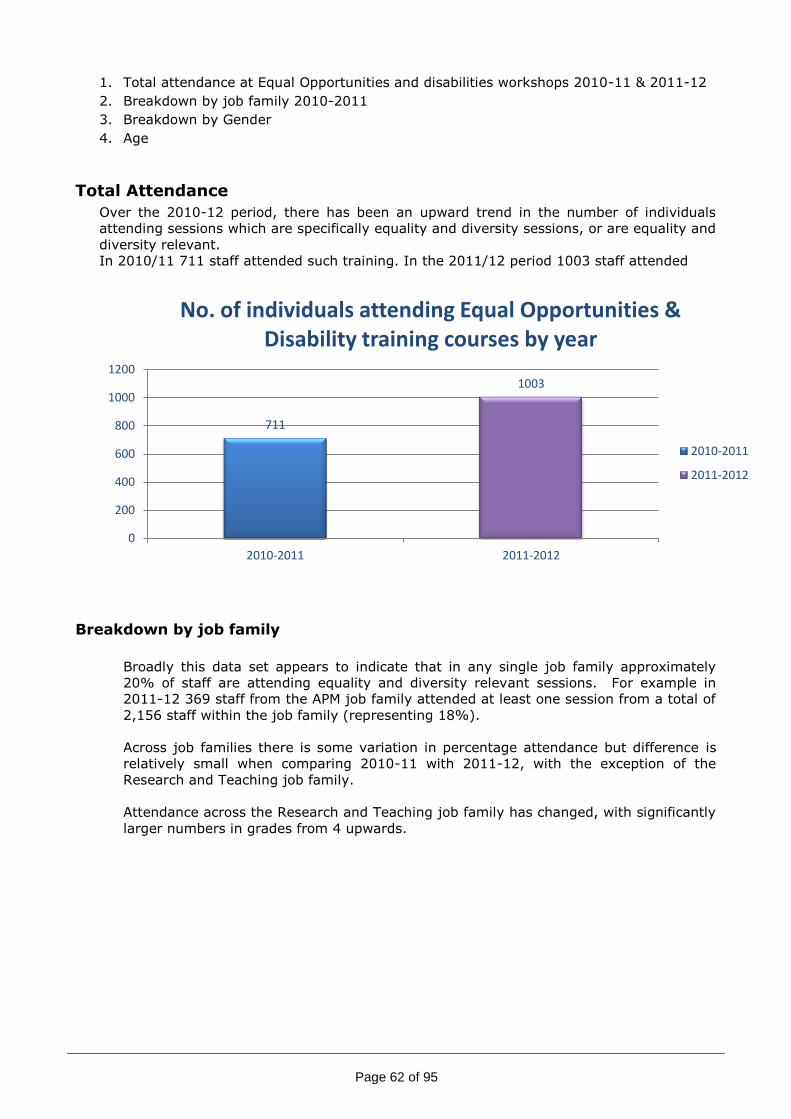
Page 62 of 95
1. Total attendance at Equal Opportunities and disabilities workshops 2010-11 & 2011-12
2. Breakdown by job family 2010-2011
3. Breakdown by Gender
4. Age
Total Attendance
Over the 2010-12 period, there has been an upward trend in the number of individuals
attending sessions which are specifically equality and diversity sessions, or are equality and
diversity relevant.
In 2010/11 711 staff attended such training. In the 2011/12 period 1003 staff attended
Breakdown by job family
Broadly this data set appears to indicate that in any single job family approximately
20% of staff are attending equality and diversity relevant sessions. For example in
2011-12 369 staff from the APM job family attended at least one session from a total of
2,156 staff within the job family (representing 18%).
Across job families there is some variation in percentage attendance but difference is
relatively small when comparing 2010-11 with 2011-12, with the exception of the
Research and Teaching job family.
Attendance across the Research and Teaching job family has changed, with significantly
larger numbers in grades from 4 upwards.
711
1003
0
200
400
600
800
1000
1200
2010-2011 2011-2012
No. of individuals attending Equal Opportunities & Disability training courses by year
2010-2011
2011-2012

Page 63 of 95
62
5
11
20
1
1
2
3
1
2
1
19
1
29
9
1
11
49
38
1
8
1
39
1
5
1
6
2
1
91
1
1
1
1
1
8
35
2
44
61
100
34
0 20 40 60 80 100 120
(blank)
TS5
TS4
TS3
TS2
TS1
RTOFF-T
RTOFF-R
RTOFF-A
RT7X-A
RT7-R
RT7-A
RT6-R
RT6-A
RT5-T
RT5-S
RT5-R
RT5E-A
RT5-A
RT4T-R
RT4-T
RT4-S
RT4-R
RT4A-T
RT4A-R
RESMEDFELL
OFOFF
OF3
OF2
OF1
CLPROFNCA
CLLECT
CLCONSNCB
APM7X
APM7
APM6
APM5
APM4T
APM4
APM3
APM2
APM1
No. of people attending an Equal Opportunites & Disability training course between October 2010 &
August 2011 by Job Family
Total
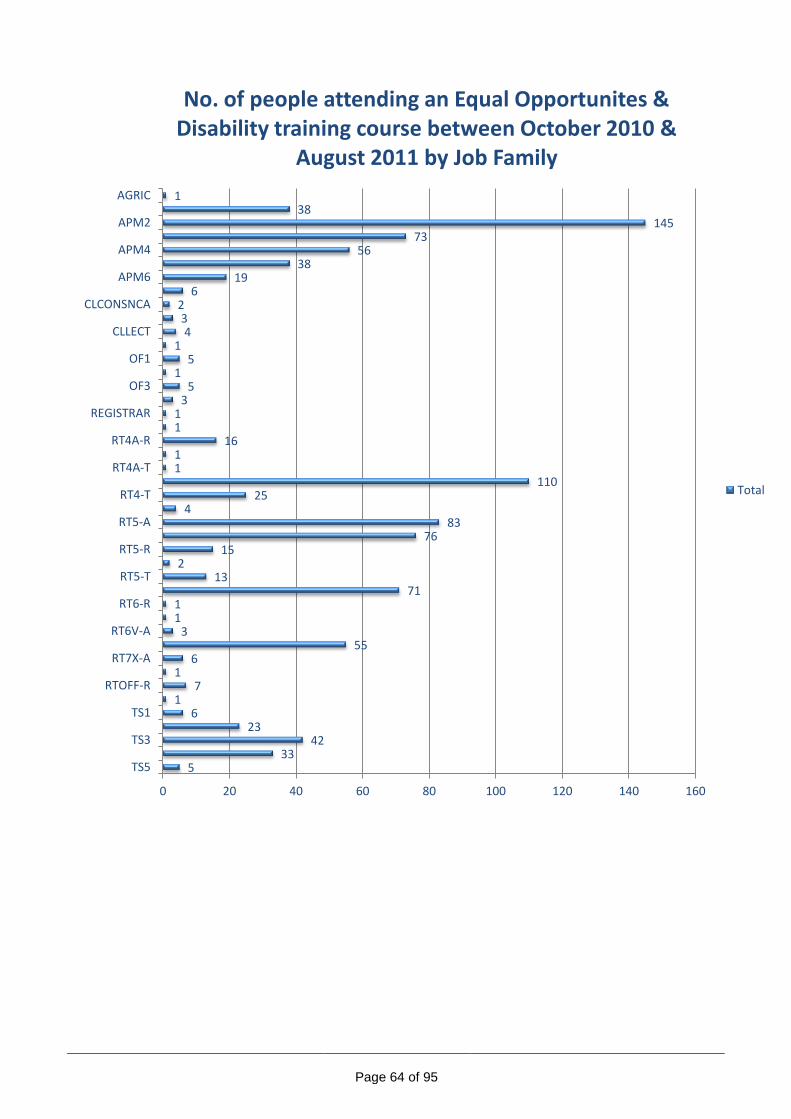
Page 64 of 95
5 33
42 23
6 1
7 1
6 55
3 1 1
71 13
2 15
76 83
4 25
110 1 1
16 1 1
3 5
1 5
1 4
3 2
6 19
38 56
73 145
38 1
0 20 40 60 80 100 120 140 160
TS5
TS3
TS1
RTOFF-R
RT7X-A
RT6V-A
RT6-R
RT5-T
RT5-R
RT5-A
RT4-T
RT4A-T
RT4A-R
REGISTRAR
OF3
OF1
CLLECT
CLCONSNCA
APM6
APM4
APM2
AGRIC
No. of people attending an Equal Opportunites & Disability training course between October 2010 &
August 2011 by Job Family
Total
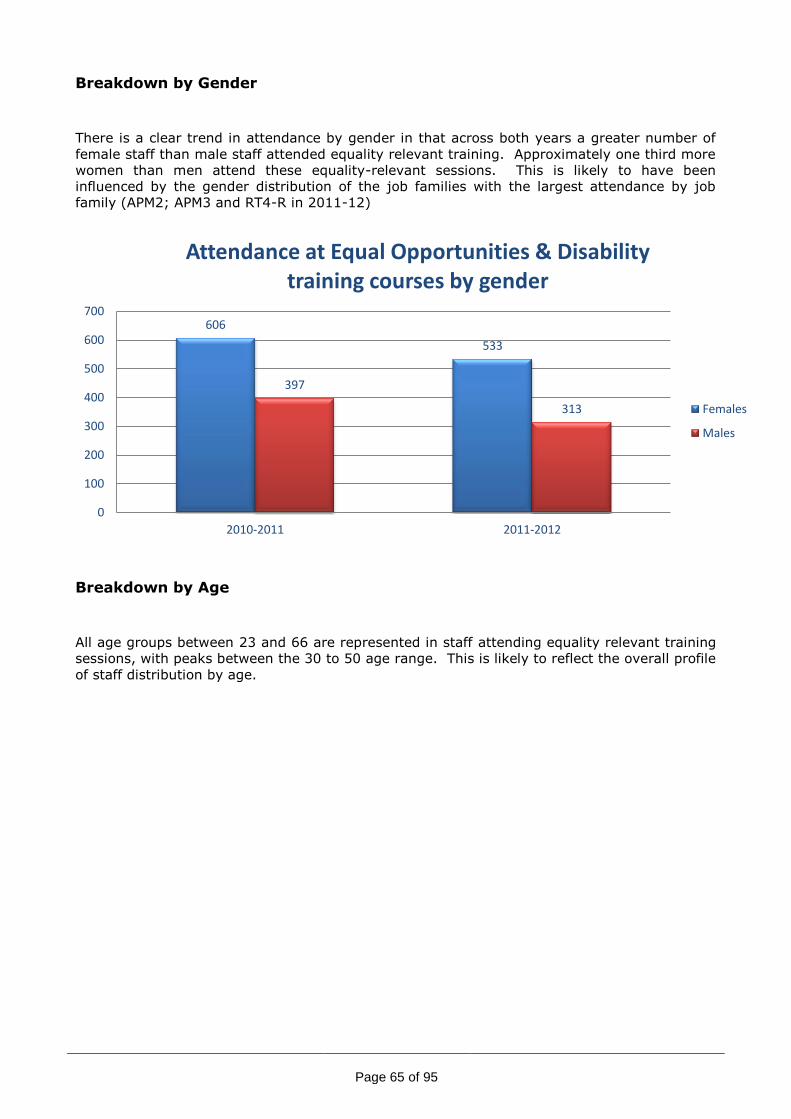
Page 65 of 95
Breakdown by Gender
There is a clear trend in attendance by gender in that across both years a greater number of
female staff than male staff attended equality relevant training. Approximately one third more
women than men attend these equality-relevant sessions. This is likely to have been
influenced by the gender distribution of the job families with the largest attendance by job
family (APM2; APM3 and RT4-R in 2011-12)
Breakdown by Age
All age groups between 23 and 66 are represented in staff attending equality relevant training
sessions, with peaks between the 30 to 50 age range. This is likely to reflect the overall profile
of staff distribution by age.
606
533
397
313
0
100
200
300
400
500
600
700
2010-2011 2011-2012
Attendance at Equal Opportunities & Disability training courses by gender
Females
Males

Page 66 of 95
2 4
10
14
10 13 12
15
27 25
19
34
19
26 24
31
24 26
22 19
24 23
16 19
9
17
25
14
18 18 15 16
22
9 10
5
14 13
9 9 10
4 7
5 2 1
0
5
10
15
20
25
30
35
40
20 22 23 24 25 26 27 28 29 30 31 32 33 34 35 36 37 38 39 40 41 42 43 44 45 46 47 48 49 50 51 52 53 54 55 56 57 58 59 60 61 62 63 64 65 66
Age profile of people attending an Equal Opportunities & Disability training course between October 2010 and
August 2011.
12 9
11 14
21
27 31 32
42
49
39 40
35 32
29
35
29
24
42 39
30 28
25
43
35
20 22
16
22
16 20
17
11 12 14
19
12 8
12
4 6
9
4 1
0
10
20
30
40
50
60
23 24 25 26 27 28 29 30 31 32 33 34 35 36 37 38 39 40 41 42 43 44 45 46 47 48 49 50 51 52 53 54 55 56 57 58 59 60 61 62 63 64 65 66
Age profile of people attending an Equal Opportunities & Disability training course between September 2011
and August 2012.
Total
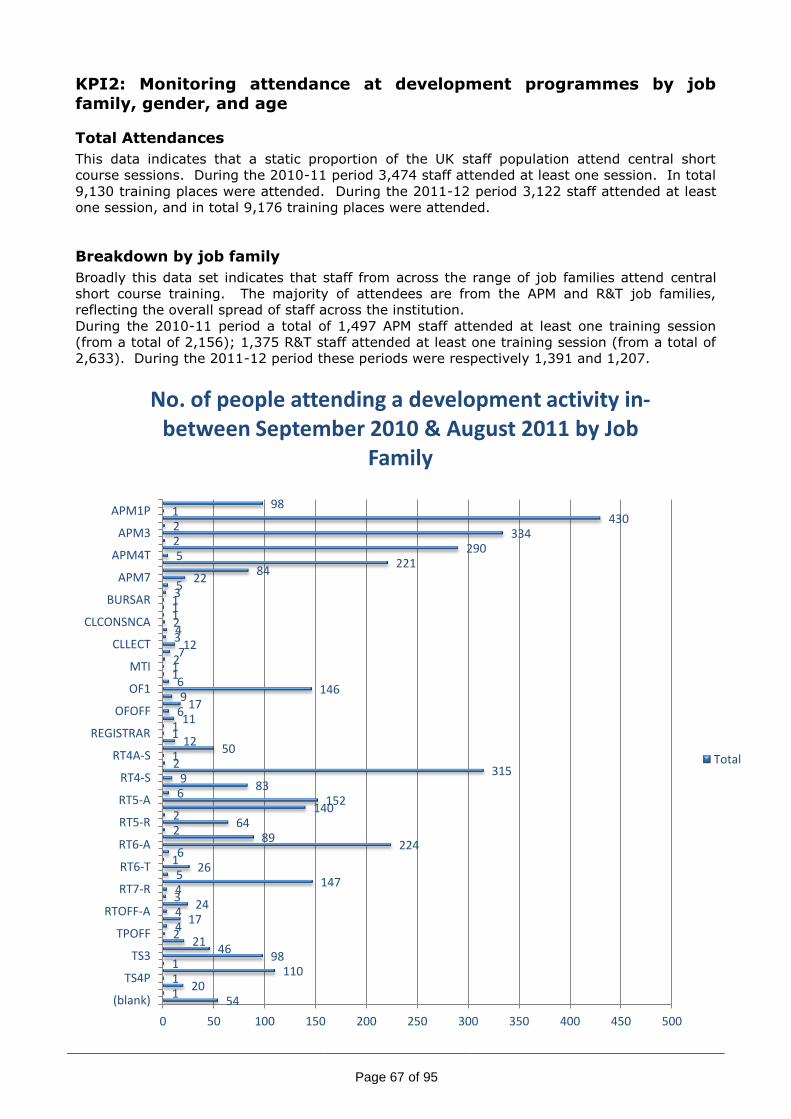
Page 67 of 95
KPI2: Monitoring attendance at development programmes by job
family, gender, and age
Total Attendances
This data indicates that a static proportion of the UK staff population attend central short
course sessions. During the 2010-11 period 3,474 staff attended at least one session. In total
9,130 training places were attended. During the 2011-12 period 3,122 staff attended at least
one session, and in total 9,176 training places were attended.
Breakdown by job family
Broadly this data set indicates that staff from across the range of job families attend central
short course training. The majority of attendees are from the APM and R&T job families,
reflecting the overall spread of staff across the institution.
During the 2010-11 period a total of 1,497 APM staff attended at least one training session
(from a total of 2,156); 1,375 R&T staff attended at least one training session (from a total of
2,633). During the 2011-12 period these periods were respectively 1,391 and 1,207.
54 1
20 1
110 1
98 46
21 2 4
17 4
24 3 4
147 5
26 1 6
224 89
2 64
2 140
152 6
83 9
315 2 1
50 12
1 1
11 6
17 9
146 6
1 1 2 7 12
3 4 2 1 1 1 3 5
22 84
221 5
290 2
334 2
430 1
98
0 50 100 150 200 250 300 350 400 450 500
(blank)
TS4P
TS3
TPOFF
RTOFF-A
RT7-R
RT6-T
RT6-A
RT5-R
RT5-A
RT4-S
RT4A-S
REGISTRAR
OFOFF
OF1
MTI
CLLECT
CLCONSNCA
BURSAR
APM7
APM4T
APM3
APM1P
No. of people attending a development activity in-between September 2010 & August 2011 by Job
Family
Total
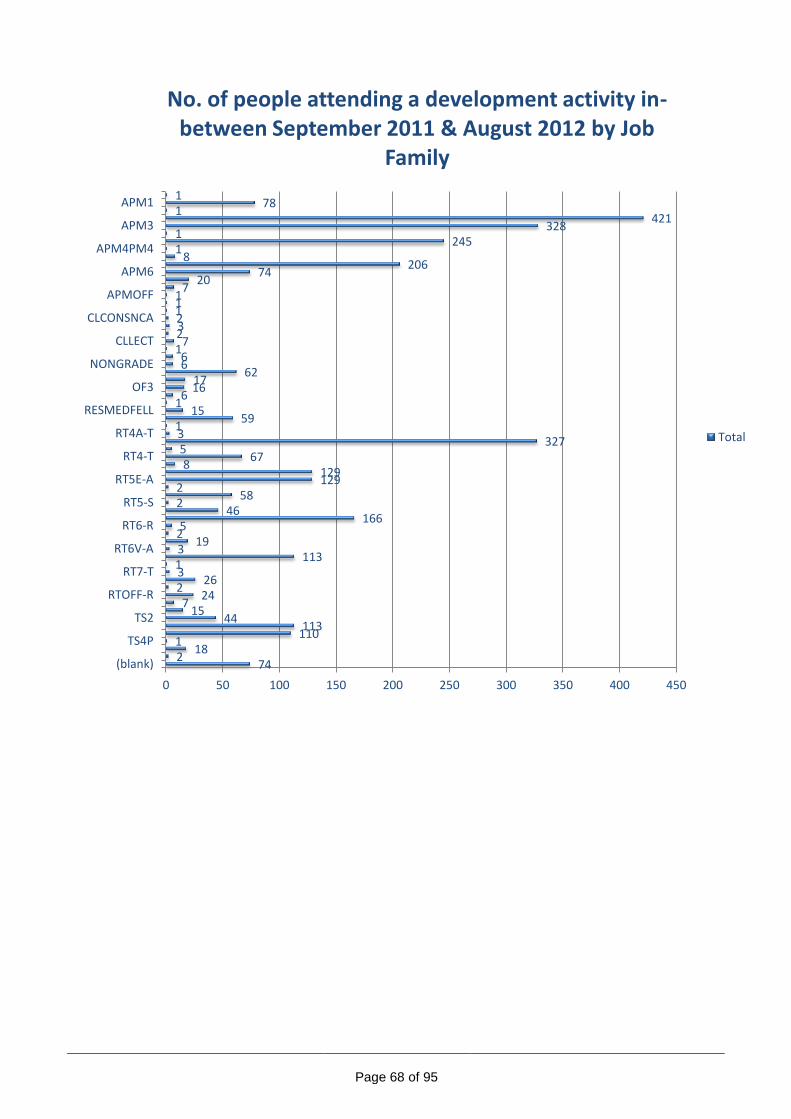
Page 68 of 95
74 2
18 1
110 113
44 15
7 24
2 26
3 1
113 3
19 2 5
166 46
2 58
2 129 129
8 67
5 327
3 1
59 15
1 6
16 17
62 6 6
1 7
2 3 2 1 1 1
7 20
74 206
8 1
245 1
328 421
1 78
1
0 50 100 150 200 250 300 350 400 450
(blank)
TS4P
TS2
RTOFF-R
RT7-T
RT6V-A
RT6-R
RT5-S
RT5E-A
RT4-T
RT4A-T
RESMEDFELL
OF3
NONGRADE
CLLECT
CLCONSNCA
APMOFF
APM6
APM4PM4
APM3
APM1
No. of people attending a development activity in-between September 2011 & August 2012 by Job
Family
Total

Page 69 of 95
Breakdown by Gender
Similar to analysis by equality and diversity focussed sessions, there is a clear trend in
attendance by gender in that a greater number of female staff than male staff attended
equality relevant training. Approximately one third more women than men attend these
equality-relevant sessions. This is likely to have been influenced by the gender distribution of
the job families with the largest attendance by job family (APM2; APM3 and RT4-R in 2011-
12).
In the 2010-11 approximately one third more women than men attended these sessions.
2158
1317
0
500
1000
1500
2000
2500
Females Males
No. of people who attended a developmental session from September 2010 to August 2011
Females
Males
1933
1189
0
500
1000
1500
2000
2500
Females Males
No. of people who attended a developmental session from September 2011 to August 2012
Females
Males

Page 70 of 95
Breakdown by Age
Similar to analysis by equality and diversity focussed sessions, all age groups between 23 and
66 are represented in staff attending equality relevant training sessions, with peaks between
the 28 to 54 age range. This is likely to reflect the overall profile of staff distribution by age.
0
20
40
60
80
100
120
140
20
22
24
26
28
30
32
34
36
38
40
42
44
46
48
50
52
54
56
58
60
62
64
66
68
11
2
2 1 8
13
22 20
41 41
61
89 91
113
129
102 106
101
110
95
115
103 102 106
113
97 95 94
115
102 96
105
91
103 101 97
80
67 63
57
90
59 51
46
31 29 31
20 12
4 2 2
51
Total number of people by age who attended a development session in-between September 2010 and
August 2011
Total
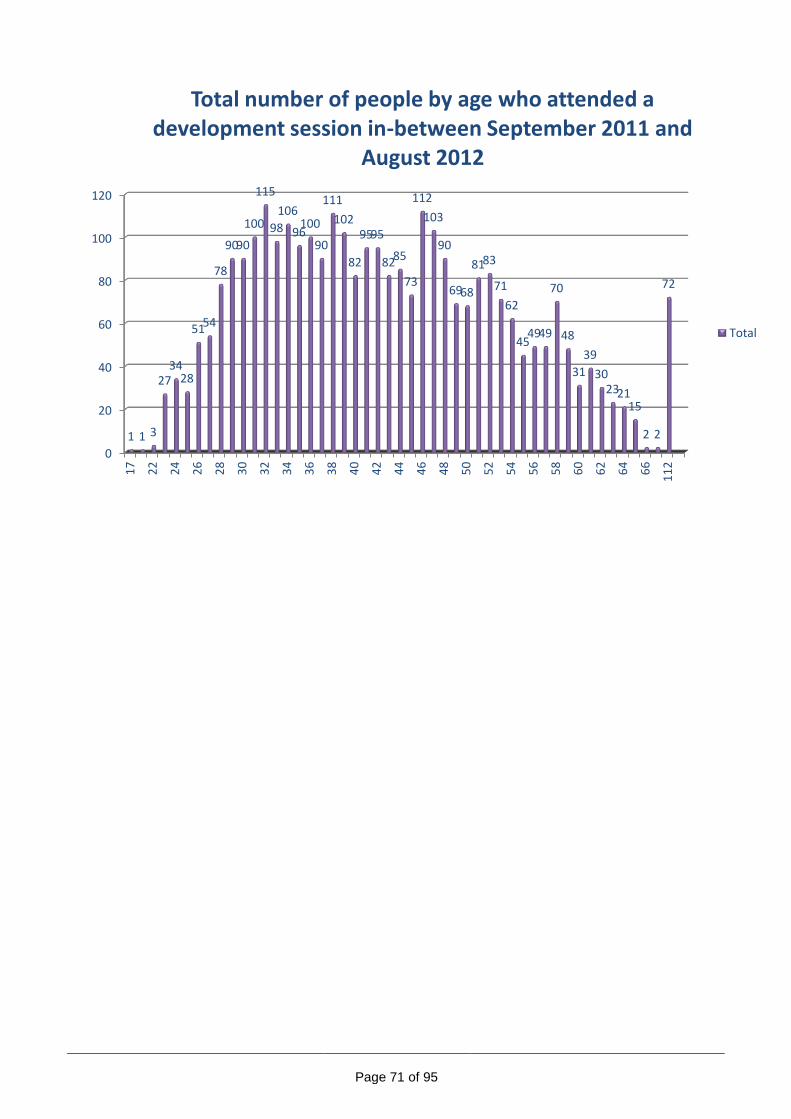
Page 71 of 95
0
20
40
60
80
100
120
17
22
24
26
28
30
32
34
36
38
40
42
44
46
48
50
52
54
56
58
60
62
64
66
11
2
1 1 3
27 34
28
51 54
78
90 90
100
115
98
106
96 100
90
111
102
82
95 95
82 85
73
112
103
90
69 68
81 83
71
62
45 49 49
70
48
31
39
30 23 21
15
2 2
72
Total number of people by age who attended a development session in-between September 2011 and
August 2012
Total

Page 72 of 95
Other KPIs
Recruitment & selection training for Managers
Attendance at recruitment and selection training is growing from a small base of 11 attendees
during the 2010-11 period and 64 in the 2011-12 period. The Agreed reporting date for
‘Recruitment and selection training implemented for all recruiters’ is July 2014, which
Professional Development are working towards in partnership with HR. Analysis in greater
depth will be available for the 2013 report, building towards complete data set for this KPI in
2014.
Positive action programmes
PEAR, WAND and City & Guilds programmes – these programmes have been included
within KPI1 (Attendance, over the period 2010-12, at workshops with a specific equality and
diversity focus by job family, gender and age).
APPLE – The APPLE programme is evaluated through a long-term evaluation, the latest of
which was completed by the 2009-10 cohorts. This reports that, on a scale of strongly agree
to strongly disagree, 60% of participants agree that the course was relevant to their work,
80% agree that learning on the course was transferable to work, 70% agree that they had the
opportunity to use what they learnt on the course, 65% agree that the course has helped
improve performance in the areas covered by the course.
NVQs – Between 2010 and 2012 23 members of staff have completed a level 3 NVQ, and 23
completed a level 2 NVQ.
Future action 2: Data relating to participants is managed by the delivering college and PD are
investigating ways to include more equality relevant data within reporting mechanisms.
School-based update sessions
The following Schools have undertaken specific update sessions during the academic year
2011-12:
1. Internal Audit
2. Pharmacy
3. Nursing
4. English Studies
5. Veterinary Sciences
6. Biosciences
Professional Development have worked with Heads of the following schools to address equality
and diversity issues through drama for training (STEPS):
1. School of Chemistry – 2 sessions, all staff required to attend
2. School of Biology – 1 session, Staff with management responsibility required to attend.
Both Schools have given feedback that this activity has met specific needs and created a more
positive environment for addressing and challenging equality issues. Professional
Development aims to work with other WINSET Schools to identify opportunities for further
targeted training.

Page 73 of 95
Appendix One
Equal Opportunity and Disability Workshops offered as part of the Central Short
Course Programme
Chair Training for job family level 1 to 4 recruitment
Chair Training for Senior Academic/ APM panels
Entering Employment: workshop for disabled postgraduate students
Listening and responding to students (staff only)
Disability: Interaction and understanding
Managing Equal Opportunities policies
Managing postgraduate study – workshop for disabled students
Recruitment and selection

Page 74 of 95
Appendix Two
PD Equality Audit 2011: Sessions and programmes containing equality and diversity
materials
Programme & sessions
PGCHE
Teaching a Diverse Audience – Introductory Event workshop
Assessment – Portfolio module
Individual Pathway Module – Assessing & Giving Feedback
Individual Pathway Module – Curriculum Design
Individual Pathway
Module – Foundations of Teaching in HE
Individual Pathway Module – Contemporary Issues in Supervising Research
Students
Personal Effectiveness/ Career progression
Welcome Event for New Staff
NVQ in Business & Administration
NVQ in Customer Service
NVQ in Professional Cookery
NVQ in Hospitality
NVQ in Cleaning and Support Services
NVQ in Security
PEAR Communication Skills
PEAR Core Days
Training the Trainer
Body Language
Communication Skills
Secretary/ PA
Effective secretary / PA managing small projects
Effective secretary/ PA maximising comm. skills
Effective secretary/ PA handling difficult situations
Others
Developing personal effectiveness
Introductions to assertiveness
ILM coaching award
APPLE programme
Handling difficult situations
ILM coaching award
ILM award managing small projects
ILM first line manager award
WAND programme
Handling difficult situations
Emotionally intelligent leadership
Managing small projects
Hall Tutor Training
Welcome Event for New Staff
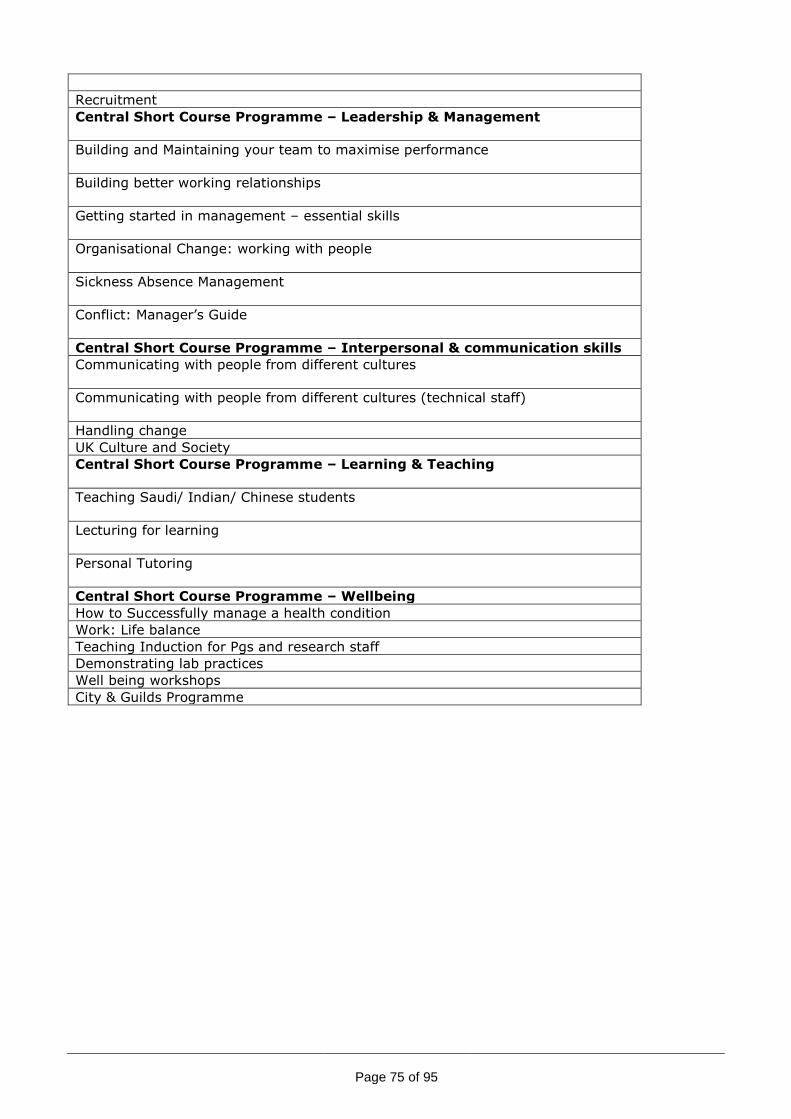
Page 75 of 95
Recruitment
Central Short Course Programme – Leadership & Management
Building and Maintaining your team to maximise performance
Building better working relationships
Getting started in management – essential skills
Organisational Change: working with people
Sickness Absence Management
Conflict: Manager’s Guide
Central Short Course Programme – Interpersonal & communication skills
Communicating with people from different cultures
Communicating with people from different cultures (technical staff)
Handling change
UK Culture and Society
Central Short Course Programme – Learning & Teaching
Teaching Saudi/ Indian/ Chinese students
Lecturing for learning
Personal Tutoring
Central Short Course Programme – Wellbeing
How to Successfully manage a health condition
Work: Life balance
Teaching Induction for Pgs and research staff
Demonstrating lab practices
Well being workshops
City & Guilds Programme
Page 76 of 95
Employee Case Work Analysis
Introduction, Methodology & Overall Analysis
1.1 This report is designed to provide Equalities information relating to HR casework
undertaken by managers and supported by HR. This report covers:
1.1.1 Disciplinary Information
1.1.2 Grievance Information
1.1.3 Dignity Complaints
1.2 The statistics provided in this report relate to proceedings which have reached a
formal stage. This includes those proceedings that are raised formally but are
then resolved informally at the formal stage. This report explicitly does not
include information about employees whose disputes were resolved informally
through extensive work by managers, employees and staff.
1.3 The number of disciplinaries and grievances specifically that reach a formal
stage is only a small proportion of the university population (between 1-2% of
the workforce).
1.4 Our information includes those employees of the University who work on any of
the UK campuses. At present, as this information relates solely to UK policy and
procedure, this information does not relate to individuals who work on the
University’s international campuses in China and Malaysia.
1.5 All information included in this report protects the anonymity of all our
employees. At all times, our goal has been to prevent the identity of any
individual becoming explicitly or implicitly apparent. The University has does not
reveal any equality information that would identify a member of staff, or by
which a particular employees personal information would be apparent. This
report therefore provides general top line statistics in order to assess our
current position against our Equalities Objectives, monitor general trends in line
with the Equalities act, and inform policy development within the University as a
whole.
1.6 This report includes information on all cases that either commenced or
concluded between 1st August 2009 - 31st July 2012. Those individuals who
lodged a dignity issue during this period are also recorded and analysed below.
1.7 The information presented in the Disciplinary Section is used to highlight cases
against individuals by the University. The information provided in the Grievance
Section highlights complaints made by individuals to the university. Finally,
information provided in the Dignity Complaints section details any harassment,
bullying or discrimination complaints made by an employee against another

Page 77 of 95
staff member to the University.
1.8 Employees who were the subject of a dignity complaint that has been accepted
as valid by the university may then count in the disciplinary section of this
report if formal action was taken against them.
1.9 The Equalities information used in this report is correct as at the 20th September
2012.l
1.10 The data for this report was assembled by HR Advisers, Employment Services
Advisers (HR Case Workers) and Assistant Advisers during a three week period
in September 2012 using spreadsheets. This information was then collated, and
populated with Equalities Information by the HR Systems & Management
Information Team (PAPS).
1.11 The data contained in this report therefore only contains information received by
this team by the 20th September 2012.
1.12 The point of contact for any queries on this report in HR Systems &
Management Information is Jonathan Sneade
([email protected]). The HR Senior Team Contact is Clare
Martlew, Deputy Director of Human Resources

Page 78 of 95
Focus on Formal Disciplinary Proceedings
2.1 Disciplinary Types by Faculty
Disciplinary Performance Grand Total
Arts 5
5
Engineering 2 2 4
Medicine & Health 9
9
Professional Services 42 6 48
Sciences 3
3
Social Sciences 6 1 7
Grand Total 67 9 76
There were 76 cases which were managed at a formal stage during the period.
67 (88.15%) were pure disciplinaries, relating to a range of issues
including conduct and attendance. 9 (11.8%) were formal performance cases. 48% of cases involved staff within professional services (including but
not limited to: Registrars, Estates and Nottingham Hospitality). The Academic Faculty with the highest number of disciplinary cases
was Medicine & Health (9), equating to 11.8% of all university cases.
2.2 Disciplinary Types by Job Family
Disciplinary Performance Grand Total
APM 11 4 15
O&F 30 1 31
R&T 19 2 21
TS 7 2 9
Grand Total 67 9 76
Staffs in the Operations & Facilities (O&F) job family were a party to 31 cases. This represents 40.7% of all university cases.
Staffs in the Research & Teaching (R&T) job family were the subject of 21 cases, which represents 27.6% of all cases within the period.
26% of cases involving staff in the Administrative, Professional and
Managerial (APM) job family related to performance. This was the highest percentage of all job families, and compares to only 11.8% across the whole universities.
96.7% of all cases regarding Operations & Facilities Staff (O&F) were disciplinary proceedings.

Page 79 of 95
2.3 Disciplinaries: Job Family by Faculty/ School
APM O&F R&T TS Grand Total
Arts
5
5
Engineering
2 2 4
Medicine & Health 1
4 4 9
Professional Services 14 31 1 2 48
Sciences
2 1 3
Social Sciences
7
7
Grand Total 15 31 21 9 76
2.4 Hearing Outcomes of Disciplinary Proceedings
2.5 Hearings: Outcomes by Disability

Page 80 of 95
The overwhelming majority of disciplinary cases were against staff
declaring themselves without a disability (92.1%). Only 2 cases
(2.6%) were involving people declaring a disability to Human Resources.
Both people subjected to a disciplinary procedure who declared disabilities
were dismissed during the period. It is important to note that the
sample size here is extremely small and assumptions based on this
should be avoided.
2.6 Hearings: Outcomes by Gender
Points to note: 26.3% of men subjected to a disciplinary procedure were dismissed at the
hearing stage.
52.6% of women subjected to a disciplinary procedure were dismissed at
the hearing stage (a difference of 19.2%).
Fewer females were subjected to a formal disciplinary procedure
than males during the period. 25% of cases (19) involved female staff.
2.7 Hearings: Outcomes by Age
under 25 25 - 34 35 - 44 45 - 54 55 - 64
Grand Total
Dismissal
2 10 6 7 25
Formal Sanction 2 6 6 13 7 34
No Sanction
1 3 5
9
Data Unavailable
1 3 1 3 8
Grand Total 2 10 22 25 17 76

Page 81 of 95
2.8 Hearings: Outcomes by Ethnic Origin
Row Labels Dismissal Formal Sanction
No Sanction
Data Unavailable
Grand Total
0
2 1
3
Black Caribbean
1 1
Chinese
2 1
3
Indian
1
1
Mixed White and Asian
1 1
Mixed White and Black
Caribbean
1
1
Other Asian background
1
1
Other Background 1 2
3
Other Black background 1
1
Other Mixed background 1
1
Other White background 1
2 1 4
White
1 1
White British English 21 20 4 3 48
White British Scottish
1
1 2
White British Welsh
4
4
White Irish
1
1
Grand Total 25 34 9 8 76
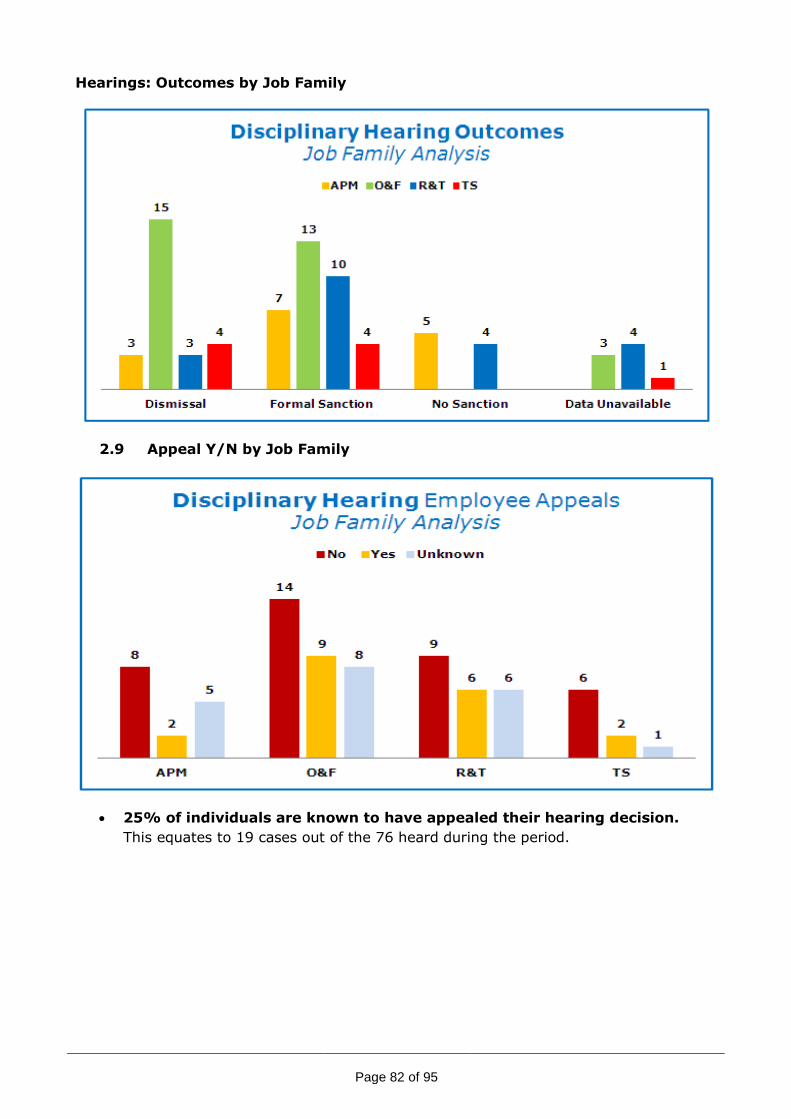
Page 82 of 95
Hearings: Outcomes by Job Family
2.9 Appeal Y/N by Job Family
25% of individuals are known to have appealed their hearing decision.
This equates to 19 cases out of the 76 heard during the period.
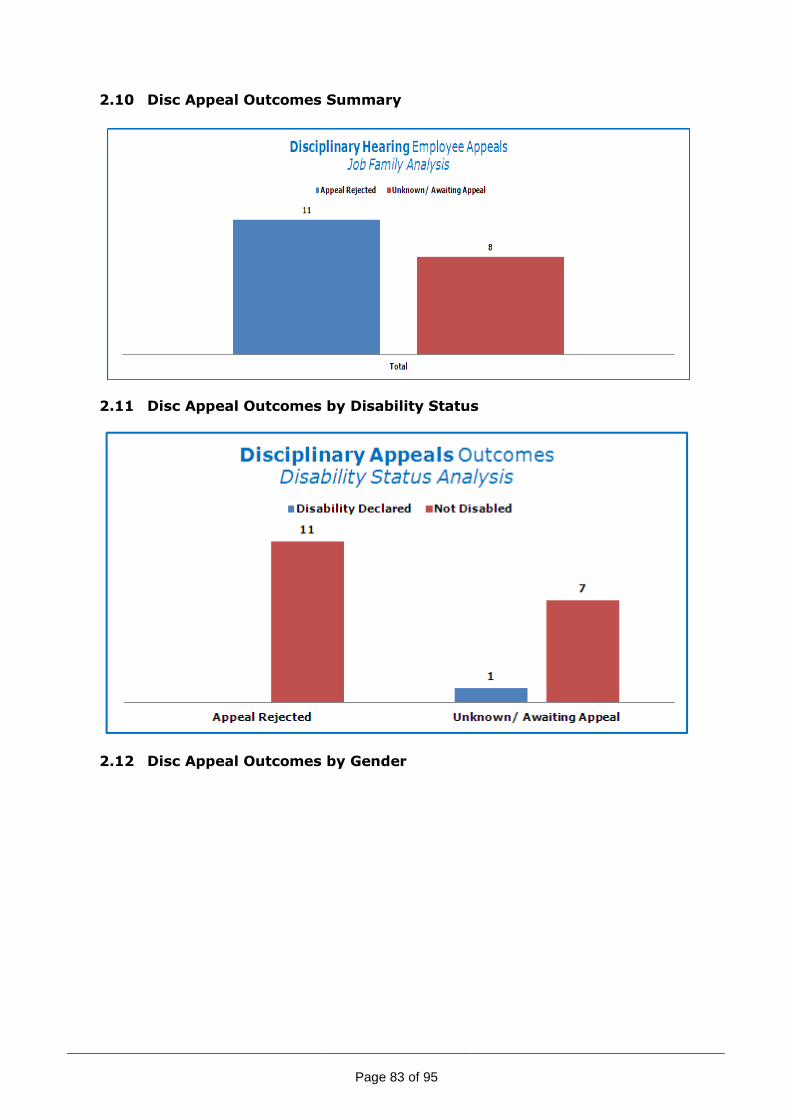
Page 83 of 95
2.10 Disc Appeal Outcomes Summary
2.11 Disc Appeal Outcomes by Disability Status
2.12 Disc Appeal Outcomes by Gender

Page 84 of 95

Page 85 of 95
2.13 Disc Appeal Outcomes by Age
2.14 Disc Appeal Outcomes by Ethnic Origin

Page 86 of 95

Page 87 of 95
2.15 Disc Appeal Outcomes by Job Family

Page 88 of 95
Focus on Grievances
3.1 Grievances: Faculty/ School by Job Family
Arts
Engineering
Medicine & Health Sciences
Professional Services
Social Sciences
Grand Total
APM 8 2 10
O&F 4
4
R&T 2
2
1 5
TS 1 1
2
Grand Total
2 1 3 12 3 21
3.2 Grievance Cases: Outcomes by Disability
3.3 Grievance Cases: Outcomes by Gender

Page 89 of 95

Page 90 of 95
3.4 Grievance Cases: Outcomes by Age Group
3.5 Grievance Cases: Outcomes by Ethnic Origin
Formally Rejected
Formally Upheld
In Progress
Informal Resolution Withdrawn
Grand Total
Indian 1
1 2
Other Background 1
1
Other Black background
1
1
Other White background
2
2
White British English 5 1 1 3 2 12
White British Scottish
1
1
White British Welsh 1
1
White Irish 1 1
Grand Total 8 1 5 3 4 21
3.6 Grievance Cases: Outcomes by Job Family

Page 91 of 95
3.7 Grievance Cases: Start Stage by Outcome
3.8 Grievance Cases: End Stage by Outcome

Page 92 of 95

Page 93 of 95
Focus on Dignity Complaints
4.1 Dignity Complaints: Faculty
Complaints %
Engineering 3 21.43%
Information Services 1 7.14%
Medicine & Health 3 21.43%
Professional Services 2 14.29%
Sciences 2 14.29%
Social Sciences 3 21.43%
Grand Total 14 100.00%
4.2 Dignity Complaints: Job Family
4.3 Dignity Complaints: Outcomes by Gender of Complainant
50%
22%
14%
14%
Dignity Complaints by Job Family
APM R&T TS Non-Staff
1 1
6
1 1 1
3
Accepted -
Formal Action
Accepted -
Informal Resolution
Rejected -
Malicious
Rejected - NFA Outcome
Unknown
Complaint Outcomes by Gender
F M

Page 94 of 95
4.4 Dignity Complaints: Outcomes by Age of Complainant
4.5 Dignity Complaints: Outcomes by Ethnic Origin of Complainant
4.6 Dignity Complaints: Outcomes by Disability
2
1 1
6
1 1
Accepted -
Formal Action
Accepted -
Informal Resolution
Rejected -
Malicious
Rejected - NFA Outcome
Unknown
Complaint Outcomes by Age Group
35 - 44 45 - 54 55 - 64
1 1 1 1
3
1 1
2
Accepted -
Formal Action
Accepted -
Informal Resolution
Rejected -
Malicious
Rejected - NFA Outcome
Unknown
Complaint Outcomes by Ethnic Origin
Black Caribbean Chinese Other White background
White British English White British Scottish White British Welsh
Unknown

Page 95 of 95
4.7 Dignity Complaints: Outcomes by Job Family
1 1 1 1
9
1
Not Disabled Unknown
Complaint Outcomes by Disability Status
Accepted - Formal Action Accepted - Informal Resolution Rejected - Malicious
Rejected - NFA Outcome Unknown
1 1 1 1
5
2 2
1
APM R&T TS Non Staff
Complaint Outcomes by Job Family
Accepted - Formal Action Accepted - Informal Resolution
Rejected - Malicious Rejected - NFA
Outcome Unknown