STADIUM® Modeling reactive transport in concrete...
34
STADIUM® Modeling reactive transport in concrete Application to CBP Eric Samson SIMCO Technologies Inc. September 2012 www.simcotechnologies.com
Transcript of STADIUM® Modeling reactive transport in concrete...

STADIUM® Modeling reactive transport in concrete Application to CBP
Eric Samson SIMCO Technologies Inc. September 2012 www.simcotechnologies.com

© SIMCO Technologies 2012
SIMCO Overview
Internal/External use of STADIUM®
Graphical User interface/User
experience
Model development/
Testing procedures
R&D Software
Sales & Marketing
Consulting activities
45+ employees 25+ engineers/scientists Fully operational lab/technical staff

© SIMCO Technologies 2012
What is STADIUM®?
Reactive transport model
• Tailored for cementitious materials • Can deal with different aggressive exposure cases • Access to all model features through input text file
Software
• Tool for engineers • Graphical interface • Material database • Exposure condition database • Focuses on chloride ingress, corrosion initiation • Time-dependent boundary conditions

© SIMCO Technologies 2012
STADIUM®-Lab Modules
Permeability Moisture isotherm
Tortuosity Diffusion coefficients
STADIUM®
Migration test
analysis
Drying test
analysis

© SIMCO Technologies 2012
Test methods part of Unified Facilities Guide Specifications (UFGS) 03 31 29 (February 2010) test protocol
• US Navy (NAVFAC ESC) • USACE • USAF • NASA
Performance specification protocol
STADIUM®-Lab Modules

© SIMCO Technologies 2012
STADIUM®-Lab Modules
The UFGS certification process
1. Review of existing facilities equipment
2. Acquisition of missing equipment (if necessary) and subscription
3. Training session: Sample preparation, laboratory testing and STADIUM® Lab analysis
4. Final certification

© SIMCO Technologies 2012
Thin-client interface Calculations performed on SIMCO’s server Data stored on SIMCO’s server
STADIUM® overview

© SIMCO Technologies 2012
STADIUM® overview
• Coupled species diffusion • Moisture/Temperature coupling • Transport of main species • Feedback effect • Time-dependent B.C.

© SIMCO Technologies 2012
STADIUM® overview
• Local Equilibrium Assumption • Dissolution/precipitation • Solid solutions • Chemical/Pitzer database in
separate text file

© SIMCO Technologies 2012
STADIUM® modeling results
Concrete exposed to sodium chloride in saturated and unsaturated condition conditions

© SIMCO Technologies 2012
STADIUM® modeling results
Leaching – calcium profiles in thin paste samples immersed in pH 7 water
2 days
7 days
4 days

© SIMCO Technologies 2012
STADIUM® modeling results
Leaching – silicon profiles in thin paste samples immersed in pH 7 water
2 days
7 days
4 days
© SIMCO Technologies 2012
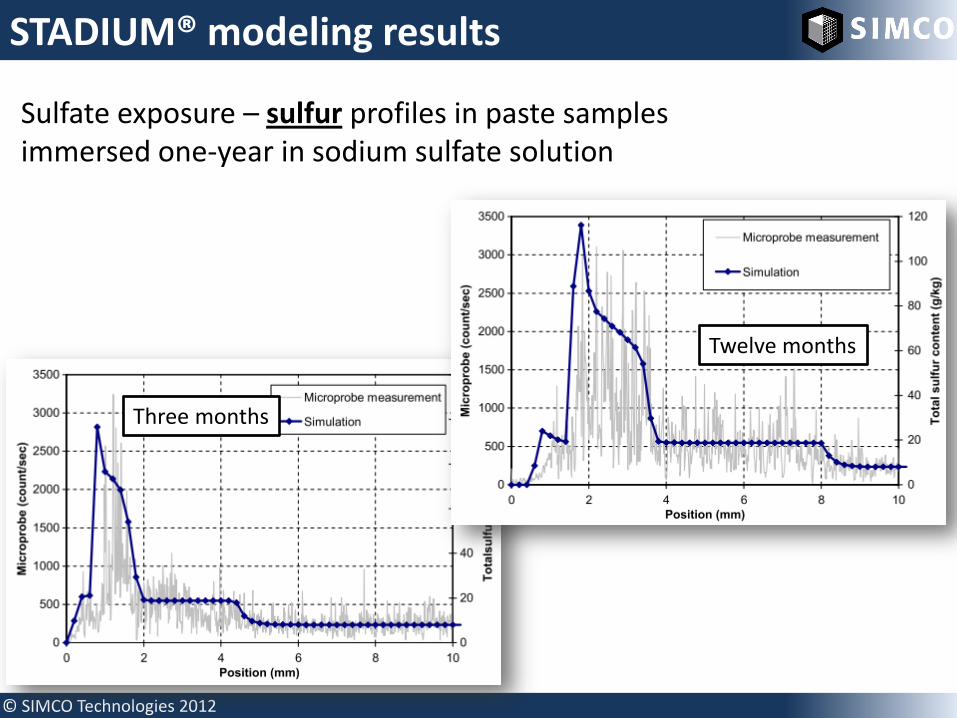
STADIUM® modeling results
Sulfate exposure – sulfur profiles in paste samples immersed one-year in sodium sulfate solution
Three months
Twelve months

© SIMCO Technologies 2012
STADIUM® modeling results
Sulfate exposure – calcium profiles in paste samples immersed one-year in sodium sulfate solution
Three months
Twelve months

© SIMCO Technologies 2012
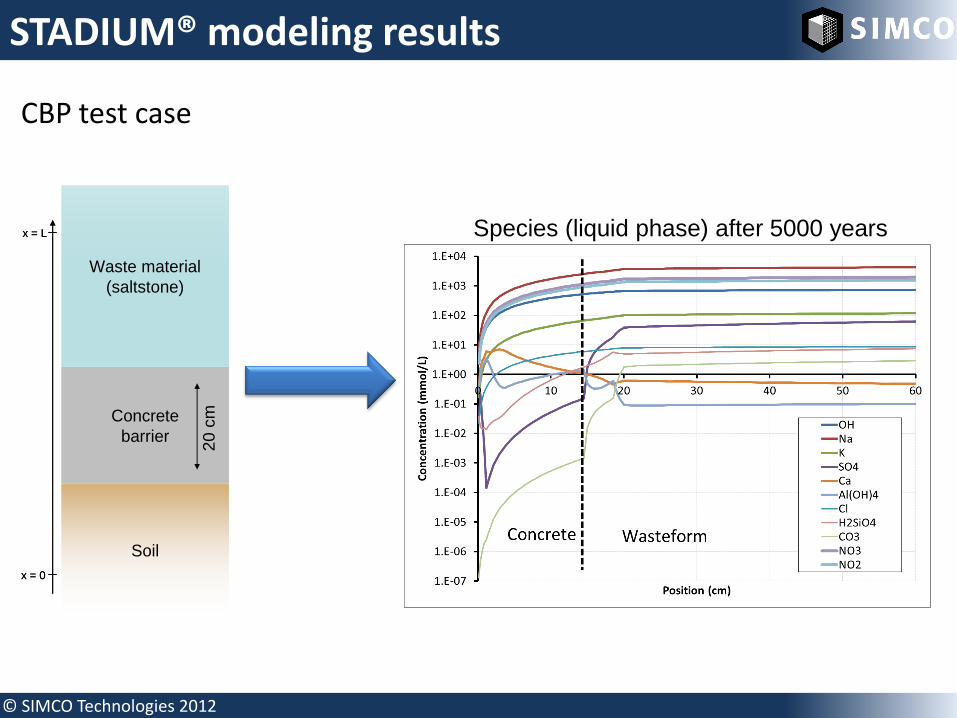
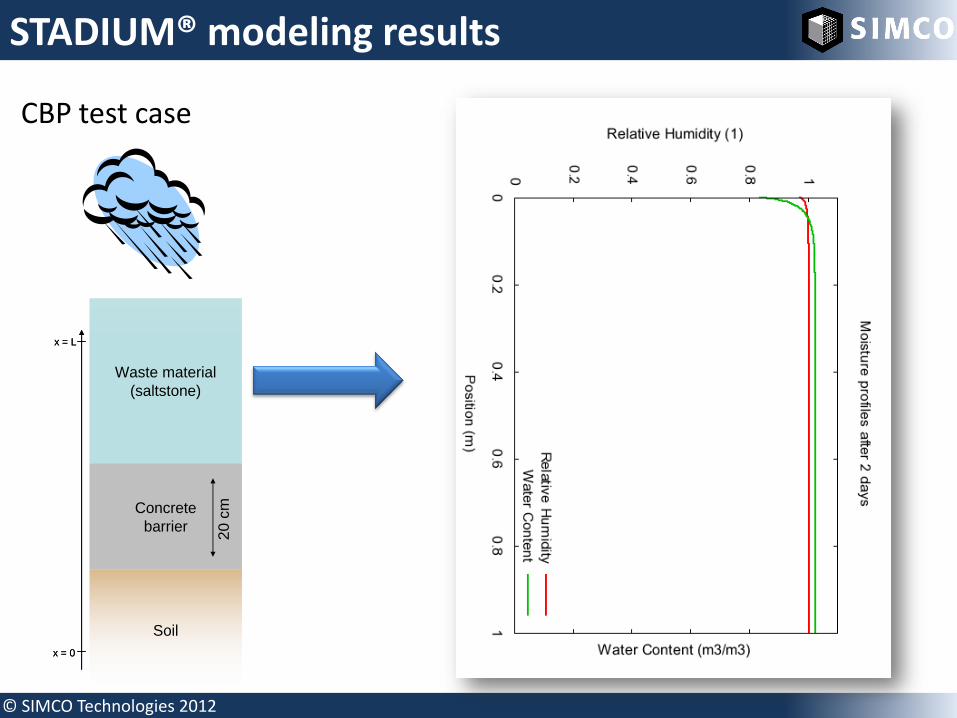
STADIUM® modeling results
CBP test case
Concrete
barrier
Waste material
(saltstone)
Soil
x = L
x = 0
20 c
mConcrete
barrier
Waste material
(saltstone)
Soil
x = L
x = 0
20 c
m
C G Soil
A
B
C
C
D
Soil

© SIMCO Technologies 2012
STADIUM® modeling results
CBP test case
Concrete
barrier
Waste material
(saltstone)
Soil
x = L
x = 0
20 c
mConcrete
barrier
Waste material
(saltstone)
Soil
x = L
x = 0
20 c
m
0
20
40
60
80
100
120
0 5 10 15 20 25 30
Position (cm)
So
lid
ph
ase c
on
ten
t (g
/kg
)
Portlandite
CaH2SiO4
Ettringite
Monosulfate
C4AH13
Calcite
Monocarboal
Concrete Saltstone
Minerals after 5000 years
© SIMCO Technologies 2012
STADIUM® modeling results
CBP test case
Concrete
barrier
Waste material
(saltstone)
Soil
x = L
x = 0
20 c
mConcrete
barrier
Waste material
(saltstone)
Soil
x = L
x = 0
20 c
m
Species (liquid phase) after 5000 years
© SIMCO Technologies 2012
STADIUM® modeling results
CBP test case
Concrete
barrier
Waste material
(saltstone)
Soil
x = L
x = 0
20 c
mConcrete
barrier
Waste material
(saltstone)
Soil
x = L
x = 0
20 c
m

© SIMCO Technologies 2012
STADIUM® modeling results
CBP test case
pCO2: 10-3.5 atm
200 ppm NaCl
Saturated soil
Vault 2 Concrete
Stee
l lin
er
20 cm
Analysis: estimation of the risk of corrosion due to chloride and drop of pH at the concrete/liner interface
Risk of corrosion initiation

© SIMCO Technologies 2012
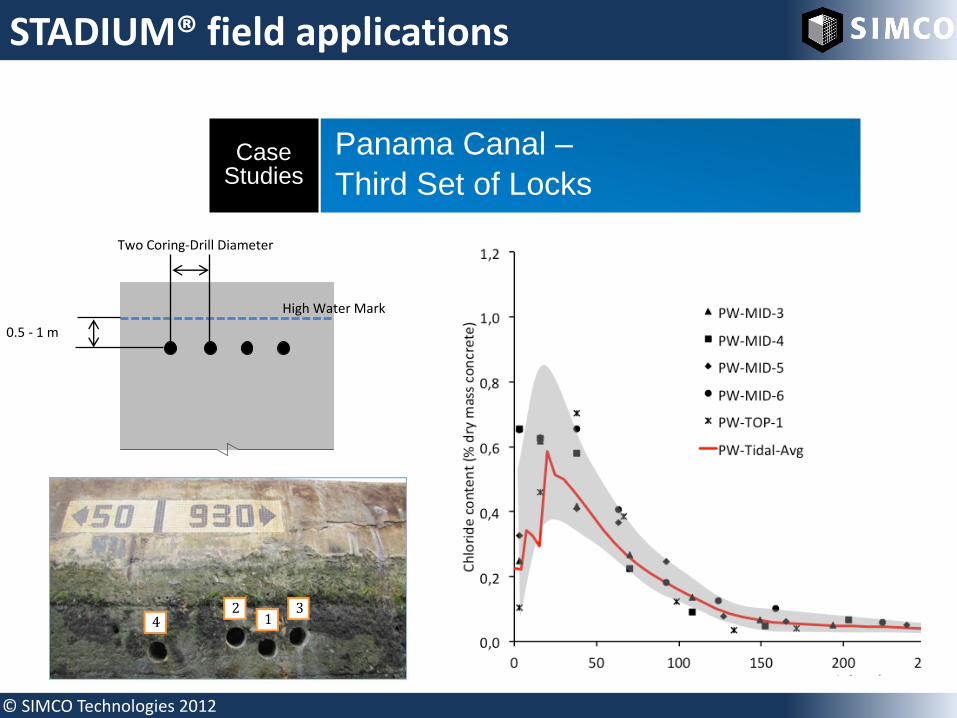
STADIUM® field applications
Panama Canal –
Third Set of Locks Case
Studies
© SIMCO Technologies 2012
STADIUM® field applications
Panama Canal –
Third Set of Locks Case
Studies
High Water Mark
Two Coring-Drill Diameter
0.5 - 1 m

© SIMCO Technologies 2012
STADIUM® field applications
STADIUM® Specified Kilo Wharf Extension
Case Studies
Kilo Wharf Extension US NAVY, GUAM
CBP ongoing activities
www.simcotechnologies.com

© SIMCO Technologies 2012
Material preparation
Concretes (Vault 1/4 & Vault 2) October 2011.
Raw materials
Source
Vault 1/4 w/b = 0.38
(kg/m3)
Vault 2 w/b = 0.38
(kg/m3)
Type I/II cement Lafarge 255 - Type V cement Lehigh - 121
GGBFS Holcim 169 162 Force 10000 SF Grace - 27 Class F Fly Ash SEFA - 95
Sand Foster 691 548 N° 67 Stone Rinker 1096 1111
Water - 162 152
(ml/100kg binder)
(ml/100kg binder)
MicroAir BASF 1.2 3.1 Polyheed N BASF 390 205
Glenium 3030 NS BASF 936 232 Fresh concrete Properties @15min
Air content(%) - 6.6 6.6 Unit weight(kg/m3) - 2283 2240
Slump(mm) - 150 155 Concrete properties @28days
Porosity(%) - 11.6 13.1 OH Diff. (e-11 m2/s) - 4.6 3.3
Concrete properties @97days Porosity(%) - 11.6 14.3
OH Diff. (e-11 m2/s) - 4.0 1.6

© SIMCO Technologies 2012
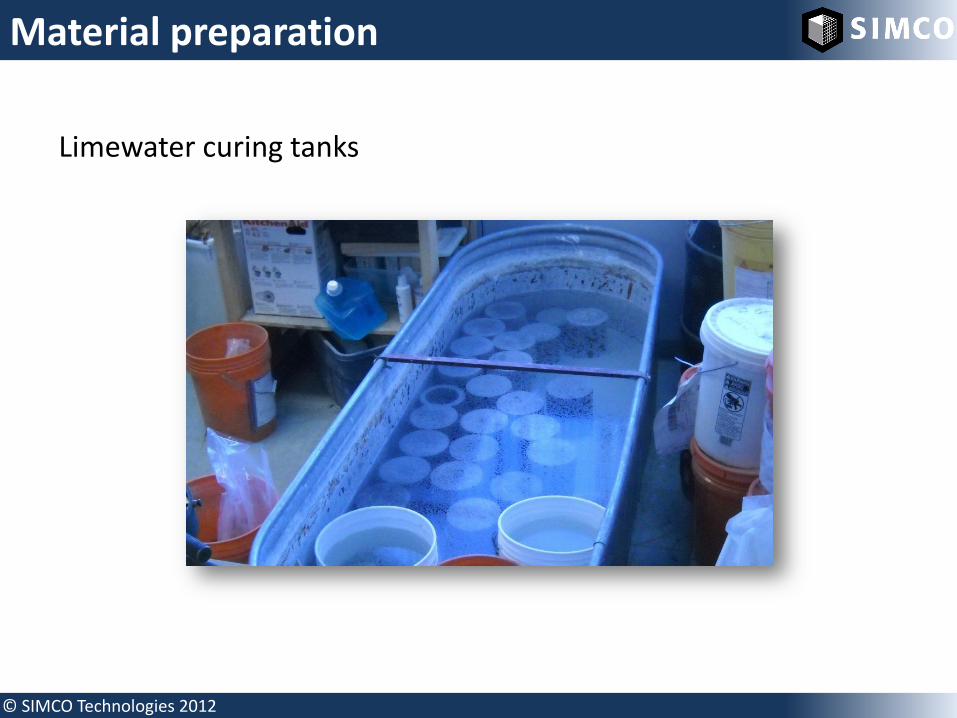
Material preparation
Four Hardened cement pastes (w/b =0.40) mixes have been prepared in December 2011. Pastes compositions are based on concrete Vault 1/4 & Vault 2 mixtures.
© SIMCO Technologies 2012
Material preparation
Limewater curing tanks

© SIMCO Technologies 2012
Experimental study – contact solutions
Contact solutions - Concentrations (mmol/L)
Salts Im.1 Im.2 Im.3 Im.4 Im.5
Na2SO4 150 150 150 150 150
NaOH 0 500 0 500 0
NaNO3 0 0 3000 3000 0
Na2CO3 0 0 0 0 150
Sulfate immersions
Sealed surface
Exposed surfaces 25mm
Pastes are immersed in different solutions Planned durations:
1) 3 months (June 2012) 2) 12months (March 2013)
Contact Solution
© SIMCO Technologies 2012
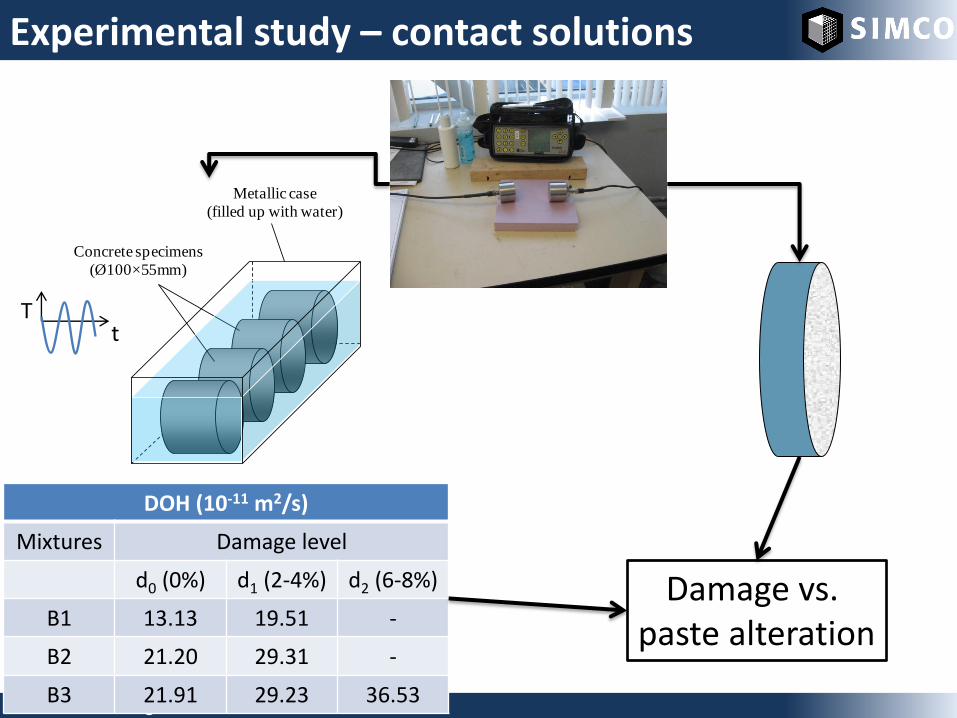
Experimental study – contact solutions
Metallic case
(filled up with water)
Concrete specimens
(Ø100×55mm)
T t
DOH (10-11 m2/s)
Mixtures Damage level
d0 (0%) d1 (2-4%) d2 (6-8%)
B1 13.13 19.51 -
B2 21.20 29.31 -
B3 21.91 29.23 36.53
Damage vs. paste alteration

© SIMCO Technologies 2012
Experimental study – saltstone/concrete
Wasteform mixture
Vault concrete
0
10 000
20 000
30 000
40 000
50 000
60 000
-25 -20 -15 -10 -5 0 5 10 15To
tal S
od
ium
co
nc
en
tra
tio
n, (P
PM
)
Depth (mm)
Vault 1/4
Saltstone
Model
Saltstone Concrete
Interface
180-day exposure Sulfur profile

© SIMCO Technologies 2012
Experimental study – saltstone/concrete
180-day exposure Sulfur profile

© SIMCO Technologies 2012
Experimental study – saltstone/concrete
Raw materials Density Wasteform (kg/m3)
Type I/II cement 3.18 94 GGBFS 2.92 423
Class F Fly Ash 2.43 423 DI Water 1.00 564
Salt - 232 Salt solution 1.22 796
Seal (silicone)
Salt solution
Saltstone
Concrete (cV1/4 or cV2)
Seal
Waterproof membrane
80
-90
6
0
20
Dimensions in millimeters

© SIMCO Technologies 2012
Corrosion in CO2 environment
Na2CO3 solution (0.1M)
Na2CO3 (0.1M)
Mortar (W/C=0.65)
Steel rebar

© SIMCO Technologies 2012
Corrosion in CO2 environment
Potential measurements
RE (calomel)

© SIMCO Technologies 2012
Corrosion in CO2 environment
CO2 ingress – Carbonate profile @ 120 days