Stability tests of GEMs with cylindrical holes for ALICE upgrade
46
Stability tests of GEMs with cylindrical holes for ALICE upgrade Behalf of the ALICE TPC upgrade collaboration 1
description
Stability tests of GEMs with cylindrical holes for ALICE upgrade. Behalf of the ALICE TPC upgrade collaboration. The ALICE TPC is the main device in the ALICE central barrel for tracking of charged particles and particle identification. Design of the present ALICE TPC. - PowerPoint PPT Presentation
Transcript of Stability tests of GEMs with cylindrical holes for ALICE upgrade

1
Stability tests of GEMs with cylindrical holes for ALICE upgrade
Behalf of the ALICE TPC upgrade collaboration

2
The ALICE TPC is the main device in the ALICE central barrel for tracking of charged particlesand particle identification

3
Design of the present ALICE TPC

4
Requirement to gating grids: ion back flow is below 10-4

5Chilo Garabatos
Counting rate will be increased 100 times!

6
A very attractive option is GEM…

7
ν
Chilo Garabatos

8
GEM-1
GEM-2
X-ray gunor Sr
Vdr
Vt1Vb2Vt2
Gas chamber
Experimental setup
6mm
3mm
7mm
2-3-mm
4-6mm
Shielding box
Monitoringsingle-wireCounter (SWC)
Gas outN2 in
55Fe
Vb23 mm
Vbp
Gas in
N2 out

9
Some related images…

10
Data acquisition(J. Reinink)
Labviewpresentation

11
12
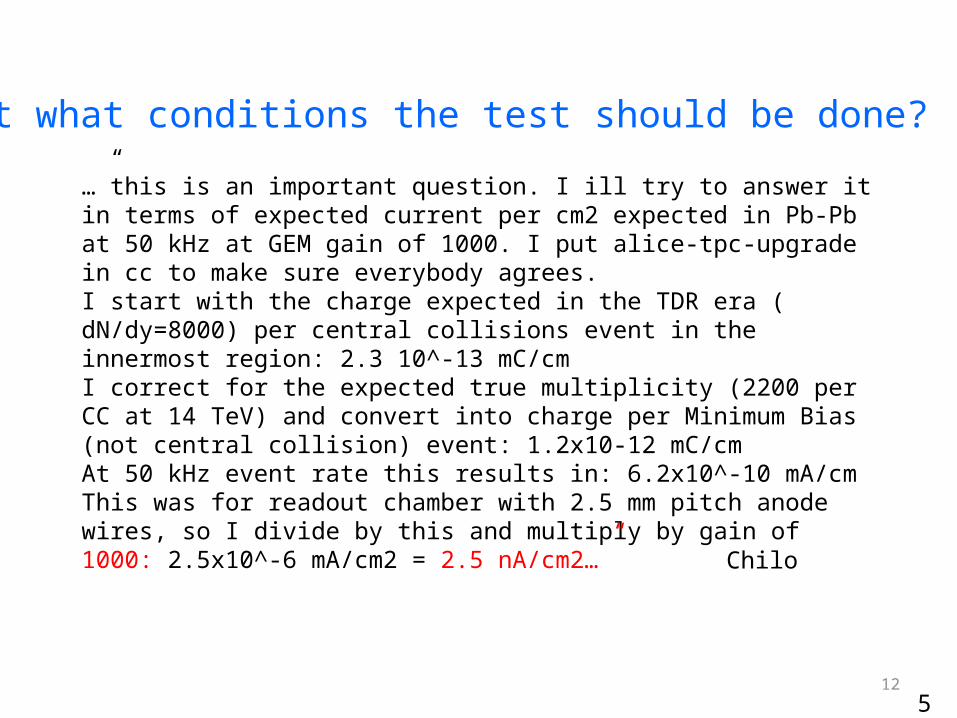
…”this is an important question. I ill try to answer it in terms of expected current per cm2 expected in Pb-Pb at 50 kHz at GEM gain of 1000. I put alice-tpc-upgrade in cc to make sure everybody agrees.I start with the charge expected in the TDR era ( dN/dy=8000) per central collisions event in the innermost region: 2.3 10^-13 mC/cmI correct for the expected true multiplicity (2200 per CC at 14 TeV) and convert into charge per Minimum Bias (not central collision) event: 1.2x10⁻¹² mC/cmAt 50 kHz event rate this results in: 6.2x10^-10 mA/cmThis was for readout chamber with 2.5 mm pitch anode wires, so I divide by this and multiply by gain of 1000: 2.5x10^-6 mA/cm2 = 2.5 nA/cm2…”
5
At what conditions the test should be done?
Chilo

13
Results:

14
Measurements were performed with single and double and triple GEMs in
Ne+10%CO2 and Ar+10%CO2 at p=1atmand humidity range 1000-50 ppm
A few examples are given below:

15
1. Single GEM
Gas gain 200Current ≈2nA/cm2
Long-term runs as well as intensity and voltage variations were done

16
0 10000 20000 30000 40000 50000 60000 70000 800000
100
200
300
400
500
600
700
800
900
Sing
le w
ire c
ount
er (S
WC)
0 10000 20000 30000 40000 50000 60000 70000 80000
-100
0
100
200
300
400
500
600
GEM
0 10000 20000 30000 40000 50000 60000 70000 800000
2
4
6
8
10
12
GEM
/SW
CRa
w d
ata
0 10000 20000 30000 40000 50000 60000 70000 800000
2
4
6
8
10
12
GEM
/SW
CCo
rrec
ted
5
Intensity variations
Time (Sec)

170 10000 20000 30000 40000 50000 60000 70000 80000
0.55
0.57
0.59
0.61
0.63
0.65
Zoomed area of the corrected data
740 760 780 800 820 840 8600
2
4
6
8
10
12
Correction
SWC
GEM

18
0 1000 2000 3000 4000 5000 6000 7000 8000 9000 100000
2
4
6
8
10
12
0 1000 2000 3000 4000 5000 6000 7000 8000 9000 100000.55
0.57
0.59
0.61
0.63
0.65Zoomed
Various tests with intensity variations

19
0 10000 20000 30000 40000 50000 60000-0.2
0
0.2
0.4
0.6
0.8
1
1.2
1.4
Series1
GEM/SWC corrected
13
167 min
9000 9500 10000 10500 11000 11500 120000
0.2
0.4
0.6
0.8
1
1.2
Series18min

20
X-ray intensity modulations
Corrected
0 2000 4000 6000 8000 10000 12000 14000 16000 18000 200000
0.1
0.2
0.3
0.4
0.5
0.6
1 2
3
0 1000 2000 3000 4000 5000 6000 70000.45
0.455
0.46
0.465
0.47
0.475
0.48
0.485
0.49
0.495
0.5
8000 9000 10000 110000.45
0.455
0.46
0.465
0.47
0.475
0.48
0.485
0.49
0.495
0.5
11000 13000 15000 17000 190000.35
0.355
0.36
0.365
0.37
0.375
0.38
0.385
0.39
0.395
0.4
Zoomed areas
1 2 3

21
0
100000
200000
300000
400000
500000
600000
700000
800000
-0.2
0
0.2
0.4
0.6
0.8
1
Series1
0 200000 400000 600000 8000000.700000000000001
0.710000000000001
0.720000000000001
0.730000000000001
0.740000000000001
0.750000000000001
0.760000000000001
0.770000000000001
0.780000000000001
0.790000000000001
0.800000000000001
Series1
GEM voltage variations
The same, but zoomed±2%!In the plateau region± 1.3%
GEM/SWCcorrected on offset
22
Summary of measurements with a singe GEM:
GEM stable within ±1-2% (continuous test time was 7 weeks)
Humidity level was 500-50ppm

23
Will be interesting to compare with simulation
Discussion with Rob Veenhof:
His calculations show:With real conical holes 70μm in diameter no charging up effect. Some short-term (10-30min) variation with time are predicted:with 70 μm holes having and inner diameter 60 μm some initial gain loss is predicted,with inner diameters less than 60 μm gain may increases with time
24
2. Double GEM
The same type of measurements: long-term runs, intensity and voltage
variations

25
18000 18100 18200 18300 18400 18500 18600 18700 18800 18900 190000
0.1
0.2
0.3
0.4
0.5
0.6
0.7
0.8
0.9
An example of double GEM reaction on intensity variation
18000 18200 18400 18600 18800 190000.750000000000001
0.760000000000001
0.770000000000001
0.780000000000001
0.790000000000001
0.800000000000001
0.810000000000001
0.820000000000001
0.830000000000001
0.840000000000001
0.850000000000001
26
Conclusion from double GEM stability studies
double GEM, irradiated in its middle area (current ~1.8nA/cm2, gain 900) is stable within ~±2%.After the voltage variation it is still not so bad: ±2.6%
When the gain was increase 2 times (from 900 to ~ 2000) and intensity 4 times, so that the current range ~ 7-15nA/cm2, stability is ±3%(which is inside the expected √2 degradation)

27
Triple GEM-the most important case
Measurements were done at 180 and 70ppm

28
Results at humidity 180 ppm

29
0 200000 400000 600000 800000 1000000 12000000
200
400
600
800
1000
1200
Single-wire, raw data
0 200000 400000 600000 800000 1000000 12000000
100
200
300
400
500
600
700
GEM, raw data
Overview of raw data
Gain 1200
Gain 1800
180ppm

30
0 50000 100000 150000 200000 250000 300000 350000 4000000.3
0.32
0.34
0.36
0.38
0.4
0.42
0.44
0.46
0.48
0.5
Corrected GEM data at gain 1200
±3%, If pikes excluded ± 2%-both are consistent with old measurements
Noise came for humiditymonitorThen it was switched off

31
425000 445000 465000 485000 505000 525000 5450000
0.1
0.2
0.3
0.4
0.5
0.6
0.7
0.8
1
23 4
Step by step gain increase from 1200 to 1800
27 hours

32
427500 428000 428500 429000 429500 4300000
0.1
0.2
0.3
0.4
0.5
0.6
Region 1
427750 427950 428150 428350 428550 428750 4289500.3
0.31
0.32
0.33
0.34
0.35
0.36
0.37
0.38
0.39
0.4
± 1.5%

33
425000 427000 429000 431000 433000 435000 437000 4390000
0.1
0.2
0.3
0.4
0.5
0.6
0.7
0.8
Region 2
428000 429000 430000 431000 432000 433000 434000 435000 4360000.5
0.52
0.54
0.56
0.58
0.6
± 1.4%

34
Region 3
435000 445000 455000 465000 475000 485000 495000 505000 5150000
0.1
0.2
0.3
0.4
0.5
0.6
0.7
0.8
435000 445000 455000 465000 475000 485000 495000 505000 5150000.700000000000001
0.710000000000001
0.720000000000001
0.730000000000001
0.740000000000001
0.750000000000001
0.760000000000001
0.770000000000001
0.780000000000001
0.790000000000001
0.800000000000001
±1.3%
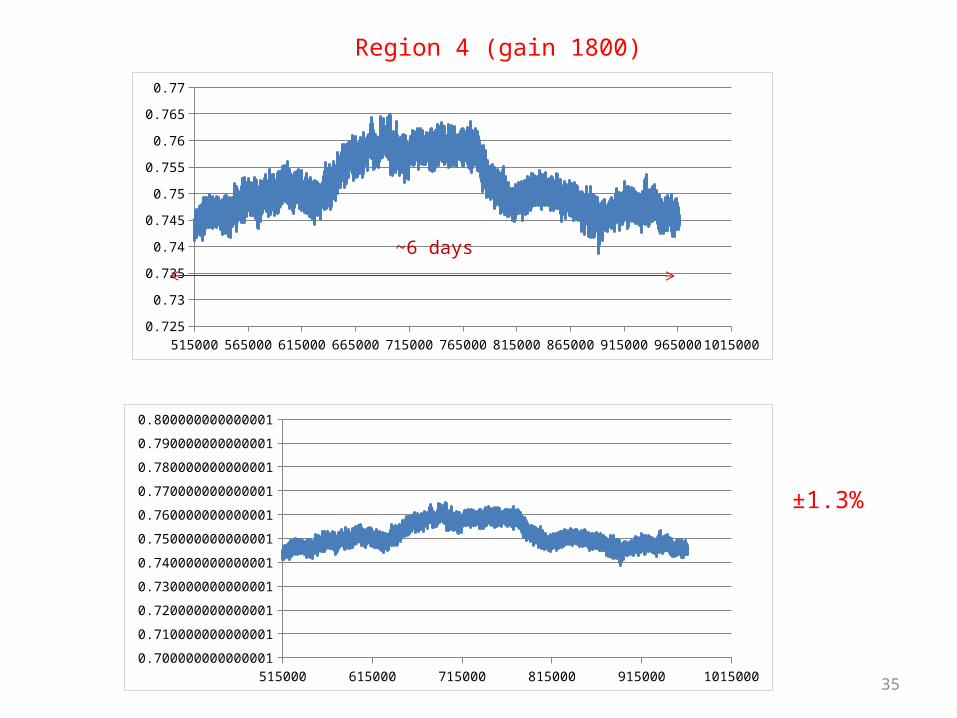
35
515000 565000 615000 665000 715000 765000 815000 865000 915000 965000 10150000.725
0.73
0.735
0.74
0.745
0.75
0.755
0.76
0.765
0.77
515000 565000 615000 665000 715000 765000 815000 865000 915000 965000 10150000.700000000000001
0.710000000000001
0.720000000000001
0.730000000000001
0.740000000000001
0.750000000000001
0.760000000000001
0.770000000000001
0.780000000000001
0.790000000000001
0.800000000000001
±1.3%
Region 4 (gain 1800)
~6 days

36
…70 ppm

37
20000 30000 40000 50000 60000 70000 80000 90000 1000000
2
4
6
8
10
12
20000 30000 40000 50000 60000 70000 80000 900001000000.7
0.71
0.72
0.73
0.74
0.75
0.760000000000001
0.770000000000001
0.78
0.79
0.8
± 1.4%Sr was removed

38
80000 82000 84000 86000 88000 90000 92000 94000 96000 98000 1000000
2
4
6
8
10
12
8000082000
8400086000
8800090000
9200094000
9600098000
1000000.7
0.71
0.72
0.73
0.74
0.75
0.760000000000001
0.770000000000001
0.78
0.79
0.8± 1.4%
20min
Zoomed area

39
700000 720000 740000 760000 780000 800000 820000 8400000
0.1
0.2
0.3
0.4
0.5
0.6
0.7
700000 720000 740000 760000 780000 800000 820000 8400000.45
0.5
0.55
0.6
0.65
± 2%
Various voltage variations

40
770000
772000
774000
776000
778000
780000
782000
784000
786000
788000
7900000.45
0.5
0.55
0.6
0.65
777000 779000 781000 783000 785000 787000 7890000.45
0.47
0.49
0.51
0.53
0.55
20min

41
Conclusion for triple GEM:
Stability between ± 2% (gain 1200) and ± 1.4% (gain 1800)was observed with triple GEMs

42
General conclusions:
1. Long-term measurements (total time more than 6 months) were performed with GEMs having cylindrical holes
2. At expected LHC conditions (corresponding to GEM’s current ~2nA a gain of ~ 1000) and humidity 100-50pp the gain variation were (over all tests performed) below ± 3%
3. Probably, better results could be achieved if we implement better compensation on environmental variations

43
Further plans:
1) Try to compensate on environmental variations even better (using a detector which has a working
voltage and a gain vs. voltage close to our GEMs; in the case of the single wire detectors these
parameters are very far away)2) Perform tests very “dry” GEMs (in preparation by
Leszek and Eraldo RD-51 Lab)

44
Made of liquid crystal (LCP) The geometry of them is exactly same as the standard CERN-GEM: hole diameter = 70 microns, hole pitch = 140 microns, thickness of LCP = 50 microns, thickness of Cu layers = 5 microns.
One of the possibilities is to use as a refernce detector Japanese GEMs:

45
…hence,more adventures are coming

46