Stability in turbulent times.
196
2007 Annual Report Stability in turbulent times.
Transcript of Stability in turbulent times.

2007 Annual Report
Stability in turbulent times.

By any measure, 2007 was a turbulent
year in the stock market and for many
REIT investors. Despite market conditions,
NNN shareholders enjoyed a total return
of 8.1%. This was due in large part to our
high quality portfolio characteristics:
• Full diversification with 908 properties
in 44 states;
• Long-term net leases with a remaining
average lease term of 13 years;
• Property-level expenses of
maintenance, taxes, insurance and
utilities passed directly to the tenant
under our net lease structure.
These results validate our long-held
philosophy: focus on retail real estate
fundamentals in our underwriting
process and manage the things that
we can control.
National Retail Properties, Inc., is a real
estate investment trust (REIT) listed on the
New York Stock Exchange (ticker symbol:
NNN) that invests in single tenant net-
leased retail properties nationwide.
NNN has generated consistent double-digit
total returns for more than a decade supported
by its strong dividend yield and 18 consecutive
years of increased annual dividends. In 2007,
NNN acquired nearly $700 million of
properties, generated record FFO per share
growth, preserved solid portfolio occupancy
and maintained its strong balance sheet.
NNN maintains a conservatively managed,
fully diversified retail real estate portfolio
with properties subject to long-term,
net leases. As of December 31, 2007,
its 908 properties are located in 44 states
with a total gross leasable area of approximately
10.6 million square feet. Occupancy is
98.3 percent and these properties are leased
to 198 tenants in 35 industry classifications.
NNN is one of only 181 of the more than
10,000 publicly traded companies in
America to have increased annual dividends
for 18 or more consecutive years.
TABLE OF CONTENTS
1. Company Profile 2. Letter to Shareholders
14. Dividend Reinvestment & Direct Stock Purchase15. Historical Financial Highlights16. Directors & Officers
Inside Back Cover:Shareholder Information

NNN is well positioned to provide a safe and growing
dividend by growing FFO per sharewhile assuming
below-average risk.
DEAR FELLOW SHAREHOLDERS
At National Retail Properties (“NNN”)
our objective is to build long-term
value for our shareholders by paying a
safe and growing dividend, generating
steady and consistent annual FFO
per share growth and accomplishing
these dual objectives while assuming
a below average level of risk.
2007 was a challenging year for equity
investors in general and for many REIT
investors. Despite the market turmoil,
NNN achieved an 8.1 percent total
return in 2007 with a large portion
of total shareholder return coming
from our quarterly cash dividend.
It is important to note that, even in
these challenging market conditions,
we are focused on long-term
opportunities as we consistently
execute our multi-year strategy.
NNN STRATEGY
Our core strategies to create
long-term shareholder value are:
•• Acquire carefully underwritten,
accretive, net-leased retail properties.
This growth enhances results and
further diversifies our portfolio,
thereby minimizing risk;
•• Sell select properties and reinvest the
proceeds into newer, higher yielding
properties to improve the quality and
growth prospects of our core portfolio;
•• Maintain a strong balance sheet
with prudent leverage;
•• Continue developing our
talented team of associates.
2 STABILITY IN TURBULENT TIMES

NATIONAL RETAIL PROPERTIES 3
2007 RESULTS
In 2007, our entire team executed
well and we had another productive
and successful year highlighted by a
number of record achievements.
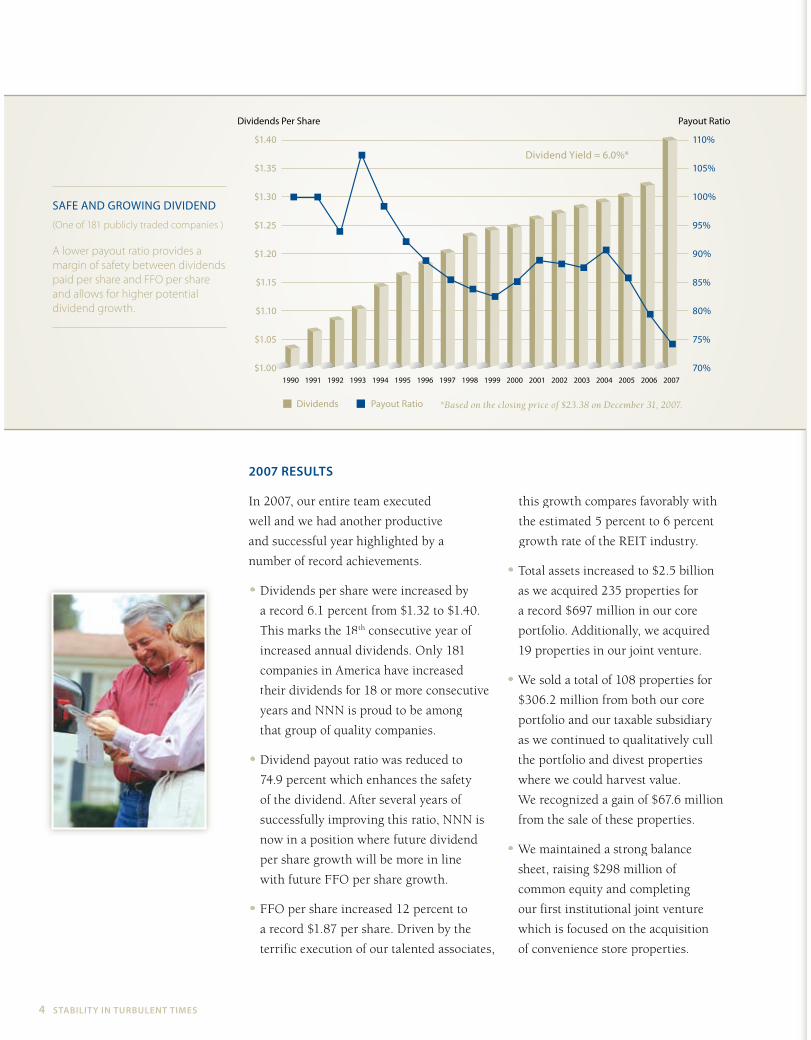
••• Dividends per share were increased by
a record 6.1 percent from $1.32 to $1.40.
This marks the 18th consecutive year of
increased annual dividends. Only 181
companies in America have increased
their dividends for 18 or more consecutive
years and NNN is proud to be among
that group of quality companies.
••• Dividend payout ratio was reduced to
74.9 percent which enhances the safety
of the dividend. After several years of
successfully improving this ratio, NNN is
now in a position where future dividend
per share growth will be more in line
with future FFO per share growth.
••• FFO per share increased 12 percent to
a record $1.87 per share. Driven by the
terrific execution of our talented associates,
this growth compares favorably with
the estimated 5 percent to 6 percent
growth rate of the REIT industry.
••• Total assets increased to $2.5 billion
as we acquired 235 properties for
a record $697 million in our core
portfolio. Additionally, we acquired
19 properties in our joint venture.
••• We sold a total of 108 properties for
$306.2 million from both our core
portfolio and our taxable subsidiary
as we continued to qualitatively cull
the portfolio and divest properties
where we could harvest value.
We recognized a gain of $67.6 million
from the sale of these properties.
••• We maintained a strong balance
sheet, raising $298 million of
common equity and completing
our first institutional joint venture
which is focused on the acquisition
of convenience store properties.
SAFE AND GROWING DIVIDEND
(One of 181 publicly traded companies )
A lower payout ratio provides a
margin of safety between dividends
paid per share and FFO per share
and allows for higher potential
dividend growth.
Dividends Payout Ratio
Payout RatioDividends Per Share
70%
75%
80%
85%
90%
95%
100%
105%
110%
1990 20072006200520042003200220012000199919981997199619951994199319921991
Dividend Yield = 6.0%*
$1.00
$1.05
$1.10
$1.15
$1.20
$1.25
$1.30
$1.35
$1.40
*Based on the closing price of $23.38 on December 31, 2007.
4 STABILITY IN TURBULENT TIMES

NATIONAL RETAIL PROPERTIES 5
DIVERSIFIED CORE PORTFOLIO
As of December 31, 2007, we owned 908
properties with an occupancy rate of
98.3 percent. The average lease maturity
of our net lease retail assets is 13 years.
Also, we have modest re-leasing risk with
few of our leases expiring in 2008 or 2009.
As of year-end, our properties were leased
to 198 different national and regional
tenants operating in 35 different retail
industry classifications. Our properties are
located in 44 states with a concentration
in the Sunbelt where the population
growth rates are the highest and retailers
are focusing their new store development.
Since January 1, 2005, our core portfolio
has expanded considerably from 362
properties to the current 908 properties.
We have more than accomplished our
objective of owning a portfolio of net-
leased retail properties fully diversified by
tenant, line of trade and geographic region.
Each acquisition is individually evaluated
by our experienced underwriting team.
When underwriting a prospective
acquisition we pay particular attention
to the real estate fundamentals of each
property. We never forget that we are in
the real estate business and while credit
is important, the strength of our company
is ultimately dependent on the key retail
real estate characteristics of our individual
properties. These key attributes include
factors such as the specific location of
the property, the demographics of the
trade area, access, visibility, ingress and
egress, traffic count, retail competition,
alternative retail uses for that location
and evaluating how the current rent
paid by the tenant compares with
the market rent for that location.
Of course, we are also focused on the ability
of the tenant to pay rent for the duration of
the lease. Our team evaluates the financial
strength of the tenant, the viability of
that tenant in the specific location and,
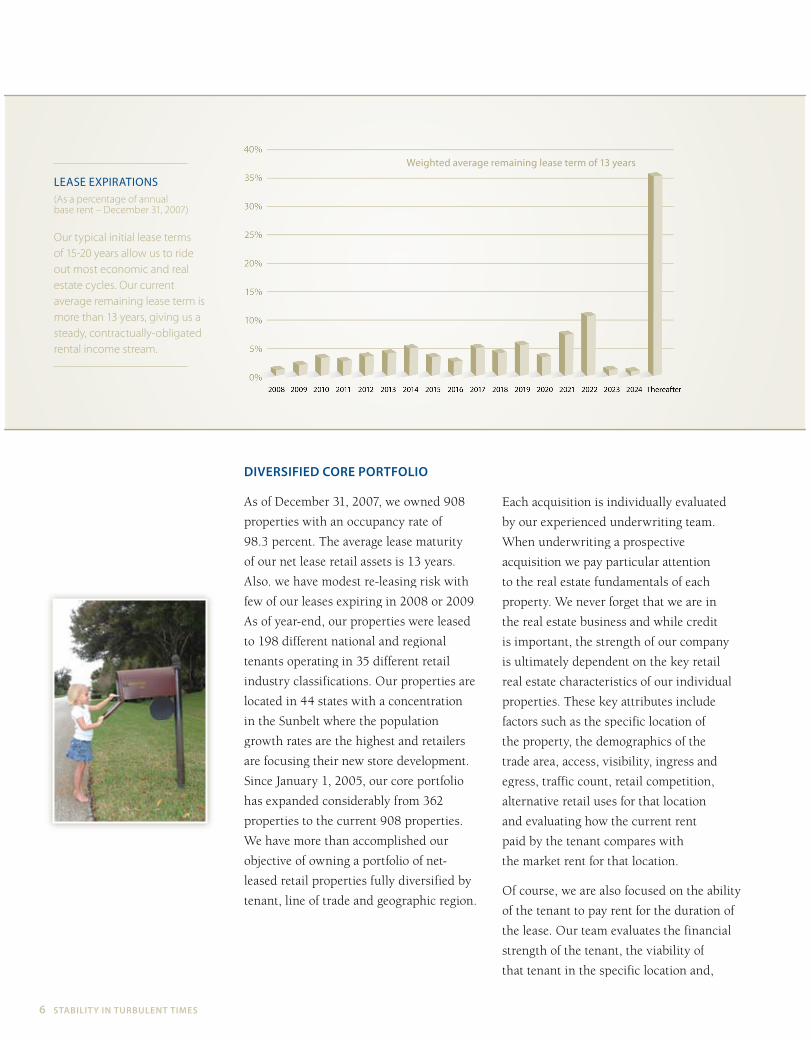
Weighted average remaining lease term of 13 years
LEASE EXPIRATIONS(As a percentage of annualbase rent – December 31, 2007)
Our typical initial lease terms
of 15-20 years allow us to ride
out most economic and real
estate cycles. Our current
average remaining lease term is
more than 13 years, giving us a
steady, contractually-obligated
rental income stream.
6 STABILITY IN TURBULENT TIMES

where possible, the unit-level economics
of that store. In general, we are looking
for the operating income contribution
from that specific store to be double
the rent of that particular location.
We believe that freestanding, net-leased
retail real estate is a superb long-term
investment for a number of reasons.
First, the ratio of land value to the total
cost of each property is unusually high
when compared to other real estate
sectors such as offices, apartments
and large regional malls. The land value
for our high profile, corner locations at
busy intersections is frequently more than
40 percent of the total value for most of
these properties at the time we purchase
them. With economic growth, inflation
and the difficulty of replacing these well-
located sites, the land value at the end
of the lease can reasonably approximate
the price that we paid for both the land
and the building upon acquisition.
We believe that the net lease format of retail real estate is a superb long-term
investment.
Second, the quality of the rental revenue
that we receive from our triple net leases
is unusually high. Our tenants are
generally responsible for property taxes,
insurance and maintenance. As a result,
our operating cash flow is more secure
and consistent than many other types of
real estate because we are not impacted
as much by increases in these costs.
Third, our leases are long-term. In the
current cautious retail environment,
it is comforting to us that, on average,
our tenants are contractually obligated
to pay rent for the next 13 years.
One area where we believe that our
shareholders can sleep comfortably is the
quality of our real estate and our tenants.
We own the corner locations of America
where much of our nation’s retail activity
takes place. Approximately two-thirds of our
rent is paid by companies that are publicly
traded and/or carry a public debt rating –
which means that they are large, financially
strong national or regional retailers.
NATIONAL RETAIL PROPERTIES 7
8 STABILITY IN TURBULENT TIMES
BALANCE SHEET STRENGTH
Maintaining a flexible and strong balance
sheet is a core attribute of NNN.
In 2007, our team was extremely active,
accessing a variety of capital sources.
We raised $298 million of new common
equity primarily through two underwritten
public offerings, and secondarily through
our dividend reinvestment and direct
stock purchase plan. We also completed a
successful $250 million 10-year unsecured
notes offering and expanded our bank
line of credit capacity by $100 million
to $400 million at attractive pricing.
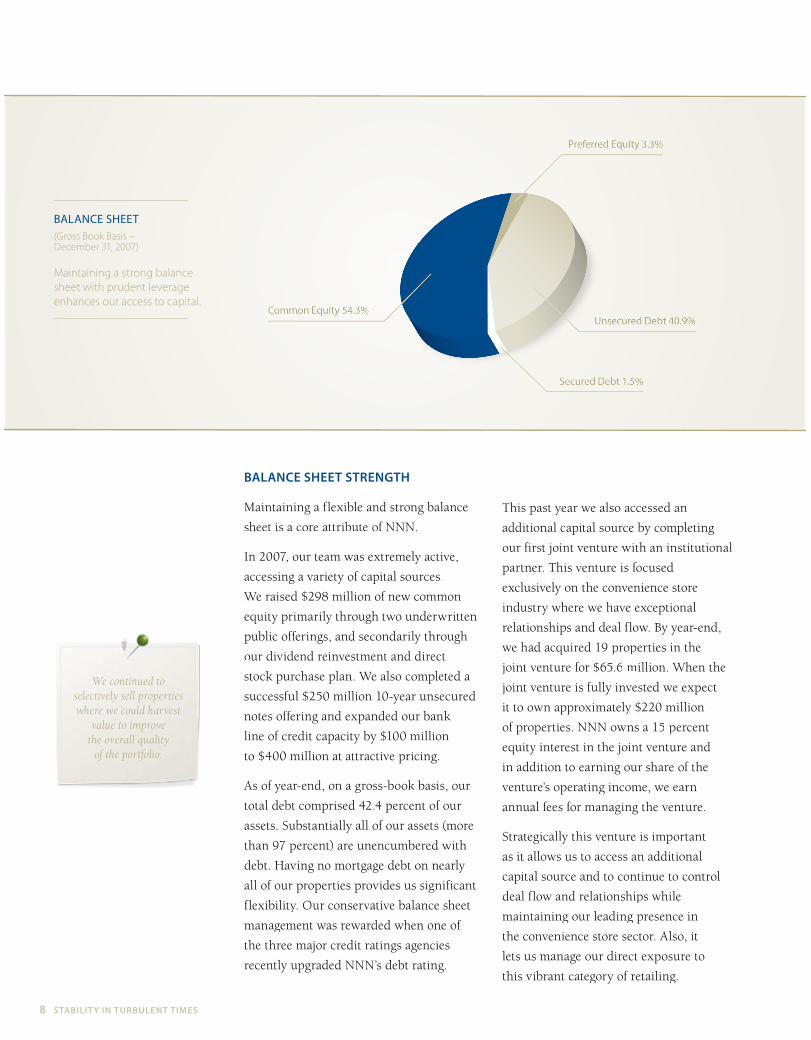
As of year-end, on a gross-book basis, our
total debt comprised 42.4 percent of our
assets. Substantially all of our assets (more
than 97 percent) are unencumbered with
debt. Having no mortgage debt on nearly
all of our properties provides us significant
flexibility. Our conservative balance sheet
management was rewarded when one of
the three major credit ratings agencies
recently upgraded NNN’s debt rating.
This past year we also accessed an
additional capital source by completing
our first joint venture with an institutional
partner. This venture is focused
exclusively on the convenience store
industry where we have exceptional
relationships and deal flow. By year-end,
we had acquired 19 properties in the
joint venture for $65.6 million. When the
joint venture is fully invested we expect
it to own approximately $220 million
of properties. NNN owns a 15 percent
equity interest in the joint venture and
in addition to earning our share of the
venture’s operating income, we earn
annual fees for managing the venture.
Strategically this venture is important
as it allows us to access an additional
capital source and to continue to control
deal flow and relationships while
maintaining our leading presence in
the convenience store sector. Also, it
lets us manage our direct exposure to
this vibrant category of retailing.
BALANCE SHEET(Gross Book Basis –December 31, 2007)
Maintaining a strong balance
sheet with prudent leverage
enhances our access to capital.
We continued to selectively sell properties where we could harvest
value to improve the overall quality
of the portfolio.

NATIONAL RETAIL PROPERTIES 9

PORTFOLIO PRUNINGAND RECYCLING CAPITAL
Our asset management team constantly
reviews our portfolio looking for assets
that do not fit our long-term strategy.
Typically, we sell assets that have fixed
rental payments and replace them with
carefully underwritten properties that have
higher yields and growing rental streams
as the rental payments escalate over the
duration of the lease. This continual process
improves the overall quality of our portfolio.
In the last three years we have sold
$505.8 million of properties from our core
portfolio, including $146 million in 2007.
The vast majority of these property
dispositions were successfully divested
by our internal team using our robust
www.nnn1031.com website. In many
instances, we have obtained exceptional
pricing for these assets by selling
properties directly to buyers thereby
avoiding brokerage commissions
and maximizing proceeds.
HUMAN CAPITAL
Our industry leading growth is due to the
hard work of all of our talented associates.
As the real estate industry continues to
evolve and mature, our human capital
management is increasingly important for
sustained performance. As managers,
our challenge is to constantly measure
and evaluate our colleagues while
ensuring that we have the appropriate
people in the correct positions. Our team
is among the most experienced and
competent in the net-lease retail arena
and many of them have been with NNN
for a long time. Philosophically, we like
to nurture and promote from within
while periodically adding people from the
outside to execute upon new initiatives.
1 Year 3 Years 5 Years 10 Years 15 Years
National Retail Properties (NNN) 8.1% 10.9% 16.2% 11.4% 13.4%
S&P 500 Index (SPX) 5.5% 8.6% 12.8% 5.9% 10.5%
Nasdaq (CCMP) 10.6% 7.6% 15.5% 5.9% 9.5%
S&P 600 Index (SML) -0.3% 7.3% 16.0% 9.0% 10.8%
ANNUAL TOTALRETURN COMPARISON(For periods endingDecember 31, 2007)
NNN shareholders have
enjoyed a 15-year average
annual total return of
13.4 percent.
10 STABILITY IN TURBULENT TIMES
Total Return is comprised of share price appreciation plus dividends paid.

NATIONAL RETAIL PROPERTIES 11

2008 AND BEYOND
The external environment in which we
operate is less friendly and more uncertain
than it was 12 months ago. Capital is
not as easily available and has become
more expensive. Also, it appears that
certain sectors of retailing are going to
experience less growth than they have
in the last several years. Finally, margin
pressures will be felt by a number of our
tenants, particularly restaurant operators,
at a time when they may have difficulty
passing these costs on to their customers.
Despite the external environment,
I am optimistic about NNN’s ability
to deliver value for our shareholders
in 2008 as we have a high quality,
diversified portfolio, our balance sheet
is very strong with adequate capital
to execute our strategy and we have
perhaps the strongest team of real estate
professionals in the net lease retail sector.
National Retail Properties is well-
positioned to fulfill our commitment
to provide our shareholders a safe and
growing dividend by growing FFO per
share while assuming below average
risk. According to The Wall Street Journal,
nearly 80 million Baby Boomers will
become eligible for Social Security
benefits over the next three decades.
These individuals all need investments
that can provide a reliable source of
income. With our track record of 18
consecutive years of paying growing
dividends, NNN is in an enviable
position of being able to satisfy the
needs of this large group of investors.
On behalf of all the associates and
directors of NNN, we thank you,
our loyal shareholders, for your support.
We are committed to working hard
to earn your continued respect and
confidence in 2008 and beyond.
Sincerely,
Craig Macnab
Chairman
& Chief Executive Officer
12 STABILITY IN TURBULENT TIMES

NATIONAL RETAIL PROPERTIES 13
WHAT DOES NNN STAND FOR?
When looking at our name, there is
no question about what we do: we focus
on retail properties throughout the
United States. However, we sometimes
get questions about the meaning
of our ticker symbol, NNN.
NNN is a common industry abbreviation
for ‘triple net lease’ – which is the primary
type of lease we have with our tenants.
A triple net lease shifts property
operating expenses (i.e., maintenance,
taxes, insurance and utilities) to the
tenant, so that the rental revenue we
receive is not subject to any variable
costs, resulting in fewer expenses
and providing a more stable cash flow.
The benefit for our tenants is that this
gives them operational control over
the property. For example, they are
able to negotiate their own rates on
insurance and maintenance items
because they pay those costs directly.
Our leases typically provide for attractive
initial yields as well as potential growth
in cash flow through base rent increases.
“We never forget that we are in the real estate
business and while credit is important,
the strength of our company is ultimately
dependent on the key retail real estatecharacteristics of our individual properties.”
14 STABILITY IN TURBULENT TIMES
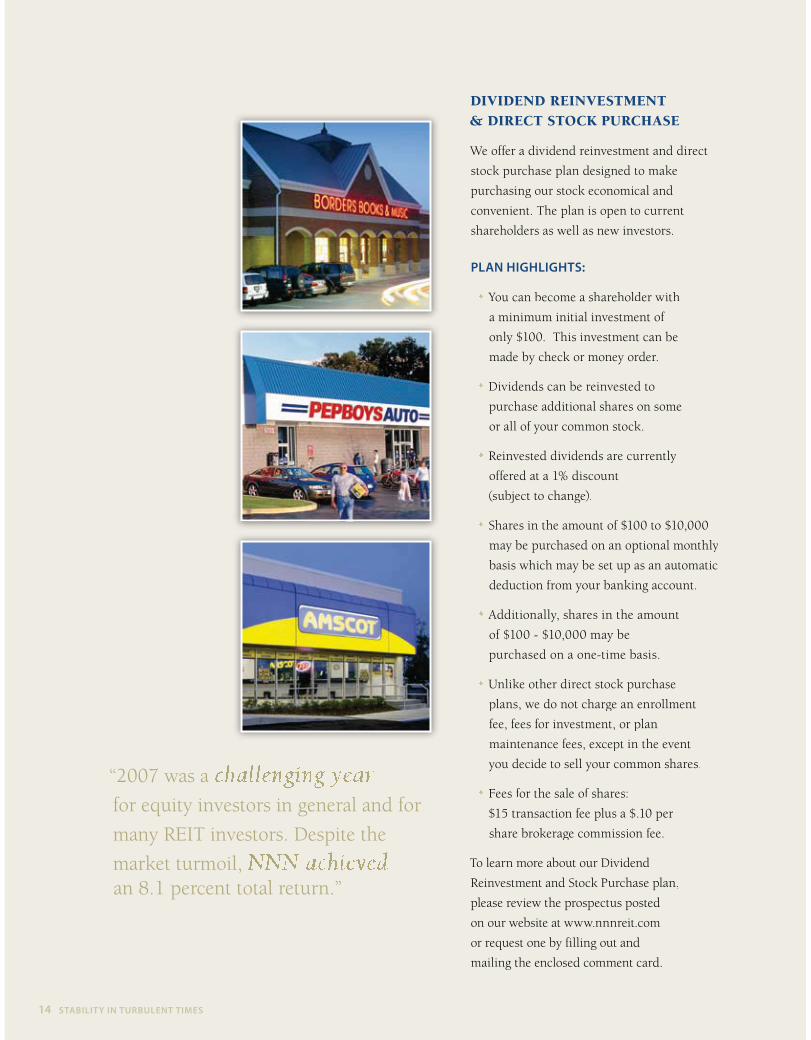
DIVIDEND REINVESTMENT& DIRECT STOCK PURCHASE
We offer a dividend reinvestment and direct
stock purchase plan designed to make
purchasing our stock economical and
convenient. The plan is open to current
shareholders as well as new investors.
PLAN HIGHLIGHTS:
•• You can become a shareholder with
a minimum initial investment of
only $100. This investment can be
made by check or money order.
•• Dividends can be reinvested to
purchase additional shares on some
or all of your common stock.
•• Reinvested dividends are currently
offered at a 1% discount
(subject to change).
•• Shares in the amount of $100 to $10,000
may be purchased on an optional monthly
basis which may be set up as an automatic
deduction from your banking account.
•• Additionally, shares in the amount
of $100 - $10,000 may be
purchased on a one-time basis.
•• Unlike other direct stock purchase
plans, we do not charge an enrollment
fee, fees for investment, or plan
maintenance fees, except in the event
you decide to sell your common shares.
•• Fees for the sale of shares:
$15 transaction fee plus a $.10 per
share brokerage commission fee.
To learn more about our Dividend
Reinvestment and Stock Purchase plan,
please review the prospectus posted
on our website at www.nnnreit.com
or request one by filling out and
mailing the enclosed comment card.
“2007 was a challenging yearchallenging yearfor equity investors in general and for
many REIT investors. Despite the
market turmoil, NNN achievedNNN achievedan 8.1 percent total return.”
NATIONAL RETAIL PROPERTIES 15
(1) Gross revenues include revenues from NNN’s continuing and discontinued operations. FASB issued Statement of Financial Accounting Standards
(“SFAS”) No. 144, “Accounting for the Impairment or Disposal of Long-Lived Assets.” This statement addresses financial accounting and reporting for the
impairment or disposal of long-lived assets and broadens the presentation of discontinued operations in the income statement to include a component
of an entity. Accordingly, the results of operations related to these certain properties that have been classified as held for sale or have been disposed of
subsequent to December 31, 2001, the effective date of SFAS No. 144, have been reclassified as earnings from discontinued operations.
(2) The National Association of Real Estate Investment Trusts (“NAREIT”) developed FFO as a relative non-GAAP financial measure of performance of a REIT
in order to recognize that income-producing real estate historically has not depreciated on the basis determined under GAAP. FFO is defined by NAREIT
and is used by NNN as follows: net earnings (computed in accordance with GAAP) plus depreciation and amortization of assets unique to the real estate
industry, excluding gains (or including losses) on the disposition of real estate held for investment, and NNN’s share of these items
from NNN’s unconsolidated partnerships and joint ventures.
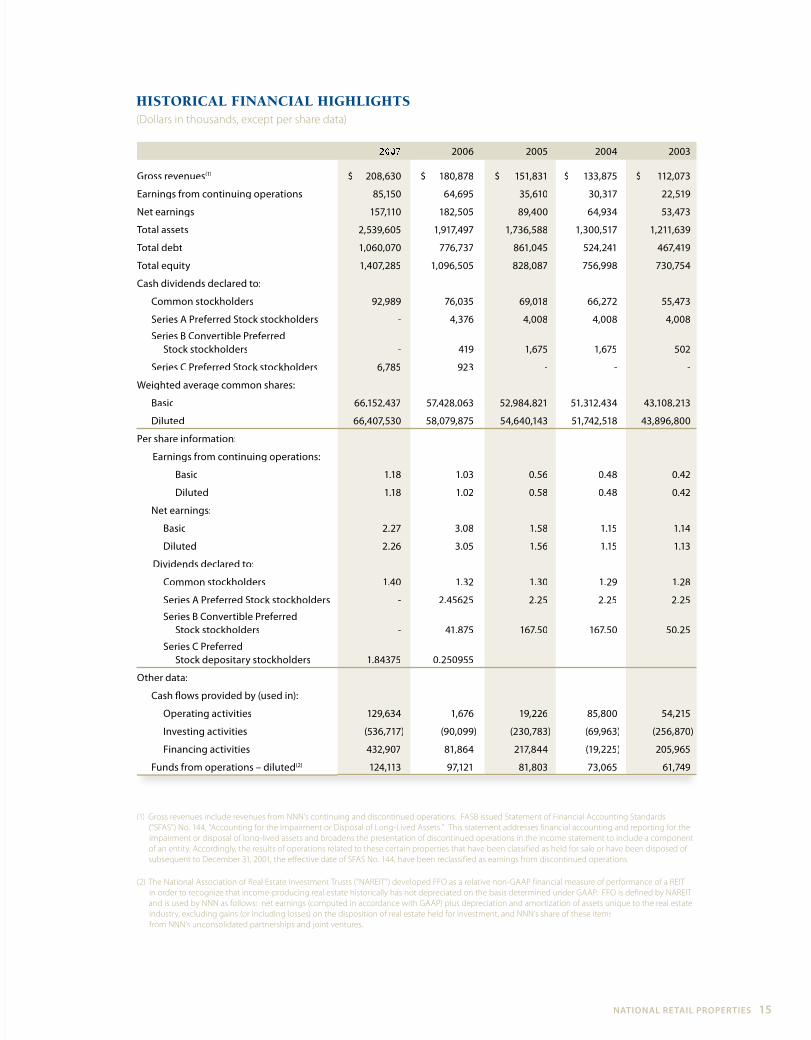
HISTORICAL FINANCIAL HIGHLIGHTS(Dollars in thousands, except per share data)
2006 2005 2004 2003
Gross revenues(1) $ 208,630 $ 180,878 $ 151,831 $ 133,875 $ 112,073
Earnings from continuing operations 85,150 64,695 35,610 30,317 22,519
Net earnings 157,110 182,505 89,400 64,934 53,473
Total assets 2,539,605 1,917,497 1,736,588 1,300,517 1,211,639
Total debt 1,060,070 776,737 861,045 524,241 467,419
Total equity 1,407,285 1,096,505 828,087 756,998 730,754
Cash dividends declared to:
Common stockholders 92,989 76,035 69,018 66,272 55,473
Series A Preferred Stock stockholders - 4,376 4,008 4,008 4,008
Series B Convertible Preferred Stock stockholders - 419 1,675 1,675 502
Series C Preferred Stock stockholders 6,785 923 - - -
Weighted average common shares:
Basic 66,152,437 57,428,063 52,984,821 51,312,434 43,108,213
Diluted 66,407,530 58,079,875 54,640,143 51,742,518 43,896,800
Per share information:
Earnings from continuing operations:
Basic 1.18 1.03 0.56 0.48 0.42
Diluted 1.18 1.02 0.58 0.48 0.42
Net earnings:
Basic 2.27 3.08 1.58 1.15 1.14
Diluted 2.26 3.05 1.56 1.15 1.13
Dividends declared to:
Common stockholders 1.40 1.32 1.30 1.29 1.28
Series A Preferred Stock stockholders - 2.45625 2.25 2.25 2.25
Series B Convertible Preferred Stock stockholders - 41.875 167.50 167.50 50.25
Series C PreferredStock depositary stockholders 1.84375 0.250955 - - -
Other data:
Cash flows provided by (used in):
Operating activities 129,634 1,676 19,226 85,800 54,215
Investing activities (536,717) (90,099) (230,783) (69,963) (256,870)
Financing activities 432,907 81,864 217,844 (19,225) 205,965
Funds from operations – diluted(2) 124,113 97,121 81,803 73,065 61,749

DIRECTORS
Craig MacnabChairman
Clifford R. HinkleLead Director
Dennis E. GershensonPresident,Chief Executive Officer& ChairmanRamco-Gershenson Properties Trust
Kevin B. HabichtExecutive Vice President& Chief Financial OfficerNational Retail Properties, Inc.
Richard B. Jennings†
PresidentRealty Capital International, Inc.& Realty Capital International LLC
Ted B. Lanier†
Retired Chairman& Chief Executive OfficerTriangle Bank and Trust Company
Robert C. LeglerRetired ChairmanFirst Marketing Corporation
Robert Martinez†
Fortieth Governor of Florida& Senior Policy AdvisorHolland & Knight
EXECUTIVE OFFICERS
Craig MacnabChairman& Chief Executive Officer
Julian E. WhitehurstPresident & Chief Operating Officer
Kevin B. HabichtExecutive Vice President& Chief Financial Officer
Paul E. BayerExecutive Vice President
Christopher P. TessitoreExecutive Vice President& General Counsel
DIRECTORS & OFFICERS
† Member audit committee
(Committees as of Febr(( uary 18, 2008)
16 STABILITY IN TURBULENT TIMES
UNITED STATESSECURITIES AND EXCHANGE COMMISSION
Washington, D. C. 20549
FORM 10-K/A(Amendment No. 1)
(Mark One)
È ANNUAL REPORT PURSUANT TO SECTION 13 OR 15 (d) OF THE SECURITIES EXCHANGEACT OF 1934.
For the fiscal year ended December 31, 2007OR
‘ TRANSITION REPORT PURSUANT TO SECTION 13 OR 15 (d) OF THE SECURITIES EXCHANGEACT OF 1934.
For the transition period from to .
Commission file number 001-11290
NATIONAL RETAIL PROPERTIES, INC.(Exact name of registrant as specified in its charter)
Maryland 56-1431377(State or other jurisdiction ofincorporation or organization)
(I.R.S. Employer Identification No.)
450 South Orange Avenue, Suite 900Orlando, Florida 32801
(Address of principal executive offices, including zip code)
Registrant’s telephone number, including area code: (407) 265-7348
Securities registered pursuant to Section 12(b) of the Act:
Title of each class: Name of exchange on which registered:
Common Stock, $0.01 par value7.375% Non-Voting Series C Preferred Stock, $0.01 par value
New York Stock ExchangeNew York Stock Exchange
Securities registered pursuant to section 12(g) of the Act:None
(Title of class)
Indicate by check mark if the registrant is a well-known seasoned issuer, as defined in Rule 405 of the Securities Act. Yes È No ‘
Indicate by check mark if the registrant is not required to file reports pursuant to Section 13 or Section 15(d) of the Act Yes ‘ No È
Indicate by check mark whether the registrant (1) has filed all reports required to be filed by Section 13 or 15(d) of the Securities ExchangeAct of 1934 during the preceding 12 months (or such shorter period that the registrant was required to file such reports), and (2) has beensubject to such filing requirements for the past 90 days. Yes È No ‘
Indicate by check mark if disclosure of delinquent filers pursuant to Item 405 of Regulation S-K is not contained herein, and will not becontained, to the best of registrant's knowledge, in definitive proxy or information statements incorporated by reference in Part III of this Form10-K or any amendment to this Form 10-K. ‘
Indicate by check mark whether the registrant is a large accelerated filer, an accelerated filer, a non-accelerated filer or a smaller reportingcompany. See definition of “accelerated filer,” “large accelerated filer” and “smaller reporting company in Rule 12b-2 of the Exchange Act.(Check one):
Large accelerated filer È Accelerated filer ‘ Non-accelerated filer ‘ Smaller reporting company ‘
Indicate by check mark whether the registrant is a shell company (as defined in Rule 12b-2 of the Act). Yes ‘ No È
The aggregate market value of voting common stock held by non-affiliates of the registrant as of June 30, 2007 was $66,159,208.
The number of shares of common stock outstanding as of February 14, 2008 was 72,534,884.

DOCUMENTS INCORPORATED BY REFERENCE:
Registrant incorporates by reference into Part III (Items 10, 11, 12, 13 and 14) of this Annual Reporton Form 10-K portions of National Retail Properties, Inc.’s definitive Proxy Statement for the 2008Annual Meeting of Stockholders to be filed with the Securities Exchange Commission pursuant toRegulation 14A. The definitive Proxy Statement will be filed with the Commission not later than 120days after the end of the fiscal year covered by this Annual Report on Form 10-K.

EXPLANATORY NOTE:
This Form 10-K/A is being filed in its entirety to correct certain typographical errors in the followingportions of National Retail Properties Inc.’s Form 10-K for the year ended December 31, 2007 (the“Form 10-K”): (i) the Report of Independent Registered Public Accounting Firm of KPMG in Item 8of the Form 10-K and (ii) the Consent of KPMG LLP filed as Exhibit 23.2 to the Form 10-K.

TABLE OF CONTENTS
PAGEREFERENCE
Part IItem 1. Business . . . . . . . . . . . . . . . . . . . . . . . . . . . . . . . . . . . . . . . . . . . . . . . . . . . . . . . . . 1Item 1A. Risk Factors . . . . . . . . . . . . . . . . . . . . . . . . . . . . . . . . . . . . . . . . . . . . . . . . . . . . . . 9Item 1B. Unresolved Staff Comments . . . . . . . . . . . . . . . . . . . . . . . . . . . . . . . . . . . . . . . . . 16Item 2. Properties . . . . . . . . . . . . . . . . . . . . . . . . . . . . . . . . . . . . . . . . . . . . . . . . . . . . . . . . 17Item 3. Legal Proceedings . . . . . . . . . . . . . . . . . . . . . . . . . . . . . . . . . . . . . . . . . . . . . . . . . 17Item 4. Submission of Matters to a Vote of Security Holders . . . . . . . . . . . . . . . . . . . . . . 17
Part IIItem 5. Market for Registrant’s Common Equity, Related Stockholder Matters and
Issuer Purchases of Equity Securities . . . . . . . . . . . . . . . . . . . . . . . . . . . . . . . . . . 18Item 6. Selected Financial Data . . . . . . . . . . . . . . . . . . . . . . . . . . . . . . . . . . . . . . . . . . . . . 20Item 7. Management’s Discussion and Analysis of Financial Condition and Results of
Operation . . . . . . . . . . . . . . . . . . . . . . . . . . . . . . . . . . . . . . . . . . . . . . . . . . . . . . . . 22Item 7A. Quantitative and Qualitative Disclosures About Market Risk . . . . . . . . . . . . . . . 46Item 8. Financial Statements and Supplementary Data . . . . . . . . . . . . . . . . . . . . . . . . . . . 47Item 9. Changes in and Disagreements With Accountants on Accounting and Financial
Disclosure . . . . . . . . . . . . . . . . . . . . . . . . . . . . . . . . . . . . . . . . . . . . . . . . . . . . . . . 94Item 9A. Controls and Procedures . . . . . . . . . . . . . . . . . . . . . . . . . . . . . . . . . . . . . . . . . . . . 94Item 9B. Other Information . . . . . . . . . . . . . . . . . . . . . . . . . . . . . . . . . . . . . . . . . . . . . . . . . 96
Part IIIItem 10. Directors, Executive Officers and Corporate Governance . . . . . . . . . . . . . . . . . . 97Item 11. Executive Compensation . . . . . . . . . . . . . . . . . . . . . . . . . . . . . . . . . . . . . . . . . . . . 97Item 12. Security Ownership of Certain Beneficial Owners and Management and Related
Stockholder Matters . . . . . . . . . . . . . . . . . . . . . . . . . . . . . . . . . . . . . . . . . . . . . . . . 97Item 13. Certain Relationships and Related Transactions, and Director Independence . . . 97Item 14. Principal Accountant Fees and Services . . . . . . . . . . . . . . . . . . . . . . . . . . . . . . . . 97
Part IVItem 15. Exhibits and Financial Statement Schedules . . . . . . . . . . . . . . . . . . . . . . . . . . . . 98
Signatures . . . . . . . . . . . . . . . . . . . . . . . . . . . . . . . . . . . . . . . . . . . . . . . . . . . . . . . . . . . . . . . . . 103
PART I
Unless the context otherwise requires, references in this Annual Report on Form 10-K to the terms“registrant” or “NNN” or “the Company” refer to National Retail Properties, Inc. and its[consolidated] subsidiaries, including taxable real estate investment trust (“REIT”) subsidiaries andtheir majority owned and controlled subsidiaries (collectively the “TRS”).
Statements contained in this annual report on Form 10-K, including the documents that areincorporated by reference, that are not historical facts are forward-looking statements within themeaning of Section 27A of the Securities Act of 1933 and Section 21E of the Securities Exchange Act of1934. Also, when NNN uses any of the words “anticipate,” “assume,” “believe,” “estimate,”“expect,” “intend,” or similar expressions, NNN is making forward-looking statements. Althoughmanagement believes that the expectations reflected in such forward-looking statements are basedupon present expectations and reasonable assumptions, NNN’s actual results could differ materiallyfrom those set forth in the forward-looking statements. Certain factors that could cause actual resultsor events to differ materially from those NNN anticipates or projects are described in Item 1A. “RiskFactors” of this Annual Report on Form 10-K.
Given these uncertainties, readers are cautioned not to place undue reliance on such statements, whichspeak only as of the date of this Annual Report on Form 10-K or any document incorporated herein byreference. NNN undertakes no obligation to publicly release any revisions to these forward-lookingstatements that may be made to reflect events or circumstances after the date of this Annual Report onForm 10-K.
Item 1. Business
The Company
NNN, a Maryland corporation, is a fully integrated REIT formed in 1984. NNN’s operations aredivided into two primary business segments: (i) investment assets, including real estate assets andmortgages and notes receivable (including structured finance) (collectively, “Investment Assets”), and(ii) inventory real estate assets (“Inventory Assets”). The Investment Assets are operated throughNational Retail Properties, Inc. and its wholly owned subsidiaries. The Inventory Assets are held in theTRS.
Real Estate Assets
NNN acquires, owns, invests in, manages and develops properties that are leased primarily to retailtenants under long-term net leases (“Investment Properties” or “Investment Portfolio”). As ofDecember 31, 2007, NNN owned 908 Investment Properties, with an aggregate leasable area of10,610,000 square feet, located in 44 states. Approximately 98 percent of NNN’s Investment Portfoliowas leased at December 31, 2007. The TRS, directly and indirectly, through investment interests,acquires and/or develops real estate primarily for the purpose of resale (“Inventory Properties” or“Inventory Portfolio”). As of December 31, 2007, the TRS owned 56 Inventory Properties.
Mortgages and Notes Receivable
Mortgages are loans secured by real estate, real estate securities or other assets. As of December 31,2007, these receivables totaled $49,336,000.
1

Structured finance agreements are typically loans secured by a borrower’s pledge of ownershipinterests in the entity that owns or leases the real estate and/or other acceptable collateral such asfixtures, equipment or cash. These agreements are sometimes subordinated to senior loans secured byfirst mortgages encumbering the underlying real estate. Subordinated positions are generally subject toa higher risk of nonpayment of principal and interest than the more senior loans. As of December 31,2007, the structured finance agreements had an outstanding principal balance of $14,359,000.
Investment in Unconsolidated Affiliate
Crow Holdings. In September 2007, NNN entered into a joint venture, NNN Retail Properties Fund ILLC (the “NNN Crow JV I”), with an affiliate of Crow Holdings Realty Partners IV, L.P. NNN CrowJV I plans to acquire from unrelated third parties up to $220,000,000 of real estate assets leased toconvenience store operators.
Competition
NNN generally competes with numerous other REITs, commercial developers, real estate limitedpartnerships and other investors, including but not limited to, insurance companies, pension funds andfinancial institutions, that own, manage, finance or develop retail and net leased properties.
Employees
As of January 31, 2008, NNN employed 72 full-time associates including executive and administrativepersonnel.
NNN’s executive offices are located at 450 S. Orange Avenue, Suite 900, Orlando, Florida 32801, andits telephone number is (407) 265-7348. NNN has an Internet website at www.nnnreit.com whereNNN’s filings with the Securities and Exchange Commission can be downloaded free of charge. Thecommon shares of National Retail Properties, Inc. are traded on the New York Stock Exchange(“NYSE”), under the ticker symbol “NNN.”
Business Strategies and Policies
The following is a discussion of NNN’s operating strategy and certain of its investment, financing andother policies. These strategies and policies have been set by management and/or the Board ofDirectors and, in general, may be amended or revised from time to time by management and/or theBoard of Directors without a vote of NNN’s stockholders.
Operating Strategies
NNN’s strategy is to invest primarily in retail real estate that is typically located along high-trafficcommercial corridors near areas of commercial and residential density. Management believes thatthese types of properties, when leased to national or regional retailers generally pursuant to triple-netleases, provide attractive opportunities for a stable current return and the potential for increased currentreturns and capital appreciation. Triple-net leases typically require the tenant to pay property operatingexpenses such as real estate taxes, assessments and other government charges, insurance, utilities, andrepairs and maintenance. Initial lease terms are generally 15 to 20 years.
2
In some cases, NNN’s investment in real estate is in the form of mortgages, structured financeinvestments or other loans which may be secured by real estate, a borrower’s pledge of ownershipinterests in the entity that owns the real estate or other assets. These investments may be subordinatedto senior loans secured by other loans encumbering the underlying real estate or assets. Subordinatedpositions are generally subject to a higher risk of nonpayment of principal and interest than the moresenior loans.
NNN holds investment real estate assets until it determines that the sale of such a property isadvantageous in view of NNN’s investment objectives. In deciding whether to sell a real estateinvestment asset, NNN may consider factors such as potential capital appreciation, net cash flow,tenant credit quality, market lease rates, potential use of sale proceeds and federal income taxconsiderations.
NNN acquires and/or develops inventory real estate assets primarily for the purpose of resale.
NNN’s management team considers certain key indicators to evaluate the financial condition andoperating performance of NNN. The key indicators for NNN may include items such as: thecomposition of NNN’s Investment Portfolio (such as tenant, geographic and industry classificationdiversification), the occupancy rate of NNN’s Investment Portfolio, certain financial performanceratios, profitability measures and industry trends compared to that of NNN.
The operating strategies employed by NNN have allowed it to increase dividends paid per commonshare for 18 consecutive years.
Investment in Real Estate or Interests in Real Estate
NNN’s management believes that attractive acquisition opportunities for retail properties will continueto be available and that NNN is well suited to take advantage of these opportunities because of itsaccess to capital markets, ability to underwrite and acquire properties, and because of management’sexperience in seeking out, identifying and evaluating potential acquisitions.
In evaluating a particular acquisition, management may consider a variety of factors, including:
• the location, visibility and accessibility of the property,
• the geographic area and demographic characteristics of the community, as well as the localreal estate market, including potential for growth and existing or potential competingproperties or retailers,
• the size of the property,
• the purchase price,
• the non-financial terms of the proposed acquisition,
• the availability of funds or other consideration for the proposed acquisition and the costthereof,
• the compatibility of the property with NNN’s existing portfolio,
• the potential for, and current extent of, any environmental problems,
• the quality of construction and design and the current physical condition of the property,
3
• the financial and other characteristics of the existing tenant,
• the tenant’s business plan, operating history and management team,
• the tenant’s industry,
• the terms of any existing leases, and
• the rent to be paid by the tenant.
NNN intends to engage in future investment activities in a manner that is consistent with themaintenance of its status as a REIT for federal income tax purposes and that will not make NNN aninvestment company under the Investment Company Act of 1940, as amended. Equity investments inacquired properties may be subject to existing mortgage financings and other indebtedness or to newindebtedness which may be incurred in connection with acquiring or refinancing these investments.
Investments in Real Estate Mortgages, Commercial Mortgage Residual Interests, and Securities of orInterests in Persons Engaged in Real Estate Activities
While NNN’s primary business objectives and current portfolio ownership primarily emphasize retailproperties, NNN may invest in (i) a wide variety of property and tenant types, (ii) leases, mortgages,commercial mortgage residual interests and other types of real estate interests, (iii) loans secured bycollateral related to business operations of an owned or leased property, or (iv) securities of otherREITs, other entities engaged in real estate activities or securities of other issuers, including for thepurpose of exercising control over such entities. For example, NNN from time to time has madeinvestments in mortgage loans or held mortgages on properties that NNN has sold and has madestructured finance investments and other loans related to properties acquired or sold.
Financing Strategy
NNN’s financing objective is to manage its capital structure effectively in order to provide sufficientcapital to execute its operating strategies while servicing its debt requirements and providing value toits stockholders. NNN generally utilizes debt and equity security offerings, bank borrowings, the saleof properties, and to a lesser extent, internally generated funds to meet its capital needs.
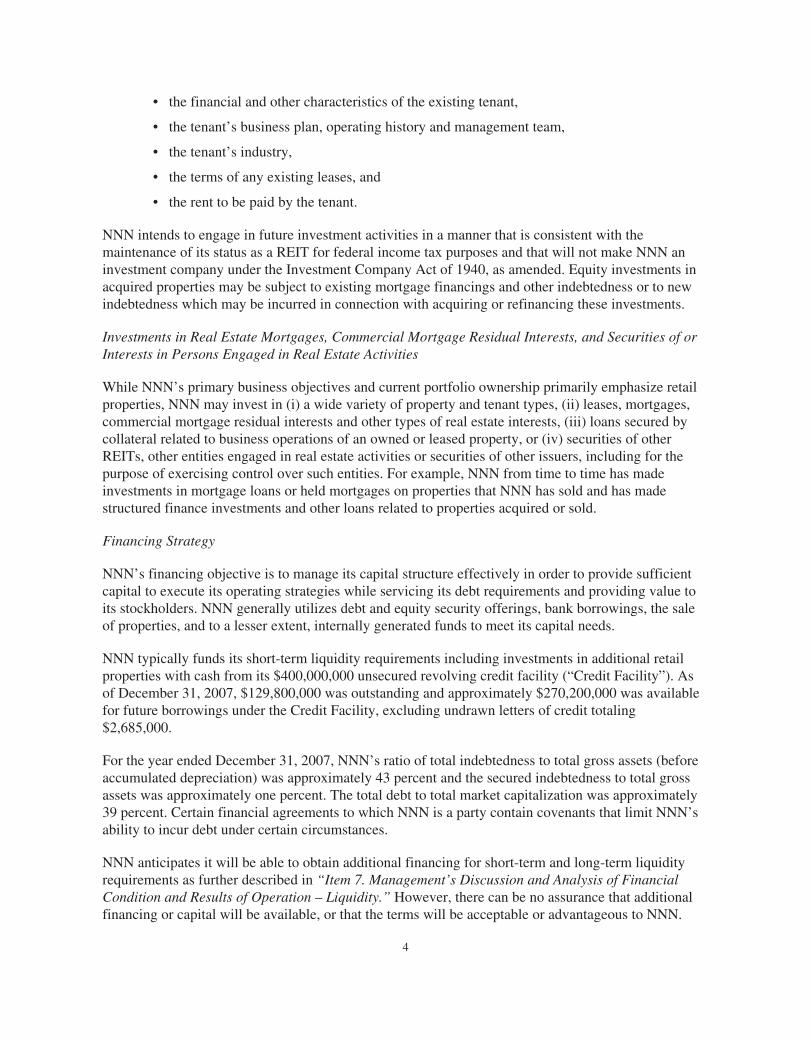
NNN typically funds its short-term liquidity requirements including investments in additional retailproperties with cash from its $400,000,000 unsecured revolving credit facility (“Credit Facility”). Asof December 31, 2007, $129,800,000 was outstanding and approximately $270,200,000 was availablefor future borrowings under the Credit Facility, excluding undrawn letters of credit totaling$2,685,000.
For the year ended December 31, 2007, NNN’s ratio of total indebtedness to total gross assets (beforeaccumulated depreciation) was approximately 43 percent and the secured indebtedness to total grossassets was approximately one percent. The total debt to total market capitalization was approximately39 percent. Certain financial agreements to which NNN is a party contain covenants that limit NNN’sability to incur debt under certain circumstances.
NNN anticipates it will be able to obtain additional financing for short-term and long-term liquidityrequirements as further described in “Item 7. Management’s Discussion and Analysis of FinancialCondition and Results of Operation – Liquidity.” However, there can be no assurance that additionalfinancing or capital will be available, or that the terms will be acceptable or advantageous to NNN.
4
The organizational documents of NNN do not limit the absolute amount or percentage of indebtednessthat NNN may incur. Additionally, NNN may change its financing strategy at any time. NNN has notengaged in trading, underwriting or agency distribution or sale of securities of other issues and doesnot intend to do so.
Strategies and Policy Changes
Any of NNN’s strategies or policies described above may be changed at any time by NNN withoutnotice to or a vote of NNN’s stockholders.
Investment Properties
As of December 31, 2007, NNN owned 908 Investment Properties with an aggregate gross leasablearea of 10,610,000 square feet, located in 44 states. Approximately 98 percent of the gross leasablearea was leased at December 31, 2007. Reference is made to the Schedule of Real Estate andAccumulated Depreciation and Amortization filed with this report for a listing of NNN’s InvestmentProperties and their respective carrying costs.
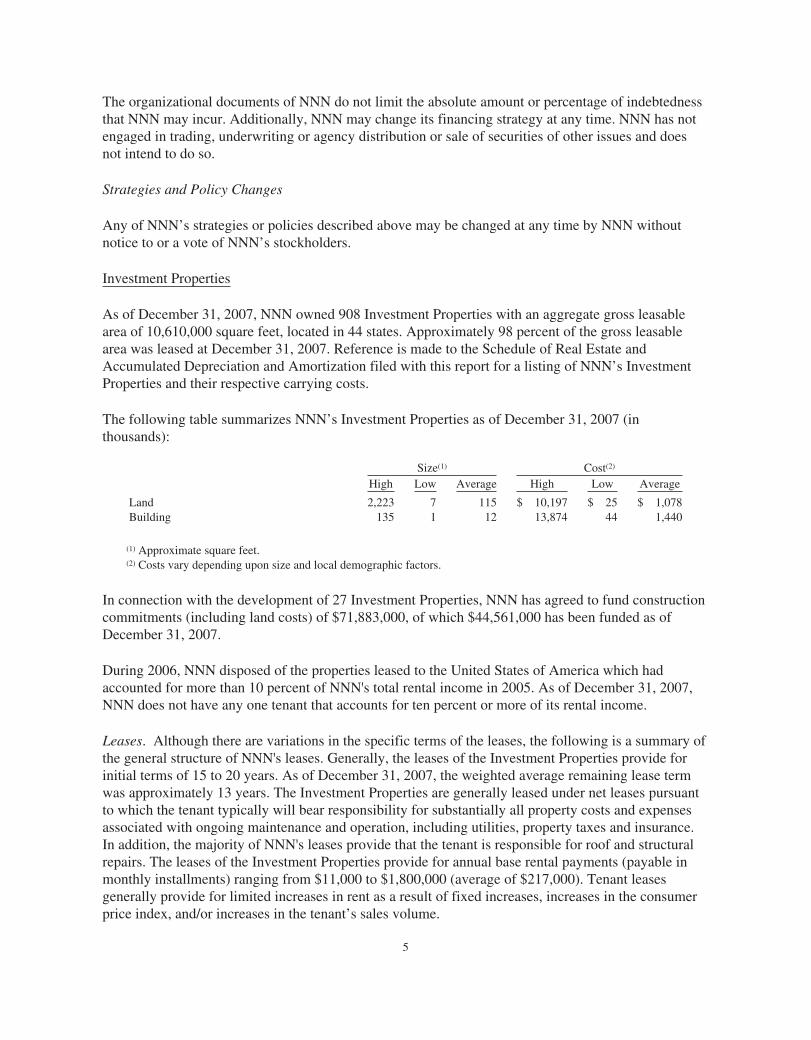
The following table summarizes NNN’s Investment Properties as of December 31, 2007 (inthousands):
Size(1) Cost(2)
High Low Average High Low Average
Land 2,223 7 115 $ 10,197 $ 25 $ 1,078Building 135 1 12 13,874 44 1,440
(1) Approximate square feet.(2) Costs vary depending upon size and local demographic factors.
In connection with the development of 27 Investment Properties, NNN has agreed to fund constructioncommitments (including land costs) of $71,883,000, of which $44,561,000 has been funded as ofDecember 31, 2007.
During 2006, NNN disposed of the properties leased to the United States of America which hadaccounted for more than 10 percent of NNN's total rental income in 2005. As of December 31, 2007,NNN does not have any one tenant that accounts for ten percent or more of its rental income.
Leases. Although there are variations in the specific terms of the leases, the following is a summary ofthe general structure of NNN's leases. Generally, the leases of the Investment Properties provide forinitial terms of 15 to 20 years. As of December 31, 2007, the weighted average remaining lease termwas approximately 13 years. The Investment Properties are generally leased under net leases pursuantto which the tenant typically will bear responsibility for substantially all property costs and expensesassociated with ongoing maintenance and operation, including utilities, property taxes and insurance.In addition, the majority of NNN's leases provide that the tenant is responsible for roof and structuralrepairs. The leases of the Investment Properties provide for annual base rental payments (payable inmonthly installments) ranging from $11,000 to $1,800,000 (average of $217,000). Tenant leasesgenerally provide for limited increases in rent as a result of fixed increases, increases in the consumerprice index, and/or increases in the tenant’s sales volume.
5
Generally, the Investment Property leases provide the tenant with one or more multi-year renewaloptions subject to generally the same terms and conditions as the initial lease. Some of the leases alsoprovide that in the event NNN wishes to sell the Investment Property subject to that lease, NNN firstmust offer the lessee the right to purchase the Investment Property on the same terms and conditions asany offer which NNN intends to accept for the sale of the Investment Property.
Certain Investment Properties have leases that provide the tenant with a purchase option to acquire theInvestment Property from NNN. The purchase price calculations are generally stated in the leaseagreement or are based on current market value.
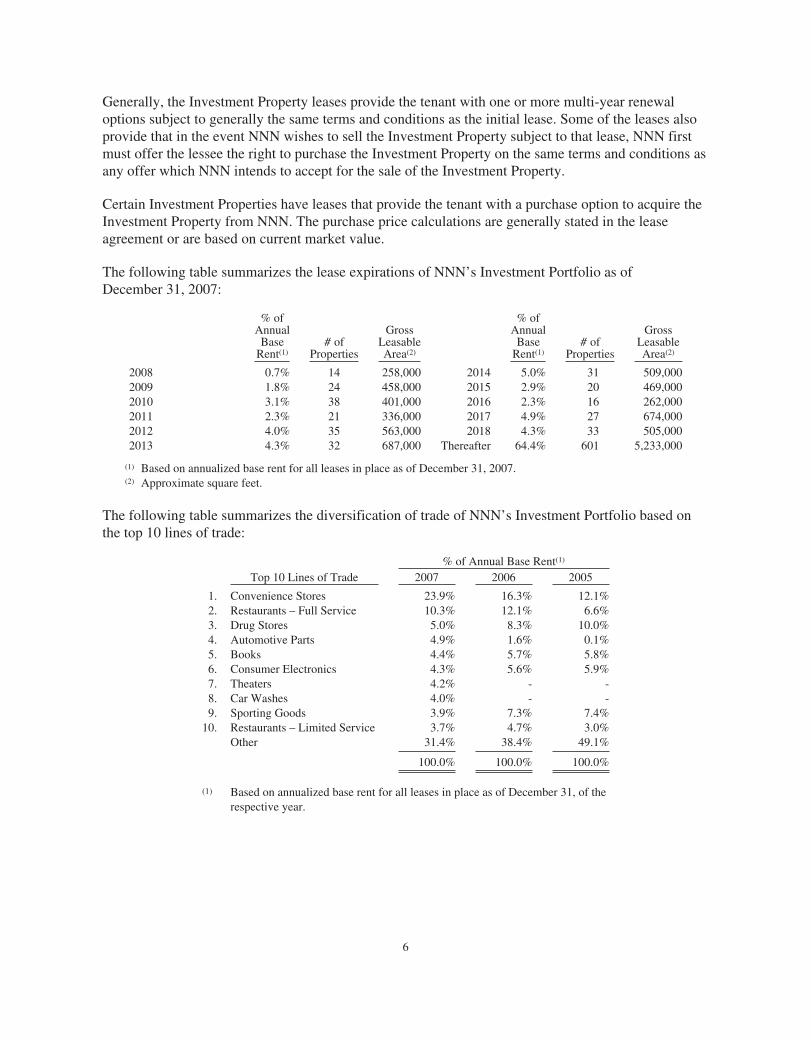
The following table summarizes the lease expirations of NNN’s Investment Portfolio as ofDecember 31, 2007:
% ofAnnualBase
Rent(1)# of
Properties
GrossLeasableArea(2)
% ofAnnualBase
Rent(1)# of
Properties
GrossLeasableArea(2)
2008 0.7% 14 258,000 2014 5.0% 31 509,0002009 1.8% 24 458,000 2015 2.9% 20 469,0002010 3.1% 38 401,000 2016 2.3% 16 262,0002011 2.3% 21 336,000 2017 4.9% 27 674,0002012 4.0% 35 563,000 2018 4.3% 33 505,0002013 4.3% 32 687,000 Thereafter 64.4% 601 5,233,000
(1) Based on annualized base rent for all leases in place as of December 31, 2007.(2) Approximate square feet.
The following table summarizes the diversification of trade of NNN’s Investment Portfolio based onthe top 10 lines of trade:
% of Annual Base Rent(1)
Top 10 Lines of Trade 2007 2006 2005
1. Convenience Stores 23.9% 16.3% 12.1%2. Restaurants – Full Service 10.3% 12.1% 6.6%3. Drug Stores 5.0% 8.3% 10.0%4. Automotive Parts 4.9% 1.6% 0.1%5. Books 4.4% 5.7% 5.8%6. Consumer Electronics 4.3% 5.6% 5.9%7. Theaters 4.2% - -8. Car Washes 4.0% - -9. Sporting Goods 3.9% 7.3% 7.4%
10. Restaurants – Limited Service 3.7% 4.7% 3.0%Other 31.4% 38.4% 49.1%
100.0% 100.0% 100.0%
(1) Based on annualized base rent for all leases in place as of December 31, of therespective year.
6
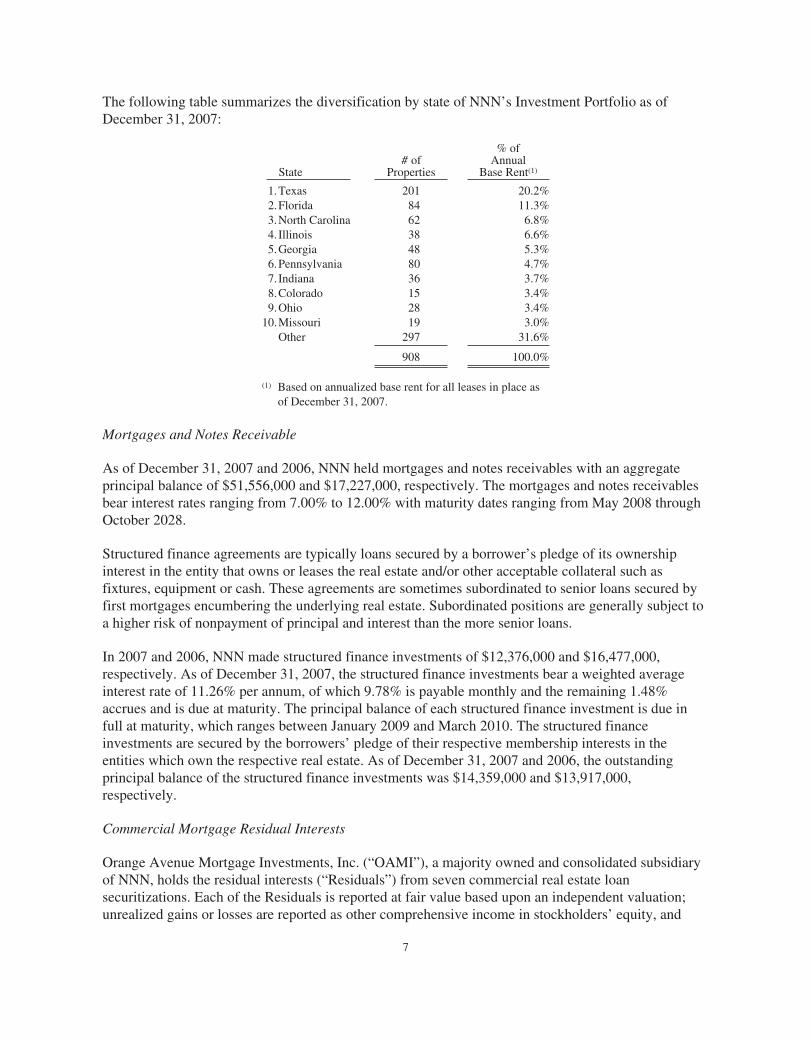
The following table summarizes the diversification by state of NNN’s Investment Portfolio as ofDecember 31, 2007:
State# of
Properties
% ofAnnual
Base Rent(1)
1.Texas 201 20.2%2.Florida 84 11.3%3.North Carolina 62 6.8%4.Illinois 38 6.6%5.Georgia 48 5.3%6.Pennsylvania 80 4.7%7.Indiana 36 3.7%8.Colorado 15 3.4%9.Ohio 28 3.4%
10.Missouri 19 3.0%Other 297 31.6%
908 100.0%
(1) Based on annualized base rent for all leases in place asof December 31, 2007.
Mortgages and Notes Receivable
As of December 31, 2007 and 2006, NNN held mortgages and notes receivables with an aggregateprincipal balance of $51,556,000 and $17,227,000, respectively. The mortgages and notes receivablesbear interest rates ranging from 7.00% to 12.00% with maturity dates ranging from May 2008 throughOctober 2028.
Structured finance agreements are typically loans secured by a borrower’s pledge of its ownershipinterest in the entity that owns or leases the real estate and/or other acceptable collateral such asfixtures, equipment or cash. These agreements are sometimes subordinated to senior loans secured byfirst mortgages encumbering the underlying real estate. Subordinated positions are generally subject toa higher risk of nonpayment of principal and interest than the more senior loans.
In 2007 and 2006, NNN made structured finance investments of $12,376,000 and $16,477,000,respectively. As of December 31, 2007, the structured finance investments bear a weighted averageinterest rate of 11.26% per annum, of which 9.78% is payable monthly and the remaining 1.48%accrues and is due at maturity. The principal balance of each structured finance investment is due infull at maturity, which ranges between January 2009 and March 2010. The structured financeinvestments are secured by the borrowers’ pledge of their respective membership interests in theentities which own the respective real estate. As of December 31, 2007 and 2006, the outstandingprincipal balance of the structured finance investments was $14,359,000 and $13,917,000,respectively.
Commercial Mortgage Residual Interests
Orange Avenue Mortgage Investments, Inc. (“OAMI”), a majority owned and consolidated subsidiaryof NNN, holds the residual interests (“Residuals”) from seven commercial real estate loansecuritizations. Each of the Residuals is reported at fair value based upon an independent valuation;unrealized gains or losses are reported as other comprehensive income in stockholders’ equity, and
7
other than temporary losses as a result of a change in timing or amount of estimated cash flows arerecorded as an other than temporary valuation impairment. The Residuals had an estimated fair valueof $24,340,000 at December 31, 2007.
Inventory Assets
The TRS develops Inventory Properties (“Development Properties” or “Development Portfolio”) aswell as acquires existing Inventory Properties (“Exchange Properties” or “Exchange Portfolio”).NNN's Inventory Portfolio is held with the intent to sell the properties to purchasers who are lookingfor replacement like-kind exchange property or to other purchasers with different investmentobjectives. As of December 31, 2007, the TRS owned 23 Development Properties (eight completed,nine under construction and six land parcels) and 33 Exchange Properties. Reference is made to theSchedule of Real Estate and Accumulated Depreciation and Amortization filed with this report for alisting of the Inventory Properties and their respective carrying costs.
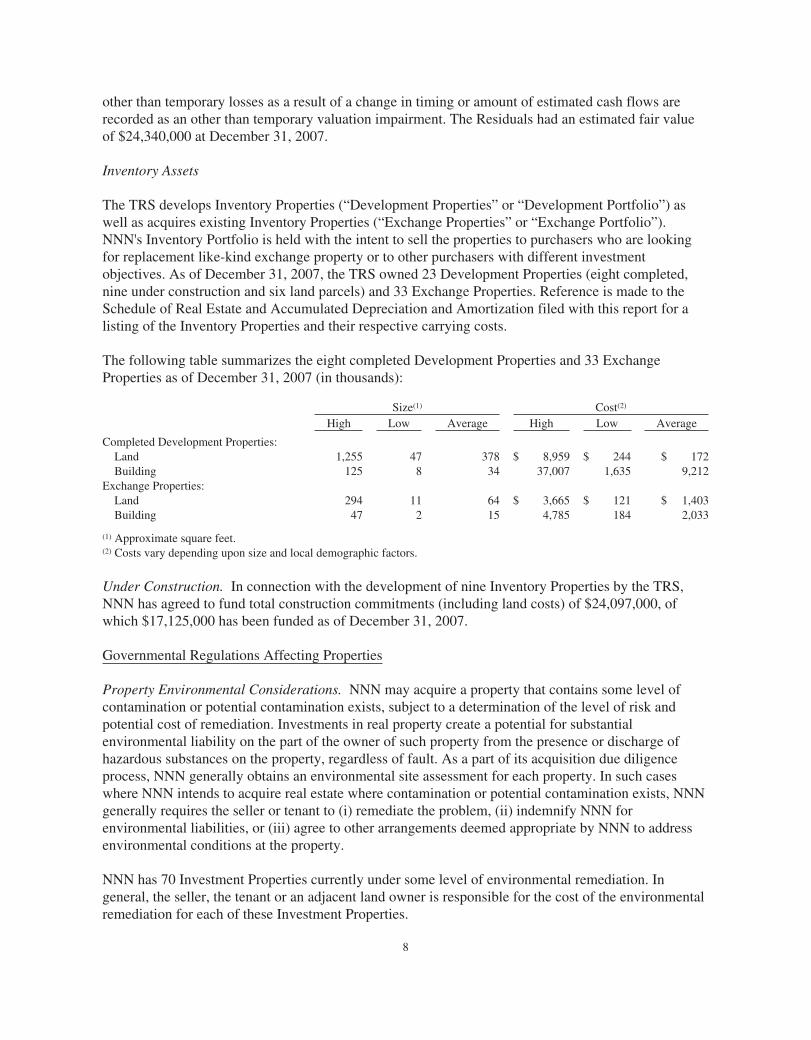
The following table summarizes the eight completed Development Properties and 33 ExchangeProperties as of December 31, 2007 (in thousands):
Size(1) Cost(2)
High Low Average High Low Average
Completed Development Properties:Land 1,255 47 378 $ 8,959 $ 244 $ 172Building 125 8 34 37,007 1,635 9,212
Exchange Properties:Land 294 11 64 $ 3,665 $ 121 $ 1,403Building 47 2 15 4,785 184 2,033
(1) Approximate square feet.(2) Costs vary depending upon size and local demographic factors.
Under Construction. In connection with the development of nine Inventory Properties by the TRS,NNN has agreed to fund total construction commitments (including land costs) of $24,097,000, ofwhich $17,125,000 has been funded as of December 31, 2007.
Governmental Regulations Affecting Properties
Property Environmental Considerations. NNN may acquire a property that contains some level ofcontamination or potential contamination exists, subject to a determination of the level of risk andpotential cost of remediation. Investments in real property create a potential for substantialenvironmental liability on the part of the owner of such property from the presence or discharge ofhazardous substances on the property, regardless of fault. As a part of its acquisition due diligenceprocess, NNN generally obtains an environmental site assessment for each property. In such caseswhere NNN intends to acquire real estate where contamination or potential contamination exists, NNNgenerally requires the seller or tenant to (i) remediate the problem, (ii) indemnify NNN forenvironmental liabilities, or (iii) agree to other arrangements deemed appropriate by NNN to addressenvironmental conditions at the property.
NNN has 70 Investment Properties currently under some level of environmental remediation. Ingeneral, the seller, the tenant or an adjacent land owner is responsible for the cost of the environmentalremediation for each of these Investment Properties.
8
Americans with Disabilities Act of 1990. The Investment and Inventory Properties, as commercialfacilities, are required to comply with Title III of the Americans with Disabilities Act of 1990 (the“ADA”). Investigation of a property may reveal non-compliance with the ADA. The tenants willtypically have primary responsibility for complying with the ADA, but NNN may incur costs if thetenant does not comply. As of February 15, 2008, NNN has not been notified by any governmentalauthority of, nor is NNN’s management aware of, any non-compliance with the ADA that NNN’smanagement believes would have a material adverse effect on its business, financial condition orresults of operations.
Other Regulations. State and local fire, life-safety and similar requirements regulate the use of NNN’sInvestment and Inventory Properties. The leases generally require that each tenant will have primaryresponsibility for complying with regulations, but failure to comply could result in fines bygovernmental authorities, awards of damages to private litigants, or restrictions on the ability toconduct business on such properties.
Item 1A. Risk Factors.
Carefully consider the following risks and all of the other information set forth in this Annual Reporton Form 10-K, including the consolidated financial statements and the notes thereto. If any of theevents or developments described below were actually to occur, NNN’s business, financial conditionor results of operations could be adversely affected.
Loss of revenues from tenants would reduce NNN’s cash flow.
NNN’s five largest tenants accounted for an aggregate of approximately 25 percent of NNN’s annualbase rent as of December 31, 2007. The default, financial distress or bankruptcy of one or more ofNNN’s tenants could cause substantial vacancies among NNN’s Investment Portfolio. Vacanciesreduce NNN’s revenues until NNN is able to re-lease the affected properties and could decrease theultimate sale value of each such vacant property. Upon the expiration of the leases that are currently inplace, NNN may not be able to re-lease a vacant property at a comparable lease rate or withoutincurring additional expenditures in connection with such re-leasing.
A significant portion of the source of NNN’s annual base rent is heavily concentrated in a specificindustry classification and in specific geographic locations.
As of December 31, 2007, an aggregate of approximately 38 percent of NNN’s annual base rent isgenerated from two retail lines of trade, convenience stores and restaurants, each representing morethan 10 percent. In addition, as of December 31, 2007, an aggregate of approximately 32 percent ofNNN’s annual base rent is generated from properties in Texas and Florida, each representing more than10 percent. Any financial hardship and/or changes in these industries or states could have an adverseeffect on NNN’s financial results.
There are a number of risks inherent in owning real estate and indirect interests in real estate.
NNN’s economic performance and the value of its real estate assets are subject to the risk that ifNNN’s properties do not generate revenues sufficient to meet its operating expenses, including debtservice, NNN’s cash flow and ability to pay distributions to its shareholders will be adversely affected.As a real estate company, NNN is susceptible to the following real estate industry risks, which arebeyond its control:
• changes in national, regional and local economic conditions and outlook,
• decreases in consumer spending and retail sales,
9
• economic downturns in the areas where NNN’s properties are located,
• adverse changes in local real estate market conditions, such as an oversupply, reduction indemand or intense competition for tenants,
• changes in tenant preferences that reduce the attractiveness of NNN’s properties to tenants,
• zoning, regulatory restrictions, or change in taxes, and
• changes in interest rates or availability of financing.
All of these factors could result in decreases in market rental rates and increases in vacancy rates,which could adversely affect NNN’s results of operations.
NNN’s real estate investments are illiquid.
Because real estate investments are relatively illiquid, NNN’s ability to adjust the portfolio promptly inresponse to economic or other conditions is limited. Certain significant expenditures generally do notchange in response to economic or other conditions, including: (i) debt service (if any), (ii) real estatetaxes, and (iii) operating and maintenance costs. This combination of variable revenue and relativelyfixed expenditures may result, under certain market conditions, in reduced income from investment.Such reduction in investment income could have an adverse effect on NNN’s financial condition.
NNN may be subject to known or unknown environmental liabilities.
NNN may acquire a property that contains some level of contamination or potential contaminationexists, subject to a determination of the level of risk and potential cost of remediation. Investments inreal property create a potential for substantial environmental liability on the part of the owner of suchproperty from the presence or discharge of hazardous substances on the property, regardless of fault. Itis NNN's policy, as a part of its acquisition due diligence process, generally to obtain an environmentalsite assessment for each property. In such cases that NNN intends to acquire real estate wherecontamination or potential contamination exists, NNN generally requires the seller or tenant to(i) remediate the problem, (ii) indemnify NNN for environmental liabilities, or (iii) agree to otherarrangements deemed appropriate by NNN to address environmental conditions at the property.
NNN has 70 Investment Properties currently under some level of environmental remediation. Ingeneral, the seller, the tenant or an adjacent land owner is responsible for the cost of the environmentalremediation for each of these Investment Properties. In the event of a bankruptcy or other inability onthe part of these parties to cover these costs, NNN may have to cover the costs of remediation, fines orother environmental liabilities at these and other properties. NNN may also own properties whererequired remediation has not begun or adverse environmental conditions have not yet been detected.This may require remediation or otherwise subject NNN to liability. NNN cannot assure that (i) it willnot be required to undertake or pay for removal or remediation of any contamination of the propertiescurrently or previously owned by NNN, (ii) NNN will not be subject to fines by governmentalauthorities or litigation, or (iii) the costs of such removal, remediation fines or litigation would not bematerial.
NNN may not be able to successfully execute its acquisition or development strategies.
NNN cannot assure that it will be able to implement its investment strategies successfully.Additionally, NNN cannot assure that its property portfolio will expand at all, or if it will expand atany specified rate or to any specified size. In addition, investment in additional real estate assets issubject to a number of risks. Because NNN expects to invest in markets other than the ones in whichits current properties are located or properties which may be leased to tenants other than those to which
10
NNN has historically leased properties, NNN will also be subject to the risks associated withinvestment in new markets or with new tenants that may be relatively unfamiliar to NNN’smanagement team.
NNN’s development activities are subject to without limitation, risks relating to the availability andtimely receipt of zoning and other regulatory approvals, the cost and timely completion of construction(including risks from factors beyond NNN’s control, such as weather or labor conditions or materialshortages), the risk of finding tenants for the properties and the ability to obtain both construction andpermanent financing on favorable terms. These risks could result in substantial unanticipated delays orexpenses and, under certain circumstances, could prevent completion of development activities onceundertaken or provide a tenant the opportunity to terminate a lease. Any of these situations may delayor eliminate proceeds or cash flows NNN expects from these projects, which could have an adverseeffect on NNN’s financial condition.
NNN may not be able to dispose of properties consistent with its operating strategy.
NNN may be unable to sell properties targeted for disposition (including its Inventory Properties) dueto adverse market conditions. This may adversely affect, among other things, NNN’s ability to sellunder favorable terms, execute its operating strategy, achieve target earnings or returns, retire debt orpay dividends.
A change in the assumptions used to determine the value of commercial mortgage residual interestscould adversely affect NNN’s financial position.
As of December 31, 2007, the Residuals had a carrying value of $24,340,000. The value of theseResiduals is based on discount rate, loan loss, prepayment speed and interest rate assumptions made byNNN to determine their value. If actual experience differs materially from these assumptions, theactual future cash flow could be less than expected and the value of the Residuals, as well as NNN’searnings, could decline.
NNN may suffer a loss in the event of a default or bankruptcy of a borrower.
If a borrower defaults on a mortgage, structured finance loan or other loan made by NNN, and does nothave sufficient assets to satisfy the loan, NNN may suffer a loss of principal and interest. In the eventof the bankruptcy of a borrower, NNN may not be able to recover against all of the assets of theborrower, or the assets of the borrower may not be sufficient to satisfy the balance due on the loan. Inaddition, certain of NNN’s loans may be subordinate to other debt of a borrower. These investmentsare typically loans secured by a borrower’s pledge of its ownership interests in the entity that owns thereal estate or other assets. These agreements are typically subordinated to senior loans secured by otherloans encumbering the underlying real estate or assets. Subordinated positions are generally subject toa higher risk of nonpayment of principal and interest than the more senior loans. As of December 31,2007, mortgages and notes receivables had an outstanding principal balance of $51,556,000 and thestructured finance investments had an outstanding principal balance of $14,359,000. If a borrowerdefaults on the debt senior to NNN’s loan, or in the event of the bankruptcy of a borrower, NNN’s loanwill be satisfied only after the borrower’s senior creditors’ claims are satisfied. Where debt senior toNNN’s loans exists, the presence of intercreditor arrangements may limit NNN’s ability to amend loandocuments, assign the loans, accept prepayments, exercise remedies and control decisions made inbankruptcy proceedings relating to borrowers. Bankruptcy proceedings and litigation can significantlyincrease the time needed for NNN to acquire underlying collateral in the event of a default, duringwhich time the collateral may decline in value. In addition, there are significant costs and delaysassociated with the foreclosure process.
11
Certain provisions of the leases or loan agreements may be unenforceable.
NNN’s rights and obligations with respect to its leases, structured finance loans, mortgage loans orother loans are governed by written agreements. A court could determine that one or more provisionsof an agreement are unenforceable, such as a particular remedy, a loan prepayment provision or aprovision governing NNN’s security interest in the underlying collateral of a borrower. NNN could beadversely impacted if this were to happen with respect to an asset or group of assets.
Property ownership through joint ventures and partnerships could limit NNN’s control of thoseinvestments.
Joint ventures or partnerships involve risks not otherwise present for direct investments by NNN. It ispossible that NNN’s co-venturers or partners may have different interests or goals than NNN at anytime and they may take actions contrary to NNN’s requests, policies or objectives, including NNN’spolicy with respect to maintaining its qualification as a REIT. Other risks of joint venture investmentsinclude impasses on decisions, because no single co-venturer or partner has full control over the jointventure or partnership. Additionally, the partner may become insolvent or bankrupt.
Competition with numerous other REITs, commercial developers, real estate limited partnerships andother investors may impede NNN’s ability to grow.
NNN may not be in a position or have the opportunity in the future to complete suitable propertyacquisitions or developments on advantageous terms due to competition for such properties with othersengaged in real estate investment activities. NNN’s inability to successfully acquire or develop newproperties may affect NNN’s ability to achieve anticipated return on investment, which could have anadverse effect on its results of operations.
Uninsured losses may adversely affect NNN’s ability to pay outstanding indebtedness.
NNN’s properties are generally covered by comprehensive liability, fire, flood, and extended coverage.NNN believes that the insurance carried on its properties is adequate in accordance with industrystandards. There are, however, types of losses (such as from hurricanes, wars or earthquakes) whichmay be uninsurable, or the cost of insuring against these losses may not be economically justifiable. Ifan uninsured loss occurs or a loss exceeds policy limits, NNN could lose both its invested capital andanticipated revenues from the property, whereby reducing NNN’s cash flow.
Acts of violence, terrorist attacks or war may affect the markets in which NNN operates and NNN’sresults of operations.
Terrorist attacks may negatively affect NNN's operations. There can be no assurance that there will notbe further terrorist attacks against the United States or United States businesses. These attacks maydirectly impact NNN’s physical facilities or the businesses of its tenants.
The United States is engaged in armed conflict, which could have an impact on NNN’s tenants. Theconsequences of armed conflict are unpredictable, and NNN may not be able to foresee events thatcould have an adverse effect on its business.
More generally, any of these events or threats of these events could cause consumer confidence andspending to decrease or result in increased volatility in the United States and worldwide financial
12
markets and economies. They also could result in, or cause a deepening of, economic recession in theUnited States or abroad. Any of these occurrences could have a significant adverse impact on NNN’sfinancial condition or results of operations.
Vacant properties or bankrupt tenants could adversely affect NNN.
As of December 31, 2007, NNN owned 12 vacant, unleased Investment Properties, which accountedfor approximately two percent of the total gross leasable area of NNN’s Investment Portfolio, inaddition to three vacant land parcels. NNN is actively marketing these properties for sale or lease butmay not be able to sell or lease these properties on favorable terms or at all. The lost revenues andincreased property expenses resulting from the rejection by any bankrupt tenant of any of theirrespective leases with NNN could have a material adverse effect on the liquidity and results ofoperations of NNN if NNN is unable to re-lease the Investment Properties at comparable rental ratesand in a timely manner. Less than one percent of the total gross leasable area of NNN’s InvestmentPortfolio is leased to three tenants that have filed a voluntary petition for bankruptcy under Chapter 11of the U.S. Bankruptcy Code. As a result, these tenants have the right to reject or affirm their leasewith NNN.
The amount of debt NNN has and the restrictions imposed by that debt could adversely affect NNN’sbusiness and financial condition.
As of December 31, 2007, NNN had total mortgage debt and secured notes payable outstanding ofapproximately $39,480,000, total unsecured notes payable of $890,790,000 and $129,800,000outstanding on the Credit Facility. NNN’s organizational documents do not limit the level or amount ofdebt that it may incur. If NNN incurs additional indebtedness and permits a higher degree of leverage,debt service requirements would increase and could adversely affect NNN’s financial condition andresults of operations, as well as NNN’s ability to pay principal and interest on the outstandingindebtedness or dividends to its stockholders. In addition, increased leverage could increase the riskthat NNN may default on its debt obligations. The Credit Facility contains financial covenants thatcould limit the amount of distributions to NNN’s common and preferred stockholders.
The amount of debt outstanding at any time could have important consequences to NNN’sstockholders. For example, it could:
• require NNN to dedicate a substantial portion of its cash flow from operations to paymentson its debt, thereby reducing funds available for operations, real estate investments andother appropriate business opportunities that may arise in the future,
• increase NNN’s vulnerability to general adverse economic and industry conditions,
• limit NNN’s ability to obtain any additional financing it may need in the future for workingcapital, debt refinancing, capital expenditures, real estate investments, development or othergeneral corporate purposes,
• make it difficult to satisfy NNN’s debt service requirements,
• limit NNN’s ability to pay dividends on its outstanding common and preferred stock,
• limit NNN’s flexibility in planning for, or reacting to, changes in its business and thefactors that affect the profitability of its business, and
• limit NNN’s flexibility in conducting its business, which may place NNN at a disadvantagecompared to competitors with less debt or debt with less restrictive terms.
13
NNN’s ability to make scheduled payments of principal or interest on its debt, or to refinance such debtwill depend primarily on its future performance, which to a certain extent is subject to thecreditworthiness of its tenants, competition, as well as economic, financial, and other factors beyond itscontrol. There can be no assurance that NNN’s business will continue to generate sufficient cash flowfrom operations in the future to service its debt or meet its other cash needs. If NNN is unable togenerate sufficient cash flow from its business, it may be required to refinance all or a portion of itsexisting debt, sell assets or obtain additional financing to meet its debt obligations and other cashneeds.
NNN cannot assure you that any such refinancing, sale of assets or additional financing would bepossible on terms and conditions, including but not limited to the interest rate, which NNN would findacceptable.
NNN is obligated to comply with financial and other covenants in its debt that could restrict itsoperating activities, and the failure to comply with such covenants could result in defaults thataccelerate the payment under its debt.
NNN’s unsecured debt contains various restrictive covenants which include, among others, provisionsrestricting NNN’s ability to:
• incur or guarantee additional debt,
• make certain distributions, investments and other restricted payments, including dividendpayments on its outstanding common and preferred stock,
• limit the ability of restricted subsidiaries to make payments to NNN,
• enter into transactions with certain affiliates,
• create certain liens, and
• consolidate, merge or sell NNN’s assets.
NNN’s secured debt generally contains customary covenants, including, among others, provisions:
• relating to the maintenance of the property securing the debt,
• restricting its ability to sell, assign or further encumber the properties securing the debt,
• restricting its ability to incur additional debt,
• restricting its ability to amend or modify existing leases, and
• relating to certain prepayment restrictions.
NNN’s ability to meet some of the covenants in its debt, including covenants related to the condition ofthe property or payment of real estate taxes, may be dependent on the performance by NNN’s tenantsunder their leases.
In addition, certain covenants in NNN’s debt, including its Credit Facility, require NNN, among otherthings, to:
• maintain certain maximum leverage ratios,
• maintain certain minimum interest and debt service coverage ratios,
• limit dividends declared and paid to NNN’s common and preferred stockholders, and
• limit investments in certain types of assets.
14
The market value of NNN’s equity and debt securities could be substantially affected by variousfactors.
As with other publicly traded securities, the market price of NNN’s equity and debt securities dependson various factors, which may change from time-to-time and may be unrelated to NNN’s operatingperformance or prospects. These factors include among many:
• general economic and financial market conditions,
• level and trend of interest rates,
• NNN’s financial condition and performance,
• market perception of NNN compared to other REITs, and
• market perception of REITs compared to other investment sectors.
NNN’s failure to qualify as a real estate investment trust for federal income tax purposes could resultin significant tax liability.
NNN intends to operate in a manner that will allow NNN to continue to qualify as a real estateinvestment trust (“REIT”). NNN believes it has been organized as, and its past and present operationsqualify NNN as a REIT. However, the Internal Revenue Service, (“IRS”) could successfully assert thatNNN is not qualified as such. In addition, NNN may not remain qualified as a REIT in the future.Qualification as a REIT involves the application of highly technical and complex Internal RevenueCode provisions for which there are only limited judicial or administrative interpretations and involvesthe determination of various factual matters and circumstances not entirely within NNN’s control.Furthermore, new tax legislation, administrative guidance or court decisions, in each instancepotentially with retroactive effect, could make it more difficult or impossible for NNN to qualify as aREIT.
If NNN fails to qualify as a REIT, it would not be allowed a deduction for dividends paid tostockholders in computing taxable income and would become subject to federal income tax at regularcorporate rates. In this event, NNN could be subject to potentially significant tax liabilities andpenalties. Unless entitled to relief under certain statutory provisions, NNN would also be disqualifiedfrom treatment as a REIT for the four taxable years following the year during which the qualificationwas lost. Even if NNN maintains its REIT status, NNN may be subject to certain federal, state andlocal taxes on its income and property.
Even if NNN remains qualified as a REIT, NNN may face other tax liabilities that reduce operatingresults and cash flow.
Even if NNN remains qualified for taxation as a REIT, NNN may be subject to certain federal, stateand local taxes on its income and assets, including taxes on any undistributed income, tax on incomefrom some activities conducted as a result of a foreclosure, and state or local income, property andtransfer taxes, such as mortgage recording taxes. Any of these taxes would decrease earnings and cashavailable for distribution to stockholders. In addition, in order to meet the REIT qualificationrequirements, NNN holds some of its assets through the TRS.
15
Adverse legislative or regulatory tax changes could reduce the NNN’s earnings, cash flow and marketprice of our common stock.
At any time, the federal and state income tax laws governing REITs or the administrativeinterpretations of those laws may change. Any such changes may have retroactive effect, and couldadversely affect NNN or its stockholders. For example, legislation enacted in 2003 and extended in2006 generally reduced the federal income tax rate on most dividends paid by corporations toindividual investors to a maximum of 15 percent (through 2010). REIT dividends, with limitedexceptions, will not benefit from the rate reduction, because a REIT’s income generally is not subjectto corporate level tax. As such, this legislation could cause shares in non-REIT corporations to be amore attractive investment to individual investors than shares in REITs, and could have an adverseeffect on the value of our common stock.
Changes in accounting pronouncements could adversely impact NNN reported financial performance.
Accounting policies and methods are fundamental to how NNN records and reports its financialcondition and results of operations. From time to time the Financial Accounting Standards Board(“FASB”) and the Commission, who create and interpret appropriate accounting standards, maychange the financial accounting and reporting standards that govern the preparation of its financialstatements. These changes could have a material impact on NNN’s reported financial condition andresults of operations. In some cases, NNN could be required to apply a new or revised standardretroactively, resulting in restating prior period financial statements.
Compliance with REIT requirements, including distribution requirements, may limit NNN’s flexibilityand negatively affect NNN’s operating decisions.
To maintain its status as a REIT for U.S. federal income tax purposes, NNN must meet certainrequirements, on an on-going basis, including requirements regarding its sources of income, the natureand diversification of its assets, the amounts NNN distributes to its stockholders and the ownership ofits shares. NNN may also be required to make distributions to its stockholders when it does not havefunds readily available for distribution or at times when NNN’s funds are otherwise needed to fundcapital expenditures or to fund debt service requirements. NNN generally will not be subject to federalincome taxes on amounts distributed to stockholders, providing it distributes 100 percent of its REITtaxable income and meets certain other requirements for qualifying as a REIT. For each of the years inthe three-year period ended December 31, 2007, NNN believes it has qualified as a REIT.Notwithstanding NNN’s qualification for taxation as a REIT, NNN is subject to certain state taxes onits income and real estate.
Item 1B. Unresolved Staff Comments.
None.
16
Item 2. Properties
Please refer to Item 1. “Business.”
Item 3. Legal Proceedings
In the ordinary course of its business, NNN is a party to various legal actions that managementbelieves is routine in nature and incidental to the operation of the business of NNN. Managementbelieves that the outcome of these proceedings will not have a material adverse effect upon itsoperations, financial condition or liquidity.
Item 4. Submission of Matters to a Vote of Security Holders
None.
17
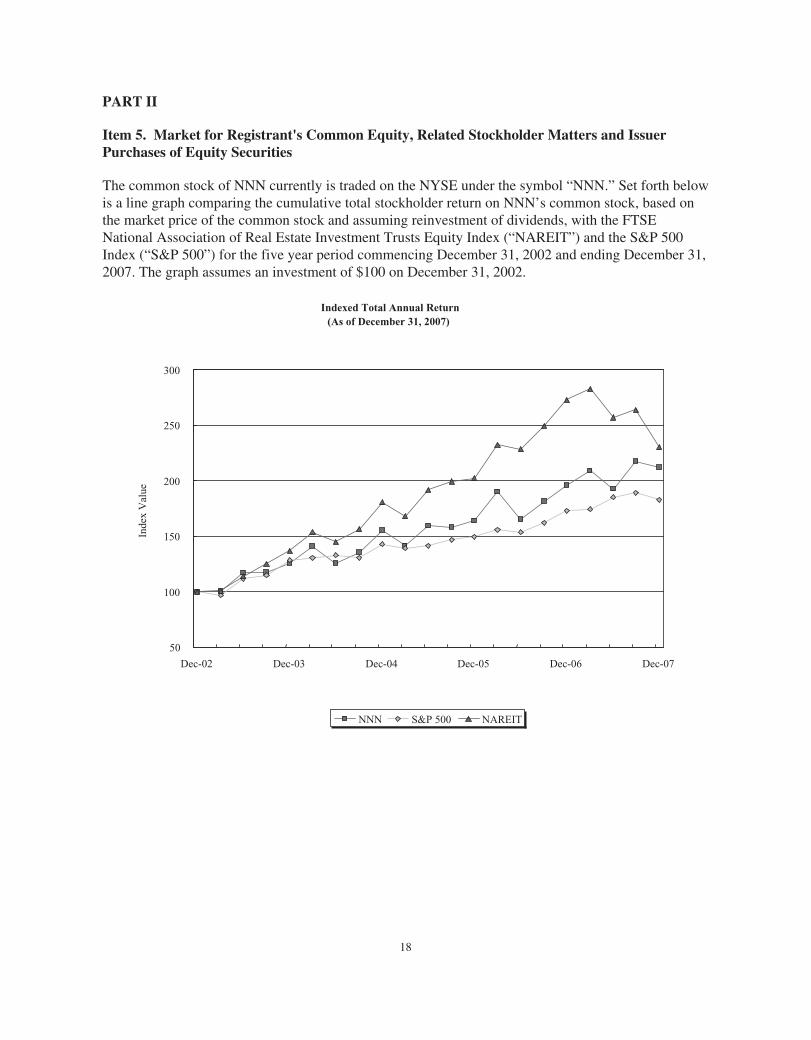
PART II
Item 5. Market for Registrant's Common Equity, Related Stockholder Matters and IssuerPurchases of Equity Securities
The common stock of NNN currently is traded on the NYSE under the symbol “NNN.” Set forth belowis a line graph comparing the cumulative total stockholder return on NNN’s common stock, based onthe market price of the common stock and assuming reinvestment of dividends, with the FTSENational Association of Real Estate Investment Trusts Equity Index (“NAREIT”) and the S&P 500Index (“S&P 500”) for the five year period commencing December 31, 2002 and ending December 31,2007. The graph assumes an investment of $100 on December 31, 2002.
Indexed Total Annual Return(As of December 31, 2007)
50
100
150
200
250
300
Dec-02 Dec-03 Dec-04 Dec-05 Dec-06 Dec-07
Inde
x V
alue
NNN S&P 500 NAREIT
18
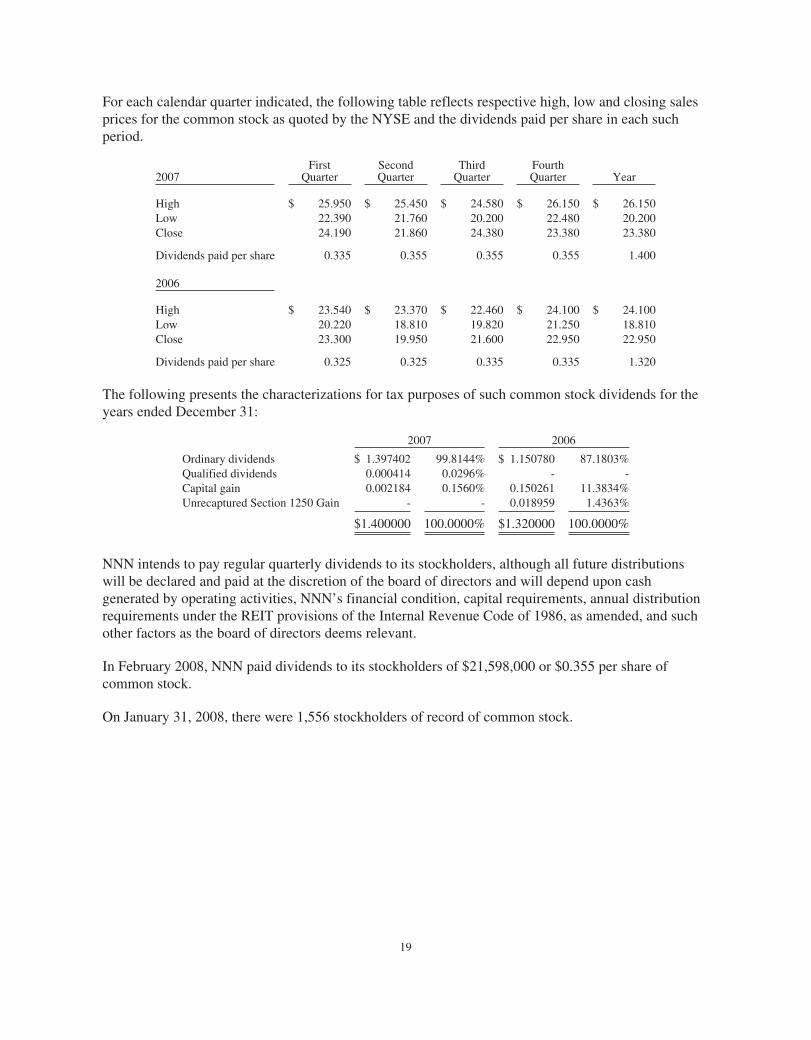
For each calendar quarter indicated, the following table reflects respective high, low and closing salesprices for the common stock as quoted by the NYSE and the dividends paid per share in each suchperiod.
2007First
QuarterSecondQuarter
ThirdQuarter
FourthQuarter Year
High $ 25.950 $ 25.450 $ 24.580 $ 26.150 $ 26.150Low 22.390 21.760 20.200 22.480 20.200Close 24.190 21.860 24.380 23.380 23.380
Dividends paid per share 0.335 0.355 0.355 0.355 1.400
2006
High $ 23.540 $ 23.370 $ 22.460 $ 24.100 $ 24.100Low 20.220 18.810 19.820 21.250 18.810Close 23.300 19.950 21.600 22.950 22.950
Dividends paid per share 0.325 0.325 0.335 0.335 1.320
The following presents the characterizations for tax purposes of such common stock dividends for theyears ended December 31:
2007 2006
Ordinary dividends $ 1.397402 99.8144% $ 1.150780 87.1803%Qualified dividends 0.000414 0.0296% - -Capital gain 0.002184 0.1560% 0.150261 11.3834%Unrecaptured Section 1250 Gain - - 0.018959 1.4363%
$1.400000 100.0000% $1.320000 100.0000%
NNN intends to pay regular quarterly dividends to its stockholders, although all future distributionswill be declared and paid at the discretion of the board of directors and will depend upon cashgenerated by operating activities, NNN’s financial condition, capital requirements, annual distributionrequirements under the REIT provisions of the Internal Revenue Code of 1986, as amended, and suchother factors as the board of directors deems relevant.
In February 2008, NNN paid dividends to its stockholders of $21,598,000 or $0.355 per share ofcommon stock.
On January 31, 2008, there were 1,556 stockholders of record of common stock.
19
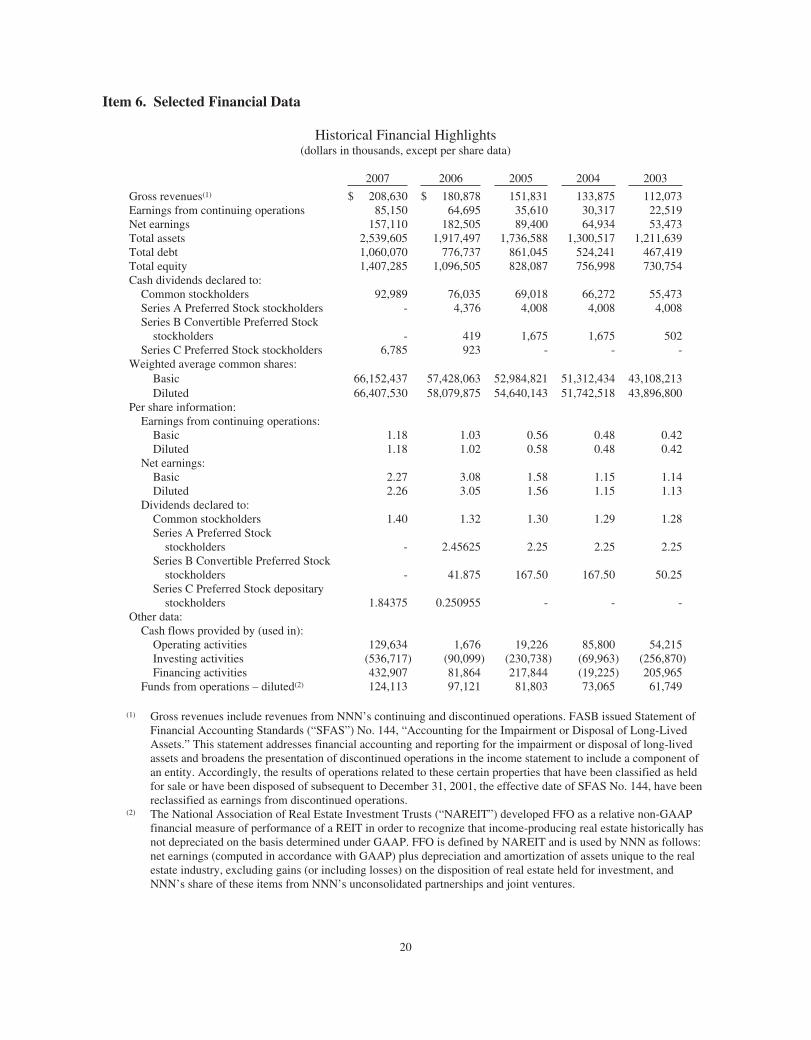
Item 6. Selected Financial Data
Historical Financial Highlights(dollars in thousands, except per share data)
2007 2006 2005 2004 2003
Gross revenues(1) $ 208,630 $ 180,878 151,831 133,875 112,073Earnings from continuing operations 85,150 64,695 35,610 30,317 22,519Net earnings 157,110 182,505 89,400 64,934 53,473Total assets 2,539,605 1,917,497 1,736,588 1,300,517 1,211,639Total debt 1,060,070 776,737 861,045 524,241 467,419Total equity 1,407,285 1,096,505 828,087 756,998 730,754Cash dividends declared to:
Common stockholders 92,989 76,035 69,018 66,272 55,473Series A Preferred Stock stockholders - 4,376 4,008 4,008 4,008Series B Convertible Preferred Stock
stockholders - 419 1,675 1,675 502Series C Preferred Stock stockholders 6,785 923 - - -
Weighted average common shares:Basic 66,152,437 57,428,063 52,984,821 51,312,434 43,108,213Diluted 66,407,530 58,079,875 54,640,143 51,742,518 43,896,800
Per share information:Earnings from continuing operations:
Basic 1.18 1.03 0.56 0.48 0.42Diluted 1.18 1.02 0.58 0.48 0.42
Net earnings:Basic 2.27 3.08 1.58 1.15 1.14Diluted 2.26 3.05 1.56 1.15 1.13
Dividends declared to:Common stockholders 1.40 1.32 1.30 1.29 1.28Series A Preferred Stock
stockholders - 2.45625 2.25 2.25 2.25Series B Convertible Preferred Stock
stockholders - 41.875 167.50 167.50 50.25Series C Preferred Stock depositary
stockholders 1.84375 0.250955 - - -Other data:
Cash flows provided by (used in):Operating activities 129,634 1,676 19,226 85,800 54,215Investing activities (536,717) (90,099) (230,738) (69,963) (256,870)Financing activities 432,907 81,864 217,844 (19,225) 205,965
Funds from operations – diluted(2) 124,113 97,121 81,803 73,065 61,749
(1) Gross revenues include revenues from NNN’s continuing and discontinued operations. FASB issued Statement ofFinancial Accounting Standards (“SFAS”) No. 144, “Accounting for the Impairment or Disposal of Long-LivedAssets.” This statement addresses financial accounting and reporting for the impairment or disposal of long-livedassets and broadens the presentation of discontinued operations in the income statement to include a component ofan entity. Accordingly, the results of operations related to these certain properties that have been classified as heldfor sale or have been disposed of subsequent to December 31, 2001, the effective date of SFAS No. 144, have beenreclassified as earnings from discontinued operations.
(2) The National Association of Real Estate Investment Trusts (“NAREIT”) developed FFO as a relative non-GAAPfinancial measure of performance of a REIT in order to recognize that income-producing real estate historically hasnot depreciated on the basis determined under GAAP. FFO is defined by NAREIT and is used by NNN as follows:net earnings (computed in accordance with GAAP) plus depreciation and amortization of assets unique to the realestate industry, excluding gains (or including losses) on the disposition of real estate held for investment, andNNN’s share of these items from NNN’s unconsolidated partnerships and joint ventures.
20
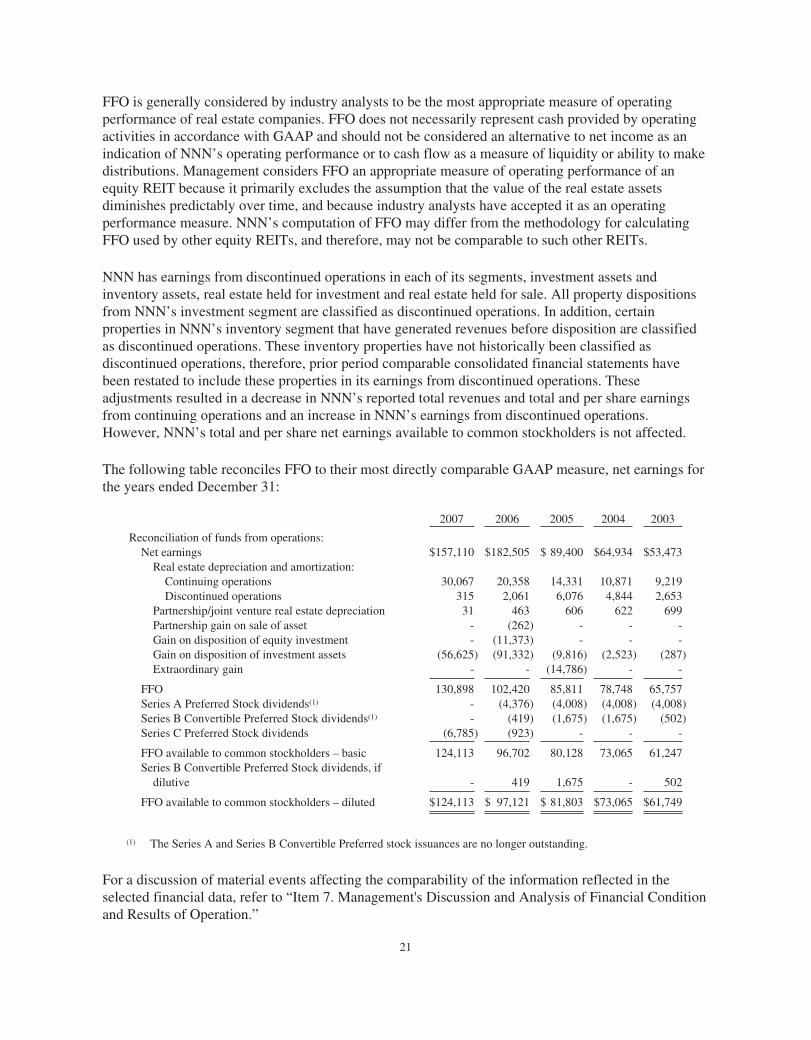
FFO is generally considered by industry analysts to be the most appropriate measure of operatingperformance of real estate companies. FFO does not necessarily represent cash provided by operatingactivities in accordance with GAAP and should not be considered an alternative to net income as anindication of NNN’s operating performance or to cash flow as a measure of liquidity or ability to makedistributions. Management considers FFO an appropriate measure of operating performance of anequity REIT because it primarily excludes the assumption that the value of the real estate assetsdiminishes predictably over time, and because industry analysts have accepted it as an operatingperformance measure. NNN’s computation of FFO may differ from the methodology for calculatingFFO used by other equity REITs, and therefore, may not be comparable to such other REITs.
NNN has earnings from discontinued operations in each of its segments, investment assets andinventory assets, real estate held for investment and real estate held for sale. All property dispositionsfrom NNN’s investment segment are classified as discontinued operations. In addition, certainproperties in NNN’s inventory segment that have generated revenues before disposition are classifiedas discontinued operations. These inventory properties have not historically been classified asdiscontinued operations, therefore, prior period comparable consolidated financial statements havebeen restated to include these properties in its earnings from discontinued operations. Theseadjustments resulted in a decrease in NNN’s reported total revenues and total and per share earningsfrom continuing operations and an increase in NNN’s earnings from discontinued operations.However, NNN’s total and per share net earnings available to common stockholders is not affected.
The following table reconciles FFO to their most directly comparable GAAP measure, net earnings forthe years ended December 31:
2007 2006 2005 2004 2003
Reconciliation of funds from operations:Net earnings $157,110 $182,505 $ 89,400 $64,934 $53,473
Real estate depreciation and amortization:Continuing operations 30,067 20,358 14,331 10,871 9,219Discontinued operations 315 2,061 6,076 4,844 2,653
Partnership/joint venture real estate depreciation 31 463 606 622 699Partnership gain on sale of asset - (262) - - -Gain on disposition of equity investment - (11,373) - - -Gain on disposition of investment assets (56,625) (91,332) (9,816) (2,523) (287)Extraordinary gain - - (14,786) - -
FFO 130,898 102,420 85,811 78,748 65,757Series A Preferred Stock dividends(1) - (4,376) (4,008) (4,008) (4,008)Series B Convertible Preferred Stock dividends(1) - (419) (1,675) (1,675) (502)Series C Preferred Stock dividends (6,785) (923) - - -
FFO available to common stockholders – basic 124,113 96,702 80,128 73,065 61,247Series B Convertible Preferred Stock dividends, if
dilutive - 419 1,675 - 502
FFO available to common stockholders – diluted $124,113 $ 97,121 $ 81,803 $73,065 $61,749
(1) The Series A and Series B Convertible Preferred stock issuances are no longer outstanding.
For a discussion of material events affecting the comparability of the information reflected in theselected financial data, refer to “Item 7. Management's Discussion and Analysis of Financial Conditionand Results of Operation.”
21
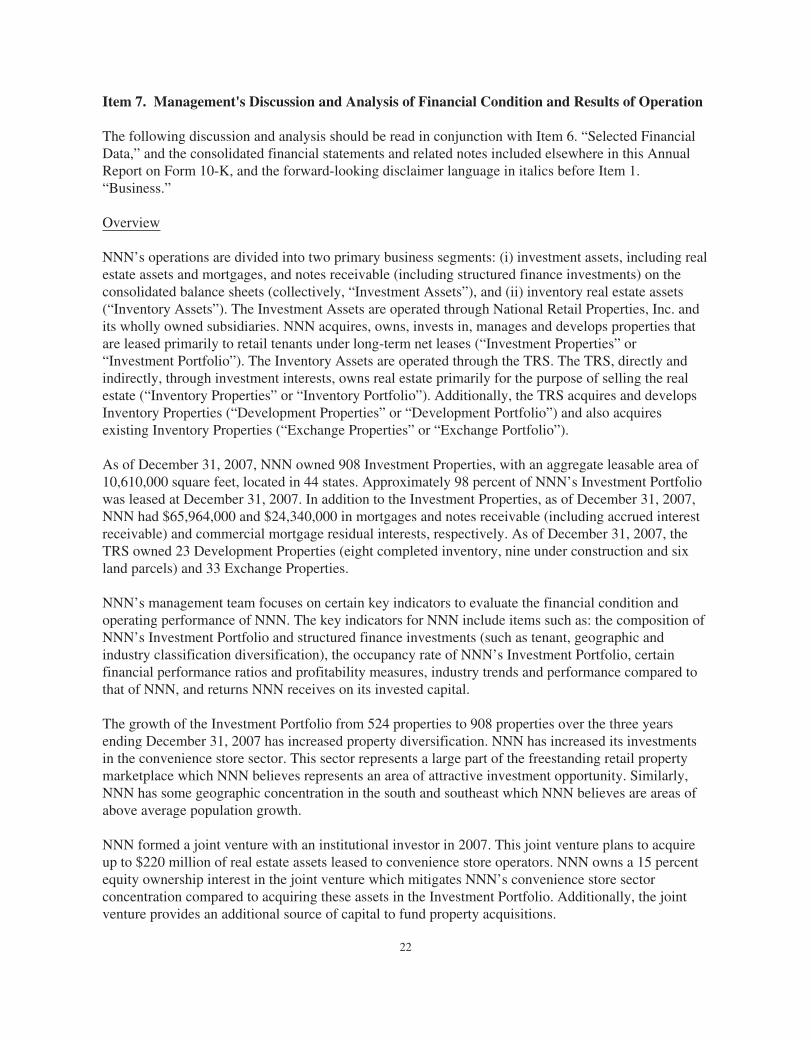
Item 7. Management's Discussion and Analysis of Financial Condition and Results of Operation
The following discussion and analysis should be read in conjunction with Item 6. “Selected FinancialData,” and the consolidated financial statements and related notes included elsewhere in this AnnualReport on Form 10-K, and the forward-looking disclaimer language in italics before Item 1.“Business.”
Overview
NNN’s operations are divided into two primary business segments: (i) investment assets, including realestate assets and mortgages, and notes receivable (including structured finance investments) on theconsolidated balance sheets (collectively, “Investment Assets”), and (ii) inventory real estate assets(“Inventory Assets”). The Investment Assets are operated through National Retail Properties, Inc. andits wholly owned subsidiaries. NNN acquires, owns, invests in, manages and develops properties thatare leased primarily to retail tenants under long-term net leases (“Investment Properties” or“Investment Portfolio”). The Inventory Assets are operated through the TRS. The TRS, directly andindirectly, through investment interests, owns real estate primarily for the purpose of selling the realestate (“Inventory Properties” or “Inventory Portfolio”). Additionally, the TRS acquires and developsInventory Properties (“Development Properties” or “Development Portfolio”) and also acquiresexisting Inventory Properties (“Exchange Properties” or “Exchange Portfolio”).
As of December 31, 2007, NNN owned 908 Investment Properties, with an aggregate leasable area of10,610,000 square feet, located in 44 states. Approximately 98 percent of NNN’s Investment Portfoliowas leased at December 31, 2007. In addition to the Investment Properties, as of December 31, 2007,NNN had $65,964,000 and $24,340,000 in mortgages and notes receivable (including accrued interestreceivable) and commercial mortgage residual interests, respectively. As of December 31, 2007, theTRS owned 23 Development Properties (eight completed inventory, nine under construction and sixland parcels) and 33 Exchange Properties.
NNN’s management team focuses on certain key indicators to evaluate the financial condition andoperating performance of NNN. The key indicators for NNN include items such as: the composition ofNNN’s Investment Portfolio and structured finance investments (such as tenant, geographic andindustry classification diversification), the occupancy rate of NNN’s Investment Portfolio, certainfinancial performance ratios and profitability measures, industry trends and performance compared tothat of NNN, and returns NNN receives on its invested capital.
The growth of the Investment Portfolio from 524 properties to 908 properties over the three yearsending December 31, 2007 has increased property diversification. NNN has increased its investmentsin the convenience store sector. This sector represents a large part of the freestanding retail propertymarketplace which NNN believes represents an area of attractive investment opportunity. Similarly,NNN has some geographic concentration in the south and southeast which NNN believes are areas ofabove average population growth.
NNN formed a joint venture with an institutional investor in 2007. This joint venture plans to acquireup to $220 million of real estate assets leased to convenience store operators. NNN owns a 15 percentequity ownership interest in the joint venture which mitigates NNN’s convenience store sectorconcentration compared to acquiring these assets in the Investment Portfolio. Additionally, the jointventure provides an additional source of capital to fund property acquisitions.
22
As of December 31, 2007, 2006 and 2005, occupancy of the Investment Portfolio has averaged 98percent. The Investment Portfolio’s average remaining lease term of 13 years has remained fairlyconstant over the past three years which, coupled with its net lease structure, provide enhancedprobability of maintaining occupancy and operating earnings in periods of soft economic conditions.
Critical Accounting Policies and Estimates
The preparation of NNN’s consolidated financial statements in conformance with accountingprinciples generally accepted in the United States of America requires management to make estimatesand judgments on assumptions that affect the reported amounts of assets, liabilities, revenues andexpenses as well as other disclosures in the financial statements. On an ongoing basis, managementevaluates its estimates and judgments; however, actual results may differ from these estimates andassumptions which in turn could have a material impact on NNN’s financial statements. A summary ofNNN’s accounting policies and procedures are included in Note 1 of NNN’s consolidated financialstatements. Management believes the following critical accounting policies among others affect itsmore significant judgments and estimates used in the preparation of NNN’s consolidated financialstatements.
Real Estate – Investment Portfolio. NNN records the acquisition of real estate at cost, includingacquisition and closing costs. The cost of properties developed by NNN includes direct and indirectcosts of construction, property taxes, interest and other miscellaneous costs incurred during thedevelopment period until the project is substantially complete and available for occupancy.
Purchase Accounting for Acquisition of Real Estate Subject to a Lease – For acquisitions of real estatesubject to a lease subsequent to June 30, 2001, the effective date of Statement of Financial AccountingStandards (“SFAS”) No. 141, “Business Combinations” (“SFAS 141”), the fair value of the real estateacquired is allocated to the acquired tangible assets, consisting of land, building and tenantimprovements, and identified intangible assets and liabilities, consisting of the value of above-marketand below-market leases, value of in-place leases, and value of tenant relationships, based in each caseon their relative fair values.
Real estate is generally leased to tenants on a net lease basis, whereby the tenant is responsible for alloperating expenses relating to the property, including property taxes, insurance, maintenance andrepairs. The leases are accounted for using either the operating or the direct financing method. Suchmethods are described below:
Operating method – Leases accounted for using the operating method are recorded at the costof the real estate. Revenue is recognized as rentals are earned and expenses (includingdepreciation) are charged to operations as incurred. Buildings are depreciated on the straight-line method over their estimated useful lives. Leasehold interests are amortized on the straight-line method over the terms of their respective leases. When scheduled rentals vary during thelease term, income is recognized on a straight-line basis so as to produce a constant periodicrent over the term of the lease. Accrued rental income is the aggregate difference between thescheduled rents which vary during the lease term and the income recognized on a straight-linebasis.
Direct financing method – Leases accounted for using the direct financing method arerecorded at their net investment (which at the inception of the lease generally represents thecost of the property). Unearned income is deferred and amortized into income over the leaseterms so as to produce a constant periodic rate of return on NNN’s net investment in the leases.
23
Management periodically assesses its real estate for possible impairment whenever events or changesin circumstances indicate that the carrying value of the asset may not be recoverable throughoperations. Management determines whether an impairment in value has occurred by comparing theestimated future cash flows (undiscounted and without interest charges), including the residual value ofthe real estate, with the carrying cost of the individual asset. If an impairment is indicated, a loss willbe recorded for the amount by which the carrying value of the asset exceeds its fair value.
Real Estate – Inventory Portfolio. The TRS acquires and/or develops and owns properties for thepurpose of re-sale. The properties that are classified as held for sale at any given time may consist ofproperties that have been acquired in the marketplace with the intent to sell and properties that havebeen, or are currently being, constructed by the TRS. The TRS records the acquisition of the real estateat cost, including the acquisition and closing costs. The cost of the real estate developed by the TRSincludes direct and indirect costs of construction, interest and other miscellaneous costs incurredduring the development period until the project is substantially complete and available for occupancy.Real estate held for sale is not depreciated.
Commercial Mortgage Residual Interest at Fair Value. Commercial mortgage residual interests,classified as available for sale, are reported at their market values with unrealized gains and lossesreported as other comprehensive income in stockholders’ equity. The commercial mortgage residualinterests were acquired in connection with the acquisition of 78.9 percent equity interest of OAMI.NNN recognizes the excess of all cash flows attributable to the commercial mortgage residual interestsestimated at the acquisition/transaction date over the initial investment (the accretable yield) as interestincome over the life of the beneficial interest using the effective yield method. Losses are consideredother than temporary valuation impairments if and when there has been a change in the timing oramount of estimated cash flows, exclusive of changes in interest rates, that leads to a loss in value.Certain of the commercial mortgage residual interests have been pledged as security for notes payable.
Revenue Recognition. Rental revenues for non-development real estate assets are recognized whenearned in accordance with SFAS 13, “Accounting for Leases,” based on the terms of the lease at thetime of acquisition of the leased asset. Rental revenues for properties under construction commenceupon completion of construction of the leased asset and delivery of the leased asset to the tenant.
Use of Estimates. Additional critical accounting policies of NNN include management’s estimates andassumptions relating to the reporting of assets and liabilities, revenues and expenses and the disclosureof contingent assets and liabilities to prepare the consolidated financial statements in conformity withaccounting principles generally accepted in the United States of America. Additional criticalaccounting policies include management’s estimates of the useful lives used in calculating depreciationexpense relating to real estate assets, the recoverability of the carrying value of long-lived assets,including the commercial mortgage residual interests, the collectibility of receivables from tenants,including accrued rental income, and capitalized overhead relating to development projects. Actualresults could differ from those estimates.
24
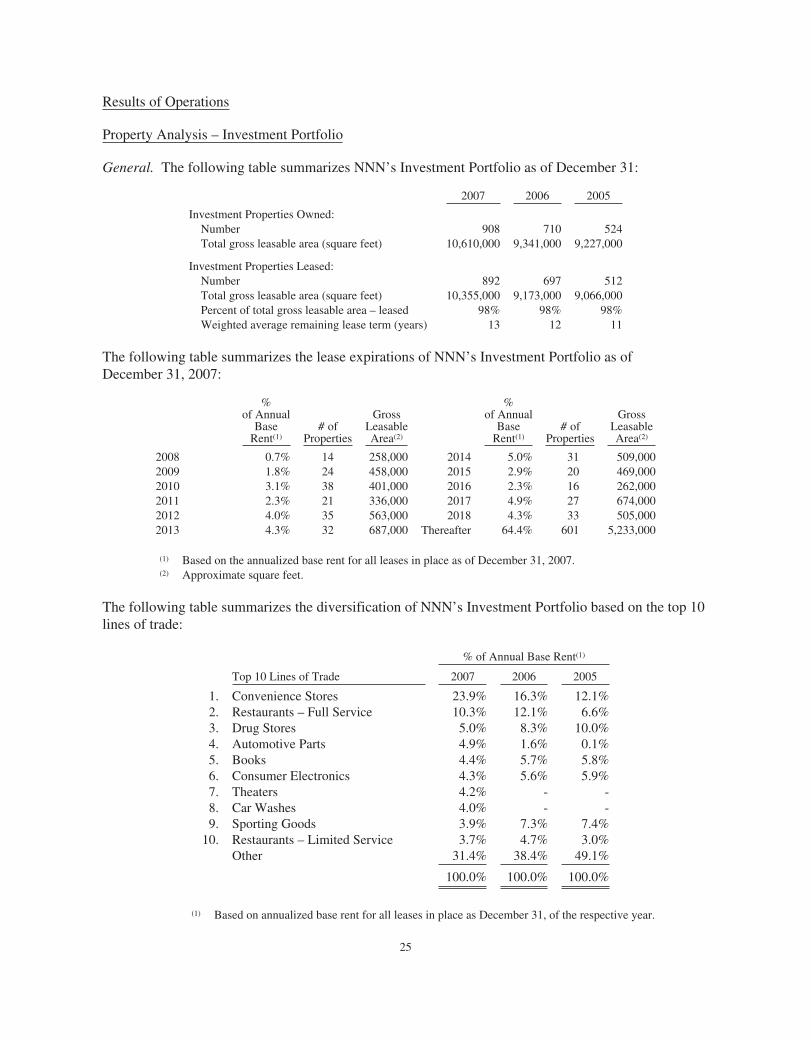
Results of Operations
Property Analysis – Investment Portfolio
General. The following table summarizes NNN’s Investment Portfolio as of December 31:
2007 2006 2005
Investment Properties Owned:Number 908 710 524Total gross leasable area (square feet) 10,610,000 9,341,000 9,227,000
Investment Properties Leased:Number 892 697 512Total gross leasable area (square feet) 10,355,000 9,173,000 9,066,000Percent of total gross leasable area – leased 98% 98% 98%Weighted average remaining lease term (years) 13 12 11
The following table summarizes the lease expirations of NNN’s Investment Portfolio as ofDecember 31, 2007:
%of Annual
BaseRent(1)
# ofProperties
GrossLeasableArea(2)
%of Annual
BaseRent(1)
# ofProperties
GrossLeasableArea(2)
2008 0.7% 14 258,000 2014 5.0% 31 509,0002009 1.8% 24 458,000 2015 2.9% 20 469,0002010 3.1% 38 401,000 2016 2.3% 16 262,0002011 2.3% 21 336,000 2017 4.9% 27 674,0002012 4.0% 35 563,000 2018 4.3% 33 505,0002013 4.3% 32 687,000 Thereafter 64.4% 601 5,233,000
(1) Based on the annualized base rent for all leases in place as of December 31, 2007.(2) Approximate square feet.
The following table summarizes the diversification of NNN’s Investment Portfolio based on the top 10lines of trade:
% of Annual Base Rent(1)
Top 10 Lines of Trade 2007 2006 2005
1. Convenience Stores 23.9% 16.3% 12.1%2. Restaurants – Full Service 10.3% 12.1% 6.6%3. Drug Stores 5.0% 8.3% 10.0%4. Automotive Parts 4.9% 1.6% 0.1%5. Books 4.4% 5.7% 5.8%6. Consumer Electronics 4.3% 5.6% 5.9%7. Theaters 4.2% - -8. Car Washes 4.0% - -9. Sporting Goods 3.9% 7.3% 7.4%
10. Restaurants – Limited Service 3.7% 4.7% 3.0%Other 31.4% 38.4% 49.1%
100.0% 100.0% 100.0%
(1) Based on annualized base rent for all leases in place as December 31, of the respective year.
25
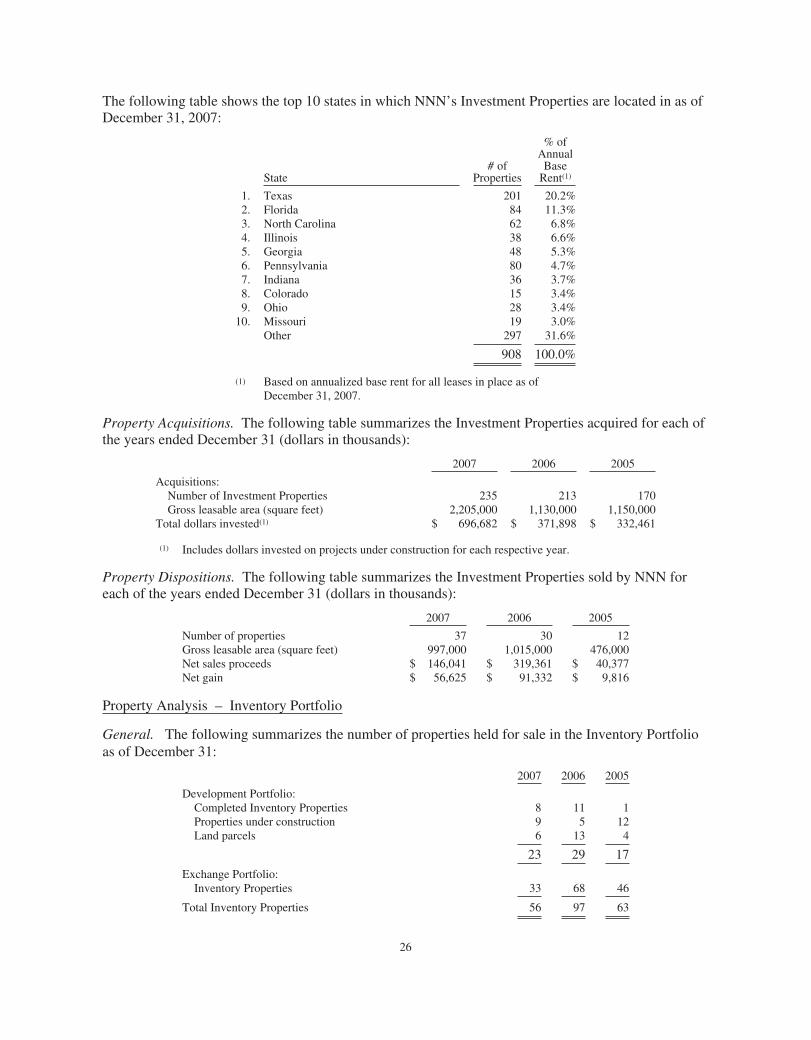
The following table shows the top 10 states in which NNN’s Investment Properties are located in as ofDecember 31, 2007:
State# of
Properties
% ofAnnualBase
Rent(1)
1. Texas 201 20.2%2. Florida 84 11.3%3. North Carolina 62 6.8%4. Illinois 38 6.6%5. Georgia 48 5.3%6. Pennsylvania 80 4.7%7. Indiana 36 3.7%8. Colorado 15 3.4%9. Ohio 28 3.4%
10. Missouri 19 3.0%Other 297 31.6%
908 100.0%
(1) Based on annualized base rent for all leases in place as ofDecember 31, 2007.
Property Acquisitions. The following table summarizes the Investment Properties acquired for each ofthe years ended December 31 (dollars in thousands):
2007 2006 2005
Acquisitions:Number of Investment Properties 235 213 170Gross leasable area (square feet) 2,205,000 1,130,000 1,150,000
Total dollars invested(1) $ 696,682 $ 371,898 $ 332,461
(1) Includes dollars invested on projects under construction for each respective year.
Property Dispositions. The following table summarizes the Investment Properties sold by NNN foreach of the years ended December 31 (dollars in thousands):
2007 2006 2005
Number of properties 37 30 12Gross leasable area (square feet) 997,000 1,015,000 476,000Net sales proceeds $ 146,041 $ 319,361 $ 40,377Net gain $ 56,625 $ 91,332 $ 9,816
Property Analysis – Inventory Portfolio
General. The following summarizes the number of properties held for sale in the Inventory Portfolioas of December 31:
2007 2006 2005
Development Portfolio:Completed Inventory Properties 8 11 1Properties under construction 9 5 12Land parcels 6 13 4
23 29 17
Exchange Portfolio:Inventory Properties 33 68 46
Total Inventory Properties 56 97 63
26
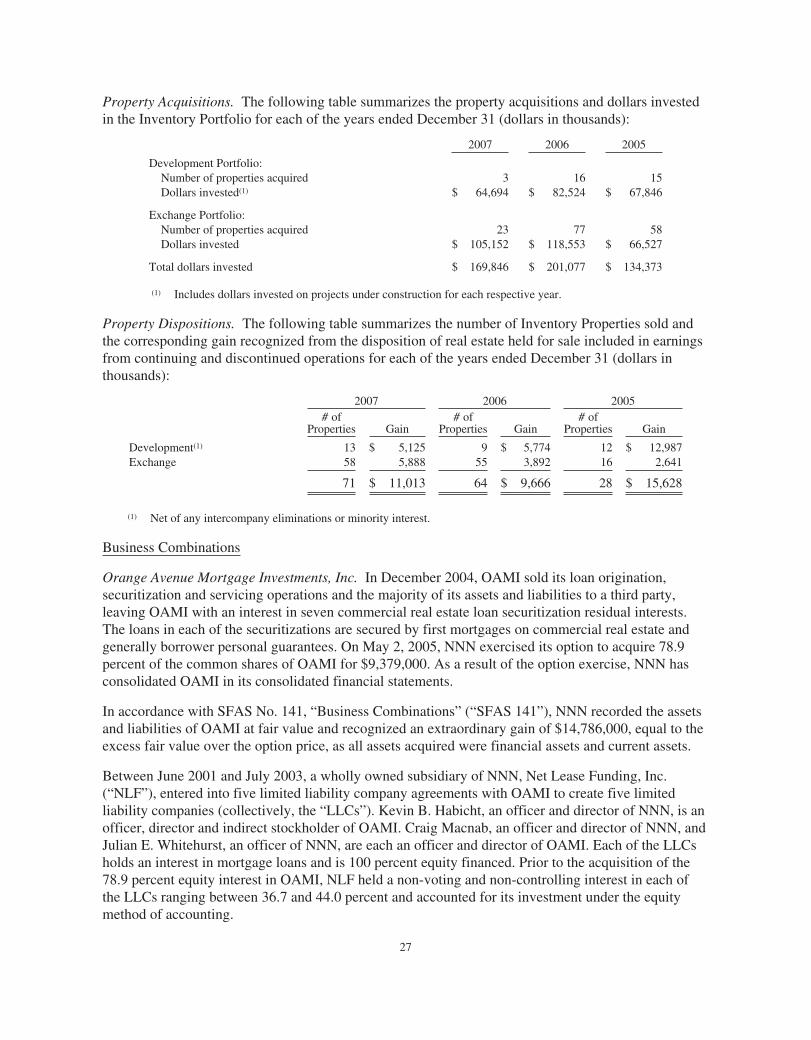
Property Acquisitions. The following table summarizes the property acquisitions and dollars investedin the Inventory Portfolio for each of the years ended December 31 (dollars in thousands):
2007 2006 2005
Development Portfolio:Number of properties acquired 3 16 15Dollars invested(1) $ 64,694 $ 82,524 $ 67,846
Exchange Portfolio:Number of properties acquired 23 77 58Dollars invested $ 105,152 $ 118,553 $ 66,527
Total dollars invested $ 169,846 $ 201,077 $ 134,373
(1) Includes dollars invested on projects under construction for each respective year.
Property Dispositions. The following table summarizes the number of Inventory Properties sold andthe corresponding gain recognized from the disposition of real estate held for sale included in earningsfrom continuing and discontinued operations for each of the years ended December 31 (dollars inthousands):
2007 2006 2005# of
Properties Gain# of
Properties Gain# of
Properties Gain
Development(1) 13 $ 5,125 9 $ 5,774 12 $ 12,987Exchange 58 5,888 55 3,892 16 2,641
71 $ 11,013 64 $ 9,666 28 $ 15,628
(1) Net of any intercompany eliminations or minority interest.
Business Combinations
Orange Avenue Mortgage Investments, Inc. In December 2004, OAMI sold its loan origination,securitization and servicing operations and the majority of its assets and liabilities to a third party,leaving OAMI with an interest in seven commercial real estate loan securitization residual interests.The loans in each of the securitizations are secured by first mortgages on commercial real estate andgenerally borrower personal guarantees. On May 2, 2005, NNN exercised its option to acquire 78.9percent of the common shares of OAMI for $9,379,000. As a result of the option exercise, NNN hasconsolidated OAMI in its consolidated financial statements.
In accordance with SFAS No. 141, “Business Combinations” (“SFAS 141”), NNN recorded the assetsand liabilities of OAMI at fair value and recognized an extraordinary gain of $14,786,000, equal to theexcess fair value over the option price, as all assets acquired were financial assets and current assets.
Between June 2001 and July 2003, a wholly owned subsidiary of NNN, Net Lease Funding, Inc.(“NLF”), entered into five limited liability company agreements with OAMI to create five limitedliability companies (collectively, the “LLCs”). Kevin B. Habicht, an officer and director of NNN, is anofficer, director and indirect stockholder of OAMI. Craig Macnab, an officer and director of NNN, andJulian E. Whitehurst, an officer of NNN, are each an officer and director of OAMI. Each of the LLCsholds an interest in mortgage loans and is 100 percent equity financed. Prior to the acquisition of the78.9 percent equity interest in OAMI, NLF held a non-voting and non-controlling interest in each ofthe LLCs ranging between 36.7 and 44.0 percent and accounted for its investment under the equitymethod of accounting.
27
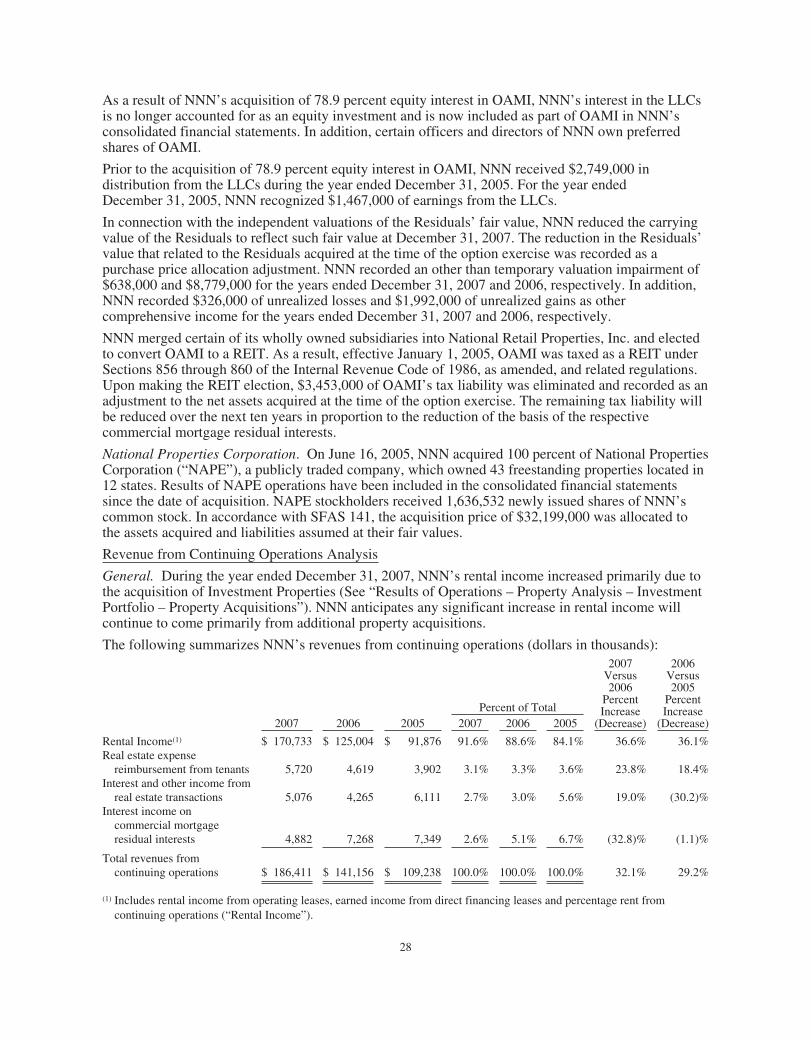
As a result of NNN’s acquisition of 78.9 percent equity interest in OAMI, NNN’s interest in the LLCsis no longer accounted for as an equity investment and is now included as part of OAMI in NNN’sconsolidated financial statements. In addition, certain officers and directors of NNN own preferredshares of OAMI.
Prior to the acquisition of 78.9 percent equity interest in OAMI, NNN received $2,749,000 indistribution from the LLCs during the year ended December 31, 2005. For the year endedDecember 31, 2005, NNN recognized $1,467,000 of earnings from the LLCs.
In connection with the independent valuations of the Residuals’ fair value, NNN reduced the carryingvalue of the Residuals to reflect such fair value at December 31, 2007. The reduction in the Residuals’value that related to the Residuals acquired at the time of the option exercise was recorded as apurchase price allocation adjustment. NNN recorded an other than temporary valuation impairment of$638,000 and $8,779,000 for the years ended December 31, 2007 and 2006, respectively. In addition,NNN recorded $326,000 of unrealized losses and $1,992,000 of unrealized gains as othercomprehensive income for the years ended December 31, 2007 and 2006, respectively.
NNN merged certain of its wholly owned subsidiaries into National Retail Properties, Inc. and electedto convert OAMI to a REIT. As a result, effective January 1, 2005, OAMI was taxed as a REIT underSections 856 through 860 of the Internal Revenue Code of 1986, as amended, and related regulations.Upon making the REIT election, $3,453,000 of OAMI’s tax liability was eliminated and recorded as anadjustment to the net assets acquired at the time of the option exercise. The remaining tax liability willbe reduced over the next ten years in proportion to the reduction of the basis of the respectivecommercial mortgage residual interests.
National Properties Corporation. On June 16, 2005, NNN acquired 100 percent of National PropertiesCorporation (“NAPE”), a publicly traded company, which owned 43 freestanding properties located in12 states. Results of NAPE operations have been included in the consolidated financial statementssince the date of acquisition. NAPE stockholders received 1,636,532 newly issued shares of NNN’scommon stock. In accordance with SFAS 141, the acquisition price of $32,199,000 was allocated tothe assets acquired and liabilities assumed at their fair values.
Revenue from Continuing Operations Analysis
General. During the year ended December 31, 2007, NNN’s rental income increased primarily due tothe acquisition of Investment Properties (See “Results of Operations – Property Analysis – InvestmentPortfolio – Property Acquisitions”). NNN anticipates any significant increase in rental income willcontinue to come primarily from additional property acquisitions.
The following summarizes NNN’s revenues from continuing operations (dollars in thousands):2007
Versus2006
PercentIncrease
(Decrease)
2006Versus2005
PercentIncrease
(Decrease)Percent of Total
2007 2006 2005 2007 2006 2005
Rental Income(1) $ 170,733 $ 125,004 $ 91,876 91.6% 88.6% 84.1% 36.6% 36.1%Real estate expense
reimbursement from tenants 5,720 4,619 3,902 3.1% 3.3% 3.6% 23.8% 18.4%Interest and other income from
real estate transactions 5,076 4,265 6,111 2.7% 3.0% 5.6% 19.0% (30.2)%Interest income on
commercial mortgageresidual interests 4,882 7,268 7,349 2.6% 5.1% 6.7% (32.8)% (1.1)%
Total revenues fromcontinuing operations $ 186,411 $ 141,156 $ 109,238 100.0% 100.0% 100.0% 32.1% 29.2%
(1) Includes rental income from operating leases, earned income from direct financing leases and percentage rent fromcontinuing operations (“Rental Income”).
28
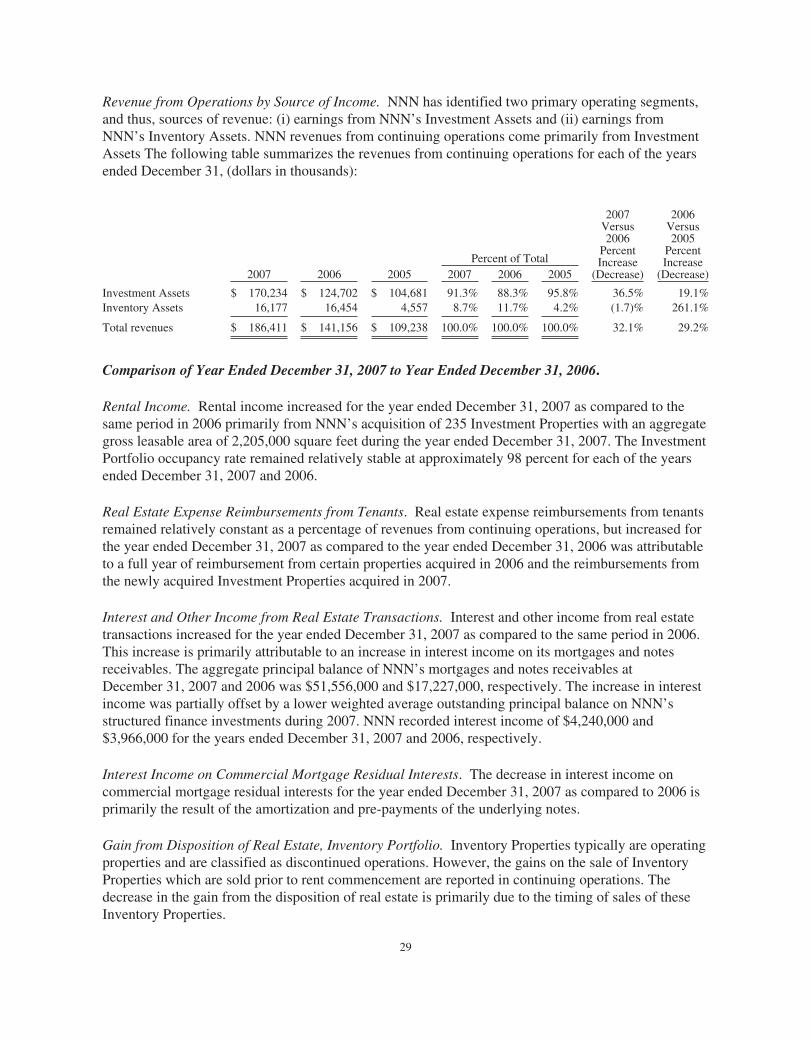
Revenue from Operations by Source of Income. NNN has identified two primary operating segments,and thus, sources of revenue: (i) earnings from NNN’s Investment Assets and (ii) earnings fromNNN’s Inventory Assets. NNN revenues from continuing operations come primarily from InvestmentAssets The following table summarizes the revenues from continuing operations for each of the yearsended December 31, (dollars in thousands):
Percent of Total
2007Versus2006
PercentIncrease
(Decrease)
2006Versus2005
PercentIncrease
(Decrease)2007 2006 2005 2007 2006 2005
Investment Assets $ 170,234 $ 124,702 $ 104,681 91.3% 88.3% 95.8% 36.5% 19.1%Inventory Assets 16,177 16,454 4,557 8.7% 11.7% 4.2% (1.7)% 261.1%
Total revenues $ 186,411 $ 141,156 $ 109,238 100.0% 100.0% 100.0% 32.1% 29.2%
Comparison of Year Ended December 31, 2007 to Year Ended December 31, 2006.
Rental Income. Rental income increased for the year ended December 31, 2007 as compared to thesame period in 2006 primarily from NNN’s acquisition of 235 Investment Properties with an aggregategross leasable area of 2,205,000 square feet during the year ended December 31, 2007. The InvestmentPortfolio occupancy rate remained relatively stable at approximately 98 percent for each of the yearsended December 31, 2007 and 2006.
Real Estate Expense Reimbursements from Tenants. Real estate expense reimbursements from tenantsremained relatively constant as a percentage of revenues from continuing operations, but increased forthe year ended December 31, 2007 as compared to the year ended December 31, 2006 was attributableto a full year of reimbursement from certain properties acquired in 2006 and the reimbursements fromthe newly acquired Investment Properties acquired in 2007.
Interest and Other Income from Real Estate Transactions. Interest and other income from real estatetransactions increased for the year ended December 31, 2007 as compared to the same period in 2006.This increase is primarily attributable to an increase in interest income on its mortgages and notesreceivables. The aggregate principal balance of NNN’s mortgages and notes receivables atDecember 31, 2007 and 2006 was $51,556,000 and $17,227,000, respectively. The increase in interestincome was partially offset by a lower weighted average outstanding principal balance on NNN’sstructured finance investments during 2007. NNN recorded interest income of $4,240,000 and$3,966,000 for the years ended December 31, 2007 and 2006, respectively.
Interest Income on Commercial Mortgage Residual Interests. The decrease in interest income oncommercial mortgage residual interests for the year ended December 31, 2007 as compared to 2006 isprimarily the result of the amortization and pre-payments of the underlying notes.
Gain from Disposition of Real Estate, Inventory Portfolio. Inventory Properties typically are operatingproperties and are classified as discontinued operations. However, the gains on the sale of InventoryProperties which are sold prior to rent commencement are reported in continuing operations. Thedecrease in the gain from the disposition of real estate is primarily due to the timing of sales of theseInventory Properties.
29
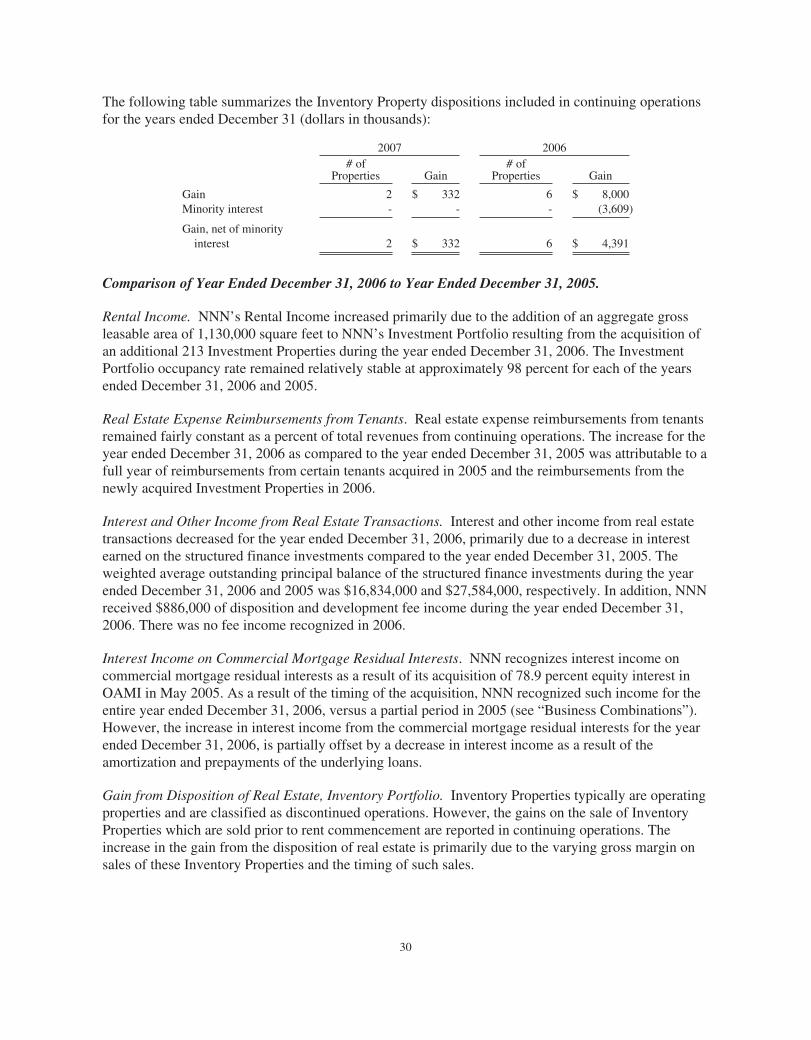
The following table summarizes the Inventory Property dispositions included in continuing operationsfor the years ended December 31 (dollars in thousands):
2007 2006# of
Properties Gain# of
Properties Gain
Gain 2 $ 332 6 $ 8,000Minority interest - - - (3,609)
Gain, net of minorityinterest 2 $ 332 6 $ 4,391
Comparison of Year Ended December 31, 2006 to Year Ended December 31, 2005.
Rental Income. NNN’s Rental Income increased primarily due to the addition of an aggregate grossleasable area of 1,130,000 square feet to NNN’s Investment Portfolio resulting from the acquisition ofan additional 213 Investment Properties during the year ended December 31, 2006. The InvestmentPortfolio occupancy rate remained relatively stable at approximately 98 percent for each of the yearsended December 31, 2006 and 2005.
Real Estate Expense Reimbursements from Tenants. Real estate expense reimbursements from tenantsremained fairly constant as a percent of total revenues from continuing operations. The increase for theyear ended December 31, 2006 as compared to the year ended December 31, 2005 was attributable to afull year of reimbursements from certain tenants acquired in 2005 and the reimbursements from thenewly acquired Investment Properties in 2006.
Interest and Other Income from Real Estate Transactions. Interest and other income from real estatetransactions decreased for the year ended December 31, 2006, primarily due to a decrease in interestearned on the structured finance investments compared to the year ended December 31, 2005. Theweighted average outstanding principal balance of the structured finance investments during the yearended December 31, 2006 and 2005 was $16,834,000 and $27,584,000, respectively. In addition, NNNreceived $886,000 of disposition and development fee income during the year ended December 31,2006. There was no fee income recognized in 2006.
Interest Income on Commercial Mortgage Residual Interests. NNN recognizes interest income oncommercial mortgage residual interests as a result of its acquisition of 78.9 percent equity interest inOAMI in May 2005. As a result of the timing of the acquisition, NNN recognized such income for theentire year ended December 31, 2006, versus a partial period in 2005 (see “Business Combinations”).However, the increase in interest income from the commercial mortgage residual interests for the yearended December 31, 2006, is partially offset by a decrease in interest income as a result of theamortization and prepayments of the underlying loans.
Gain from Disposition of Real Estate, Inventory Portfolio. Inventory Properties typically are operatingproperties and are classified as discontinued operations. However, the gains on the sale of InventoryProperties which are sold prior to rent commencement are reported in continuing operations. Theincrease in the gain from the disposition of real estate is primarily due to the varying gross margin onsales of these Inventory Properties and the timing of such sales.
30
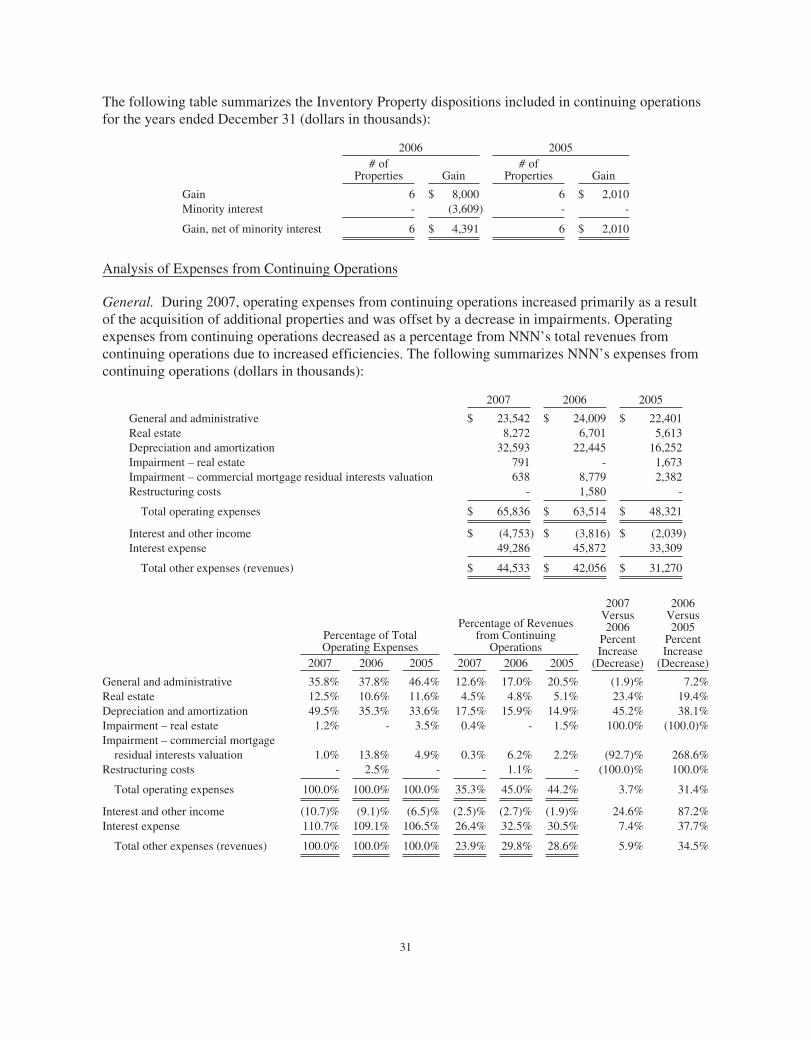
The following table summarizes the Inventory Property dispositions included in continuing operationsfor the years ended December 31 (dollars in thousands):
2006 2005# of
Properties Gain# of
Properties Gain
Gain 6 $ 8,000 6 $ 2,010Minority interest - (3,609) - -
Gain, net of minority interest 6 $ 4,391 6 $ 2,010
Analysis of Expenses from Continuing Operations
General. During 2007, operating expenses from continuing operations increased primarily as a resultof the acquisition of additional properties and was offset by a decrease in impairments. Operatingexpenses from continuing operations decreased as a percentage from NNN’s total revenues fromcontinuing operations due to increased efficiencies. The following summarizes NNN’s expenses fromcontinuing operations (dollars in thousands):
2007 2006 2005
General and administrative $ 23,542 $ 24,009 $ 22,401Real estate 8,272 6,701 5,613Depreciation and amortization 32,593 22,445 16,252Impairment – real estate 791 - 1,673Impairment – commercial mortgage residual interests valuation 638 8,779 2,382Restructuring costs - 1,580 -
Total operating expenses $ 65,836 $ 63,514 $ 48,321
Interest and other income $ (4,753) $ (3,816) $ (2,039)Interest expense 49,286 45,872 33,309
Total other expenses (revenues) $ 44,533 $ 42,056 $ 31,270
Percentage of TotalOperating Expenses
Percentage of Revenuesfrom Continuing
Operations
2007Versus2006
PercentIncrease
(Decrease)
2006Versus2005
PercentIncrease
(Decrease)2007 2006 2005 2007 2006 2005
General and administrative 35.8% 37.8% 46.4% 12.6% 17.0% 20.5% (1.9)% 7.2%Real estate 12.5% 10.6% 11.6% 4.5% 4.8% 5.1% 23.4% 19.4%Depreciation and amortization 49.5% 35.3% 33.6% 17.5% 15.9% 14.9% 45.2% 38.1%Impairment – real estate 1.2% - 3.5% 0.4% - 1.5% 100.0% (100.0)%Impairment – commercial mortgage
residual interests valuation 1.0% 13.8% 4.9% 0.3% 6.2% 2.2% (92.7)% 268.6%Restructuring costs - 2.5% - - 1.1% - (100.0)% 100.0%
Total operating expenses 100.0% 100.0% 100.0% 35.3% 45.0% 44.2% 3.7% 31.4%
Interest and other income (10.7)% (9.1)% (6.5)% (2.5)% (2.7)% (1.9)% 24.6% 87.2%Interest expense 110.7% 109.1% 106.5% 26.4% 32.5% 30.5% 7.4% 37.7%
Total other expenses (revenues) 100.0% 100.0% 100.0% 23.9% 29.8% 28.6% 5.9% 34.5%
31
Comparison of Year End December 31, 2007 to Year Ended December 31, 2006.
General and Administrative. General and administrative expenses decreased slightly for the yearended December 31, 2007 as compared to the same period in 2006; however, such expenses remainedfairly consistent as a percentage of total operating expense from continuing operations. The decrease ingeneral and administrative expenses for 2007 was primarily attributable to a decrease in expensesrelated to personnel compensation, and a decrease in lost pursuit costs.
Real Estate. Real estate expenses increased for the year ended December 31, 2007, as compared to theyear ended December 31, 2006; however, such expenses remained fairly consistent as a percentage oftotal revenues from continuing operations. The increase in real estate expenses for 2007 as comparedto the same period for 2006 is primarily attributable to (i) an increase in tenant reimbursable real estateexpenses, and (ii) an increase in certain real estate expenses that were not reimbursable by tenants.
Depreciation and Amortization. Depreciation and amortization expenses increased for the year endedDecember 31, 2007, as compared to the year ended December 31, 2006. The increase for the yearended December 31, 2007, as compared to the same period in 2006 is attributable to (i) the acquisitionof 235 Investment Properties with an aggregate gross leasable area of 2,205,000 square feet in 2007,and (ii) a full year of depreciation and amortization on the 213 Investment Properties with an aggregategross leasable area of 1,130,000 square feet which were acquired during 2006. The increase indepreciation and amortization was partially offset by the disposition of 37 Investment Properties withan aggregate gross leasable area of 997,000 square feet during the year ended December 31, 2007.
Impairment – Real Estate. NNN reviews long-lived assets for impairment whenever events or changesin circumstances indicate that the carrying amount of the asset may not be recoverable. Events orcircumstances that may occur include changes in real estate market conditions, the ability of NNN tore-lease properties that are currently vacant or become vacant, and the ability to sell properties at anattractive return. Generally, NNN calculates a possible impairment by comparing the future cash flowsto the current net book value. Impairments are measured as the amount by which the current bookvalue of the asset exceeds the fair value of the asset. During the year ended December 31, 2007, NNNrecorded impairments totaling $791,000. No impairments were recorded during the year endedDecember 31, 2006.
Impairment – Commercial Mortgage Residual Interests Valuation. In connection with the independentvaluations of the Residuals’ fair value, NNN reduced the carrying value of the Residuals to reflect suchfair value at December 31, 2007 and 2006. In 2007, due to changes in market conditions relating toresidual assets, the independent valuation increased the discount rate from 17% to 25%. Other thantemporary valuation adjustments are recorded as a reduction of earnings from operations. For the yearsended December 2007 and 2006, NNN recorded an other than temporary impairment of $638,000 and$8,779,000, respectively.
Restructuring Costs. During the year ended December 31, 2006, NNN recorded restructuring costs of$1,580,000, which included severance costs and accelerated vesting of restricted stock in connectionwith a workforce reduction in April 2006. No such costs were incurred during 2007.
Interest Expense. The increase in interest expense for the year ended December 31, 2007, as comparedto the year ended December 31, 2006, is primarily attributable to an increase of $126,164,000 inweighted average long-term debt outstanding. The increase in the weighted average long-term debt wasdue to the increase in dollars invested in Investment and Inventory Properties. The increase in interestexpense was partially offset by an increase of $1,440,000 in the interest capitalized to construction
32
projects in 2007, as well as by a decrease in the overall weighted average interest rate for 2007 ascompared to 2006. The following represents the primary changes in debt:
(i) issuance of $250,000,000 of notes payable in September 2007 with an effective interestrate of 6.92% due in October 2017,
(ii) repayment of mortgage in September 2007 with balance of $7,305,000 at December 31,2006 and an interest rate of 7.37%,
(iii) the decrease in the weighted average debt outstanding on the revolving credit facility(decreased by $28,506,000),
(iv) issuance of $172,500,000 of notes payable in September 2006 with an effective interestrate of 3.95% due in September 2026,
(v) payoff of the $20,800,000 variable rate term note in October 2007, which was assumed inconnection with the acquisition of NAPE in June 2005,
(vi) repayment of a mortgage in February 2006 with a balance of $18,538,000 atDecember 31, 2005 with an interest rate of 7.435%, and
(vii) payoff of the $10,500,000 OAMI secured note payable with a stated interest rate of10.00%.
Comparison of Year Ended December 31, 2006 to Year Ended December 31, 2005.
General and Administrative. General and administrative expenses increased for the year endedDecember 31, 2006, however, such expenses decreased as a percentage of total operating expensesfrom continuing operations for the year ended December 31, 2006. The increase in general andadministrative expenses for 2006 was primarily attributable to (i) an increase in expenses related topersonnel compensation, (ii) an increase in professional services provided to NNN, and (iii) anincrease in lost pursuit costs. The increase in 2006 was partially offset by the decrease in expensesrelated to personnel as a result of a workforce reduction in April 2006 and an increase in costscapitalized to projects under development.
Real Estate. Real estate expenses increased for the year ended December 31, 2006, as compared to theyear ended December 31, 2005; however, such expenses remained fairly consistent as a percentage oftotal operating expenses and total revenues from continuing operations. The increase in real estateexpenses for 2006 when compared to the same period for 2005 is primarily attributable to (i) anincrease in tenant reimbursable real estate expenses, (ii) an increase in expenses related to vacantproperties, and (iii) an increase in certain real estate expenses that were not reimbursable by tenants.
Depreciation and Amortization. Depreciation and amortization expenses increased for the year endedDecember 31, 2006, as compared to the year ended December 31, 2005; however, such expensesremained fairly consistent as a percentage of total operating expenses and total revenues fromcontinuing operations. The increase for the year ended December 31, 2006, when compared to thesame period in 2005 is attributable to (i) the acquisition of 213 Investment Properties with an aggregategross leasable area of 1,130,000 square feet in 2006 and (ii) a full year of depreciation andamortization on the 170 Investment Properties with an aggregate gross leasable area of 1,150,000square feet acquired in 2005. The increase in depreciation and amortization was partially offset by thedisposition of 30 Investment Properties with an aggregate gross leasable area of 1,015,000 square feetduring the year ended December 31, 2006.
Impairment – Real Estate. NNN reviews long-lived assets for impairment whenever events or changesin circumstances indicate that the carrying amount of the asset may not be recoverable. Events or
33
circumstances that may occur include changes in real estate market conditions, the ability of NNN tore-lease properties that are currently vacant or become vacant, and the ability to sell properties at anattractive return. Generally, NNN calculates a possible impairment by comparing the future cash flowsto the current net book value. Impairments are measured as the amount by which the current bookvalue of the asset exceeds the fair value of the asset.
Impairment – Commercial Mortgage Residual Interests Valuation. In connection with the independentvaluations of the Residuals’ fair value, NNN recorded an other than temporary valuation impairment of$8,779,000 and $2,382,000 for the years ended December 31, 2006 and 2005, respectively.
The reduction in the Residuals’ value that related to the Residuals acquired at the time of the optionexercise was recorded as a purchase price allocation adjustment. The reduction in the Residuals’ valueacquired at the time of the option exercise that related to the period subsequent to the option exercise,as well as the reduction in value related to the portion of the Residuals previously owned by NLF, wererecorded as an aggregate other than temporary valuation impairment in 2005 (see “BusinessCombinations”).
NNN reduced the carrying value of the Residuals during the year ended December 31, 2006, basedupon the fair value as determined by an independent valuation. The decrease in the value of theResiduals was primarily the result of the increase in prepayment speeds of the underlying loans. Thevaluation adjustments that are considered other than temporary are recorded as a reduction of earningsfrom operations.
Restructuring Costs. During the year ended December 31, 2006, NNN recorded restructuring costs of$1,580,000, which included severance costs and accelerated vesting of restricted stock in connectionwith a workforce reduction in April 2006.
Interest Expense. The increase in interest expense for the year ended December 31, 2006, over theyear ended December 31, 2005, was primarily due to a $241,104,000 increase in the weighted averagelong-term debt outstanding for the year ended December 31, 2006. The increase in the weightedaverage long-term debt outstanding is attributable to the increase in Investment and InventoryProperties and the acquisition of the 78.9 percent equity interest in OAMI. This increase was offsetslightly by a 25 basis point decrease in the overall weighted average interest rate for 2006 compared to2005. The following represents the primary changes in debt:
(i) issuance of $150,000,000 of notes payable in November 2005 with an effective interestrate of 6.185% due in December 2015,
(ii) the increase in the weighted average debt outstanding on the revolving credit facility(increased by $61,819,000),
(iii) issuance of $172,500,000 of notes payable in September 2006 with an effective interestrate of 3.95% due in September 2026,
(iv) the $20,800,000 variable rate term note assumed in connection with the acquisition ofNAPE in June 2005,
(v) the $32,000,000 secured notes payable acquired in May 2005 in connection with the 78.9percent equity interest in OAMI, and
(vi) repayment of a mortgage in February 2006 with a balance of $18,538,000 atDecember 31, 2005 with an interest rate of 7.435%.
34
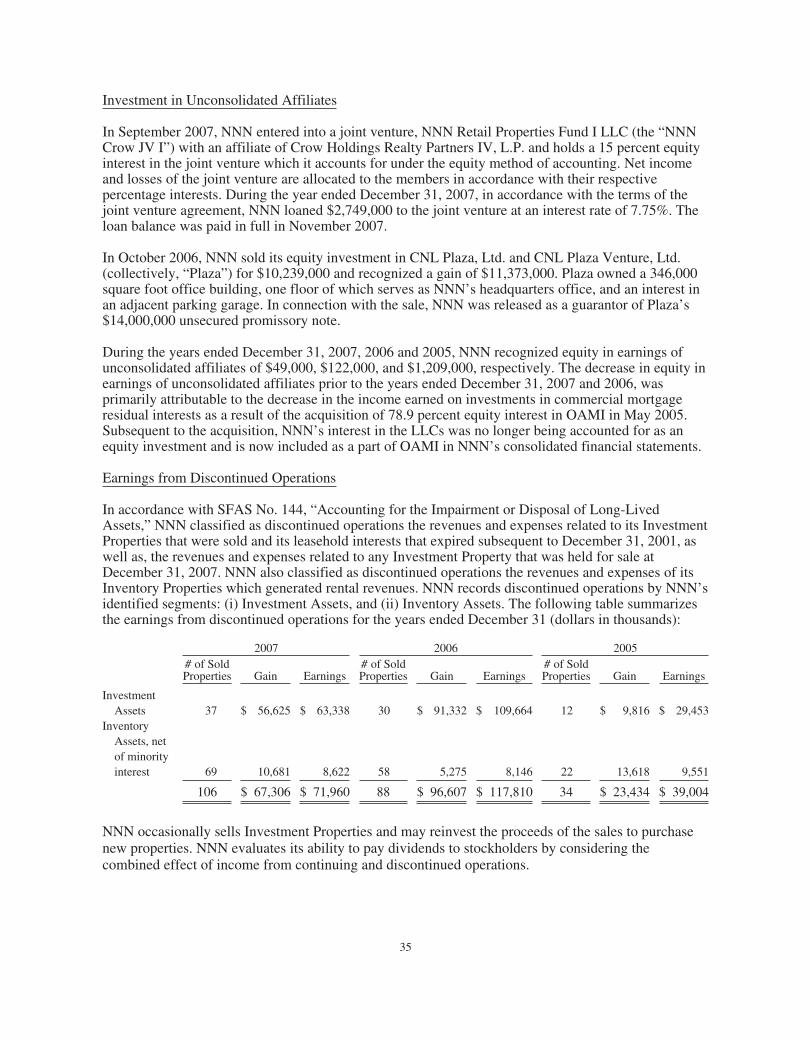
Investment in Unconsolidated Affiliates
In September 2007, NNN entered into a joint venture, NNN Retail Properties Fund I LLC (the “NNNCrow JV I”) with an affiliate of Crow Holdings Realty Partners IV, L.P. and holds a 15 percent equityinterest in the joint venture which it accounts for under the equity method of accounting. Net incomeand losses of the joint venture are allocated to the members in accordance with their respectivepercentage interests. During the year ended December 31, 2007, in accordance with the terms of thejoint venture agreement, NNN loaned $2,749,000 to the joint venture at an interest rate of 7.75%. Theloan balance was paid in full in November 2007.
In October 2006, NNN sold its equity investment in CNL Plaza, Ltd. and CNL Plaza Venture, Ltd.(collectively, “Plaza”) for $10,239,000 and recognized a gain of $11,373,000. Plaza owned a 346,000square foot office building, one floor of which serves as NNN’s headquarters office, and an interest inan adjacent parking garage. In connection with the sale, NNN was released as a guarantor of Plaza’s$14,000,000 unsecured promissory note.
During the years ended December 31, 2007, 2006 and 2005, NNN recognized equity in earnings ofunconsolidated affiliates of $49,000, $122,000, and $1,209,000, respectively. The decrease in equity inearnings of unconsolidated affiliates prior to the years ended December 31, 2007 and 2006, wasprimarily attributable to the decrease in the income earned on investments in commercial mortgageresidual interests as a result of the acquisition of 78.9 percent equity interest in OAMI in May 2005.Subsequent to the acquisition, NNN’s interest in the LLCs was no longer being accounted for as anequity investment and is now included as a part of OAMI in NNN’s consolidated financial statements.
Earnings from Discontinued Operations
In accordance with SFAS No. 144, “Accounting for the Impairment or Disposal of Long-LivedAssets,” NNN classified as discontinued operations the revenues and expenses related to its InvestmentProperties that were sold and its leasehold interests that expired subsequent to December 31, 2001, aswell as, the revenues and expenses related to any Investment Property that was held for sale atDecember 31, 2007. NNN also classified as discontinued operations the revenues and expenses of itsInventory Properties which generated rental revenues. NNN records discontinued operations by NNN’sidentified segments: (i) Investment Assets, and (ii) Inventory Assets. The following table summarizesthe earnings from discontinued operations for the years ended December 31 (dollars in thousands):
2007 2006 2005# of SoldProperties Gain Earnings
# of SoldProperties Gain Earnings
# of SoldProperties Gain Earnings
InvestmentAssets 37 $ 56,625 $ 63,338 30 $ 91,332 $ 109,664 12 $ 9,816 $ 29,453
InventoryAssets, netof minorityinterest 69 10,681 8,622 58 5,275 8,146 22 13,618 9,551
106 $ 67,306 $ 71,960 88 $ 96,607 $ 117,810 34 $ 23,434 $ 39,004
NNN occasionally sells Investment Properties and may reinvest the proceeds of the sales to purchasenew properties. NNN evaluates its ability to pay dividends to stockholders by considering thecombined effect of income from continuing and discontinued operations.
35
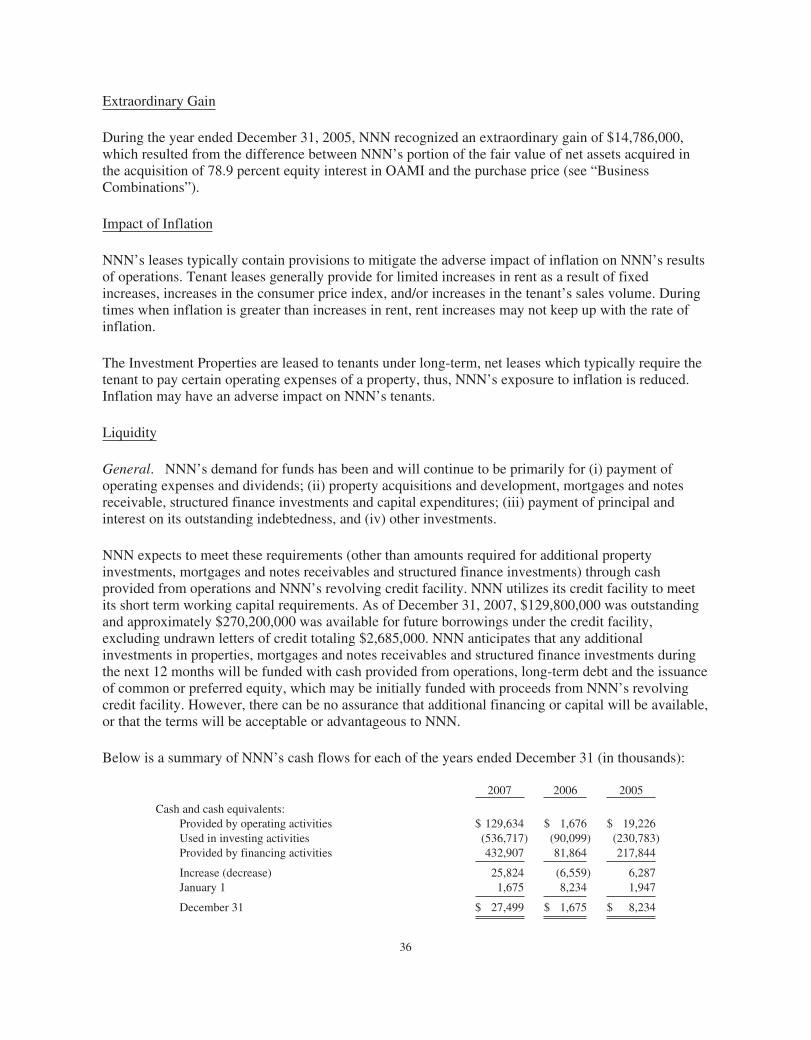
Extraordinary Gain
During the year ended December 31, 2005, NNN recognized an extraordinary gain of $14,786,000,which resulted from the difference between NNN’s portion of the fair value of net assets acquired inthe acquisition of 78.9 percent equity interest in OAMI and the purchase price (see “BusinessCombinations”).
Impact of Inflation
NNN’s leases typically contain provisions to mitigate the adverse impact of inflation on NNN’s resultsof operations. Tenant leases generally provide for limited increases in rent as a result of fixedincreases, increases in the consumer price index, and/or increases in the tenant’s sales volume. Duringtimes when inflation is greater than increases in rent, rent increases may not keep up with the rate ofinflation.
The Investment Properties are leased to tenants under long-term, net leases which typically require thetenant to pay certain operating expenses of a property, thus, NNN’s exposure to inflation is reduced.Inflation may have an adverse impact on NNN’s tenants.
Liquidity
General. NNN’s demand for funds has been and will continue to be primarily for (i) payment ofoperating expenses and dividends; (ii) property acquisitions and development, mortgages and notesreceivable, structured finance investments and capital expenditures; (iii) payment of principal andinterest on its outstanding indebtedness, and (iv) other investments.
NNN expects to meet these requirements (other than amounts required for additional propertyinvestments, mortgages and notes receivables and structured finance investments) through cashprovided from operations and NNN’s revolving credit facility. NNN utilizes its credit facility to meetits short term working capital requirements. As of December 31, 2007, $129,800,000 was outstandingand approximately $270,200,000 was available for future borrowings under the credit facility,excluding undrawn letters of credit totaling $2,685,000. NNN anticipates that any additionalinvestments in properties, mortgages and notes receivables and structured finance investments duringthe next 12 months will be funded with cash provided from operations, long-term debt and the issuanceof common or preferred equity, which may be initially funded with proceeds from NNN’s revolvingcredit facility. However, there can be no assurance that additional financing or capital will be available,or that the terms will be acceptable or advantageous to NNN.
Below is a summary of NNN’s cash flows for each of the years ended December 31 (in thousands):
2007 2006 2005
Cash and cash equivalents:Provided by operating activities $ 129,634 $ 1,676 $ 19,226Used in investing activities (536,717) (90,099) (230,783)Provided by financing activities 432,907 81,864 217,844
Increase (decrease) 25,824 (6,559) 6,287January 1 1,675 8,234 1,947
December 31 $ 27,499 $ 1,675 $ 8,234
36
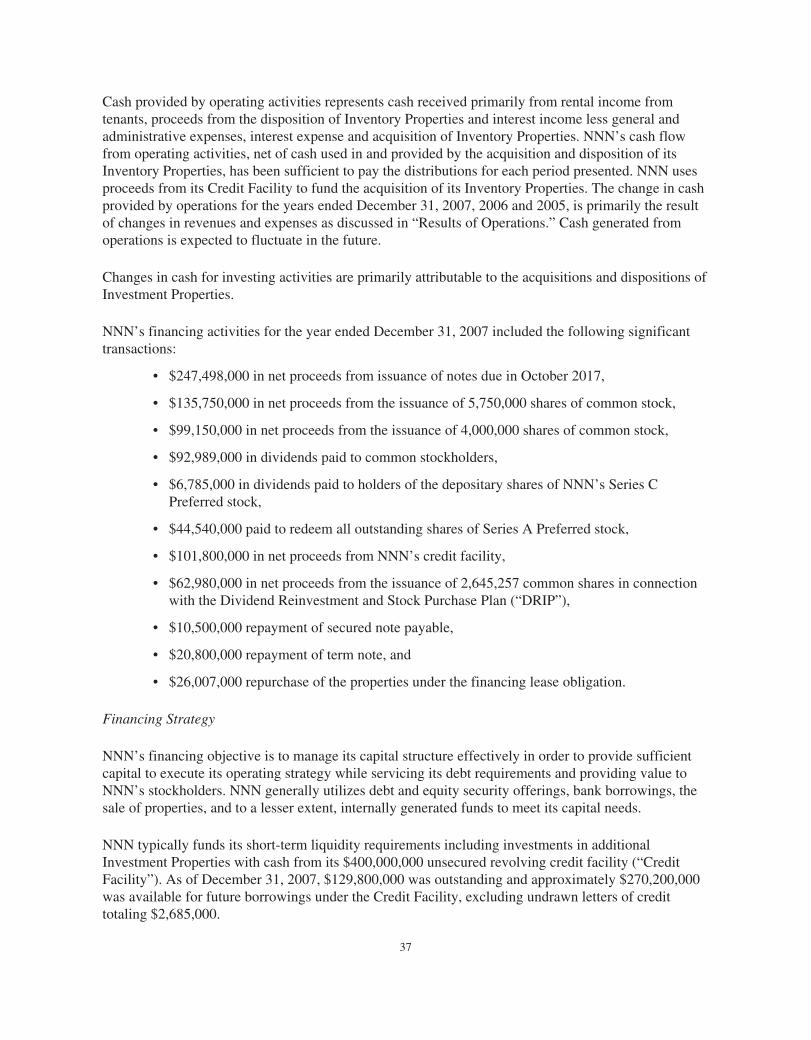
Cash provided by operating activities represents cash received primarily from rental income fromtenants, proceeds from the disposition of Inventory Properties and interest income less general andadministrative expenses, interest expense and acquisition of Inventory Properties. NNN’s cash flowfrom operating activities, net of cash used in and provided by the acquisition and disposition of itsInventory Properties, has been sufficient to pay the distributions for each period presented. NNN usesproceeds from its Credit Facility to fund the acquisition of its Inventory Properties. The change in cashprovided by operations for the years ended December 31, 2007, 2006 and 2005, is primarily the resultof changes in revenues and expenses as discussed in “Results of Operations.” Cash generated fromoperations is expected to fluctuate in the future.
Changes in cash for investing activities are primarily attributable to the acquisitions and dispositions ofInvestment Properties.
NNN’s financing activities for the year ended December 31, 2007 included the following significanttransactions:
• $247,498,000 in net proceeds from issuance of notes due in October 2017,
• $135,750,000 in net proceeds from the issuance of 5,750,000 shares of common stock,
• $99,150,000 in net proceeds from the issuance of 4,000,000 shares of common stock,
• $92,989,000 in dividends paid to common stockholders,
• $6,785,000 in dividends paid to holders of the depositary shares of NNN’s Series CPreferred stock,
• $44,540,000 paid to redeem all outstanding shares of Series A Preferred stock,
• $101,800,000 in net proceeds from NNN’s credit facility,
• $62,980,000 in net proceeds from the issuance of 2,645,257 common shares in connectionwith the Dividend Reinvestment and Stock Purchase Plan (“DRIP”),
• $10,500,000 repayment of secured note payable,
• $20,800,000 repayment of term note, and
• $26,007,000 repurchase of the properties under the financing lease obligation.
Financing Strategy
NNN’s financing objective is to manage its capital structure effectively in order to provide sufficientcapital to execute its operating strategy while servicing its debt requirements and providing value toNNN’s stockholders. NNN generally utilizes debt and equity security offerings, bank borrowings, thesale of properties, and to a lesser extent, internally generated funds to meet its capital needs.
NNN typically funds its short-term liquidity requirements including investments in additionalInvestment Properties with cash from its $400,000,000 unsecured revolving credit facility (“CreditFacility”). As of December 31, 2007, $129,800,000 was outstanding and approximately $270,200,000was available for future borrowings under the Credit Facility, excluding undrawn letters of credittotaling $2,685,000.
37
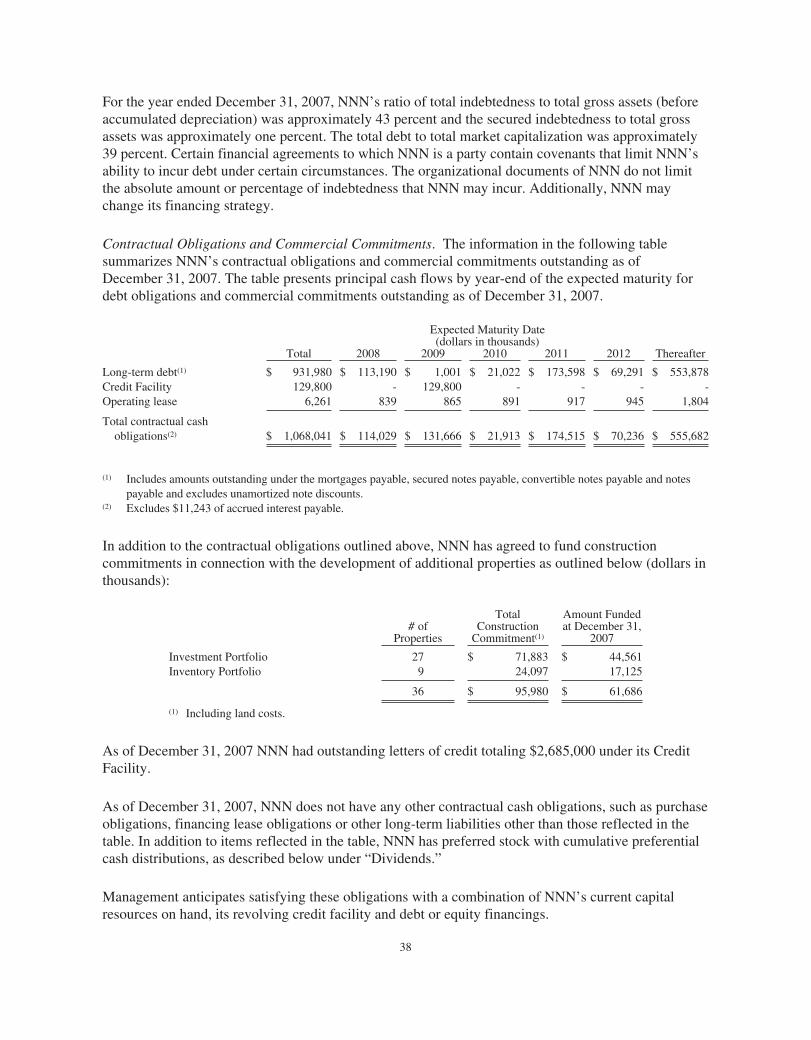
For the year ended December 31, 2007, NNN’s ratio of total indebtedness to total gross assets (beforeaccumulated depreciation) was approximately 43 percent and the secured indebtedness to total grossassets was approximately one percent. The total debt to total market capitalization was approximately39 percent. Certain financial agreements to which NNN is a party contain covenants that limit NNN’sability to incur debt under certain circumstances. The organizational documents of NNN do not limitthe absolute amount or percentage of indebtedness that NNN may incur. Additionally, NNN maychange its financing strategy.
Contractual Obligations and Commercial Commitments. The information in the following tablesummarizes NNN’s contractual obligations and commercial commitments outstanding as ofDecember 31, 2007. The table presents principal cash flows by year-end of the expected maturity fordebt obligations and commercial commitments outstanding as of December 31, 2007.
Expected Maturity Date(dollars in thousands)
Total 2008 2009 2010 2011 2012 Thereafter
Long-term debt(1) $ 931,980 $ 113,190 $ 1,001 $ 21,022 $ 173,598 $ 69,291 $ 553,878Credit Facility 129,800 - 129,800 - - - -Operating lease 6,261 839 865 891 917 945 1,804
Total contractual cashobligations(2) $ 1,068,041 $ 114,029 $ 131,666 $ 21,913 $ 174,515 $ 70,236 $ 555,682
(1) Includes amounts outstanding under the mortgages payable, secured notes payable, convertible notes payable and notespayable and excludes unamortized note discounts.
(2) Excludes $11,243 of accrued interest payable.
In addition to the contractual obligations outlined above, NNN has agreed to fund constructioncommitments in connection with the development of additional properties as outlined below (dollars inthousands):
# ofProperties
TotalConstruction
Commitment(1)
Amount Fundedat December 31,
2007
Investment Portfolio 27 $ 71,883 $ 44,561Inventory Portfolio 9 24,097 17,125
36 $ 95,980 $ 61,686
(1) Including land costs.
As of December 31, 2007 NNN had outstanding letters of credit totaling $2,685,000 under its CreditFacility.
As of December 31, 2007, NNN does not have any other contractual cash obligations, such as purchaseobligations, financing lease obligations or other long-term liabilities other than those reflected in thetable. In addition to items reflected in the table, NNN has preferred stock with cumulative preferentialcash distributions, as described below under “Dividends.”
Management anticipates satisfying these obligations with a combination of NNN’s current capitalresources on hand, its revolving credit facility and debt or equity financings.
38
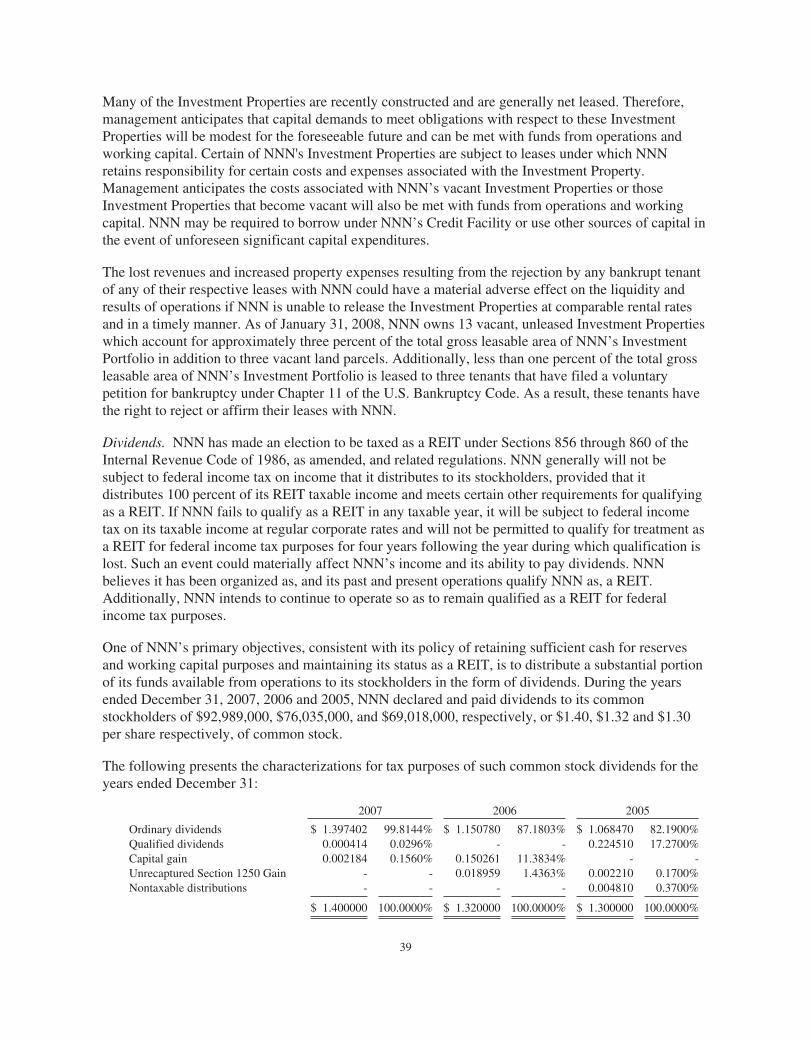
Many of the Investment Properties are recently constructed and are generally net leased. Therefore,management anticipates that capital demands to meet obligations with respect to these InvestmentProperties will be modest for the foreseeable future and can be met with funds from operations andworking capital. Certain of NNN's Investment Properties are subject to leases under which NNNretains responsibility for certain costs and expenses associated with the Investment Property.Management anticipates the costs associated with NNN’s vacant Investment Properties or thoseInvestment Properties that become vacant will also be met with funds from operations and workingcapital. NNN may be required to borrow under NNN’s Credit Facility or use other sources of capital inthe event of unforeseen significant capital expenditures.
The lost revenues and increased property expenses resulting from the rejection by any bankrupt tenantof any of their respective leases with NNN could have a material adverse effect on the liquidity andresults of operations if NNN is unable to release the Investment Properties at comparable rental ratesand in a timely manner. As of January 31, 2008, NNN owns 13 vacant, unleased Investment Propertieswhich account for approximately three percent of the total gross leasable area of NNN’s InvestmentPortfolio in addition to three vacant land parcels. Additionally, less than one percent of the total grossleasable area of NNN’s Investment Portfolio is leased to three tenants that have filed a voluntarypetition for bankruptcy under Chapter 11 of the U.S. Bankruptcy Code. As a result, these tenants havethe right to reject or affirm their leases with NNN.
Dividends. NNN has made an election to be taxed as a REIT under Sections 856 through 860 of theInternal Revenue Code of 1986, as amended, and related regulations. NNN generally will not besubject to federal income tax on income that it distributes to its stockholders, provided that itdistributes 100 percent of its REIT taxable income and meets certain other requirements for qualifyingas a REIT. If NNN fails to qualify as a REIT in any taxable year, it will be subject to federal incometax on its taxable income at regular corporate rates and will not be permitted to qualify for treatment asa REIT for federal income tax purposes for four years following the year during which qualification islost. Such an event could materially affect NNN’s income and its ability to pay dividends. NNNbelieves it has been organized as, and its past and present operations qualify NNN as, a REIT.Additionally, NNN intends to continue to operate so as to remain qualified as a REIT for federalincome tax purposes.
One of NNN’s primary objectives, consistent with its policy of retaining sufficient cash for reservesand working capital purposes and maintaining its status as a REIT, is to distribute a substantial portionof its funds available from operations to its stockholders in the form of dividends. During the yearsended December 31, 2007, 2006 and 2005, NNN declared and paid dividends to its commonstockholders of $92,989,000, $76,035,000, and $69,018,000, respectively, or $1.40, $1.32 and $1.30per share respectively, of common stock.
The following presents the characterizations for tax purposes of such common stock dividends for theyears ended December 31:
2007 2006 2005
Ordinary dividends $ 1.397402 99.8144% $ 1.150780 87.1803% $ 1.068470 82.1900%Qualified dividends 0.000414 0.0296% - - 0.224510 17.2700%Capital gain 0.002184 0.1560% 0.150261 11.3834% - -Unrecaptured Section 1250 Gain - - 0.018959 1.4363% 0.002210 0.1700%Nontaxable distributions - - - - 0.004810 0.3700%
$ 1.400000 100.0000% $ 1.320000 100.0000% $ 1.300000 100.0000%
39
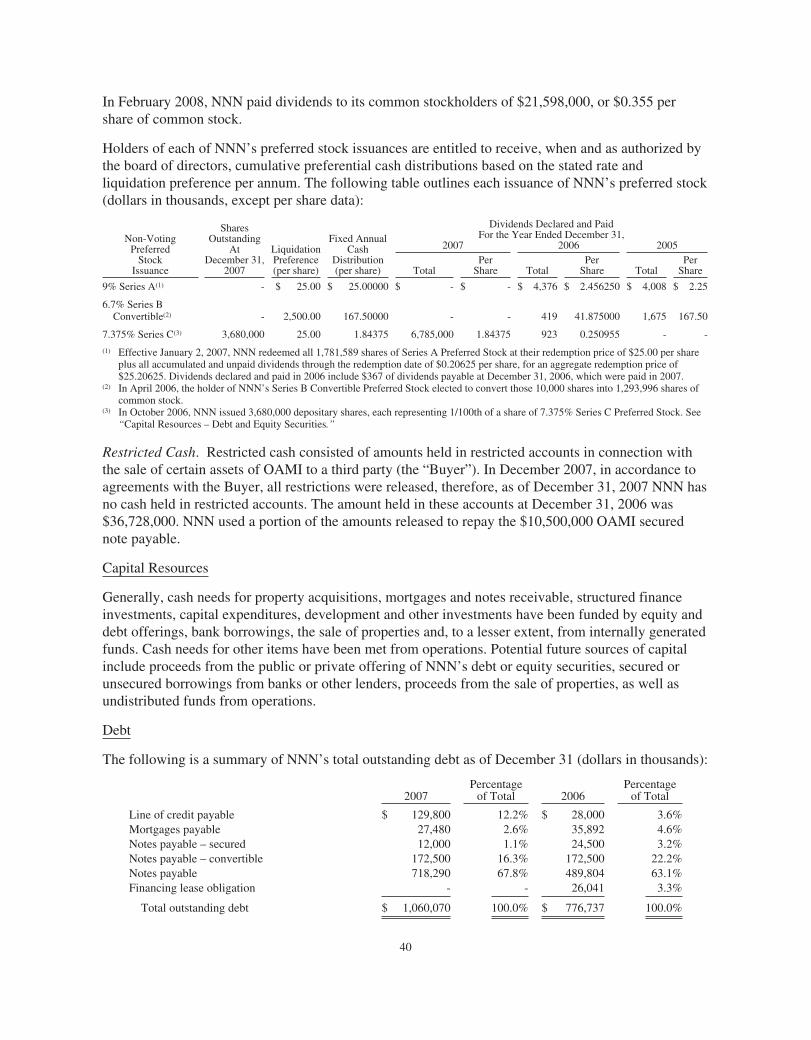
In February 2008, NNN paid dividends to its common stockholders of $21,598,000, or $0.355 pershare of common stock.
Holders of each of NNN’s preferred stock issuances are entitled to receive, when and as authorized bythe board of directors, cumulative preferential cash distributions based on the stated rate andliquidation preference per annum. The following table outlines each issuance of NNN’s preferred stock(dollars in thousands, except per share data):
Non-VotingPreferred
StockIssuance
SharesOutstanding
AtDecember 31,
2007
LiquidationPreference(per share)
Fixed AnnualCash
Distribution(per share)
Dividends Declared and PaidFor the Year Ended December 31,
2007 2006 2005
TotalPer
Share TotalPer
Share TotalPer
Share
9% Series A(1) - $ 25.00 $ 25.00000 $ - $ - $ 4,376 $ 2.456250 $ 4,008 $ 2.25
6.7% Series BConvertible(2) - 2,500.00 167.50000 - - 419 41.875000 1,675 167.50
7.375% Series C(3) 3,680,000 25.00 1.84375 6,785,000 1.84375 923 0.250955 - -
(1) Effective January 2, 2007, NNN redeemed all 1,781,589 shares of Series A Preferred Stock at their redemption price of $25.00 per shareplus all accumulated and unpaid dividends through the redemption date of $0.20625 per share, for an aggregate redemption price of$25.20625. Dividends declared and paid in 2006 include $367 of dividends payable at December 31, 2006, which were paid in 2007.
(2) In April 2006, the holder of NNN’s Series B Convertible Preferred Stock elected to convert those 10,000 shares into 1,293,996 shares ofcommon stock.
(3) In October 2006, NNN issued 3,680,000 depositary shares, each representing 1/100th of a share of 7.375% Series C Preferred Stock. See“Capital Resources – Debt and Equity Securities.”
Restricted Cash. Restricted cash consisted of amounts held in restricted accounts in connection withthe sale of certain assets of OAMI to a third party (the “Buyer”). In December 2007, in accordance toagreements with the Buyer, all restrictions were released, therefore, as of December 31, 2007 NNN hasno cash held in restricted accounts. The amount held in these accounts at December 31, 2006 was$36,728,000. NNN used a portion of the amounts released to repay the $10,500,000 OAMI securednote payable.
Capital Resources
Generally, cash needs for property acquisitions, mortgages and notes receivable, structured financeinvestments, capital expenditures, development and other investments have been funded by equity anddebt offerings, bank borrowings, the sale of properties and, to a lesser extent, from internally generatedfunds. Cash needs for other items have been met from operations. Potential future sources of capitalinclude proceeds from the public or private offering of NNN’s debt or equity securities, secured orunsecured borrowings from banks or other lenders, proceeds from the sale of properties, as well asundistributed funds from operations.
Debt
The following is a summary of NNN’s total outstanding debt as of December 31 (dollars in thousands):
2007Percentage
of Total 2006Percentage
of Total
Line of credit payable $ 129,800 12.2% $ 28,000 3.6%Mortgages payable 27,480 2.6% 35,892 4.6%Notes payable – secured 12,000 1.1% 24,500 3.2%Notes payable – convertible 172,500 16.3% 172,500 22.2%Notes payable 718,290 67.8% 489,804 63.1%Financing lease obligation - - 26,041 3.3%
Total outstanding debt $ 1,060,070 100.0% $ 776,737 100.0%
40
Line of Credit Payable. In October 2007, NNN exercised the $100,000,000 accordion feature of itsexisting revolving Credit Facility increasing the borrowing capacity to $400,000,000 from$300,000,000. The terms of the Credit Facility provide for (i) a tiered interest rate structure of amaximum of 112.5 basis points above LIBOR (based upon the debt rating of NNN, the current interestrate is 80 basis points above LIBOR), (ii) requires NNN to pay a commitment fee based on a tiered ratestructure to a maximum of 25 basis points per annum (based upon the debt rating of NNN, the currentcommitment fee is 20 basis points), (iii) provides for a competitive bid option for up to 50 percent ofthe facility amount and (iv) expires on May 8, 2009. The principal balance is due in full uponexpiration of the Credit Facility in May 2009, which NNN may request to be extended for an additional12 months. As of December 31, 2007, $129,800,000 was outstanding and approximately $270,200,000was available for future borrowings under the Credit Facility, excluding undrawn letters of credittotaling $2,685,000.
In accordance with the terms of the Credit Facility, NNN is required to meet certain restrictivefinancial covenants, which, among other things, require NNN to maintain certain (i) maximumleverage ratios, (ii) debt service coverage, (iii) cash flow coverage, and (iv) investment limitations. AtDecember 31, 2007, NNN was in compliance with those covenants. In the event that NNN violates anyof these restrictive financial covenants, its access to the debt or equity markets may become impaired.
Mortgages Payable. In September 2007, upon maturity, NNN repaid the outstanding principal balanceon the long-term fixed rate loan which had an original principal balance of $12,000,000, and wassecured by a first mortgage on nine Investment Properties. Upon repayment of the loan, theencumbered Investment Properties were released from the mortgage. As of December 31, 2006, theoutstanding principal balance was $7,305,000 with an interest rate of 7.37%.
In February 2006, upon maturity, NNN repaid the outstanding principal balance of its long-term, fixedrate loan with an original principal balance of $39,450,000, which was secured by a first mortgage oncertain of NNN’s Investment Properties. Upon repayment of the loan, the Investment Properties werereleased from the mortgage. As of December 31, 2005, the outstanding principal balance was$18,538,000 with an interest rate of 7.44%.
In May 2006, NNN disposed of three Investment Properties that were subject to a first mortgage withan original and outstanding principal balance of $95,000,000 with an interest rate of 5.40%. Upondisposition of these Investment Properties, the buyer assumed the mortgage.
Notes Payable – Secured. In December 2007, NNN repaid the outstanding principal balance of$10,500,000 on one of its secured notes which had an interest rate of 10.00%. NNN repaid theoutstanding balance of the note with the restricted cash that was released in December 2007.
Notes Payable – Convertible. In September 2006, NNN filed a prospectus supplement to theprospectus contained in its February 2006 shelf registration statement and issued $150,000,000 of3.95% convertible senior notes due September 2026 (with a 2011 put option). Subsequently, NNNissued an additional $22,500,000 in connection with the underwriters’ over-allotment option(collectively, the “Convertible Notes”). The Convertible Notes were sold at par with interest payablesemi-annually commencing on March 15, 2007 (effective interest rate of 3.95%).
The notes are convertible, at the option of the holder, at any time on or after September 15, 2025. Priorto September 15, 2025, holders may convert their Convertible Notes under certain circumstances. Theinitial conversion rate per $1,000 principal amount of Convertible Notes was 40.9015 shares of NNN’s
41
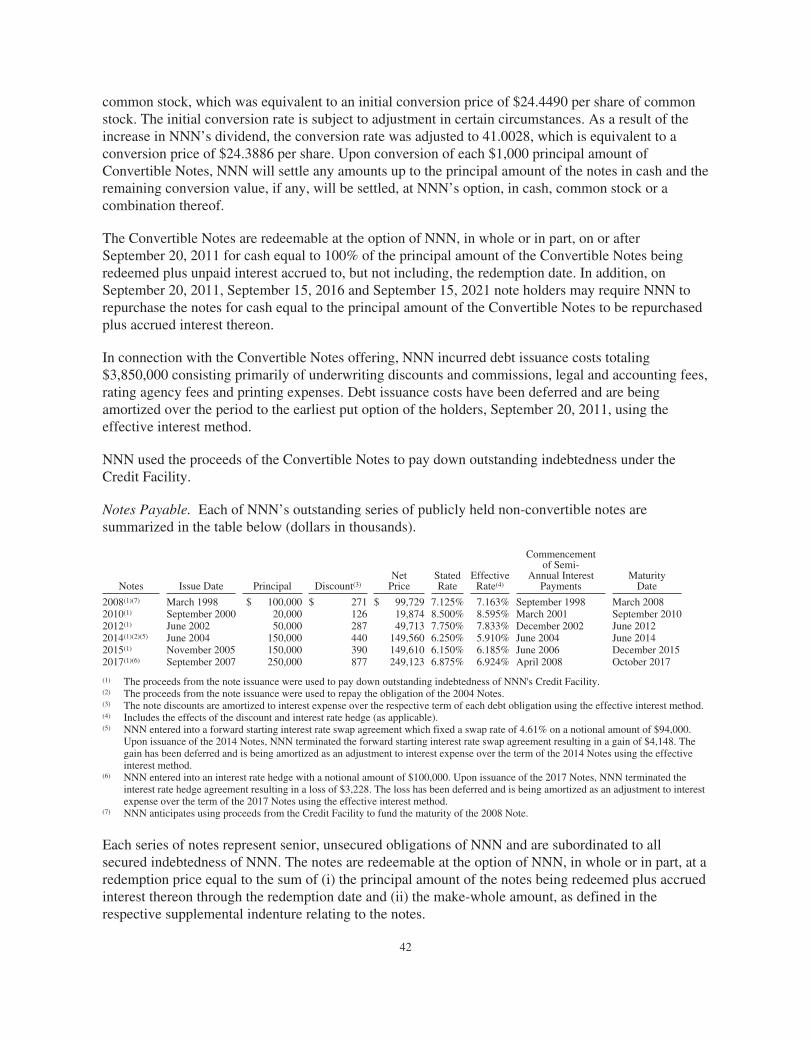
common stock, which was equivalent to an initial conversion price of $24.4490 per share of commonstock. The initial conversion rate is subject to adjustment in certain circumstances. As a result of theincrease in NNN’s dividend, the conversion rate was adjusted to 41.0028, which is equivalent to aconversion price of $24.3886 per share. Upon conversion of each $1,000 principal amount ofConvertible Notes, NNN will settle any amounts up to the principal amount of the notes in cash and theremaining conversion value, if any, will be settled, at NNN’s option, in cash, common stock or acombination thereof.
The Convertible Notes are redeemable at the option of NNN, in whole or in part, on or afterSeptember 20, 2011 for cash equal to 100% of the principal amount of the Convertible Notes beingredeemed plus unpaid interest accrued to, but not including, the redemption date. In addition, onSeptember 20, 2011, September 15, 2016 and September 15, 2021 note holders may require NNN torepurchase the notes for cash equal to the principal amount of the Convertible Notes to be repurchasedplus accrued interest thereon.
In connection with the Convertible Notes offering, NNN incurred debt issuance costs totaling$3,850,000 consisting primarily of underwriting discounts and commissions, legal and accounting fees,rating agency fees and printing expenses. Debt issuance costs have been deferred and are beingamortized over the period to the earliest put option of the holders, September 20, 2011, using theeffective interest method.
NNN used the proceeds of the Convertible Notes to pay down outstanding indebtedness under theCredit Facility.
Notes Payable. Each of NNN’s outstanding series of publicly held non-convertible notes aresummarized in the table below (dollars in thousands).
Notes Issue Date Principal Discount(3)Net
PriceStatedRate
EffectiveRate(4)
Commencementof Semi-
Annual InterestPayments
MaturityDate
2008(1)(7) March 1998 $ 100,000 $ 271 $ 99,729 7.125% 7.163% September 1998 March 20082010(1) September 2000 20,000 126 19,874 8.500% 8.595% March 2001 September 20102012(1) June 2002 50,000 287 49,713 7.750% 7.833% December 2002 June 20122014(1)(2)(5) June 2004 150,000 440 149,560 6.250% 5.910% June 2004 June 20142015(1) November 2005 150,000 390 149,610 6.150% 6.185% June 2006 December 20152017(1)(6) September 2007 250,000 877 249,123 6.875% 6.924% April 2008 October 2017
(1) The proceeds from the note issuance were used to pay down outstanding indebtedness of NNN's Credit Facility.(2) The proceeds from the note issuance were used to repay the obligation of the 2004 Notes.(3) The note discounts are amortized to interest expense over the respective term of each debt obligation using the effective interest method.(4) Includes the effects of the discount and interest rate hedge (as applicable).(5) NNN entered into a forward starting interest rate swap agreement which fixed a swap rate of 4.61% on a notional amount of $94,000.
Upon issuance of the 2014 Notes, NNN terminated the forward starting interest rate swap agreement resulting in a gain of $4,148. Thegain has been deferred and is being amortized as an adjustment to interest expense over the term of the 2014 Notes using the effectiveinterest method.
(6) NNN entered into an interest rate hedge with a notional amount of $100,000. Upon issuance of the 2017 Notes, NNN terminated theinterest rate hedge agreement resulting in a loss of $3,228. The loss has been deferred and is being amortized as an adjustment to interestexpense over the term of the 2017 Notes using the effective interest method.
(7) NNN anticipates using proceeds from the Credit Facility to fund the maturity of the 2008 Note.
Each series of notes represent senior, unsecured obligations of NNN and are subordinated to allsecured indebtedness of NNN. The notes are redeemable at the option of NNN, in whole or in part, at aredemption price equal to the sum of (i) the principal amount of the notes being redeemed plus accruedinterest thereon through the redemption date and (ii) the make-whole amount, as defined in therespective supplemental indenture relating to the notes.
42
In connection with the note offerings, NNN incurred debt issuance costs totaling $6,667,000 consistingprimarily of underwriting discounts and commissions, legal and accounting fees, rating agency feesand printing expenses. Debt issuance costs for all note issuances have been deferred and are beingamortized over the term of the respective notes using the effective interest method.
In accordance with the terms of the indenture, pursuant to which NNN’s notes have been issued, NNNis required to meet certain restrictive financial covenants, which, among other things, require NNN tomaintain (i) certain leverage ratios and (ii) certain interest coverage. At December 31, 2007, NNN wasin compliance with those covenants. In the event that NNN violates any of the certain restrictivefinancial covenants, its access to the debt or equity markets may become impaired.
In addition, in connection with the acquisition of NAPE, NNN assumed a $20,800,000 term notepayable (“Term Note”). In October 2007, NNN repaid the outstanding principal balance on its$20,800,000 term note. The term note had a weighted interest rate of 6.62% as of December 2006.
Financing Lease Obligation. In July 2004, NNN sold five investment properties for approximately$26,041,000 and subsequently leased back the properties under a 10-year financing lease obligation.NNN may repurchase one or more of the properties subject to put and call options included in thefinancing lease. In accordance with the provisions of SFAS No. 66, “Accounting for Sales of RealEstate,” NNN has recognized the sale as a financing transaction. The 10-year financing lease bears aninterest rate of 5.00% annually with monthly interest payments of $109,000 and expires in June 2014unless either the put or call option was exercised. In November 2007, NNN repurchased the propertiesunder the agreements of the put option for approximately $26,007,000.
Debt and Equity Securities.
NNN has used, and expects to use in the future, issuances of debt and equity securities primarily to paydown its outstanding indebtedness and to finance investment acquisitions. NNN has maintainedinvestment grade debt ratings from Standard and Poor’s, Moody’s Investor Service and Fitch Ratingson its senior, unsecured debt since 1998. In February 2006, NNN filed a shelf registration statementwith the Securities and Exchange Commission which permits the issuance by NNN of an indeterminateamount of debt and equity securities.
A description of NNN’s outstanding series of publicly held notes is found under “Debt – NotesPayable – Convertible” and “Debt – Notes Payable” above.
7.375% Series C Cumulative Redeemable Preferred Stock. In October 2006, NNN issued 3,200,000depositary shares, each representing 1/100th of a share of 7.375% Series C Cumulative RedeemablePreferred Stock (“Series C Redeemable Preferred Stock”), and received gross proceeds of $80,000,000.Subsequently, NNN issued an additional 480,000 depositary shares in connection with theunderwriters’ over-allotment option and received gross proceeds of $12,000,000. In connection withthis offering, NNN incurred stock issuance costs of approximately $3,098,000, consisting primarily ofunderwriting commissions and fees, legal and accounting fees and printing expenses.
Holders of the depositary shares are entitled to receive, when and as authorized by the Board ofDirectors, cumulative preferential cash dividends at the rate of 7.375% of the $25.00 liquidationpreference per depositary share per annum (equivalent to a fixed annual amount of $1.84375 perdepositary share). The Series C Redeemable Preferred Stock underlying the depositary shares rankssenior to NNN’s common stock with respect to dividend rights and rights upon liquidation, dissolution
43
or winding up of NNN. NNN may redeem the Series C Redeemable Preferred Stock underlying thedepositary shares on or after October 12, 2011, for cash, at a redemption price of $2,500.00 per share(or $25.00 per depositary share), plus all accumulated, accrued and unpaid dividends.
In January 2007, NNN used $44,540,000 of the net proceeds from the offering to redeem the Series APreferred Stock; and the remainder of the net proceeds were to repay borrowings under the CreditFacility.
Common Stock Issuances. In March 2007, NNN issued 5,000,000 shares of common stock at a priceof $24.70 per share and received net proceeds of $118,020,000. Subsequently, in April 2007, NNNissued an additional 750,000 shares of common stock in connection with the underwriters’ over-allotment option and received net proceeds of $17,730,000. In connection with this offering, NNNincurred stock issuance costs totaling approximately $6,217,000 consisting primarily of underwriters’fees and commissions, legal and accounting fees and printing expenses.
In October 2007, NNN issued 4,000,000 shares of common stock at a price of $25.94 per share andreceived net proceeds of $99,150,000. In connection with this offering, NNN incurred stock issuancecosts totaling approximately $4,874,000 consisting primarily of underwriter’s fees and commissions,legal and accounting fees. In October 2007, NNN used a portion of the net proceeds to repay theoutstanding principal balance on its term note.
In June 2005, in connection with the acquisition of National Properties Corporation (see “Results ofOperations – Business Combination”), NNN issued 1,636,532 newly issued shares of NNN’s commonstock in exchange for 100 percent of the common stock of NAPE.
Dividend Reinvestment and Stock Purchase Plan. In February 2006, NNN filed a shelf registrationstatement with the Securities and Exchange Commission for its Dividend Reinvestment and StockPurchase Plan (“DRIP”), which permits the issuance by NNN of up to 12,191,394 shares of commonstock. The DRIP provides an economical and convenient way for current stockholders and otherinterested new investors to invest in NNN’s common stock. The following outlines the common stockissuances pursuant to NNN’s DRIP for each of the years ended December 31 (dollars in thousands):
2007 2006
Shares of commonstock 2,645,257 3,046,408
Net proceeds $ 62,980 $ 65,722
The proceeds from the issuances were used to pay down outstanding indebtedness under NNN’s CreditFacility.
Investment in Unconsolidated Affiliates – In September 2007, NNN entered into a joint venture, NNNRetail Properties Fund I LLC (the “NNN Crow JV I”), with an affiliate of Crow Holdings RealtyPartners IV, L.P. NNN Crow JV I plans to acquire up to $220,000,000 of real estate assets leased toconvenience store operators from unrelated third parties. NNN owns a 15 percent equity interest in thejoint venture which it accounts for under the equity method of accounting. Net income and losses ofthe joint venture are allocated to the members in accordance with their respective percentage interest.During the year ended December 31, 2007, in accordance with the terms of the joint ventureagreement, NNN loaned $2,749,000 to the joint venture at an interest rate of 7.75%. The loan balancewas paid in full in November 2007.
Mortgages and Notes Receivable. Mortgages are loans secured by real estate, real estate securities orother assets. As of December 31, 2007, these receivables totaled $49,336,000.
44
Structured finance agreements are typically loans secured by a borrower’s pledge of ownershipinterests in the entity that owns or leases the real estate and/or other acceptable collateral such asfixtures, equipment or cash. These agreements are sometimes subordinated to senior loans secured byfirst mortgages encumbering the underlying real estate. Subordinated positions are generally subject toa higher risk of nonpayment of principal and interest than the more senior loans. As of December 31,2007, the structured finance agreements had an outstanding principal balance of $14,359,000.
As of December 31, 2007, the structured finance investments bear a weighted average interest rate of11.26% per annum, of which 9.78% is payable monthly and the remaining 1.48% accrues and is due atmaturity. The principal balance of each structured finance investment is due in full at maturity, whichranges between January 2009 and March 2010. The structured finance investments are secured by theborrowers’ pledge of their respective membership interests in the certain subsidiaries which own therespective real estate.
Mortgages and notes receivable consisted of the following at December 31 (dollars in thousands):
2007 2006
Mortgages and notes receivable $ 51,556 $ 17,227Structured Finance 14,359 13,917Accrued interest receivables 545 641
66,460 31,785Less loan origination fees, net (100) (206)Less allowance (396) (634)
$ 65,964 $ 30,945
Commercial Mortgage Residual Interests. In connection with the independent valuations of thecommercial mortgage residual interests’ (the “Residuals”) fair value, NNN adjusted carrying value ofthe Residuals to reflect such fair value at December 31, 2007. The adjustments in the Residuals’ wererecorded as an aggregate other than temporary valuation impairment of $638,000 and $8,779,000, forthe years ended December 31, 2007 and 2006, respectively. NNN recorded $326,000 of unrealizedlosses and $1,992,000 of unrealized gains as other comprehensive income for the years endedDecember 31, 2007 and 2006, respectively.
45
Item 7A. Quantitative and Qualitative Disclosures About Market Risk
NNN is exposed to interest changes primarily as a result of its variable rate Credit Facility and its long-term, fixed rate debt used to finance NNN’s development and acquisition activities, and for generalcorporate purposes. NNN’s interest rate risk management objective is to limit the impact of interestrate changes on earnings and cash flows and to lower its overall borrowing costs. To achieve itsobjectives, NNN borrows at both fixed and variable rates on its long-term debt. As of December 31,2007, NNN has one interest rate hedge with a value of $109,000 which is included in other liabilities.As of December 31, 2006, NNN had no outstanding derivatives.
The information in the table below summarizes NNN’s market risks associated with its debtobligations outstanding as of December 31, 2007 and 2006. The table presents principal cash flows andrelated interest rates by year for debt obligations outstanding as of December 31, 2007. The variableinterest rates shown represent the weighted average rates for the Credit Facility and Term Note at theend of the periods. The table incorporates only those debt obligations that exist as of December 31,2007 it does not consider those debt obligations or positions which could arise after this date.Moreover, because firm commitments are not presented in the table below, the information presentedtherein has limited predictive value. As a result, NNN’s ultimate realized gain or loss with respect tointerest rate fluctuations will depend on the exposures that arise during the period, NNN’s hedgingstrategies at that time and interest rates. If interest rates on NNN’s variable rate debt increased by onepercent, NNN’s interest expense would have increased approximately three percent for the year endedDecember 31, 2007.
Debt Obligations (dollars in thousands)Variable Rate Debt Fixed Rate Debt
Credit Facility and TermNote(1) Mortgages Unsecured Debt(3)(4) Secured Debt
DebtObligation
WeightedAverageInterestRate(2)
DebtObligation
WeightedAverageInterest
RateDebt
Obligation
EffectiveInterest
RateDebt
Obligation
WeightedAverageInterest
Rate2008 - - 1,190 7.04% 99,992 7.16% 12,000 10.00%2009 129,800 6.24% 1,000 7.02% - - - -2010 - - 1,022 7.01% 19,955 8.60% - -2011 - - 1,098 7.00% 172,500 3.95% - -2012 - - 19,291 6.73% 49,846 7.83% - -Thereafter - - 3,879 7.60% 548,497 6.45% - -
Total $ 129,800 6.24% $ 27,480 7.04% $ 890,790 6.17% $ 12,000 10.00%
Fair Value:December 31, 2007 $ 129,800 6.24% $ 27,480 7.04% $ 921,507 6.17% $ 12,000 10.00%
December 31, 2006 $ 48,800 5.98% $ 35,892 7.12% $ 690,198 5.84% $ 24,500 10.00%
(1) In October 2007, NNN repaid the outstanding principal balance on the Term Note.(2) The Credit Facility interest rate varies based upon a tiered rate structure ranging from 55 to 112.5 basis points above
LIBOR based upon the debt rating of NNN.(3) Includes NNN’s notes payable, net of unamortized note discounts and convertible notes payable.(4) In July 2004, NNN sold Investment Properties for $26,041 and subsequently leased back the properties under a 10 year
financing lease obligation which was subsequently repurchased in November 2007.
NNN is also exposed to market risks related to NNN’s Residuals. Factors that may impact the marketvalue of the Residuals include delinquencies, loan losses, prepayment speeds and interest rates. TheResiduals, which are reported at market value, had a carrying value of $24,340,000 and $31,512,000 asof December 31, 2007 and December 31, 2006, respectively. Unrealized gains and losses are reportedas other comprehensive income in stockholders’ equity. Losses are considered other than temporaryand reported as a valuation impairment in earnings from operations if and when there has been achange in the timing or amount of estimated cash flows that leads to a loss in value.
46
Item 8. Financial Statements and Supplementary Data
Report of Independent Registered Public Accounting Firm
The Board of Directors and ShareholdersNational Retail Properties, Inc.
We have audited National Retail Properties, Inc.’s internal control over financial reporting as ofDecember 31, 2007, based on criteria established in Internal Control—Integrated Framework issued by theCommittee of Sponsoring Organizations of the Treadway Commission (the COSO criteria). National RetailProperties, Inc.’s management is responsible for maintaining effective internal control over financial reporting,and for its assessment of the effectiveness of internal control over financial reporting included in theaccompanying Managements’ Report on Internal Control over Financial Reporting. Our responsibility is toexpress an opinion on the company’s internal control over financial reporting based on our audit.
We conducted our audit in accordance with the standards of the Public Company Accounting OversightBoard (United States). Those standards require that we plan and perform the audit to obtain reasonable assuranceabout whether effective internal control over financial reporting was maintained in all material respects. Our auditincluded obtaining an understanding of internal control over financial reporting, assessing the risk that a materialweakness exists, testing and evaluating the design and operative effectiveness of internal control based on theassessed risk, and performing such other procedures as we considered necessary in the circumstances. We believethat our audit provides a reasonable basis for our opinion.
A company’s internal control over financial reporting is a process designed to provide reasonable assuranceregarding the reliability of financial reporting and the preparation of financial statements for external purposes inaccordance with generally accepted accounting principles. A company’s internal control over financial reportingincludes those policies and procedures that (1) pertain to the maintenance of records that, in reasonable detail,accurately and fairly reflect the transactions and dispositions of the assets of the company; (2) provide reasonableassurance that transactions are recorded as necessary to permit preparation of financial statements in accordancewith generally accepted accounting principles, and that receipts and expenditures of the company are being madeonly in accordance with authorizations of management and directors of the company; and (3) provide reasonableassurance regarding prevention or timely detection of unauthorized acquisition, use, or disposition of thecompany’s assets that could have a material effect on the financial statements.
Because of its inherent limitations, internal control over financial reporting may not prevent or detectmisstatements. Also, projections of any evaluation of effectiveness to future periods are subject to the risk thatcontrols may become inadequate because of changes in conditions, or that the degree of compliance with thepolicies or procedures may deteriorate.
In our opinion, National Retail Properties, Inc. maintained, in all material respects, effective internal controlover financial reporting as of December 31, 2007, based on the COSO criteria.
We also have audited, in accordance with the standards of the Public Company Accounting Oversight Board(United States), the consolidated balance sheets of National Retail Properties, Inc. as of December 31, 2007 and2006, and the related consolidated statements of income, shareholders’ equity, and cash flows for the years thenended of National Retail Properties, Inc. and our report dated February 22, 2008, expressed an unqualifiedopinion thereon.
Certified Public Accountants
February 22, 2008Miami, Florida
47
Report of Independent Registered Public Accounting Firm
The Board of Directors and ShareholdersNational Retail Properties, Inc.
We have audited the accompanying consolidated balance sheets of National Retail Properties, Inc. andsubsidiaries as of December 31, 2007 and 2006, and the related consolidated statements of income,shareholders’ equity, and cash flows for the years then ended. These financial statements are theresponsibility of the Company’s management. Our responsibility is to express an opinion on thesefinancial statements based on our audits.
We conducted our audits in accordance with the standards of the Public Company AccountingOversight Board (United States). Those standards require that we plan and perform the audit to obtainreasonable assurance about whether the financial statements are free of material misstatement. Anaudit includes examining, on a test basis, evidence supporting the amounts and disclosures in thefinancial statements. An audit also includes assessing the accounting principles used and significantestimates made by management, as well as evaluating the overall financial statement presentation. Webelieve that our audits provide a reasonable basis for our opinion.
In our opinion, the financial statements referred to above present fairly, in all material respects, theconsolidated financial position of National Retail Properties, Inc. and subsidiaries at December 31,2007 and 2006, and the consolidated results of their operations and their cash flows for the years thenended, in conformity with U.S. generally accepted accounting principles.
We also have audited, in accordance with the standards of the Public Company Accounting OversightBoard (United States), National Retail Properties, Inc.’s internal control over financial reporting as ofDecember 31, 2007, based on criteria established in Internal Control-Integrated Framework issued bythe Committee of Sponsoring Organizations of the Treadway Commission and our report datedFebruary 22, 2008, expressed an unqualified opinion thereon.
February 22, 2008Miami, Florida
48
Report of Independent Registered Public Accounting Firm
The Board of Directors and StockholdersNational Retail Properties, Inc.:
We have audited the accompanying consolidated statements of earnings, stockholders’ equity, and cashflows of National Retail Properties, Inc. and subsidiaries for the year ended December 31, 2005. Theseconsolidated financial statements are the responsibility of the Company’s management. Ourresponsibility is to express an opinion on these consolidated financial statements for 2005 based on ouraudit.
We conducted our audit in accordance with the standards of the Public Company AccountingOversight Board (United States). Those standards require that we plan and perform the audit to obtainreasonable assurance about whether the financial statements are free of material misstatement. Anaudit includes examining, on a test basis, evidence supporting the amounts and disclosures in thefinancial statements. An audit also includes assessing the accounting principles used and significantestimates made by management, as well as evaluating the overall financial statement presentation. Webelieve that our audit provides a reasonable basis for our opinion.
In our opinion, the consolidated financial statements referred to above present fairly, in all materialrespects, the results of operations and the cash flows of National Retail Properties, Inc. and subsidiariesfor the year ended December 31, 2005, in conformity with U.S. generally accepted accountingprinciples.
Orlando, FloridaFebruary 17, 2006, except as to notes 2, 19, 26 which are as of February 22, 2008Certified Public Accountants
49
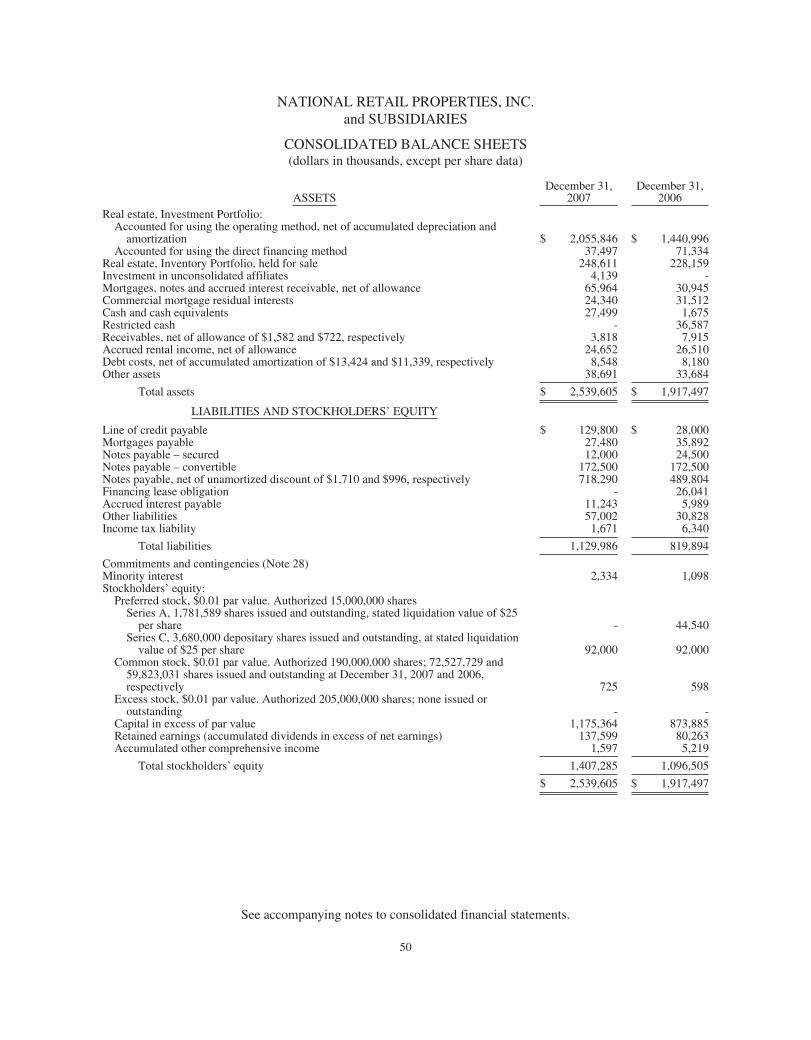
NATIONAL RETAIL PROPERTIES, INC.and SUBSIDIARIES
CONSOLIDATED BALANCE SHEETS(dollars in thousands, except per share data)
ASSETSDecember 31,
2007December 31,
2006Real estate, Investment Portfolio:
Accounted for using the operating method, net of accumulated depreciation andamortization $ 2,055,846 $ 1,440,996
Accounted for using the direct financing method 37,497 71,334Real estate, Inventory Portfolio, held for sale 248,611 228,159Investment in unconsolidated affiliates 4,139 -Mortgages, notes and accrued interest receivable, net of allowance 65,964 30,945Commercial mortgage residual interests 24,340 31,512Cash and cash equivalents 27,499 1,675Restricted cash - 36,587Receivables, net of allowance of $1,582 and $722, respectively 3,818 7,915Accrued rental income, net of allowance 24,652 26,510Debt costs, net of accumulated amortization of $13,424 and $11,339, respectively 8,548 8,180Other assets 38,691 33,684
Total assets $ 2,539,605 $ 1,917,497
LIABILITIES AND STOCKHOLDERS’ EQUITY
Line of credit payable $ 129,800 $ 28,000Mortgages payable 27,480 35,892Notes payable – secured 12,000 24,500Notes payable – convertible 172,500 172,500Notes payable, net of unamortized discount of $1,710 and $996, respectively 718,290 489,804Financing lease obligation - 26,041Accrued interest payable 11,243 5,989Other liabilities 57,002 30,828Income tax liability 1,671 6,340
Total liabilities 1,129,986 819,894
Commitments and contingencies (Note 28)Minority interest 2,334 1,098Stockholders’ equity:
Preferred stock, $0.01 par value. Authorized 15,000,000 sharesSeries A, 1,781,589 shares issued and outstanding, stated liquidation value of $25
per share - 44,540Series C, 3,680,000 depositary shares issued and outstanding, at stated liquidation
value of $25 per share 92,000 92,000Common stock, $0.01 par value. Authorized 190,000,000 shares; 72,527,729 and
59,823,031 shares issued and outstanding at December 31, 2007 and 2006,respectively 725 598
Excess stock, $0.01 par value. Authorized 205,000,000 shares; none issued oroutstanding - -
Capital in excess of par value 1,175,364 873,885Retained earnings (accumulated dividends in excess of net earnings) 137,599 80,263Accumulated other comprehensive income 1,597 5,219
Total stockholders’ equity 1,407,285 1,096,505
$ 2,539,605 $ 1,917,497
See accompanying notes to consolidated financial statements.
50
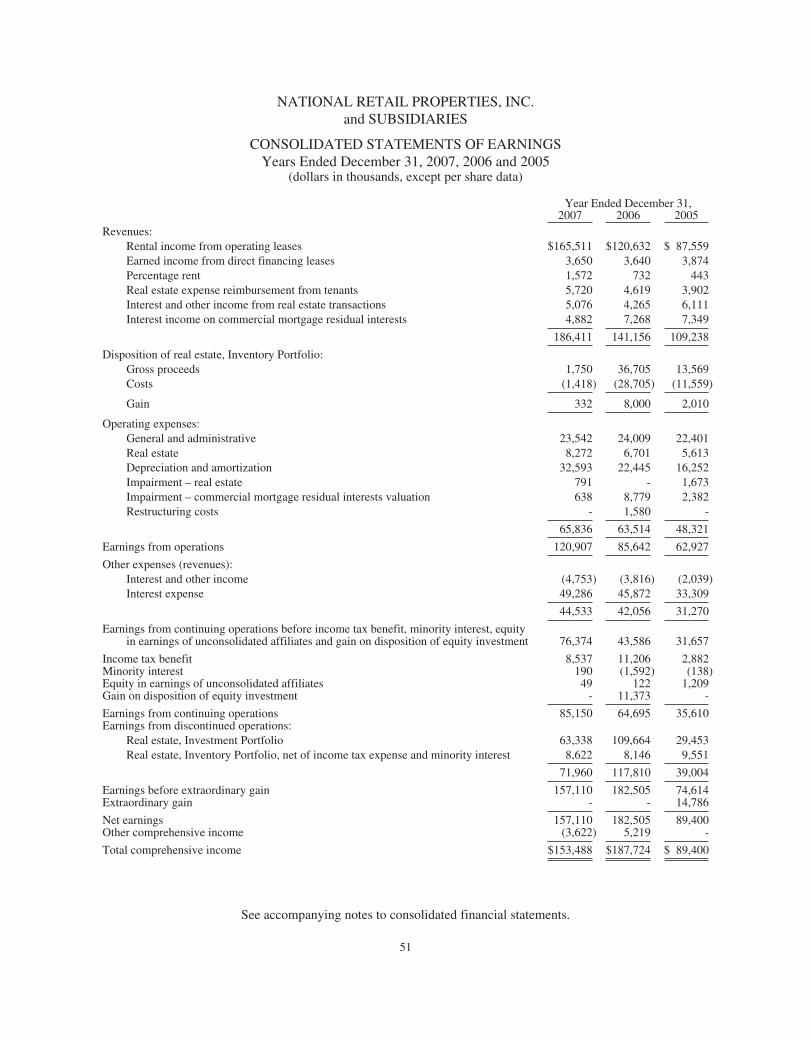
NATIONAL RETAIL PROPERTIES, INC.and SUBSIDIARIES
CONSOLIDATED STATEMENTS OF EARNINGSYears Ended December 31, 2007, 2006 and 2005
(dollars in thousands, except per share data)
Year Ended December 31,2007 2006 2005
Revenues:Rental income from operating leases $165,511 $120,632 $ 87,559Earned income from direct financing leases 3,650 3,640 3,874Percentage rent 1,572 732 443Real estate expense reimbursement from tenants 5,720 4,619 3,902Interest and other income from real estate transactions 5,076 4,265 6,111Interest income on commercial mortgage residual interests 4,882 7,268 7,349
186,411 141,156 109,238
Disposition of real estate, Inventory Portfolio:Gross proceeds 1,750 36,705 13,569Costs (1,418) (28,705) (11,559)
Gain 332 8,000 2,010
Operating expenses:General and administrative 23,542 24,009 22,401Real estate 8,272 6,701 5,613Depreciation and amortization 32,593 22,445 16,252Impairment – real estate 791 - 1,673Impairment – commercial mortgage residual interests valuation 638 8,779 2,382Restructuring costs - 1,580 -
65,836 63,514 48,321
Earnings from operations 120,907 85,642 62,927
Other expenses (revenues):Interest and other income (4,753) (3,816) (2,039)Interest expense 49,286 45,872 33,309
44,533 42,056 31,270
Earnings from continuing operations before income tax benefit, minority interest, equityin earnings of unconsolidated affiliates and gain on disposition of equity investment 76,374 43,586 31,657
Income tax benefit 8,537 11,206 2,882Minority interest 190 (1,592) (138)Equity in earnings of unconsolidated affiliates 49 122 1,209Gain on disposition of equity investment - 11,373 -
Earnings from continuing operations 85,150 64,695 35,610Earnings from discontinued operations:
Real estate, Investment Portfolio 63,338 109,664 29,453Real estate, Inventory Portfolio, net of income tax expense and minority interest 8,622 8,146 9,551
71,960 117,810 39,004
Earnings before extraordinary gain 157,110 182,505 74,614Extraordinary gain - - 14,786
Net earnings 157,110 182,505 89,400Other comprehensive income (3,622) 5,219 -
Total comprehensive income $153,488 $187,724 $ 89,400
See accompanying notes to consolidated financial statements.
51
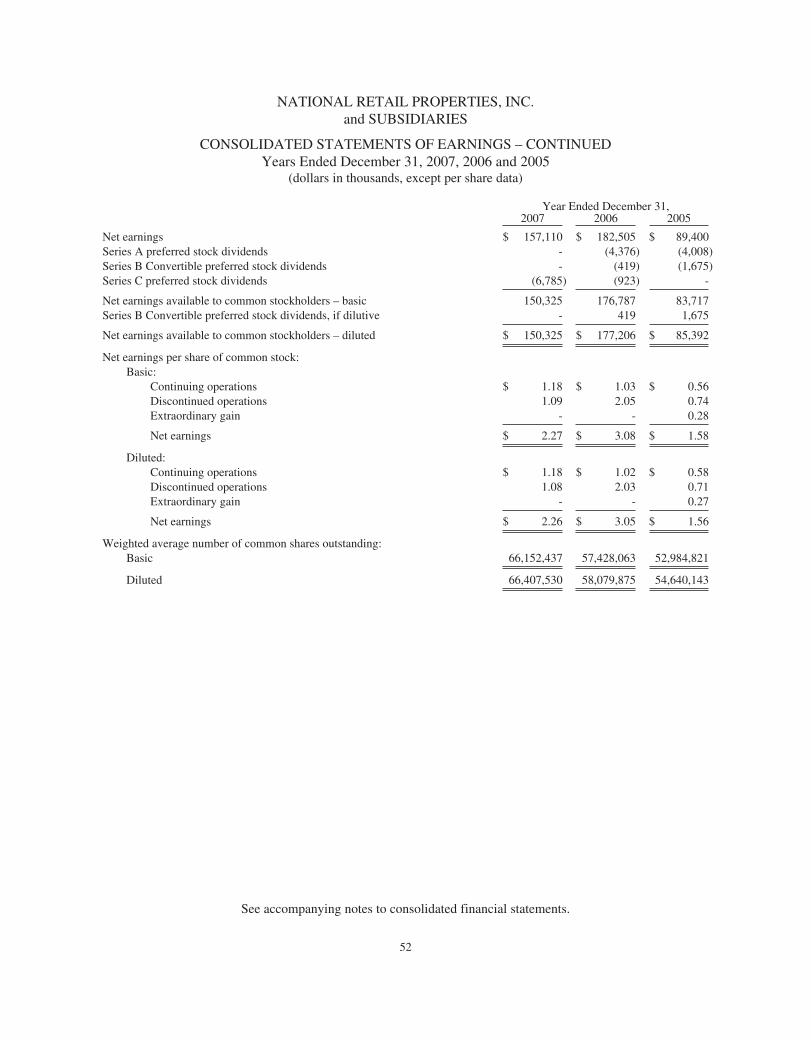
NATIONAL RETAIL PROPERTIES, INC.and SUBSIDIARIES
CONSOLIDATED STATEMENTS OF EARNINGS – CONTINUEDYears Ended December 31, 2007, 2006 and 2005
(dollars in thousands, except per share data)
Year Ended December 31,2007 2006 2005
Net earnings $ 157,110 $ 182,505 $ 89,400Series A preferred stock dividends - (4,376) (4,008)Series B Convertible preferred stock dividends - (419) (1,675)Series C preferred stock dividends (6,785) (923) -
Net earnings available to common stockholders – basic 150,325 176,787 83,717Series B Convertible preferred stock dividends, if dilutive - 419 1,675
Net earnings available to common stockholders – diluted $ 150,325 $ 177,206 $ 85,392
Net earnings per share of common stock:Basic:
Continuing operations $ 1.18 $ 1.03 $ 0.56Discontinued operations 1.09 2.05 0.74Extraordinary gain - - 0.28
Net earnings $ 2.27 $ 3.08 $ 1.58
Diluted:Continuing operations $ 1.18 $ 1.02 $ 0.58Discontinued operations 1.08 2.03 0.71Extraordinary gain - - 0.27
Net earnings $ 2.26 $ 3.05 $ 1.56
Weighted average number of common shares outstanding:Basic 66,152,437 57,428,063 52,984,821
Diluted 66,407,530 58,079,875 54,640,143
See accompanying notes to consolidated financial statements.
52
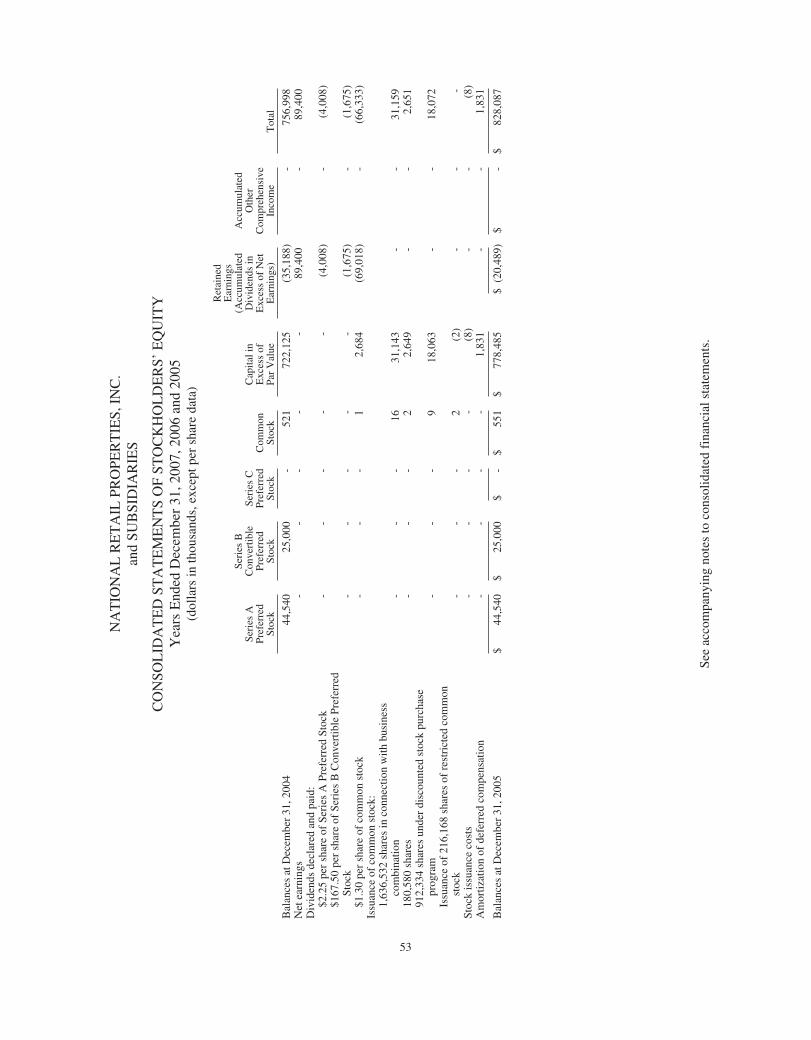
NA
TIO
NA
LR
ET
AIL
PRO
PER
TIE
S,IN
C.
and
SUB
SID
IAR
IES
CO
NSO
LID
AT
ED
STA
TE
ME
NT
SO
FST
OC
KH
OL
DE
RS’
EQ
UIT
YY
ears
End
edD
ecem
ber
31,2
007,
2006
and
2005
(dol
lars
inth
ousa
nds,
exce
ptpe
rsh
are
data
)
Seri
esA
Pref
erre
dSt
ock
Seri
esB
Con
vert
ible
Pref
erre
dSt
ock
Seri
esC
Pref
erre
dSt
ock
Com
mon
Stoc
k
Cap
itali
nE
xces
sof
Par
Val
ue
Ret
aine
dE
arni
ngs
(Acc
umul
ated
Div
iden
dsin
Exc
ess
ofN
etE
arni
ngs)
Acc
umul
ated
Oth
erC
ompr
ehen
sive
Inco
me
Tot
al
Bal
ance
sat
Dec
embe
r31
,200
444
,540
25,0
00-
521
722,
125
(35,
188)
-75
6,99
8N
etea
rnin
gs-
--
--
89,4
00-
89,4
00D
ivid
ends
decl
ared
and
paid
:$2
.25
per
shar
eof
Seri
esA
Pref
erre
dSt
ock
--
--
-(4
,008
)-
(4,0
08)
$167
.50
per
shar
eof
Seri
esB
Con
vert
ible
Pref
erre
dSt
ock
--
--
-(1
,675
)-
(1,6
75)
$1.3
0pe
rsh
are
ofco
mm
onst
ock
--
-1
2,68
4(6
9,01
8)-
(66,
333)
Issu
ance
ofco
mm
onst
ock:
1,63
6,53
2sh
ares
inco
nnec
tion
with
busi
ness
com
bina
tion
--
-16
31,1
43-
-31
,159
180,
580
shar
es-
--
22,
649
--
2,65
191
2,33
4sh
ares
unde
rdi
scou
nted
stoc
kpu
rcha
sepr
ogra
m-
--
918
,063
--
18,0
72Is
suan
ceof
216,
168
shar
esof
rest
rict
edco
mm
onst
ock
--
-2
(2)
--
-St
ock
issu
ance
cost
s-
--
-(8
)-
-(8
)A
mor
tizat
ion
ofde
ferr
edco
mpe
nsat
ion
--
--
1,83
1-
-1,
831
Bal
ance
sat
Dec
embe
r31
,200
5$
44,5
40$
25,0
00$
-$
551
$77
8,48
5$
(20,
489)
$-
$82
8,08
7
See
acco
mpa
nyin
gno
tes
toco
nsol
idat
edfi
nanc
ials
tate
men
ts.
53
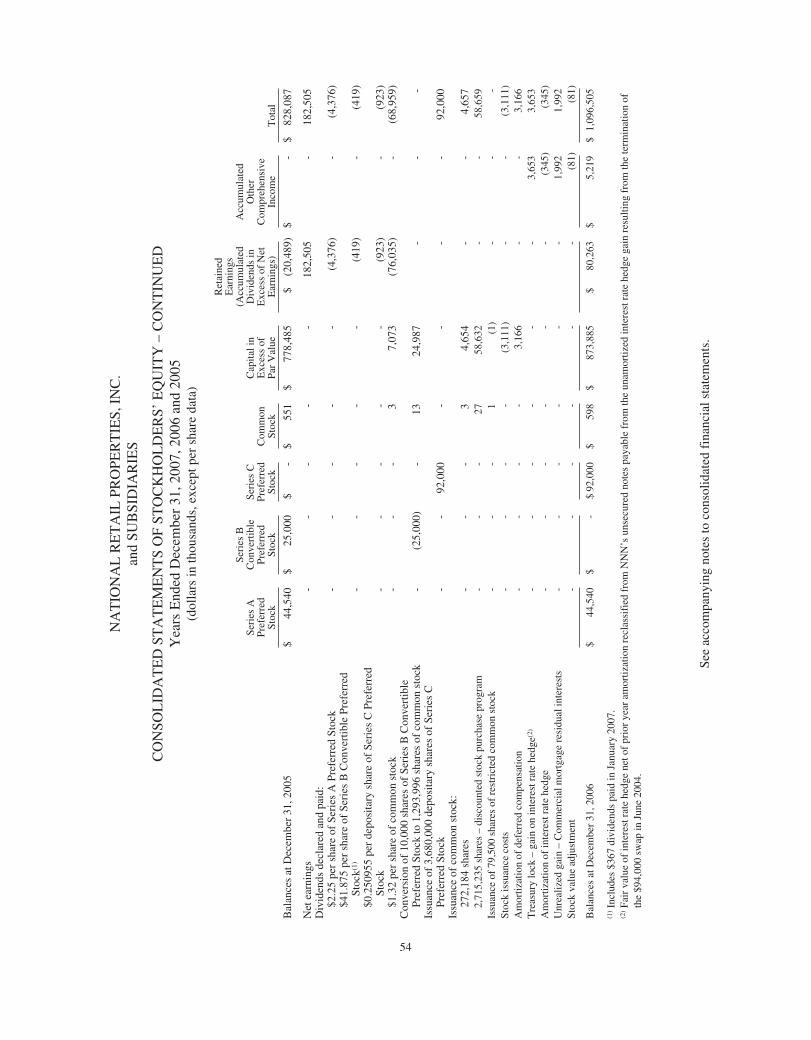
NA
TIO
NA
LR
ET
AIL
PRO
PER
TIE
S,IN
C.
and
SUB
SID
IAR
IES
CO
NSO
LID
AT
ED
STA
TE
ME
NT
SO
FST
OC
KH
OL
DE
RS’
EQ
UIT
Y–
CO
NT
INU
ED
Yea
rsE
nded
Dec
embe
r31
,200
7,20
06an
d20
05(d
olla
rsin
thou
sand
s,ex
cept
per
shar
eda
ta)
Seri
esA
Pref
erre
dSt
ock
Seri
esB
Con
vert
ible
Pref
erre
dSt
ock
Seri
esC
Pref
erre
dSt
ock
Com
mon
Stoc
k
Cap
itali
nE
xces
sof
Par
Val
ue
Ret
aine
dE
arni
ngs
(Acc
umul
ated
Div
iden
dsin
Exc
ess
ofN
etE
arni
ngs)
Acc
umul
ated
Oth
erC
ompr
ehen
sive
Inco
me
Tot
al
Bal
ance
sat
Dec
embe
r31
,200
5$
44,5
40$
25,0
00$
-$
551
$77
8,48
5$
(20,
489)
$-
$82
8,08
7
Net
earn
ings
--
--
-18
2,50
5-
182,
505
Div
iden
dsde
clar
edan
dpa
id:
$2.2
5pe
rsh
are
ofSe
ries
APr
efer
red
Stoc
k-
--
--
(4,3
76)
-(4
,376
)$4
1.87
5pe
rsh
are
ofSe
ries
BC
onve
rtib
lePr
efer
red
Stoc
k(1)
--
--
-(4
19)
-(4
19)
$0.2
5095
5pe
rde
posi
tary
shar
eof
Seri
esC
Pref
erre
dSt
ock
--
--
-(9
23)
-(9
23)
$1.3
2pe
rsh
are
ofco
mm
onst
ock
--
-3
7,07
3(7
6,03
5)-
(68,
959)
Con
vers
ion
of10
,000
shar
esof
Seri
esB
Con
vert
ible
Pref
erre
dSt
ock
to1,
293,
996
shar
esof
com
mon
stoc
k-
(25,
000)
-13
24,9
87-
--
Issu
ance
of3,
680,
000
depo
sita
rysh
ares
ofSe
ries
CPr
efer
red
Stoc
k-
-92
,000
--
--
92,0
00Is
suan
ceof
com
mon
stoc
k:27
2,18
4sh
ares
--
-3
4,65
4-
-4,
657
2,71
5,23
5sh
ares
–di
scou
nted
stoc
kpu
rcha
sepr
ogra
m-
--
2758
,632
--
58,6
59Is
suan
ceof
79,5
00sh
ares
ofre
stri
cted
com
mon
stoc
k-
--
1(1
)-
--
Stoc
kis
suan
ceco
sts
--
--
(3,1
11)
--
(3,1
11)
Am
ortiz
atio
nof
defe
rred
com
pens
atio
n-
--
-3,
166
--
3,16
6T
reas
ury
lock
–ga
inon
inte
rest
rate
hedg
e(2)
--
--
--
3,65
33,
653
Am
ortiz
atio
nof
inte
rest
rate
hedg
e-
--
--
-(3
45)
(345
)U
nrea
lized
gain
–C
omm
erci
alm
ortg
age
resi
dual
inte
rest
s-
--
--
-1,
992
1,99
2St
ock
valu
ead
just
men
t-
--
--
-(8
1)(8
1)
Bal
ance
sat
Dec
embe
r31
,200
6$
44,5
40$
-$
92,0
00$
598
$87
3,88
5$
80,2
63$
5,21
9$
1,09
6,50
5
(1)In
clud
es$3
67di
vide
nds
paid
inJa
nuar
y20
07.
(2)Fa
irva
lue
ofin
tere
stra
tehe
dge
neto
fpr
ior
year
amor
tizat
ion
recl
assi
fied
from
NN
N’s
unse
cure
dno
tes
paya
ble
from
the
unam
ortiz
edin
tere
stra
tehe
dge
gain
resu
lting
from
the
term
inat
ion
ofth
e$9
4,00
0sw
apin
June
2004
.
See
acco
mpa
nyin
gno
tes
toco
nsol
idat
edfi
nanc
ials
tate
men
ts.
54
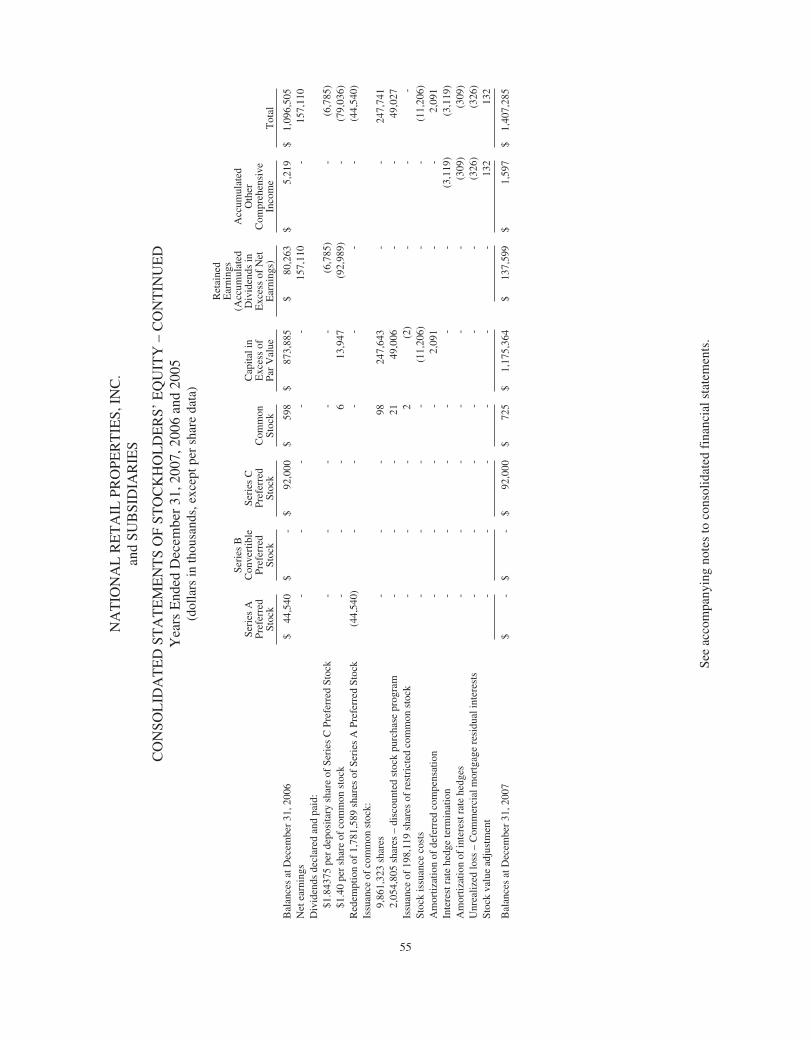
NA
TIO
NA
LR
ET
AIL
PRO
PER
TIE
S,IN
C.
and
SUB
SID
IAR
IES
CO
NSO
LID
AT
ED
STA
TE
ME
NT
SO
FST
OC
KH
OL
DE
RS’
EQ
UIT
Y–
CO
NT
INU
ED
Yea
rsE
nded
Dec
embe
r31
,200
7,20
06an
d20
05(d
olla
rsin
thou
sand
s,ex
cept
per
shar
eda
ta)
Seri
esA
Pref
erre
dSt
ock
Seri
esB
Con
vert
ible
Pref
erre
dSt
ock
Seri
esC
Pref
erre
dSt
ock
Com
mon
Stoc
k
Cap
itali
nE
xces
sof
Par
Val
ue
Ret
aine
dE
arni
ngs
(Acc
umul
ated
Div
iden
dsin
Exc
ess
ofN
etE
arni
ngs)
Acc
umul
ated
Oth
erC
ompr
ehen
sive
Inco
me
Tot
al
Bal
ance
sat
Dec
embe
r31
,200
6$
44,5
40$
-$
92,0
00$
598
$87
3,88
5$
80,2
63$
5,21
9$
1,09
6,50
5N
etea
rnin
gs-
--
--
157,
110
-15
7,11
0D
ivid
ends
decl
ared
and
paid
:$1
.843
75pe
rde
posi
tary
shar
eof
Seri
esC
Pref
erre
dSt
ock
--
--
-(6
,785
)-
(6,7
85)
$1.4
0pe
rsh
are
ofco
mm
onst
ock
--
-6
13,9
47(9
2,98
9)-
(79,
036)
Red
empt
ion
of1,
781,
589
shar
esof
Seri
esA
Pref
erre
dSt
ock
(44,
540)
--
--
--
(44,
540)
Issu
ance
ofco
mm
onst
ock:
9,86
1,32
3sh
ares
--
-98
247,
643
--
247,
741
2,05
4,80
5sh
ares
–di
scou
nted
stoc
kpu
rcha
sepr
ogra
m-
--
2149
,006
--
49,0
27Is
suan
ceof
198,
119
shar
esof
rest
rict
edco
mm
onst
ock
--
-2
(2)
--
-St
ock
issu
ance
cost
s-
--
-(1
1,20
6)-
-(1
1,20
6)A
mor
tizat
ion
ofde
ferr
edco
mpe
nsat
ion
--
--
2,09
1-
-2,
091
Inte
rest
rate
hedg
ete
rmin
atio
n-
--
--
-(3
,119
)(3
,119
)A
mor
tizat
ion
ofin
tere
stra
tehe
dges
--
--
--
(309
)(3
09)
Unr
ealiz
edlo
ss–
Com
mer
cial
mor
tgag
ere
sidu
alin
tere
sts
--
--
--
(326
)(3
26)
Stoc
kva
lue
adju
stm
ent
--
--
--
132
132
Bal
ance
sat
Dec
embe
r31
,200
7$
-$
-$
92,0
00$
725
$1,
175,
364
$13
7,59
9$
1,59
7$
1,40
7,28
5
See
acco
mpa
nyin
gno
tes
toco
nsol
idat
edfi
nanc
ials
tate
men
ts.
55
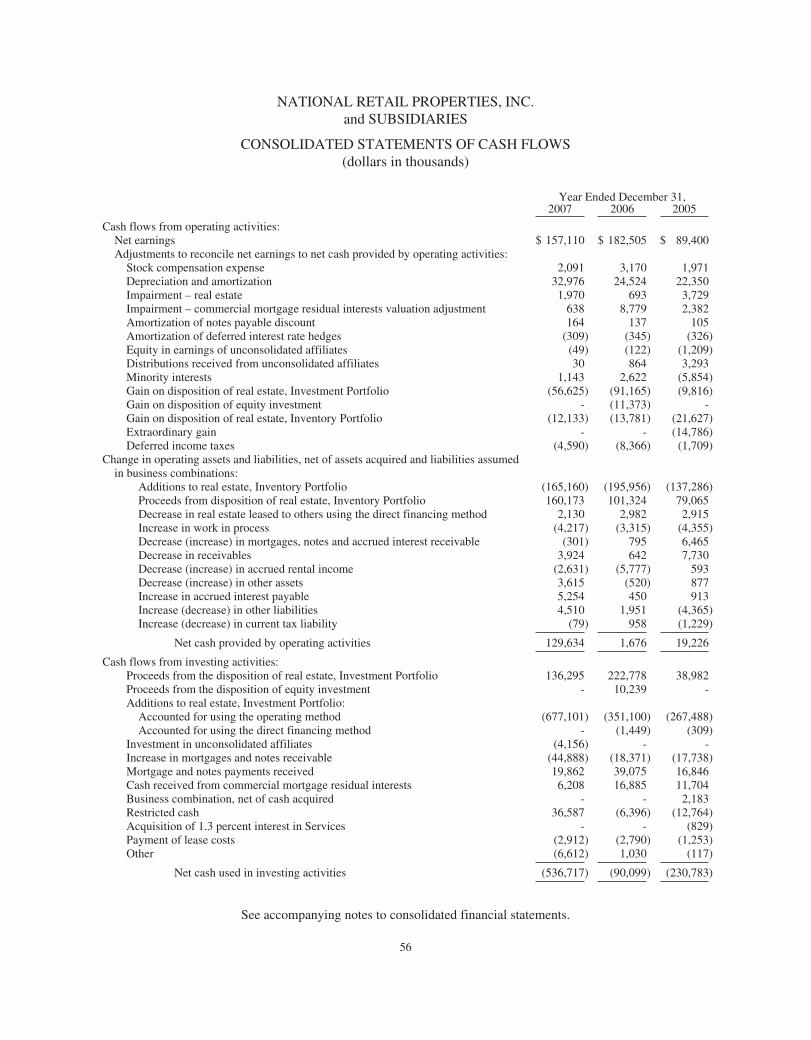
NATIONAL RETAIL PROPERTIES, INC.and SUBSIDIARIES
CONSOLIDATED STATEMENTS OF CASH FLOWS(dollars in thousands)
Year Ended December 31,2007 2006 2005
Cash flows from operating activities:Net earnings $ 157,110 $ 182,505 $ 89,400Adjustments to reconcile net earnings to net cash provided by operating activities:
Stock compensation expense 2,091 3,170 1,971Depreciation and amortization 32,976 24,524 22,350Impairment – real estate 1,970 693 3,729Impairment – commercial mortgage residual interests valuation adjustment 638 8,779 2,382Amortization of notes payable discount 164 137 105Amortization of deferred interest rate hedges (309) (345) (326)Equity in earnings of unconsolidated affiliates (49) (122) (1,209)Distributions received from unconsolidated affiliates 30 864 3,293Minority interests 1,143 2,622 (5,854)Gain on disposition of real estate, Investment Portfolio (56,625) (91,165) (9,816)Gain on disposition of equity investment - (11,373) -Gain on disposition of real estate, Inventory Portfolio (12,133) (13,781) (21,627)Extraordinary gain - - (14,786)Deferred income taxes (4,590) (8,366) (1,709)
Change in operating assets and liabilities, net of assets acquired and liabilities assumedin business combinations:
Additions to real estate, Inventory Portfolio (165,160) (195,956) (137,286)Proceeds from disposition of real estate, Inventory Portfolio 160,173 101,324 79,065Decrease in real estate leased to others using the direct financing method 2,130 2,982 2,915Increase in work in process (4,217) (3,315) (4,355)Decrease (increase) in mortgages, notes and accrued interest receivable (301) 795 6,465Decrease in receivables 3,924 642 7,730Decrease (increase) in accrued rental income (2,631) (5,777) 593Decrease (increase) in other assets 3,615 (520) 877Increase in accrued interest payable 5,254 450 913Increase (decrease) in other liabilities 4,510 1,951 (4,365)Increase (decrease) in current tax liability (79) 958 (1,229)
Net cash provided by operating activities 129,634 1,676 19,226
Cash flows from investing activities:Proceeds from the disposition of real estate, Investment Portfolio 136,295 222,778 38,982Proceeds from the disposition of equity investment - 10,239 -Additions to real estate, Investment Portfolio:
Accounted for using the operating method (677,101) (351,100) (267,488)Accounted for using the direct financing method - (1,449) (309)
Investment in unconsolidated affiliates (4,156) - -Increase in mortgages and notes receivable (44,888) (18,371) (17,738)Mortgage and notes payments received 19,862 39,075 16,846Cash received from commercial mortgage residual interests 6,208 16,885 11,704Business combination, net of cash acquired - - 2,183Restricted cash 36,587 (6,396) (12,764)Acquisition of 1.3 percent interest in Services - - (829)Payment of lease costs (2,912) (2,790) (1,253)Other (6,612) 1,030 (117)
Net cash used in investing activities (536,717) (90,099) (230,783)
See accompanying notes to consolidated financial statements.
56
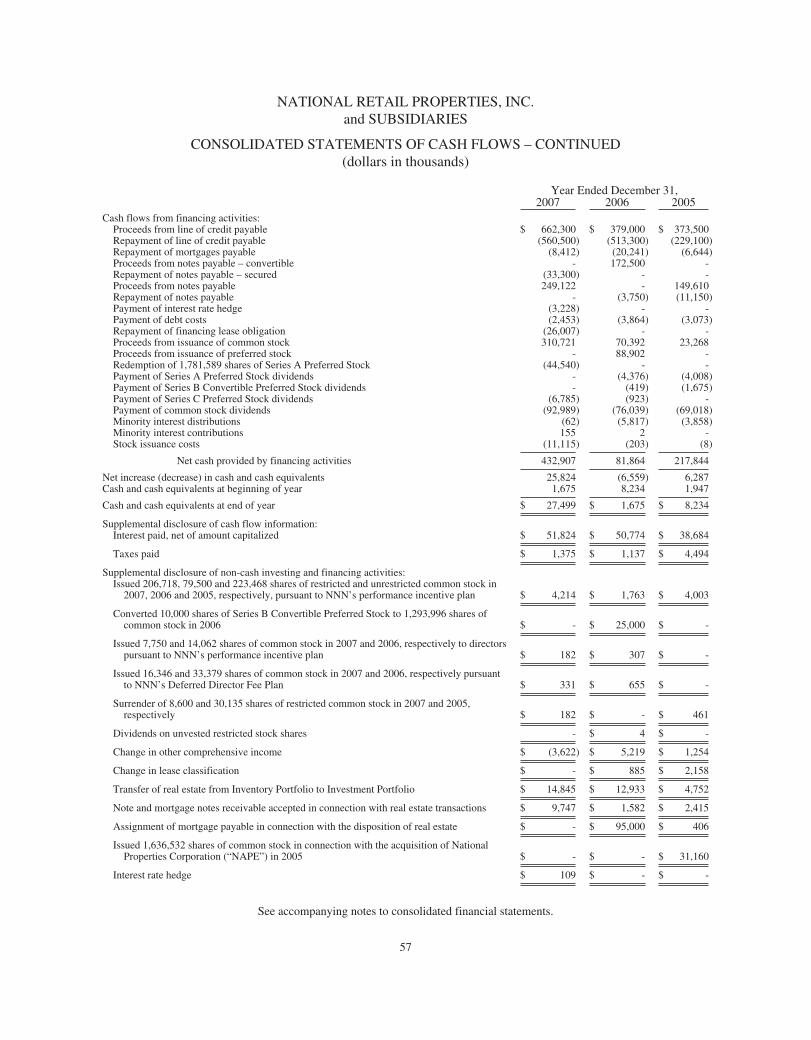
NATIONAL RETAIL PROPERTIES, INC.and SUBSIDIARIES
CONSOLIDATED STATEMENTS OF CASH FLOWS – CONTINUED(dollars in thousands)
Year Ended December 31,2007 2006 2005
Cash flows from financing activities:Proceeds from line of credit payable $ 662,300 $ 379,000 $ 373,500Repayment of line of credit payable (560,500) (513,300) (229,100)Repayment of mortgages payable (8,412) (20,241) (6,644)Proceeds from notes payable – convertible - 172,500 -Repayment of notes payable – secured (33,300) - -Proceeds from notes payable 249,122 - 149,610Repayment of notes payable - (3,750) (11,150)Payment of interest rate hedge (3,228) - -Payment of debt costs (2,453) (3,864) (3,073)Repayment of financing lease obligation (26,007) - -Proceeds from issuance of common stock 310,721 70,392 23,268Proceeds from issuance of preferred stock - 88,902 -Redemption of 1,781,589 shares of Series A Preferred Stock (44,540) - -Payment of Series A Preferred Stock dividends - (4,376) (4,008)Payment of Series B Convertible Preferred Stock dividends - (419) (1,675)Payment of Series C Preferred Stock dividends (6,785) (923) -Payment of common stock dividends (92,989) (76,039) (69,018)Minority interest distributions (62) (5,817) (3,858)Minority interest contributions 155 2 -Stock issuance costs (11,115) (203) (8)
Net cash provided by financing activities 432,907 81,864 217,844
Net increase (decrease) in cash and cash equivalents 25,824 (6,559) 6,287Cash and cash equivalents at beginning of year 1,675 8,234 1,947
Cash and cash equivalents at end of year $ 27,499 $ 1,675 $ 8,234
Supplemental disclosure of cash flow information:Interest paid, net of amount capitalized $ 51,824 $ 50,774 $ 38,684
Taxes paid $ 1,375 $ 1,137 $ 4,494
Supplemental disclosure of non-cash investing and financing activities:Issued 206,718, 79,500 and 223,468 shares of restricted and unrestricted common stock in
2007, 2006 and 2005, respectively, pursuant to NNN’s performance incentive plan $ 4,214 $ 1,763 $ 4,003
Converted 10,000 shares of Series B Convertible Preferred Stock to 1,293,996 shares ofcommon stock in 2006 $ - $ 25,000 $ -
Issued 7,750 and 14,062 shares of common stock in 2007 and 2006, respectively to directorspursuant to NNN’s performance incentive plan $ 182 $ 307 $ -
Issued 16,346 and 33,379 shares of common stock in 2007 and 2006, respectively pursuantto NNN’s Deferred Director Fee Plan $ 331 $ 655 $ -
Surrender of 8,600 and 30,135 shares of restricted common stock in 2007 and 2005,respectively $ 182 $ - $ 461
Dividends on unvested restricted stock shares - $ 4 $ -
Change in other comprehensive income $ (3,622) $ 5,219 $ 1,254
Change in lease classification $ - $ 885 $ 2,158
Transfer of real estate from Inventory Portfolio to Investment Portfolio $ 14,845 $ 12,933 $ 4,752
Note and mortgage notes receivable accepted in connection with real estate transactions $ 9,747 $ 1,582 $ 2,415
Assignment of mortgage payable in connection with the disposition of real estate $ - $ 95,000 $ 406
Issued 1,636,532 shares of common stock in connection with the acquisition of NationalProperties Corporation (“NAPE”) in 2005 $ - $ - $ 31,160
Interest rate hedge $ 109 $ - $ -
See accompanying notes to consolidated financial statements.
57
NATIONAL RETAIL PROPERTIES, INC.and SUBSIDIARIES
NOTES TO CONSOLIDATED FINANCIAL STATEMENTSYears Ended December 31, 2007, 2006 and 2005
Note 1 – Organization and Summary of Significant Accounting Policies:
Organization and Nature of Business – National Retail Properties, Inc. (formerly known asCommercial Net Lease Realty, Inc.), a Maryland corporation, is a fully integrated real estateinvestment trust (“REIT”) formed in 1984. The term “NNN” refers to National RetailProperties, Inc. and its majority owned and controlled subsidiaries. These subsidiaries includethe wholly owned subsidiaries of National Retail Properties, Inc., as well as the taxable REITsubsidiaries and their majority owned and controlled subsidiaries (collectively, the “TRS”).
NNN’s operations are divided into two primary business segments: (i) investment assets,including real estate assets, mortgages and notes receivable (including structured financeinvestments) on the consolidated balance sheets and commercial mortgage residual interests(collectively, “Investment Assets”), and (ii) inventory real estate assets (“Inventory Assets”).The Investment Assets are operated through National Retail Properties, Inc. and its whollyowned subsidiaries. NNN acquires, owns, invests in, manages and develops properties that areleased primarily to retail tenants under long-term net leases (“Investment Properties” or“Investment Portfolio”). As of December 31, 2007, NNN owned 908 Investment Properties,with an aggregate gross leasable area of 10,610,000 square feet, located in 44 states. In additionto the Investment Properties, as of December 31, 2007, NNN had $65,964,000 and $24,340,000in mortgages and notes receivables (including structured finance investments) and commercialmortgage residual interests, respectively. The Inventory Assets are operated through the TRS.The TRS, directly and indirectly, through investment interests, acquires and develops real estateprimarily for the purpose of selling the real estate (“Inventory Properties” or “InventoryPortfolio”). As of December 31, 2007, the TRS owned 56 Inventory Properties.
Principles of Consolidation – In January 2003, the Financial Accounting Standards Board(“FASB”) issued FASB Interpretation No. 46 (revised December 2003), “Consolidation ofVariable Interest Entities” (“FIN 46R”). This Interpretation of Accounting Research BulletinNo. 51, “Consolidated Financial Statements,” addresses consolidation by business enterprisesof variable interest entities.
NNN’s consolidated financial statements include the accounts of each of the respectivemajority owned and controlled affiliates. All significant intercompany account balances andtransactions have been eliminated. NNN applies the equity method of accounting toinvestments in partnerships and joint ventures that are not subject to control by NNN due to thesignificance of rights held by other parties.
58
The TRS develops real estate through various joint venture development affiliate agreements.NNN consolidates the joint venture development entities listed in the table below based uponeither NNN being the primary beneficiary of the respective variable interest entity or NNNhaving a controlling interest over the respective entity. NNN eliminates significantintercompany balances and transactions and records a minority interest for its other partners’ownership percentage. The following table summarizes each of the investments as ofDecember 31, 2007:
Date of Agreement Entity NameTRS’
Ownership %
November 2002 WG Grand Prairie TX, LLC 60%
February 2003 Gator Pearson, LLC 50%
February 2004 CNLRS Yosemite Park CO, LLC 50%
September 2004 CNLRS Bismarck ND, LLC 50%
December 2005 CNLRS P&P, L.P. 50%
February 2006 CNLRS BEP, L.P. 50%
February 2006 CNLRS Rockwall, L.P. 50%
September 2006 NNN Harrison Crossing, L.P. 50%
September 2006 CNLRS RGI Bonita Springs, LLC 50%
NNN no longer holds an interest in the collective partnership interest of CNL Plaza, Ltd. andCNL Plaza Venture, Ltd. (collectively, “Plaza”). In October 2006, NNN sold its equityinvestment for $10,239,000 (see Note 4).
In September 2007, NNN entered into a joint venture, NNN Retail Properties Fund I LLC (the“NNN Crow JVI”) with an affiliate of Crow Holdings Realty Partners IV, LP (see Note 4).
In May 2005, NNN (through a wholly owned subsidiary of the TRS) exercised its option topurchase 78.9 percent of the common shares of Orange Avenue Mortgage Investments, Inc.(“OAMI”). As a result, NNN has consolidated OAMI in its consolidated financial statements(see Note 22).
Real Estate – Investment Portfolio – NNN records the acquisition of real estate at cost,including acquisition and closing costs. The cost of properties developed by NNN includesdirect and indirect costs of construction, property taxes, interest and other miscellaneous costsincurred during the development period until the project is substantially complete and availablefor occupancy.
Purchase Accounting for Acquisition of Real Estate Subject to a Lease – For acquisitions ofreal estate subject to a lease subsequent to June 30, 2001, the effective date of Statement ofFinancial Accounting Standards (“SFAS”) No. 141, “Business Combinations” (“SFAS 141”),the fair value of the real estate acquired is allocated to the acquired tangible assets, consistingof land, building and tenant improvements, and identified intangible assets and liabilities,consisting of the value of above-market and below-market leases, value of in-place leases andvalue of tenant relationships, based in each case on their relative fair values.
The fair value of the tangible assets of an acquired leased property is determined by valuing theproperty as if it were vacant, and the “as-if-vacant” value is then allocated to land, building andtenant improvements based on the determination of the relative fair values of these assets. Theas-if-vacant fair value of a property is provided to management by a qualified appraiser.
59
In allocating the fair value of the identified intangible assets and liabilities of an acquiredproperty, above-market and below-market in-place lease values are recorded as other assets orliabilities based on the present value (using an interest rate which reflects the risks associatedwith the leases acquired) of the difference between (i) the contractual amounts to be paidpursuant to the in-place leases and (ii) management’s estimate of fair market lease rates for thecorresponding in-place leases, measured over a period equal to the remaining non-cancelableterm of the lease. The capitalized above-market lease values are amortized as a reduction ofrental income over the remaining non-cancelable terms of the respective leases. The capitalizedbelow-market lease values are amortized as an increase to rental income over the initial term.
The aggregate value of other acquired intangible assets, consisting of in-place leases, ismeasured by the excess of (i) the purchase price paid for a property after adjusting existingin-place leases to market rental rates over (ii) the estimated fair value of the propertyas-if-vacant, determined as set forth above. The value of in-place leases exclusive of the valueof above-market and below-market in-place leases is amortized to expense over the remainingnon-cancelable periods of the respective leases. If a lease were to be terminated prior to itsstated expiration, all unamortized amounts relating to that lease would be written off.
The value of tenant relationships is reviewed on individual transactions to determine if futurevalue was derived from the acquisition.
Real estate is generally leased to tenants on a net lease basis, whereby the tenant is responsiblefor all operating expenses relating to the property, including property taxes, insurance,maintenance and repairs. The leases are accounted for using either the operating or the directfinancing method. Such methods are described below:
Operating method – Leases accounted for using the operating method are recorded atthe cost of the real estate. Revenue is recognized as rentals are earned and expenses(including depreciation) are charged to operations as incurred. Buildings are depreciatedon the straight-line method over their estimated useful lives. Leasehold interests areamortized on the straight-line method over the terms of their respective leases. Whenscheduled rentals vary during the lease term, income is recognized on a straight-linebasis so as to produce a constant periodic rent over the term of the lease. Accrued rentalincome is the aggregate difference between the scheduled rents which vary during thelease term and the income recognized on a straight-line basis.
Direct financing method – Leases accounted for using the direct financing method arerecorded at their net investment (which at the inception of the lease generally representsthe cost of the property). Unearned income is deferred and amortized into income overthe lease terms so as to produce a constant periodic rate of return on NNN’s netinvestment in the leases.
Management periodically assesses its real estate for possible impairment whenever events orchanges in circumstances indicate that the carrying value of the asset, including accrued rentalincome, may not be recoverable through operations. Management determines whether animpairment in value has occurred by comparing the estimated future cash flows (undiscountedand without interest charges), including the residual value of the real estate, with the carryingcost of the individual asset. If an impairment is indicated, a loss will be recorded for the amountby which the carrying value of the asset exceeds its fair value.
60
Real Estate – Inventory Portfolio – The TRS acquires, develops and owns properties that itintends to sell. The properties that are classified as held for sale at any given time may consistof properties that have been acquired in the marketplace with the intent to sell and propertiesthat have been, or are currently being, constructed by the TRS. The TRS records the acquisitionof the real estate at cost, including the acquisition and closing costs. The cost of the real estatedeveloped by the TRS includes direct and indirect costs of construction, interest and othermiscellaneous costs incurred during the development period until the project is substantiallycomplete and available for occupancy. Real estate held for sale is not depreciated. Inaccordance with SFAS No. 144, “Accounting for the Impairment or Disposal of Long-LivedAssets,” the TRS classifies its real estate held for sale as discontinued operations for eachproperty in which rental revenues are generated (see Note 19).
Real Estate Dispositions – When real estate is disposed of, the related cost, accumulateddepreciation or amortization and any accrued rental income for operating leases and the netinvestment for direct financing leases are removed from the accounts and gains and losses fromthe dispositions are reflected in income. Gains from the disposition of real estate are generallyrecognized using the full accrual method in accordance with the provisions of SFAS No. 66“Accounting for Real Estate Sales,” provided that various criteria relating to the terms of thesale and any subsequent involvement by NNN with the real estate sold are met. Leasetermination fees are recognized when the related leases are cancelled and NNN no longer has acontinuing obligation to provide services to the former tenants.
Valuation of Mortgages, Notes and Accrued Interest – The allowance related to the mortgages,notes and accrued interest is NNN’s best estimate of the amount of probable credit losses. Theallowance is determined on an individual note basis in reviewing any payment past due for over90 days. Any outstanding amounts are written off against the allowance when all possiblemeans of collection have been exhausted.
Investment in Unconsolidated Affiliates – NNN accounts for each of its investments inunconsolidated affiliates under the equity method of accounting (see Note 4).
Commercial Mortgage Residual Interests, at Fair Value – Commercial mortgage residualinterests, classified as available for sale, are reported at their market values with unrealizedgains and losses reported as other comprehensive income in stockholders’ equity. Thecommercial mortgage residual interests were acquired in connection with the acquisition of78.9 percent equity interest of OAMI. NNN recognizes the excess of all cash flows attributableto the commercial mortgage residual interests estimated at the acquisition/transaction date overthe initial investment (the accretable yield) as interest income over the life of the beneficialinterest using the effective yield method. Losses are considered other than temporary valuationimpairments if and when there has been a change in the timing or amount of estimated cashflows, exclusive of changes in interest rates, that leads to a loss in value. Certain of thecommercial mortgage residual interests have been pledged as security for notes payable.
Cash and Cash Equivalents – NNN considers all highly liquid investments with a maturity ofthree months or less when purchased to be cash equivalents. Cash and cash equivalents consistof cash and money market accounts. Cash equivalents are stated at cost plus accrued interest,which approximates fair value.
61
Cash accounts maintained on behalf of NNN in demand deposits at commercial banks andmoney market funds may exceed federally insured levels; however, NNN has not experiencedany losses in such accounts. NNN limits investment of temporary cash investments to financialinstitutions with high credit standing; therefore, management believes it is not exposed to anysignificant credit risk on cash and cash equivalents.
Restricted Cash – Restricted cash consisted of amounts held in restricted accounts inconnection with the sale of certain assets of OAMI to a third party (the “Buyer”). As ofDecember 31, 2007, NNN has no cash held in restricted accounts. The amount held in theseaccounts at December 31, 2006 was $36,728,000. In December 2007, in accordance toagreements with the Buyer, the restrictions expired. NNN used a portion of the amountsreleased to repay the $10,500,000 OAMI secured note payable.
Valuation of Receivables – NNN estimates of the collectibility of its accounts receivablerelated to rents, expense reimbursements and other revenues. NNN analyzes accountsreceivable and historical bad debt levels, customer credit-worthiness and current economictrends when evaluating the adequacy of the allowance for doubtful accounts. In addition,tenants in bankruptcy are analyzed and estimates are made in connection with the expectedrecovery of pre-petition and post-petition claims.
Debt Costs – Debt costs incurred in connection with NNN’s $400,000,000 line of credit andmortgages payable have been deferred and are being amortized over the term of the respectiveloan commitment using the straight-line method, which approximates the effective interestmethod. Debt costs incurred in connection with the issuance of NNN’s notes payable have beendeferred and are being amortized over the term of the respective debt obligation using theeffective interest method.
Revenue Recognition – Rental revenues for non-development real estate assets are recognizedwhen earned in accordance with SFAS 13, “Accounting for Leases,” based on the terms of thelease at the time of acquisition of the leased asset. Rental revenues for properties underconstruction commence upon completion of construction of the leased asset and delivery of theleased asset to the tenant.
Earnings Per Share – Basic net earnings per share is computed by dividing net earningsavailable to common stockholders by the weighted average number of common sharesoutstanding during each period. Diluted net earnings per common share is computed bydividing net earnings available to common stockholders for the period by the number ofcommon shares that would have been outstanding assuming the issuance of common shares forall potentially dilutive common shares outstanding during the periods.
62
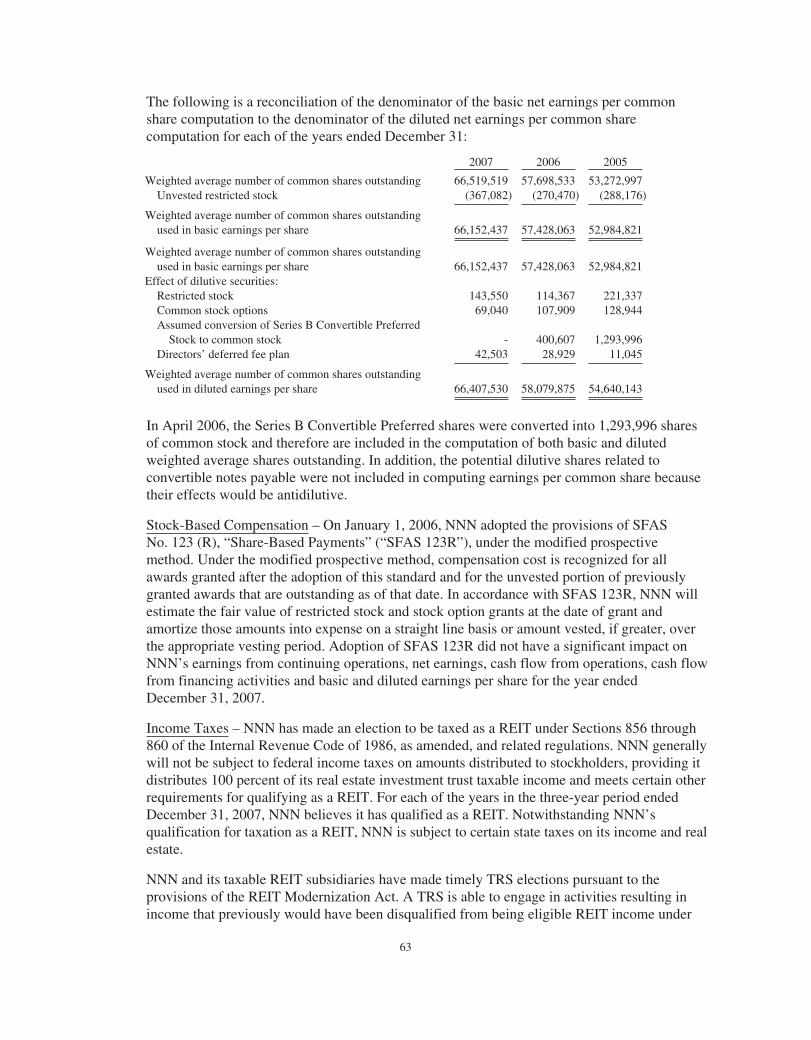
The following is a reconciliation of the denominator of the basic net earnings per commonshare computation to the denominator of the diluted net earnings per common sharecomputation for each of the years ended December 31:
2007 2006 2005
Weighted average number of common shares outstanding 66,519,519 57,698,533 53,272,997Unvested restricted stock (367,082) (270,470) (288,176)
Weighted average number of common shares outstandingused in basic earnings per share 66,152,437 57,428,063 52,984,821
Weighted average number of common shares outstandingused in basic earnings per share 66,152,437 57,428,063 52,984,821
Effect of dilutive securities:Restricted stock 143,550 114,367 221,337Common stock options 69,040 107,909 128,944Assumed conversion of Series B Convertible Preferred
Stock to common stock - 400,607 1,293,996Directors’ deferred fee plan 42,503 28,929 11,045
Weighted average number of common shares outstandingused in diluted earnings per share 66,407,530 58,079,875 54,640,143
In April 2006, the Series B Convertible Preferred shares were converted into 1,293,996 sharesof common stock and therefore are included in the computation of both basic and dilutedweighted average shares outstanding. In addition, the potential dilutive shares related toconvertible notes payable were not included in computing earnings per common share becausetheir effects would be antidilutive.
Stock-Based Compensation – On January 1, 2006, NNN adopted the provisions of SFASNo. 123 (R), “Share-Based Payments” (“SFAS 123R”), under the modified prospectivemethod. Under the modified prospective method, compensation cost is recognized for allawards granted after the adoption of this standard and for the unvested portion of previouslygranted awards that are outstanding as of that date. In accordance with SFAS 123R, NNN willestimate the fair value of restricted stock and stock option grants at the date of grant andamortize those amounts into expense on a straight line basis or amount vested, if greater, overthe appropriate vesting period. Adoption of SFAS 123R did not have a significant impact onNNN’s earnings from continuing operations, net earnings, cash flow from operations, cash flowfrom financing activities and basic and diluted earnings per share for the year endedDecember 31, 2007.
Income Taxes – NNN has made an election to be taxed as a REIT under Sections 856 through860 of the Internal Revenue Code of 1986, as amended, and related regulations. NNN generallywill not be subject to federal income taxes on amounts distributed to stockholders, providing itdistributes 100 percent of its real estate investment trust taxable income and meets certain otherrequirements for qualifying as a REIT. For each of the years in the three-year period endedDecember 31, 2007, NNN believes it has qualified as a REIT. Notwithstanding NNN’squalification for taxation as a REIT, NNN is subject to certain state taxes on its income and realestate.
NNN and its taxable REIT subsidiaries have made timely TRS elections pursuant to theprovisions of the REIT Modernization Act. A TRS is able to engage in activities resulting inincome that previously would have been disqualified from being eligible REIT income under
63
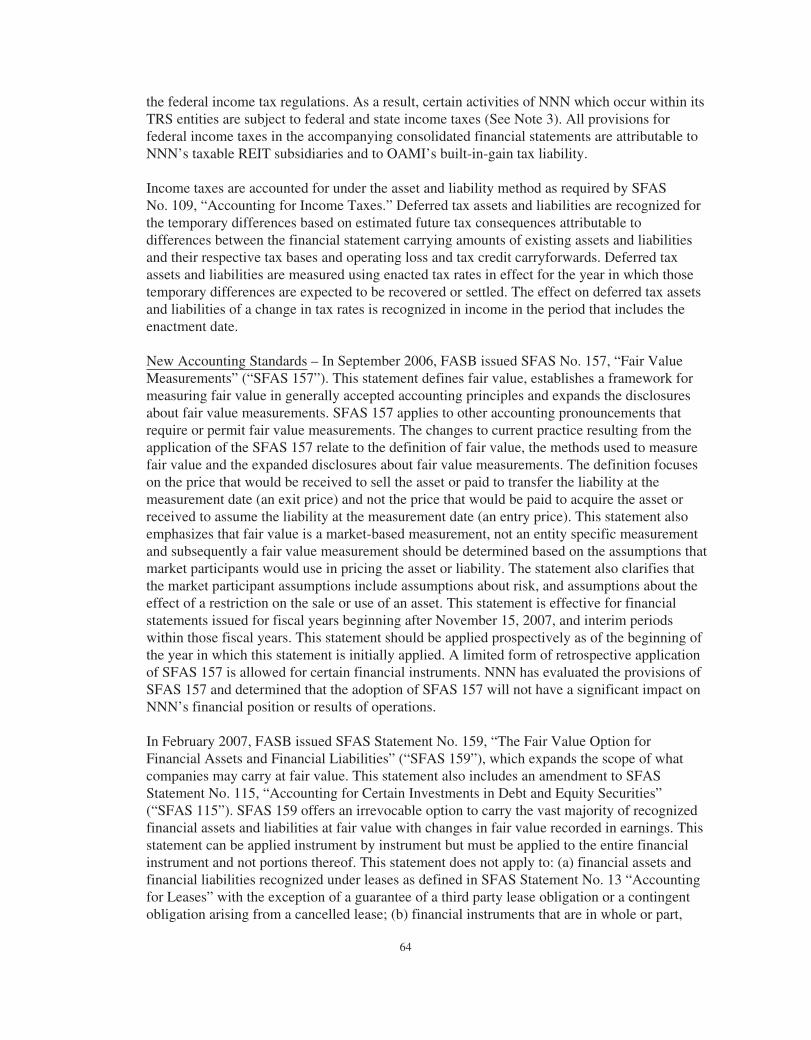
the federal income tax regulations. As a result, certain activities of NNN which occur within itsTRS entities are subject to federal and state income taxes (See Note 3). All provisions forfederal income taxes in the accompanying consolidated financial statements are attributable toNNN’s taxable REIT subsidiaries and to OAMI’s built-in-gain tax liability.
Income taxes are accounted for under the asset and liability method as required by SFASNo. 109, “Accounting for Income Taxes.” Deferred tax assets and liabilities are recognized forthe temporary differences based on estimated future tax consequences attributable todifferences between the financial statement carrying amounts of existing assets and liabilitiesand their respective tax bases and operating loss and tax credit carryforwards. Deferred taxassets and liabilities are measured using enacted tax rates in effect for the year in which thosetemporary differences are expected to be recovered or settled. The effect on deferred tax assetsand liabilities of a change in tax rates is recognized in income in the period that includes theenactment date.
New Accounting Standards – In September 2006, FASB issued SFAS No. 157, “Fair ValueMeasurements” (“SFAS 157”). This statement defines fair value, establishes a framework formeasuring fair value in generally accepted accounting principles and expands the disclosuresabout fair value measurements. SFAS 157 applies to other accounting pronouncements thatrequire or permit fair value measurements. The changes to current practice resulting from theapplication of the SFAS 157 relate to the definition of fair value, the methods used to measurefair value and the expanded disclosures about fair value measurements. The definition focuseson the price that would be received to sell the asset or paid to transfer the liability at themeasurement date (an exit price) and not the price that would be paid to acquire the asset orreceived to assume the liability at the measurement date (an entry price). This statement alsoemphasizes that fair value is a market-based measurement, not an entity specific measurementand subsequently a fair value measurement should be determined based on the assumptions thatmarket participants would use in pricing the asset or liability. The statement also clarifies thatthe market participant assumptions include assumptions about risk, and assumptions about theeffect of a restriction on the sale or use of an asset. This statement is effective for financialstatements issued for fiscal years beginning after November 15, 2007, and interim periodswithin those fiscal years. This statement should be applied prospectively as of the beginning ofthe year in which this statement is initially applied. A limited form of retrospective applicationof SFAS 157 is allowed for certain financial instruments. NNN has evaluated the provisions ofSFAS 157 and determined that the adoption of SFAS 157 will not have a significant impact onNNN’s financial position or results of operations.
In February 2007, FASB issued SFAS Statement No. 159, “The Fair Value Option forFinancial Assets and Financial Liabilities” (“SFAS 159”), which expands the scope of whatcompanies may carry at fair value. This statement also includes an amendment to SFASStatement No. 115, “Accounting for Certain Investments in Debt and Equity Securities”(“SFAS 115”). SFAS 159 offers an irrevocable option to carry the vast majority of recognizedfinancial assets and liabilities at fair value with changes in fair value recorded in earnings. Thisstatement can be applied instrument by instrument but must be applied to the entire financialinstrument and not portions thereof. This statement does not apply to: (a) financial assets andfinancial liabilities recognized under leases as defined in SFAS Statement No. 13 “Accountingfor Leases” with the exception of a guarantee of a third party lease obligation or a contingentobligation arising from a cancelled lease; (b) financial instruments that are in whole or part,
64
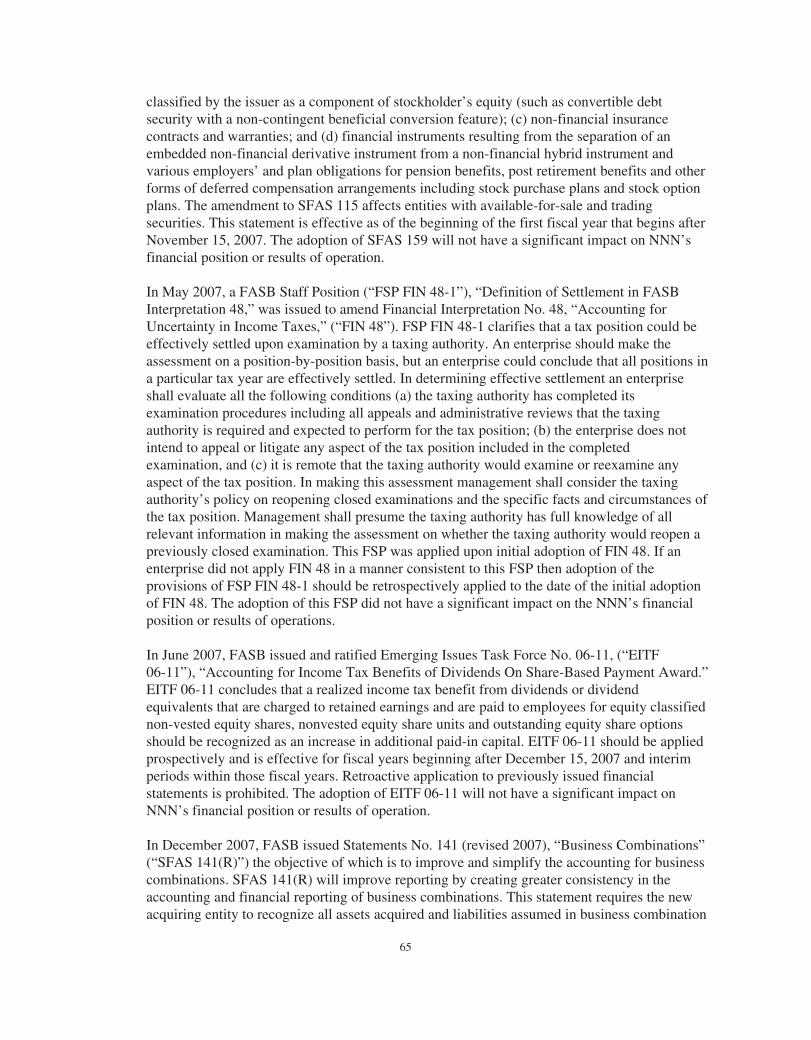
classified by the issuer as a component of stockholder’s equity (such as convertible debtsecurity with a non-contingent beneficial conversion feature); (c) non-financial insurancecontracts and warranties; and (d) financial instruments resulting from the separation of anembedded non-financial derivative instrument from a non-financial hybrid instrument andvarious employers’ and plan obligations for pension benefits, post retirement benefits and otherforms of deferred compensation arrangements including stock purchase plans and stock optionplans. The amendment to SFAS 115 affects entities with available-for-sale and tradingsecurities. This statement is effective as of the beginning of the first fiscal year that begins afterNovember 15, 2007. The adoption of SFAS 159 will not have a significant impact on NNN’sfinancial position or results of operation.
In May 2007, a FASB Staff Position (“FSP FIN 48-1”), “Definition of Settlement in FASBInterpretation 48,” was issued to amend Financial Interpretation No. 48, “Accounting forUncertainty in Income Taxes,” (“FIN 48”). FSP FIN 48-1 clarifies that a tax position could beeffectively settled upon examination by a taxing authority. An enterprise should make theassessment on a position-by-position basis, but an enterprise could conclude that all positions ina particular tax year are effectively settled. In determining effective settlement an enterpriseshall evaluate all the following conditions (a) the taxing authority has completed itsexamination procedures including all appeals and administrative reviews that the taxingauthority is required and expected to perform for the tax position; (b) the enterprise does notintend to appeal or litigate any aspect of the tax position included in the completedexamination, and (c) it is remote that the taxing authority would examine or reexamine anyaspect of the tax position. In making this assessment management shall consider the taxingauthority’s policy on reopening closed examinations and the specific facts and circumstances ofthe tax position. Management shall presume the taxing authority has full knowledge of allrelevant information in making the assessment on whether the taxing authority would reopen apreviously closed examination. This FSP was applied upon initial adoption of FIN 48. If anenterprise did not apply FIN 48 in a manner consistent to this FSP then adoption of theprovisions of FSP FIN 48-1 should be retrospectively applied to the date of the initial adoptionof FIN 48. The adoption of this FSP did not have a significant impact on the NNN’s financialposition or results of operations.
In June 2007, FASB issued and ratified Emerging Issues Task Force No. 06-11, (“EITF06-11”), “Accounting for Income Tax Benefits of Dividends On Share-Based Payment Award.”EITF 06-11 concludes that a realized income tax benefit from dividends or dividendequivalents that are charged to retained earnings and are paid to employees for equity classifiednon-vested equity shares, nonvested equity share units and outstanding equity share optionsshould be recognized as an increase in additional paid-in capital. EITF 06-11 should be appliedprospectively and is effective for fiscal years beginning after December 15, 2007 and interimperiods within those fiscal years. Retroactive application to previously issued financialstatements is prohibited. The adoption of EITF 06-11 will not have a significant impact onNNN’s financial position or results of operation.
In December 2007, FASB issued Statements No. 141 (revised 2007), “Business Combinations”(“SFAS 141(R)”) the objective of which is to improve and simplify the accounting for businesscombinations. SFAS 141(R) will improve reporting by creating greater consistency in theaccounting and financial reporting of business combinations. This statement requires the newacquiring entity to recognize all assets acquired and liabilities assumed in business combination
65
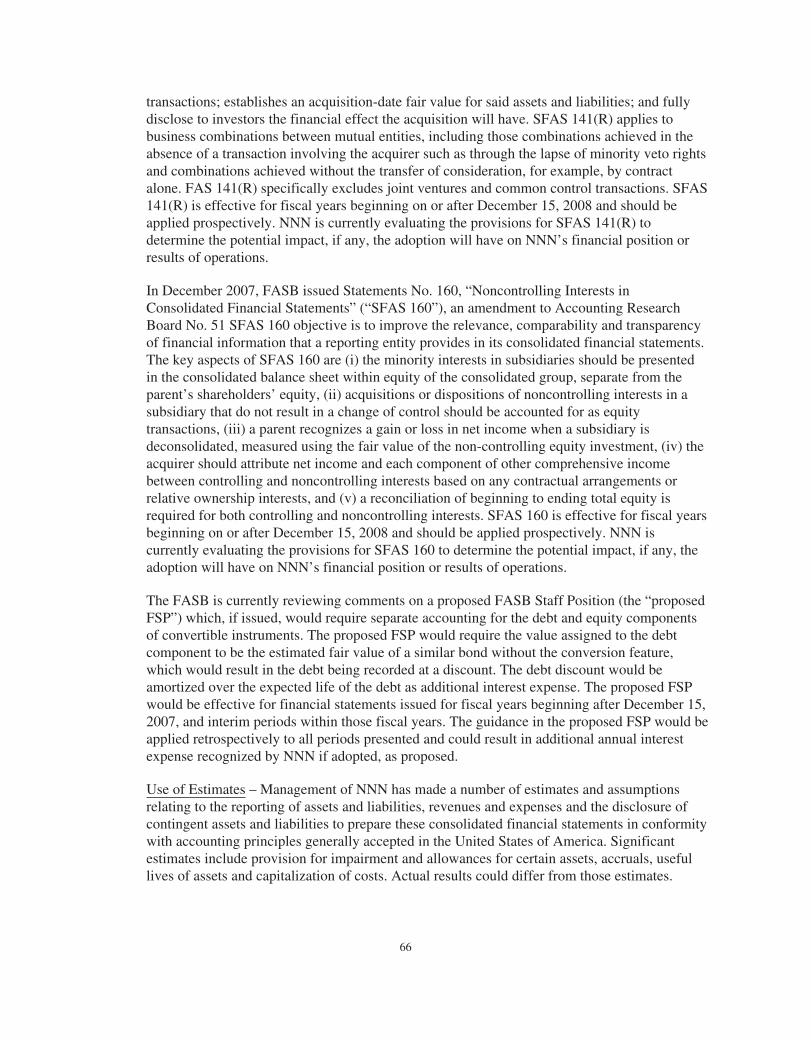
transactions; establishes an acquisition-date fair value for said assets and liabilities; and fullydisclose to investors the financial effect the acquisition will have. SFAS 141(R) applies tobusiness combinations between mutual entities, including those combinations achieved in theabsence of a transaction involving the acquirer such as through the lapse of minority veto rightsand combinations achieved without the transfer of consideration, for example, by contractalone. FAS 141(R) specifically excludes joint ventures and common control transactions. SFAS141(R) is effective for fiscal years beginning on or after December 15, 2008 and should beapplied prospectively. NNN is currently evaluating the provisions for SFAS 141(R) todetermine the potential impact, if any, the adoption will have on NNN’s financial position orresults of operations.
In December 2007, FASB issued Statements No. 160, “Noncontrolling Interests inConsolidated Financial Statements” (“SFAS 160”), an amendment to Accounting ResearchBoard No. 51 SFAS 160 objective is to improve the relevance, comparability and transparencyof financial information that a reporting entity provides in its consolidated financial statements.The key aspects of SFAS 160 are (i) the minority interests in subsidiaries should be presentedin the consolidated balance sheet within equity of the consolidated group, separate from theparent’s shareholders’ equity, (ii) acquisitions or dispositions of noncontrolling interests in asubsidiary that do not result in a change of control should be accounted for as equitytransactions, (iii) a parent recognizes a gain or loss in net income when a subsidiary isdeconsolidated, measured using the fair value of the non-controlling equity investment, (iv) theacquirer should attribute net income and each component of other comprehensive incomebetween controlling and noncontrolling interests based on any contractual arrangements orrelative ownership interests, and (v) a reconciliation of beginning to ending total equity isrequired for both controlling and noncontrolling interests. SFAS 160 is effective for fiscal yearsbeginning on or after December 15, 2008 and should be applied prospectively. NNN iscurrently evaluating the provisions for SFAS 160 to determine the potential impact, if any, theadoption will have on NNN’s financial position or results of operations.
The FASB is currently reviewing comments on a proposed FASB Staff Position (the “proposedFSP”) which, if issued, would require separate accounting for the debt and equity componentsof convertible instruments. The proposed FSP would require the value assigned to the debtcomponent to be the estimated fair value of a similar bond without the conversion feature,which would result in the debt being recorded at a discount. The debt discount would beamortized over the expected life of the debt as additional interest expense. The proposed FSPwould be effective for financial statements issued for fiscal years beginning after December 15,2007, and interim periods within those fiscal years. The guidance in the proposed FSP would beapplied retrospectively to all periods presented and could result in additional annual interestexpense recognized by NNN if adopted, as proposed.
Use of Estimates – Management of NNN has made a number of estimates and assumptionsrelating to the reporting of assets and liabilities, revenues and expenses and the disclosure ofcontingent assets and liabilities to prepare these consolidated financial statements in conformitywith accounting principles generally accepted in the United States of America. Significantestimates include provision for impairment and allowances for certain assets, accruals, usefullives of assets and capitalization of costs. Actual results could differ from those estimates.
66
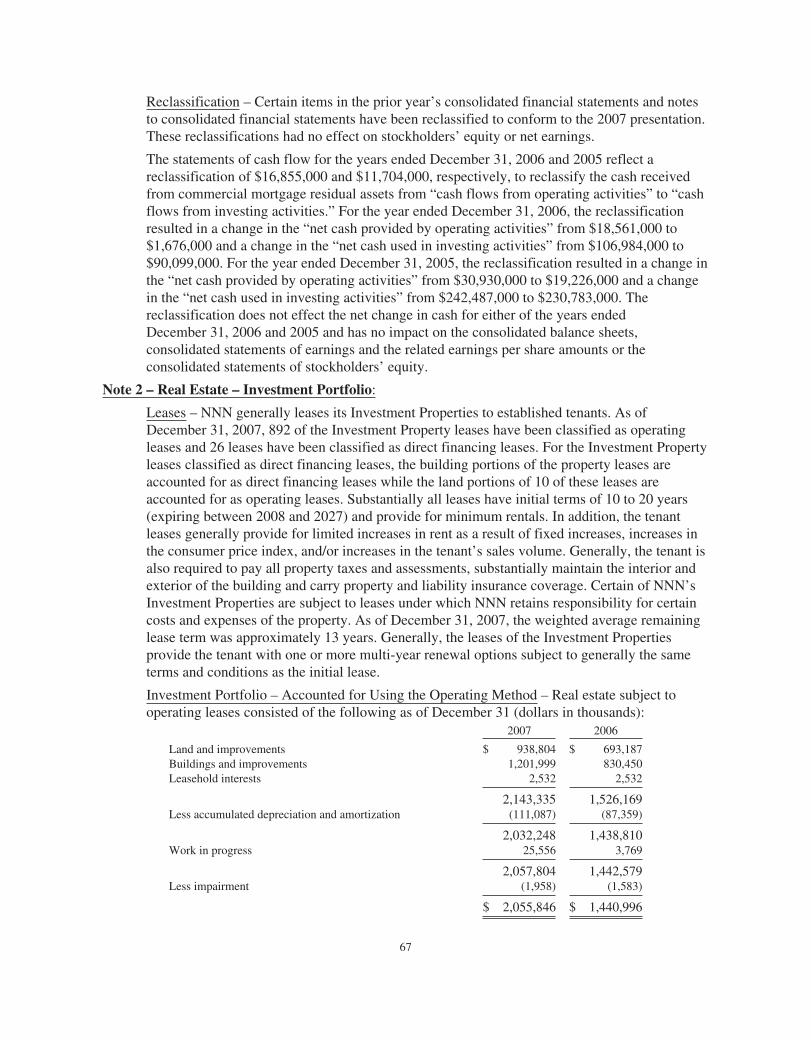
Reclassification – Certain items in the prior year’s consolidated financial statements and notesto consolidated financial statements have been reclassified to conform to the 2007 presentation.These reclassifications had no effect on stockholders’ equity or net earnings.
The statements of cash flow for the years ended December 31, 2006 and 2005 reflect areclassification of $16,855,000 and $11,704,000, respectively, to reclassify the cash receivedfrom commercial mortgage residual assets from “cash flows from operating activities” to “cashflows from investing activities.” For the year ended December 31, 2006, the reclassificationresulted in a change in the “net cash provided by operating activities” from $18,561,000 to$1,676,000 and a change in the “net cash used in investing activities” from $106,984,000 to$90,099,000. For the year ended December 31, 2005, the reclassification resulted in a change inthe “net cash provided by operating activities” from $30,930,000 to $19,226,000 and a changein the “net cash used in investing activities” from $242,487,000 to $230,783,000. Thereclassification does not effect the net change in cash for either of the years endedDecember 31, 2006 and 2005 and has no impact on the consolidated balance sheets,consolidated statements of earnings and the related earnings per share amounts or theconsolidated statements of stockholders’ equity.
Note 2 – Real Estate – Investment Portfolio:
Leases – NNN generally leases its Investment Properties to established tenants. As ofDecember 31, 2007, 892 of the Investment Property leases have been classified as operatingleases and 26 leases have been classified as direct financing leases. For the Investment Propertyleases classified as direct financing leases, the building portions of the property leases areaccounted for as direct financing leases while the land portions of 10 of these leases areaccounted for as operating leases. Substantially all leases have initial terms of 10 to 20 years(expiring between 2008 and 2027) and provide for minimum rentals. In addition, the tenantleases generally provide for limited increases in rent as a result of fixed increases, increases inthe consumer price index, and/or increases in the tenant’s sales volume. Generally, the tenant isalso required to pay all property taxes and assessments, substantially maintain the interior andexterior of the building and carry property and liability insurance coverage. Certain of NNN’sInvestment Properties are subject to leases under which NNN retains responsibility for certaincosts and expenses of the property. As of December 31, 2007, the weighted average remaininglease term was approximately 13 years. Generally, the leases of the Investment Propertiesprovide the tenant with one or more multi-year renewal options subject to generally the sameterms and conditions as the initial lease.
Investment Portfolio – Accounted for Using the Operating Method – Real estate subject tooperating leases consisted of the following as of December 31 (dollars in thousands):
2007 2006
Land and improvements $ 938,804 $ 693,187Buildings and improvements 1,201,999 830,450Leasehold interests 2,532 2,532
2,143,335 1,526,169Less accumulated depreciation and amortization (111,087) (87,359)
2,032,248 1,438,810Work in progress 25,556 3,769
2,057,804 1,442,579Less impairment (1,958) (1,583)
$ 2,055,846 $ 1,440,996
67
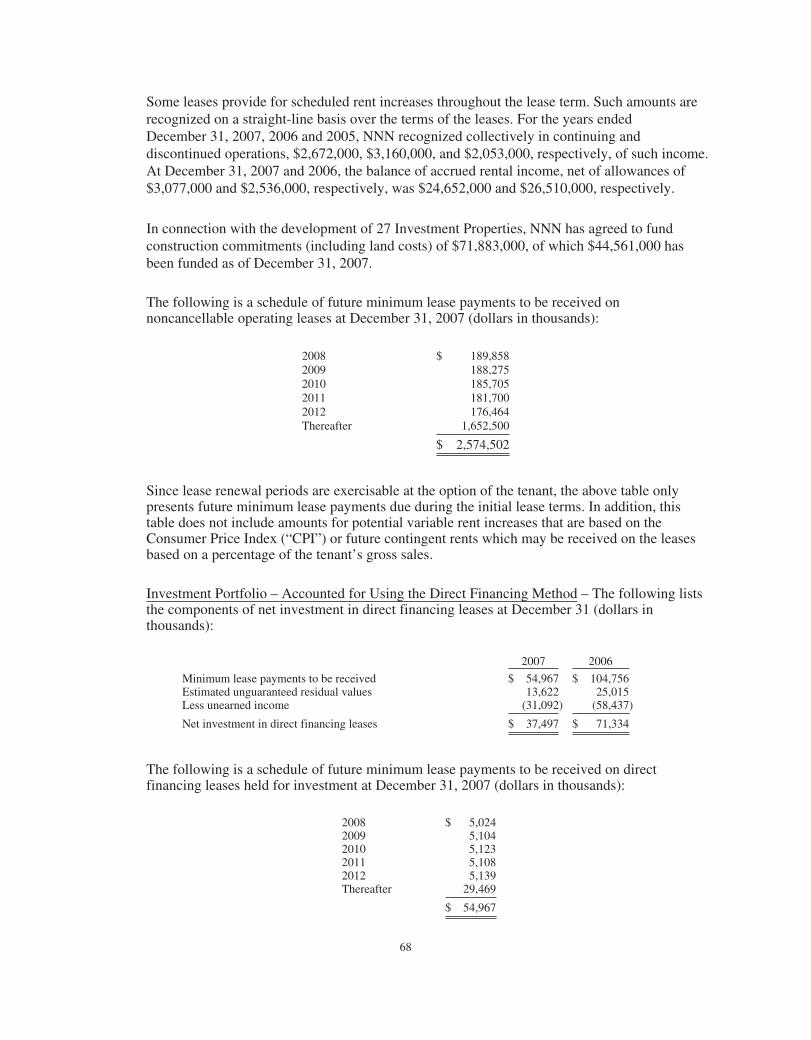
Some leases provide for scheduled rent increases throughout the lease term. Such amounts arerecognized on a straight-line basis over the terms of the leases. For the years endedDecember 31, 2007, 2006 and 2005, NNN recognized collectively in continuing anddiscontinued operations, $2,672,000, $3,160,000, and $2,053,000, respectively, of such income.At December 31, 2007 and 2006, the balance of accrued rental income, net of allowances of$3,077,000 and $2,536,000, respectively, was $24,652,000 and $26,510,000, respectively.
In connection with the development of 27 Investment Properties, NNN has agreed to fundconstruction commitments (including land costs) of $71,883,000, of which $44,561,000 hasbeen funded as of December 31, 2007.
The following is a schedule of future minimum lease payments to be received onnoncancellable operating leases at December 31, 2007 (dollars in thousands):
2008 $ 189,8582009 188,2752010 185,7052011 181,7002012 176,464Thereafter 1,652,500
$ 2,574,502
Since lease renewal periods are exercisable at the option of the tenant, the above table onlypresents future minimum lease payments due during the initial lease terms. In addition, thistable does not include amounts for potential variable rent increases that are based on theConsumer Price Index (“CPI”) or future contingent rents which may be received on the leasesbased on a percentage of the tenant’s gross sales.
Investment Portfolio – Accounted for Using the Direct Financing Method – The following liststhe components of net investment in direct financing leases at December 31 (dollars inthousands):
2007 2006
Minimum lease payments to be received $ 54,967 $ 104,756Estimated unguaranteed residual values 13,622 25,015Less unearned income (31,092) (58,437)
Net investment in direct financing leases $ 37,497 $ 71,334
The following is a schedule of future minimum lease payments to be received on directfinancing leases held for investment at December 31, 2007 (dollars in thousands):
2008 $ 5,0242009 5,1042010 5,1232011 5,1082012 5,139Thereafter 29,469
$ 54,967
68
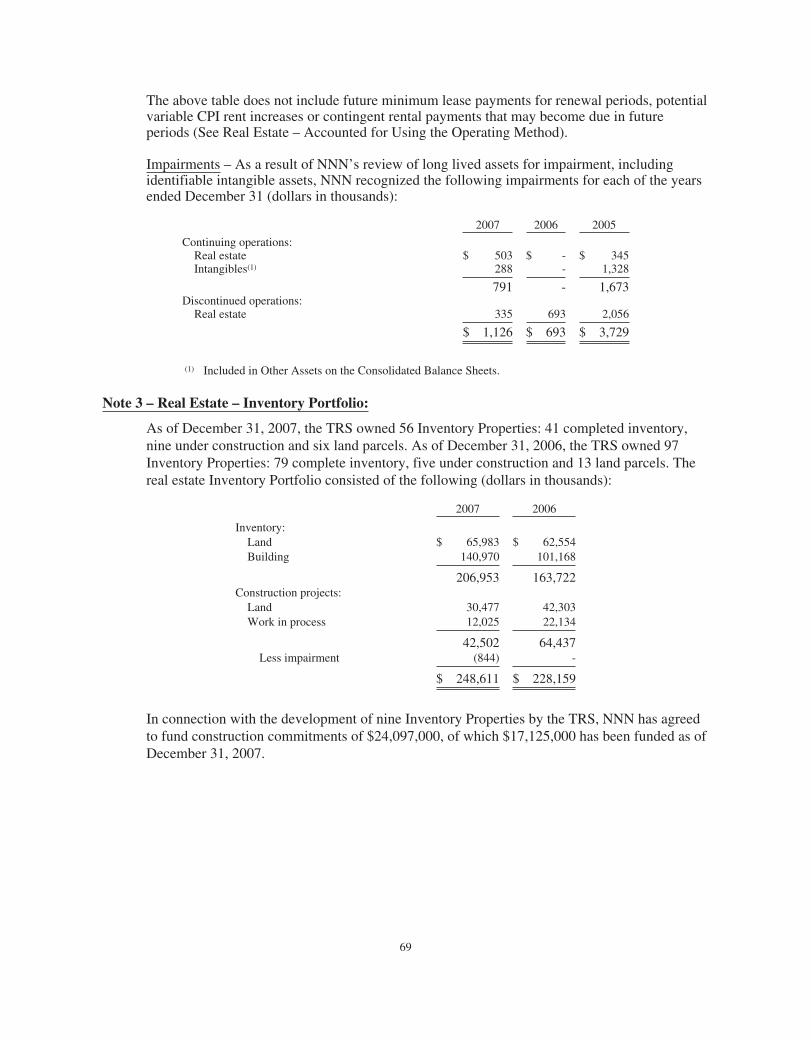
The above table does not include future minimum lease payments for renewal periods, potentialvariable CPI rent increases or contingent rental payments that may become due in futureperiods (See Real Estate – Accounted for Using the Operating Method).
Impairments – As a result of NNN’s review of long lived assets for impairment, includingidentifiable intangible assets, NNN recognized the following impairments for each of the yearsended December 31 (dollars in thousands):
2007 2006 2005
Continuing operations:Real estate $ 503 $ - $ 345Intangibles(1) 288 - 1,328
791 - 1,673Discontinued operations:
Real estate 335 693 2,056
$ 1,126 $ 693 $ 3,729
(1) Included in Other Assets on the Consolidated Balance Sheets.
Note 3 – Real Estate – Inventory Portfolio:
As of December 31, 2007, the TRS owned 56 Inventory Properties: 41 completed inventory,nine under construction and six land parcels. As of December 31, 2006, the TRS owned 97Inventory Properties: 79 complete inventory, five under construction and 13 land parcels. Thereal estate Inventory Portfolio consisted of the following (dollars in thousands):
2007 2006
Inventory:Land $ 65,983 $ 62,554Building 140,970 101,168
206,953 163,722Construction projects:
Land 30,477 42,303Work in process 12,025 22,134
42,502 64,437Less impairment (844) -
$ 248,611 $ 228,159
In connection with the development of nine Inventory Properties by the TRS, NNN has agreedto fund construction commitments of $24,097,000, of which $17,125,000 has been funded as ofDecember 31, 2007.
69
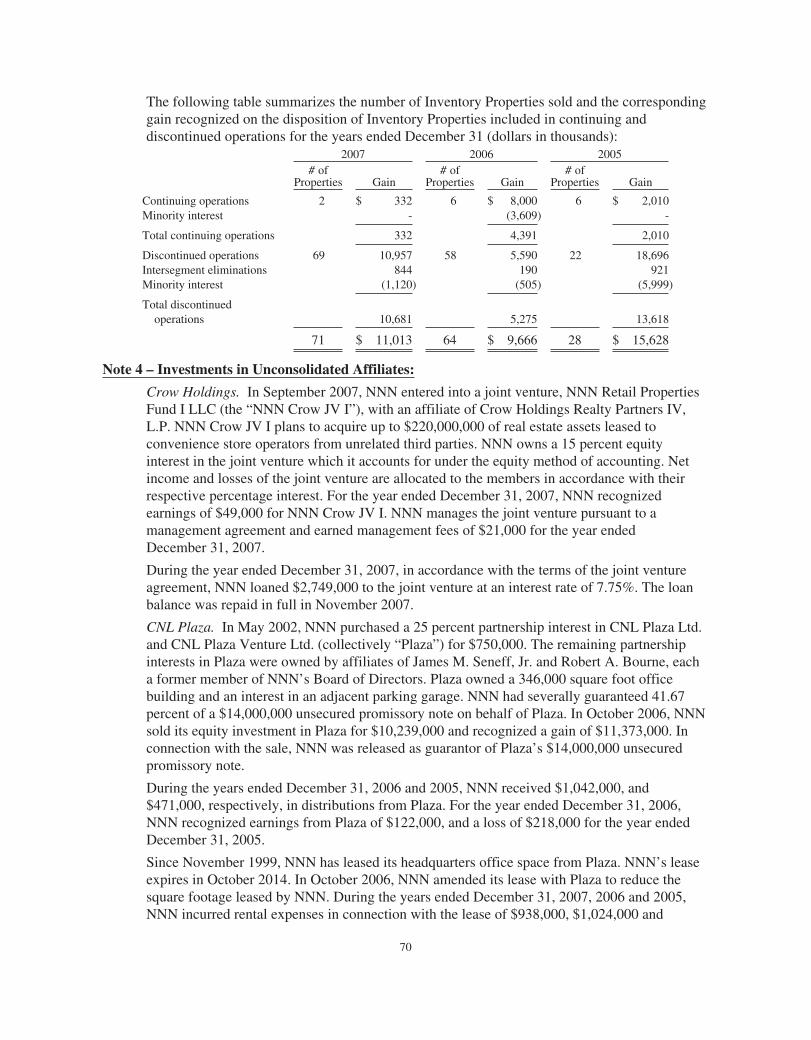
The following table summarizes the number of Inventory Properties sold and the correspondinggain recognized on the disposition of Inventory Properties included in continuing anddiscontinued operations for the years ended December 31 (dollars in thousands):
2007 2006 2005# of
Properties Gain# of
Properties Gain# of
Properties Gain
Continuing operations 2 $ 332 6 $ 8,000 6 $ 2,010Minority interest - (3,609) -
Total continuing operations 332 4,391 2,010
Discontinued operations 69 10,957 58 5,590 22 18,696Intersegment eliminations 844 190 921Minority interest (1,120) (505) (5,999)
Total discontinuedoperations 10,681 5,275 13,618
71 $ 11,013 64 $ 9,666 28 $ 15,628
Note 4 – Investments in Unconsolidated Affiliates:
Crow Holdings. In September 2007, NNN entered into a joint venture, NNN Retail PropertiesFund I LLC (the “NNN Crow JV I”), with an affiliate of Crow Holdings Realty Partners IV,L.P. NNN Crow JV I plans to acquire up to $220,000,000 of real estate assets leased toconvenience store operators from unrelated third parties. NNN owns a 15 percent equityinterest in the joint venture which it accounts for under the equity method of accounting. Netincome and losses of the joint venture are allocated to the members in accordance with theirrespective percentage interest. For the year ended December 31, 2007, NNN recognizedearnings of $49,000 for NNN Crow JV I. NNN manages the joint venture pursuant to amanagement agreement and earned management fees of $21,000 for the year endedDecember 31, 2007.
During the year ended December 31, 2007, in accordance with the terms of the joint ventureagreement, NNN loaned $2,749,000 to the joint venture at an interest rate of 7.75%. The loanbalance was repaid in full in November 2007.
CNL Plaza. In May 2002, NNN purchased a 25 percent partnership interest in CNL Plaza Ltd.and CNL Plaza Venture Ltd. (collectively “Plaza”) for $750,000. The remaining partnershipinterests in Plaza were owned by affiliates of James M. Seneff, Jr. and Robert A. Bourne, eacha former member of NNN’s Board of Directors. Plaza owned a 346,000 square foot officebuilding and an interest in an adjacent parking garage. NNN had severally guaranteed 41.67percent of a $14,000,000 unsecured promissory note on behalf of Plaza. In October 2006, NNNsold its equity investment in Plaza for $10,239,000 and recognized a gain of $11,373,000. Inconnection with the sale, NNN was released as guarantor of Plaza’s $14,000,000 unsecuredpromissory note.
During the years ended December 31, 2006 and 2005, NNN received $1,042,000, and$471,000, respectively, in distributions from Plaza. For the year ended December 31, 2006,NNN recognized earnings from Plaza of $122,000, and a loss of $218,000 for the year endedDecember 31, 2005.
Since November 1999, NNN has leased its headquarters office space from Plaza. NNN’s leaseexpires in October 2014. In October 2006, NNN amended its lease with Plaza to reduce thesquare footage leased by NNN. During the years ended December 31, 2007, 2006 and 2005,NNN incurred rental expenses in connection with the lease of $938,000, $1,024,000 and
70
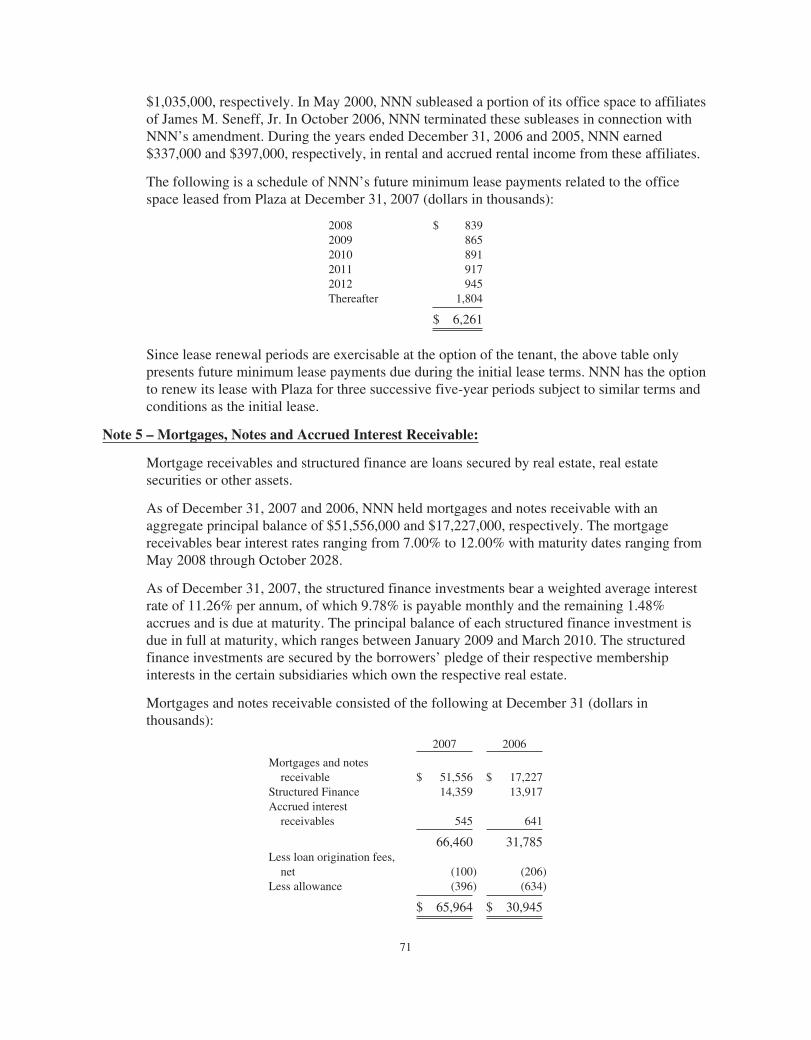
$1,035,000, respectively. In May 2000, NNN subleased a portion of its office space to affiliatesof James M. Seneff, Jr. In October 2006, NNN terminated these subleases in connection withNNN’s amendment. During the years ended December 31, 2006 and 2005, NNN earned$337,000 and $397,000, respectively, in rental and accrued rental income from these affiliates.
The following is a schedule of NNN’s future minimum lease payments related to the officespace leased from Plaza at December 31, 2007 (dollars in thousands):
2008 $ 8392009 8652010 8912011 9172012 945Thereafter 1,804
$ 6,261
Since lease renewal periods are exercisable at the option of the tenant, the above table onlypresents future minimum lease payments due during the initial lease terms. NNN has the optionto renew its lease with Plaza for three successive five-year periods subject to similar terms andconditions as the initial lease.
Note 5 – Mortgages, Notes and Accrued Interest Receivable:
Mortgage receivables and structured finance are loans secured by real estate, real estatesecurities or other assets.
As of December 31, 2007 and 2006, NNN held mortgages and notes receivable with anaggregate principal balance of $51,556,000 and $17,227,000, respectively. The mortgagereceivables bear interest rates ranging from 7.00% to 12.00% with maturity dates ranging fromMay 2008 through October 2028.
As of December 31, 2007, the structured finance investments bear a weighted average interestrate of 11.26% per annum, of which 9.78% is payable monthly and the remaining 1.48%accrues and is due at maturity. The principal balance of each structured finance investment isdue in full at maturity, which ranges between January 2009 and March 2010. The structuredfinance investments are secured by the borrowers’ pledge of their respective membershipinterests in the certain subsidiaries which own the respective real estate.
Mortgages and notes receivable consisted of the following at December 31 (dollars inthousands):
2007 2006
Mortgages and notesreceivable $ 51,556 $ 17,227
Structured Finance 14,359 13,917Accrued interest
receivables 545 641
66,460 31,785Less loan origination fees,
net (100) (206)Less allowance (396) (634)
$ 65,964 $ 30,945
71
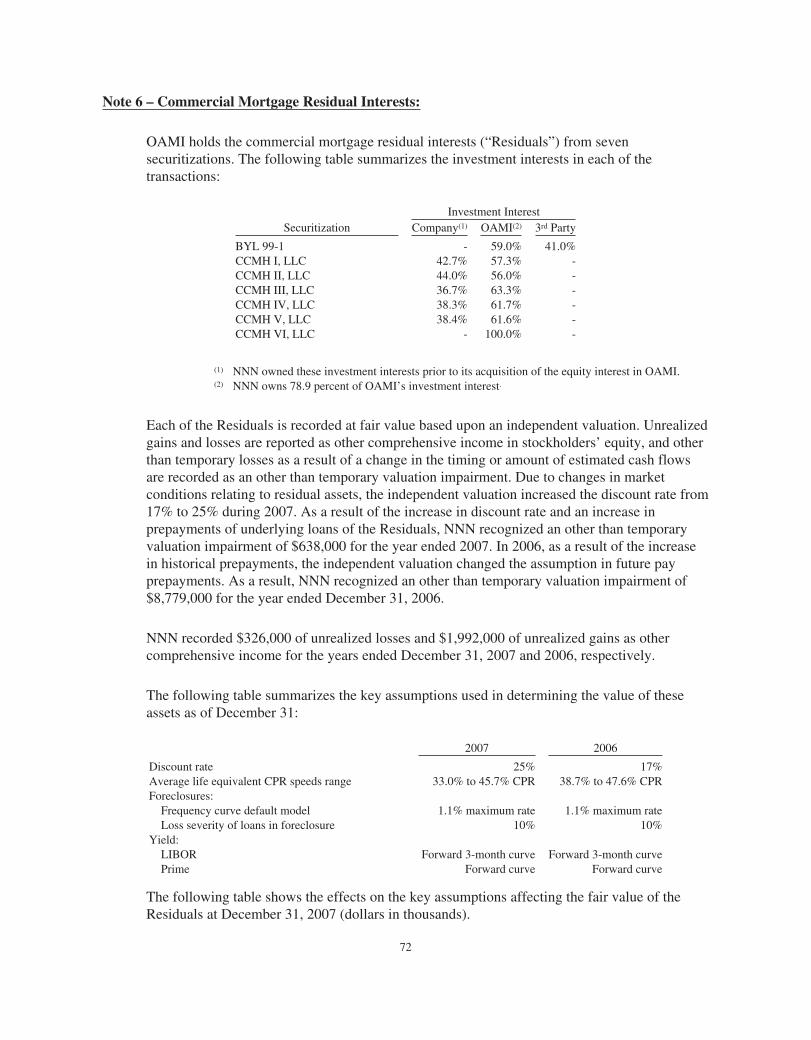
Note 6 – Commercial Mortgage Residual Interests:
OAMI holds the commercial mortgage residual interests (“Residuals”) from sevensecuritizations. The following table summarizes the investment interests in each of thetransactions:
Investment InterestSecuritization Company(1) OAMI(2) 3rd Party
BYL 99-1 - 59.0% 41.0%CCMH I, LLC 42.7% 57.3% -CCMH II, LLC 44.0% 56.0% -CCMH III, LLC 36.7% 63.3% -CCMH IV, LLC 38.3% 61.7% -CCMH V, LLC 38.4% 61.6% -CCMH VI, LLC - 100.0% -
(1) NNN owned these investment interests prior to its acquisition of the equity interest in OAMI.(2) NNN owns 78.9 percent of OAMI’s investment interest.
Each of the Residuals is recorded at fair value based upon an independent valuation. Unrealizedgains and losses are reported as other comprehensive income in stockholders’ equity, and otherthan temporary losses as a result of a change in the timing or amount of estimated cash flowsare recorded as an other than temporary valuation impairment. Due to changes in marketconditions relating to residual assets, the independent valuation increased the discount rate from17% to 25% during 2007. As a result of the increase in discount rate and an increase inprepayments of underlying loans of the Residuals, NNN recognized an other than temporaryvaluation impairment of $638,000 for the year ended 2007. In 2006, as a result of the increasein historical prepayments, the independent valuation changed the assumption in future payprepayments. As a result, NNN recognized an other than temporary valuation impairment of$8,779,000 for the year ended December 31, 2006.
NNN recorded $326,000 of unrealized losses and $1,992,000 of unrealized gains as othercomprehensive income for the years ended December 31, 2007 and 2006, respectively.
The following table summarizes the key assumptions used in determining the value of theseassets as of December 31:
2007 2006
Discount rate 25% 17%Average life equivalent CPR speeds range 33.0% to 45.7% CPR 38.7% to 47.6% CPRForeclosures:
Frequency curve default model 1.1% maximum rate 1.1% maximum rateLoss severity of loans in foreclosure 10% 10%
Yield:LIBOR Forward 3-month curve Forward 3-month curvePrime Forward curve Forward curve
The following table shows the effects on the key assumptions affecting the fair value of theResiduals at December 31, 2007 (dollars in thousands).
72
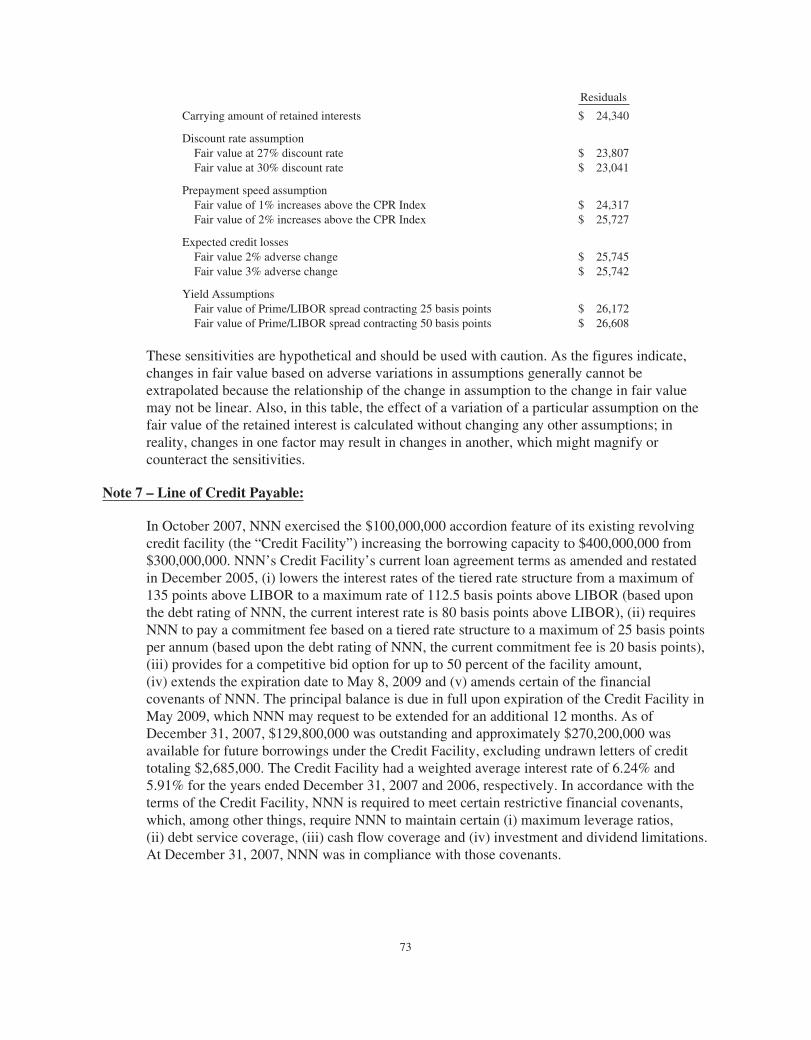
Residuals
Carrying amount of retained interests $ 24,340
Discount rate assumptionFair value at 27% discount rate $ 23,807Fair value at 30% discount rate $ 23,041
Prepayment speed assumptionFair value of 1% increases above the CPR Index $ 24,317Fair value of 2% increases above the CPR Index $ 25,727
Expected credit lossesFair value 2% adverse change $ 25,745Fair value 3% adverse change $ 25,742
Yield AssumptionsFair value of Prime/LIBOR spread contracting 25 basis points $ 26,172Fair value of Prime/LIBOR spread contracting 50 basis points $ 26,608
These sensitivities are hypothetical and should be used with caution. As the figures indicate,changes in fair value based on adverse variations in assumptions generally cannot beextrapolated because the relationship of the change in assumption to the change in fair valuemay not be linear. Also, in this table, the effect of a variation of a particular assumption on thefair value of the retained interest is calculated without changing any other assumptions; inreality, changes in one factor may result in changes in another, which might magnify orcounteract the sensitivities.
Note 7 – Line of Credit Payable:
In October 2007, NNN exercised the $100,000,000 accordion feature of its existing revolvingcredit facility (the “Credit Facility”) increasing the borrowing capacity to $400,000,000 from$300,000,000. NNN’s Credit Facility’s current loan agreement terms as amended and restatedin December 2005, (i) lowers the interest rates of the tiered rate structure from a maximum of135 points above LIBOR to a maximum rate of 112.5 basis points above LIBOR (based uponthe debt rating of NNN, the current interest rate is 80 basis points above LIBOR), (ii) requiresNNN to pay a commitment fee based on a tiered rate structure to a maximum of 25 basis pointsper annum (based upon the debt rating of NNN, the current commitment fee is 20 basis points),(iii) provides for a competitive bid option for up to 50 percent of the facility amount,(iv) extends the expiration date to May 8, 2009 and (v) amends certain of the financialcovenants of NNN. The principal balance is due in full upon expiration of the Credit Facility inMay 2009, which NNN may request to be extended for an additional 12 months. As ofDecember 31, 2007, $129,800,000 was outstanding and approximately $270,200,000 wasavailable for future borrowings under the Credit Facility, excluding undrawn letters of credittotaling $2,685,000. The Credit Facility had a weighted average interest rate of 6.24% and5.91% for the years ended December 31, 2007 and 2006, respectively. In accordance with theterms of the Credit Facility, NNN is required to meet certain restrictive financial covenants,which, among other things, require NNN to maintain certain (i) maximum leverage ratios,(ii) debt service coverage, (iii) cash flow coverage and (iv) investment and dividend limitations.At December 31, 2007, NNN was in compliance with those covenants.
73
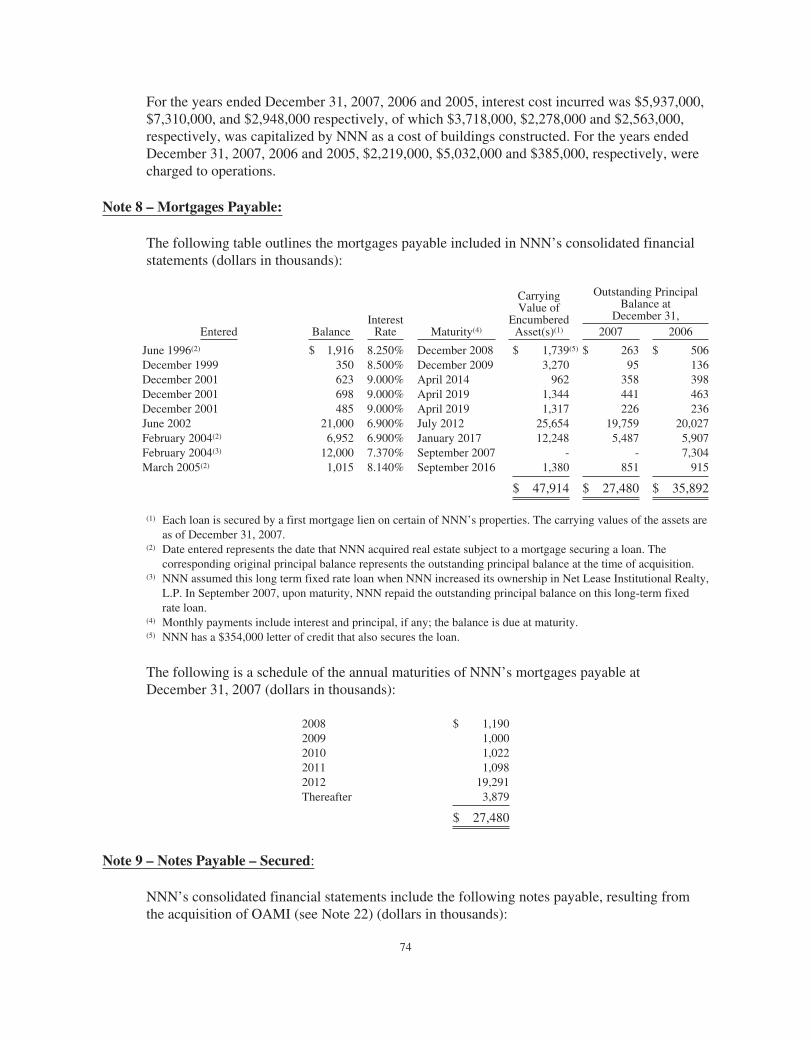
For the years ended December 31, 2007, 2006 and 2005, interest cost incurred was $5,937,000,$7,310,000, and $2,948,000 respectively, of which $3,718,000, $2,278,000 and $2,563,000,respectively, was capitalized by NNN as a cost of buildings constructed. For the years endedDecember 31, 2007, 2006 and 2005, $2,219,000, $5,032,000 and $385,000, respectively, werecharged to operations.
Note 8 – Mortgages Payable:
The following table outlines the mortgages payable included in NNN’s consolidated financialstatements (dollars in thousands):
Entered BalanceInterest
Rate Maturity(4)
CarryingValue of
EncumberedAsset(s)(1)
Outstanding PrincipalBalance at
December 31,2007 2006
June 1996(2) $ 1,916 8.250% December 2008 $ 1,739(5) $ 263 $ 506December 1999 350 8.500% December 2009 3,270 95 136December 2001 623 9.000% April 2014 962 358 398December 2001 698 9.000% April 2019 1,344 441 463December 2001 485 9.000% April 2019 1,317 226 236June 2002 21,000 6.900% July 2012 25,654 19,759 20,027February 2004(2) 6,952 6.900% January 2017 12,248 5,487 5,907February 2004(3) 12,000 7.370% September 2007 - - 7,304March 2005(2) 1,015 8.140% September 2016 1,380 851 915
$ 47,914 $ 27,480 $ 35,892
(1) Each loan is secured by a first mortgage lien on certain of NNN’s properties. The carrying values of the assets areas of December 31, 2007.
(2) Date entered represents the date that NNN acquired real estate subject to a mortgage securing a loan. Thecorresponding original principal balance represents the outstanding principal balance at the time of acquisition.
(3) NNN assumed this long term fixed rate loan when NNN increased its ownership in Net Lease Institutional Realty,L.P. In September 2007, upon maturity, NNN repaid the outstanding principal balance on this long-term fixedrate loan.
(4) Monthly payments include interest and principal, if any; the balance is due at maturity.(5) NNN has a $354,000 letter of credit that also secures the loan.
The following is a schedule of the annual maturities of NNN’s mortgages payable atDecember 31, 2007 (dollars in thousands):
2008 $ 1,1902009 1,0002010 1,0222011 1,0982012 19,291Thereafter 3,879
$ 27,480
Note 9 – Notes Payable – Secured:
NNN’s consolidated financial statements include the following notes payable, resulting fromthe acquisition of OAMI (see Note 22) (dollars in thousands):
74
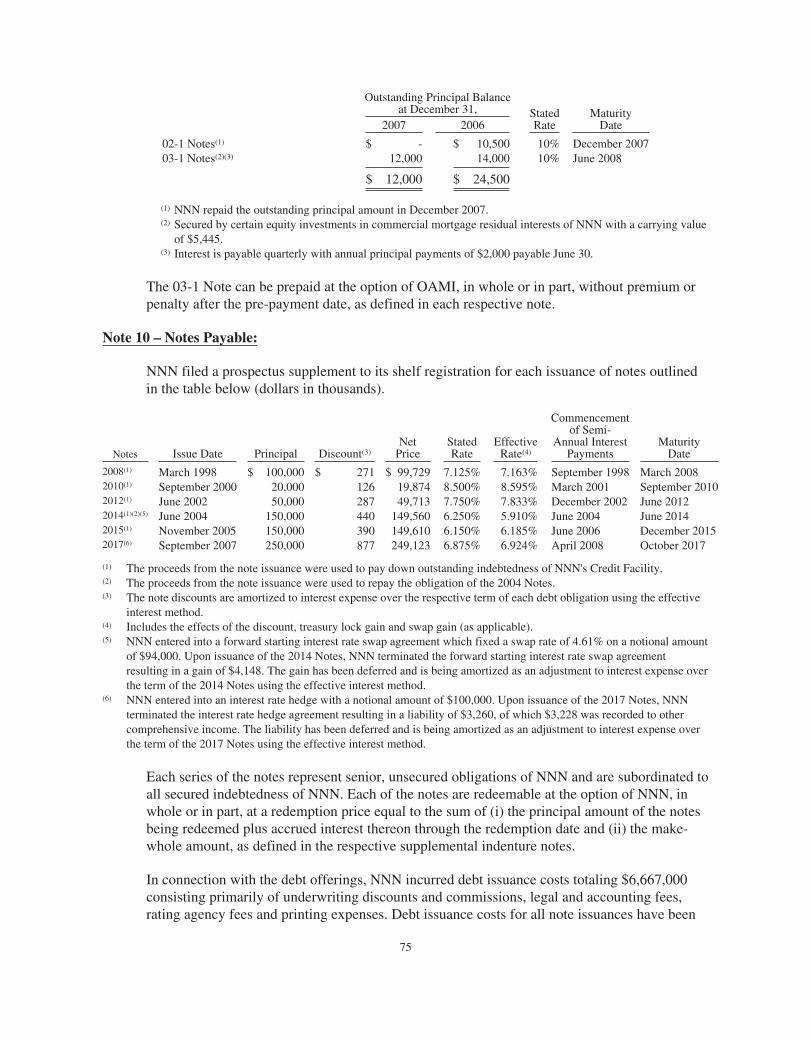
Outstanding Principal Balanceat December 31, Stated
RateMaturity
Date2007 2006
02-1 Notes(1) $ - $ 10,500 10% December 200703-1 Notes(2)(3) 12,000 14,000 10% June 2008
$ 12,000 $ 24,500
(1) NNN repaid the outstanding principal amount in December 2007.(2) Secured by certain equity investments in commercial mortgage residual interests of NNN with a carrying value
of $5,445.(3) Interest is payable quarterly with annual principal payments of $2,000 payable June 30.
The 03-1 Note can be prepaid at the option of OAMI, in whole or in part, without premium orpenalty after the pre-payment date, as defined in each respective note.
Note 10 – Notes Payable:
NNN filed a prospectus supplement to its shelf registration for each issuance of notes outlinedin the table below (dollars in thousands).
Notes Issue Date Principal Discount(3)Net
PriceStatedRate
EffectiveRate(4)
Commencementof Semi-
Annual InterestPayments
MaturityDate
2008(1) March 1998 $ 100,000 $ 271 $ 99,729 7.125% 7.163% September 1998 March 20082010(1) September 2000 20,000 126 19,874 8.500% 8.595% March 2001 September 20102012(1) June 2002 50,000 287 49,713 7.750% 7.833% December 2002 June 20122014(1)(2)(5) June 2004 150,000 440 149,560 6.250% 5.910% June 2004 June 20142015(1) November 2005 150,000 390 149,610 6.150% 6.185% June 2006 December 20152017(6) September 2007 250,000 877 249,123 6.875% 6.924% April 2008 October 2017
(1) The proceeds from the note issuance were used to pay down outstanding indebtedness of NNN's Credit Facility.(2) The proceeds from the note issuance were used to repay the obligation of the 2004 Notes.(3) The note discounts are amortized to interest expense over the respective term of each debt obligation using the effective
interest method.(4) Includes the effects of the discount, treasury lock gain and swap gain (as applicable).(5) NNN entered into a forward starting interest rate swap agreement which fixed a swap rate of 4.61% on a notional amount
of $94,000. Upon issuance of the 2014 Notes, NNN terminated the forward starting interest rate swap agreementresulting in a gain of $4,148. The gain has been deferred and is being amortized as an adjustment to interest expense overthe term of the 2014 Notes using the effective interest method.
(6) NNN entered into an interest rate hedge with a notional amount of $100,000. Upon issuance of the 2017 Notes, NNNterminated the interest rate hedge agreement resulting in a liability of $3,260, of which $3,228 was recorded to othercomprehensive income. The liability has been deferred and is being amortized as an adjustment to interest expense overthe term of the 2017 Notes using the effective interest method.
Each series of the notes represent senior, unsecured obligations of NNN and are subordinated toall secured indebtedness of NNN. Each of the notes are redeemable at the option of NNN, inwhole or in part, at a redemption price equal to the sum of (i) the principal amount of the notesbeing redeemed plus accrued interest thereon through the redemption date and (ii) the make-whole amount, as defined in the respective supplemental indenture notes.
In connection with the debt offerings, NNN incurred debt issuance costs totaling $6,667,000consisting primarily of underwriting discounts and commissions, legal and accounting fees,rating agency fees and printing expenses. Debt issuance costs for all note issuances have been
75
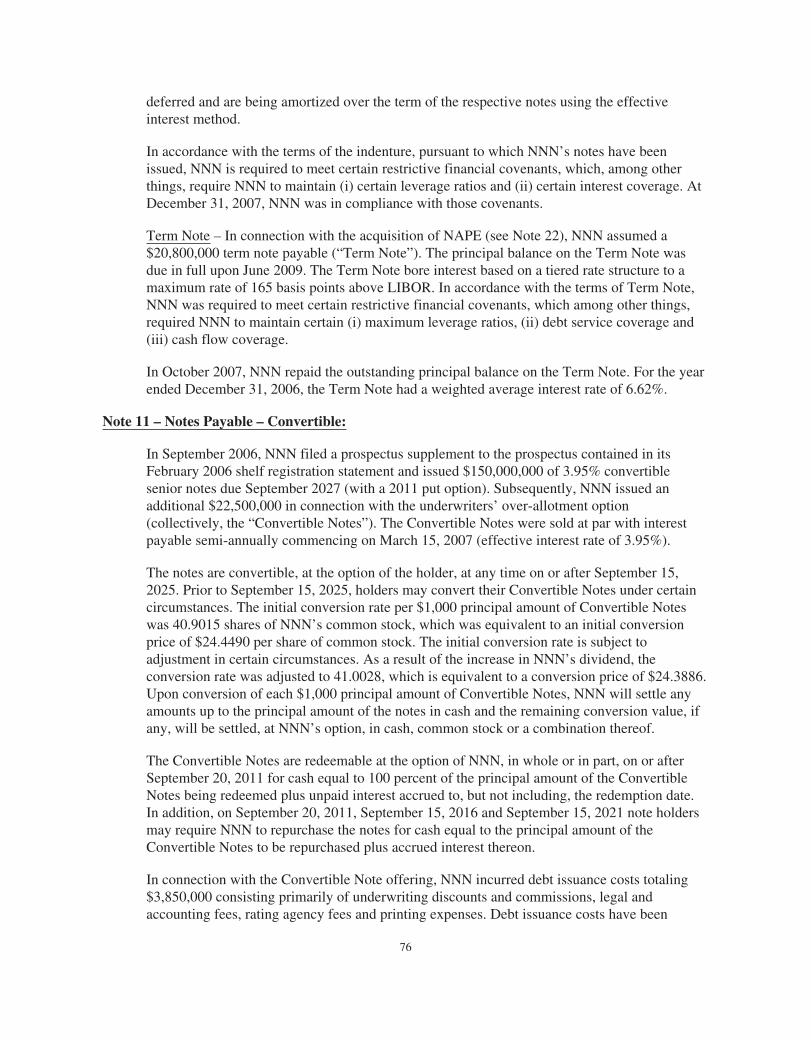
deferred and are being amortized over the term of the respective notes using the effectiveinterest method.
In accordance with the terms of the indenture, pursuant to which NNN’s notes have beenissued, NNN is required to meet certain restrictive financial covenants, which, among otherthings, require NNN to maintain (i) certain leverage ratios and (ii) certain interest coverage. AtDecember 31, 2007, NNN was in compliance with those covenants.
Term Note – In connection with the acquisition of NAPE (see Note 22), NNN assumed a$20,800,000 term note payable (“Term Note”). The principal balance on the Term Note wasdue in full upon June 2009. The Term Note bore interest based on a tiered rate structure to amaximum rate of 165 basis points above LIBOR. In accordance with the terms of Term Note,NNN was required to meet certain restrictive financial covenants, which among other things,required NNN to maintain certain (i) maximum leverage ratios, (ii) debt service coverage and(iii) cash flow coverage.
In October 2007, NNN repaid the outstanding principal balance on the Term Note. For the yearended December 31, 2006, the Term Note had a weighted average interest rate of 6.62%.
Note 11 – Notes Payable – Convertible:
In September 2006, NNN filed a prospectus supplement to the prospectus contained in itsFebruary 2006 shelf registration statement and issued $150,000,000 of 3.95% convertiblesenior notes due September 2027 (with a 2011 put option). Subsequently, NNN issued anadditional $22,500,000 in connection with the underwriters’ over-allotment option(collectively, the “Convertible Notes”). The Convertible Notes were sold at par with interestpayable semi-annually commencing on March 15, 2007 (effective interest rate of 3.95%).
The notes are convertible, at the option of the holder, at any time on or after September 15,2025. Prior to September 15, 2025, holders may convert their Convertible Notes under certaincircumstances. The initial conversion rate per $1,000 principal amount of Convertible Noteswas 40.9015 shares of NNN’s common stock, which was equivalent to an initial conversionprice of $24.4490 per share of common stock. The initial conversion rate is subject toadjustment in certain circumstances. As a result of the increase in NNN’s dividend, theconversion rate was adjusted to 41.0028, which is equivalent to a conversion price of $24.3886.Upon conversion of each $1,000 principal amount of Convertible Notes, NNN will settle anyamounts up to the principal amount of the notes in cash and the remaining conversion value, ifany, will be settled, at NNN’s option, in cash, common stock or a combination thereof.
The Convertible Notes are redeemable at the option of NNN, in whole or in part, on or afterSeptember 20, 2011 for cash equal to 100 percent of the principal amount of the ConvertibleNotes being redeemed plus unpaid interest accrued to, but not including, the redemption date.In addition, on September 20, 2011, September 15, 2016 and September 15, 2021 note holdersmay require NNN to repurchase the notes for cash equal to the principal amount of theConvertible Notes to be repurchased plus accrued interest thereon.
In connection with the Convertible Note offering, NNN incurred debt issuance costs totaling$3,850,000 consisting primarily of underwriting discounts and commissions, legal andaccounting fees, rating agency fees and printing expenses. Debt issuance costs have been
76
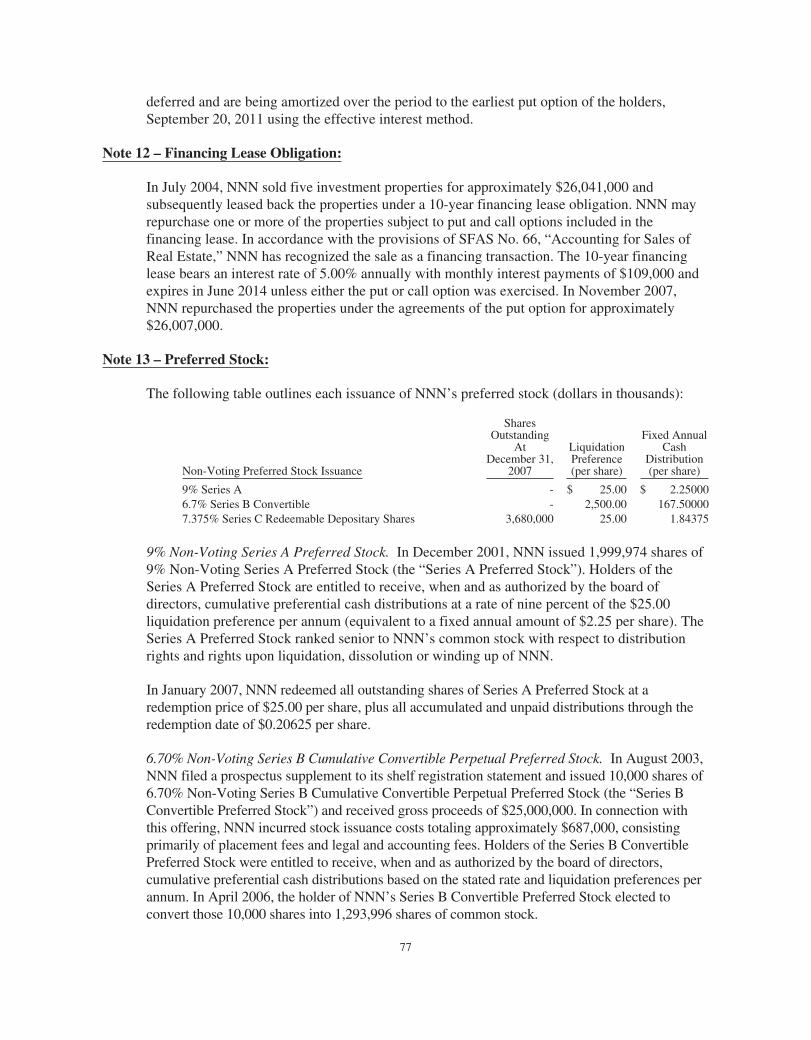
deferred and are being amortized over the period to the earliest put option of the holders,September 20, 2011 using the effective interest method.
Note 12 – Financing Lease Obligation:
In July 2004, NNN sold five investment properties for approximately $26,041,000 andsubsequently leased back the properties under a 10-year financing lease obligation. NNN mayrepurchase one or more of the properties subject to put and call options included in thefinancing lease. In accordance with the provisions of SFAS No. 66, “Accounting for Sales ofReal Estate,” NNN has recognized the sale as a financing transaction. The 10-year financinglease bears an interest rate of 5.00% annually with monthly interest payments of $109,000 andexpires in June 2014 unless either the put or call option was exercised. In November 2007,NNN repurchased the properties under the agreements of the put option for approximately$26,007,000.
Note 13 – Preferred Stock:
The following table outlines each issuance of NNN’s preferred stock (dollars in thousands):
Non-Voting Preferred Stock Issuance
SharesOutstanding
AtDecember 31,
2007
LiquidationPreference(per share)
Fixed AnnualCash
Distribution(per share)
9% Series A - $ 25.00 $ 2.250006.7% Series B Convertible - 2,500.00 167.500007.375% Series C Redeemable Depositary Shares 3,680,000 25.00 1.84375
9% Non-Voting Series A Preferred Stock. In December 2001, NNN issued 1,999,974 shares of9% Non-Voting Series A Preferred Stock (the “Series A Preferred Stock”). Holders of theSeries A Preferred Stock are entitled to receive, when and as authorized by the board ofdirectors, cumulative preferential cash distributions at a rate of nine percent of the $25.00liquidation preference per annum (equivalent to a fixed annual amount of $2.25 per share). TheSeries A Preferred Stock ranked senior to NNN’s common stock with respect to distributionrights and rights upon liquidation, dissolution or winding up of NNN.
In January 2007, NNN redeemed all outstanding shares of Series A Preferred Stock at aredemption price of $25.00 per share, plus all accumulated and unpaid distributions through theredemption date of $0.20625 per share.
6.70% Non-Voting Series B Cumulative Convertible Perpetual Preferred Stock. In August 2003,NNN filed a prospectus supplement to its shelf registration statement and issued 10,000 shares of6.70% Non-Voting Series B Cumulative Convertible Perpetual Preferred Stock (the “Series BConvertible Preferred Stock”) and received gross proceeds of $25,000,000. In connection withthis offering, NNN incurred stock issuance costs totaling approximately $687,000, consistingprimarily of placement fees and legal and accounting fees. Holders of the Series B ConvertiblePreferred Stock were entitled to receive, when and as authorized by the board of directors,cumulative preferential cash distributions based on the stated rate and liquidation preferences perannum. In April 2006, the holder of NNN’s Series B Convertible Preferred Stock elected toconvert those 10,000 shares into 1,293,996 shares of common stock.
77
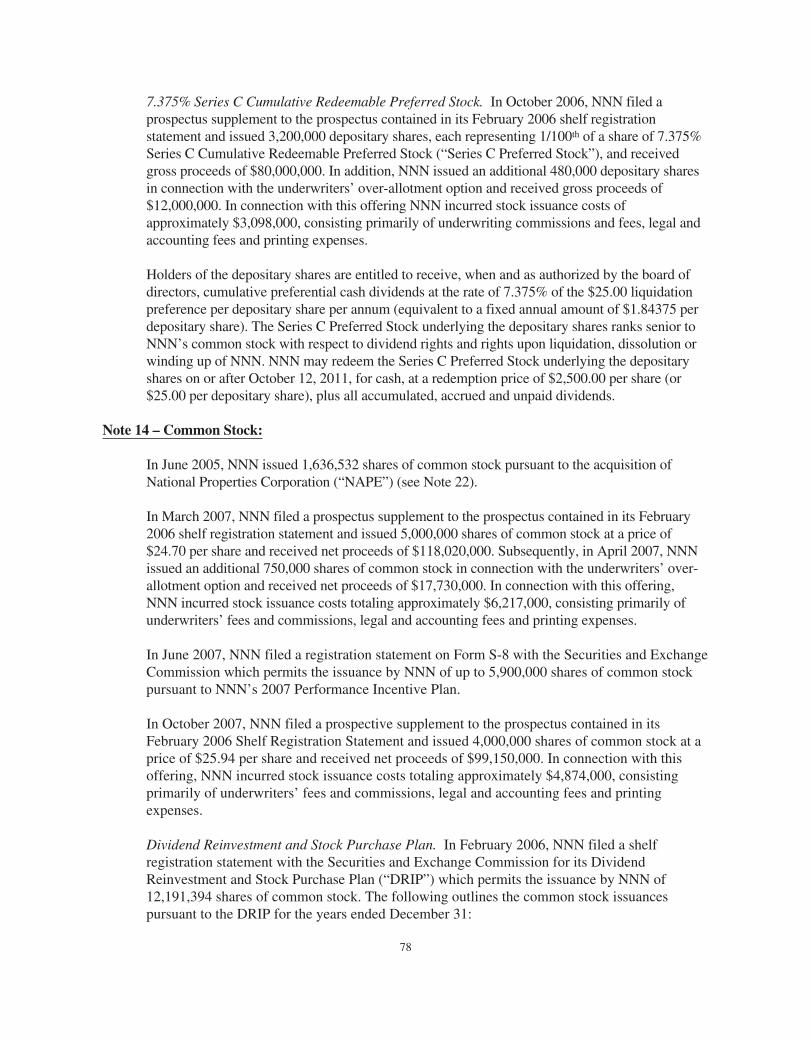
7.375% Series C Cumulative Redeemable Preferred Stock. In October 2006, NNN filed aprospectus supplement to the prospectus contained in its February 2006 shelf registrationstatement and issued 3,200,000 depositary shares, each representing 1/100th of a share of 7.375%Series C Cumulative Redeemable Preferred Stock (“Series C Preferred Stock”), and receivedgross proceeds of $80,000,000. In addition, NNN issued an additional 480,000 depositary sharesin connection with the underwriters’ over-allotment option and received gross proceeds of$12,000,000. In connection with this offering NNN incurred stock issuance costs ofapproximately $3,098,000, consisting primarily of underwriting commissions and fees, legal andaccounting fees and printing expenses.
Holders of the depositary shares are entitled to receive, when and as authorized by the board ofdirectors, cumulative preferential cash dividends at the rate of 7.375% of the $25.00 liquidationpreference per depositary share per annum (equivalent to a fixed annual amount of $1.84375 perdepositary share). The Series C Preferred Stock underlying the depositary shares ranks senior toNNN’s common stock with respect to dividend rights and rights upon liquidation, dissolution orwinding up of NNN. NNN may redeem the Series C Preferred Stock underlying the depositaryshares on or after October 12, 2011, for cash, at a redemption price of $2,500.00 per share (or$25.00 per depositary share), plus all accumulated, accrued and unpaid dividends.
Note 14 – Common Stock:
In June 2005, NNN issued 1,636,532 shares of common stock pursuant to the acquisition ofNational Properties Corporation (“NAPE”) (see Note 22).
In March 2007, NNN filed a prospectus supplement to the prospectus contained in its February2006 shelf registration statement and issued 5,000,000 shares of common stock at a price of$24.70 per share and received net proceeds of $118,020,000. Subsequently, in April 2007, NNNissued an additional 750,000 shares of common stock in connection with the underwriters’ over-allotment option and received net proceeds of $17,730,000. In connection with this offering,NNN incurred stock issuance costs totaling approximately $6,217,000, consisting primarily ofunderwriters’ fees and commissions, legal and accounting fees and printing expenses.
In June 2007, NNN filed a registration statement on Form S-8 with the Securities and ExchangeCommission which permits the issuance by NNN of up to 5,900,000 shares of common stockpursuant to NNN’s 2007 Performance Incentive Plan.
In October 2007, NNN filed a prospective supplement to the prospectus contained in itsFebruary 2006 Shelf Registration Statement and issued 4,000,000 shares of common stock at aprice of $25.94 per share and received net proceeds of $99,150,000. In connection with thisoffering, NNN incurred stock issuance costs totaling approximately $4,874,000, consistingprimarily of underwriters’ fees and commissions, legal and accounting fees and printingexpenses.
Dividend Reinvestment and Stock Purchase Plan. In February 2006, NNN filed a shelfregistration statement with the Securities and Exchange Commission for its DividendReinvestment and Stock Purchase Plan (“DRIP”) which permits the issuance by NNN of12,191,394 shares of common stock. The following outlines the common stock issuancespursuant to the DRIP for the years ended December 31:
78
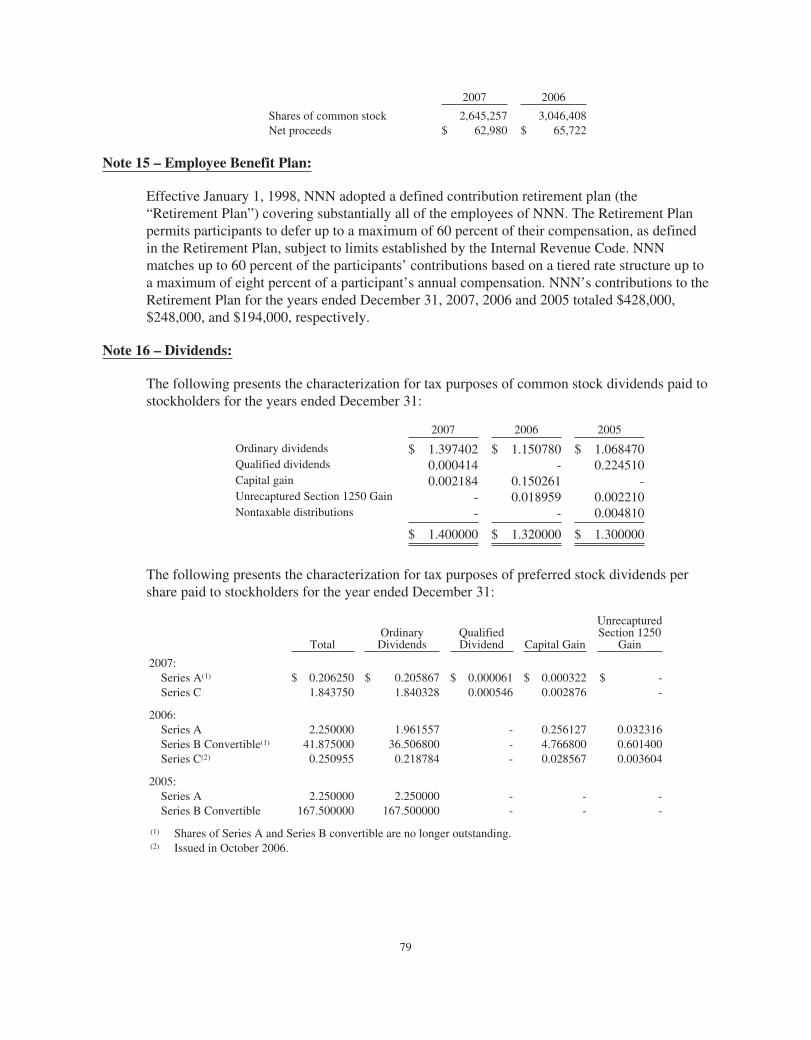
2007 2006
Shares of common stock 2,645,257 3,046,408Net proceeds $ 62,980 $ 65,722
Note 15 – Employee Benefit Plan:
Effective January 1, 1998, NNN adopted a defined contribution retirement plan (the“Retirement Plan”) covering substantially all of the employees of NNN. The Retirement Planpermits participants to defer up to a maximum of 60 percent of their compensation, as definedin the Retirement Plan, subject to limits established by the Internal Revenue Code. NNNmatches up to 60 percent of the participants’ contributions based on a tiered rate structure up toa maximum of eight percent of a participant’s annual compensation. NNN’s contributions to theRetirement Plan for the years ended December 31, 2007, 2006 and 2005 totaled $428,000,$248,000, and $194,000, respectively.
Note 16 – Dividends:
The following presents the characterization for tax purposes of common stock dividends paid tostockholders for the years ended December 31:
2007 2006 2005
Ordinary dividends $ 1.397402 $ 1.150780 $ 1.068470Qualified dividends 0.000414 - 0.224510Capital gain 0.002184 0.150261 -Unrecaptured Section 1250 Gain - 0.018959 0.002210Nontaxable distributions - - 0.004810
$ 1.400000 $ 1.320000 $ 1.300000
The following presents the characterization for tax purposes of preferred stock dividends pershare paid to stockholders for the year ended December 31:
TotalOrdinaryDividends
QualifiedDividend Capital Gain
UnrecapturedSection 1250
Gain
2007:Series A(1) $ 0.206250 $ 0.205867 $ 0.000061 $ 0.000322 $ -Series C 1.843750 1.840328 0.000546 0.002876 -
2006:Series A 2.250000 1.961557 - 0.256127 0.032316Series B Convertible(1) 41.875000 36.506800 - 4.766800 0.601400Series C(2) 0.250955 0.218784 - 0.028567 0.003604
2005:Series A 2.250000 2.250000 - - -Series B Convertible 167.500000 167.500000 - - -
(1) Shares of Series A and Series B convertible are no longer outstanding.(2) Issued in October 2006.
79
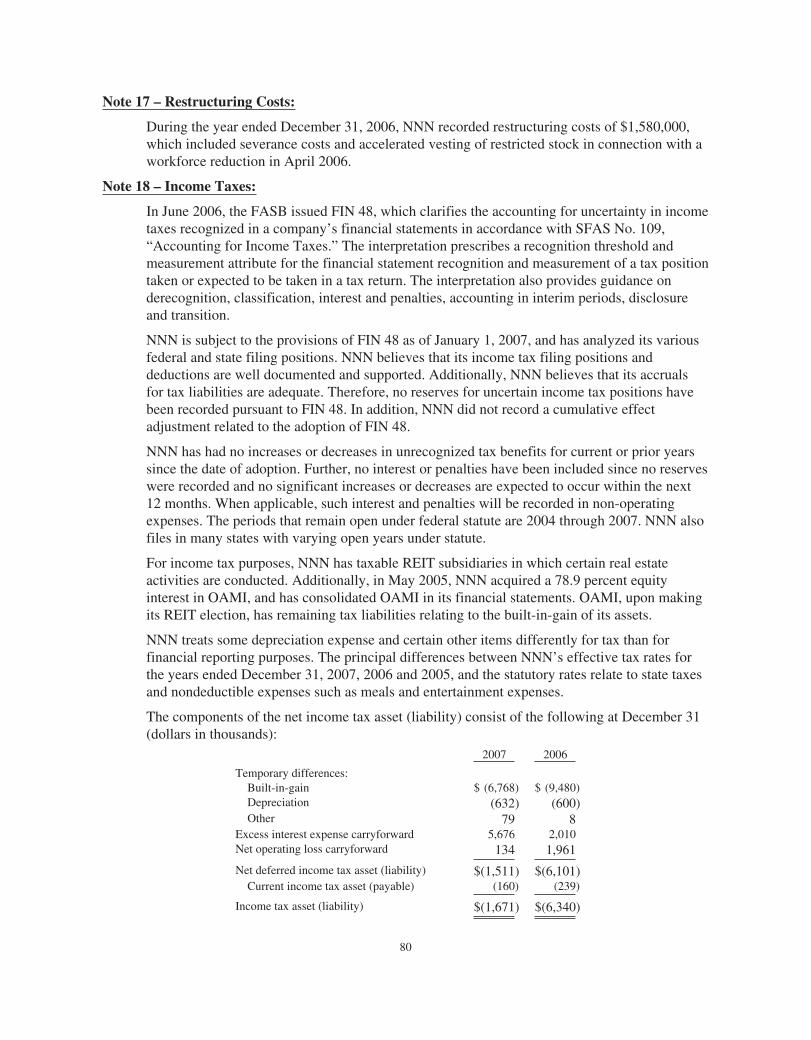
Note 17 – Restructuring Costs:
During the year ended December 31, 2006, NNN recorded restructuring costs of $1,580,000,which included severance costs and accelerated vesting of restricted stock in connection with aworkforce reduction in April 2006.
Note 18 – Income Taxes:
In June 2006, the FASB issued FIN 48, which clarifies the accounting for uncertainty in incometaxes recognized in a company’s financial statements in accordance with SFAS No. 109,“Accounting for Income Taxes.” The interpretation prescribes a recognition threshold andmeasurement attribute for the financial statement recognition and measurement of a tax positiontaken or expected to be taken in a tax return. The interpretation also provides guidance onderecognition, classification, interest and penalties, accounting in interim periods, disclosureand transition.
NNN is subject to the provisions of FIN 48 as of January 1, 2007, and has analyzed its variousfederal and state filing positions. NNN believes that its income tax filing positions anddeductions are well documented and supported. Additionally, NNN believes that its accrualsfor tax liabilities are adequate. Therefore, no reserves for uncertain income tax positions havebeen recorded pursuant to FIN 48. In addition, NNN did not record a cumulative effectadjustment related to the adoption of FIN 48.
NNN has had no increases or decreases in unrecognized tax benefits for current or prior yearssince the date of adoption. Further, no interest or penalties have been included since no reserveswere recorded and no significant increases or decreases are expected to occur within the next12 months. When applicable, such interest and penalties will be recorded in non-operatingexpenses. The periods that remain open under federal statute are 2004 through 2007. NNN alsofiles in many states with varying open years under statute.
For income tax purposes, NNN has taxable REIT subsidiaries in which certain real estateactivities are conducted. Additionally, in May 2005, NNN acquired a 78.9 percent equityinterest in OAMI, and has consolidated OAMI in its financial statements. OAMI, upon makingits REIT election, has remaining tax liabilities relating to the built-in-gain of its assets.
NNN treats some depreciation expense and certain other items differently for tax than forfinancial reporting purposes. The principal differences between NNN’s effective tax rates forthe years ended December 31, 2007, 2006 and 2005, and the statutory rates relate to state taxesand nondeductible expenses such as meals and entertainment expenses.
The components of the net income tax asset (liability) consist of the following at December 31(dollars in thousands):
2007 2006
Temporary differences:Built-in-gain $ (6,768) $ (9,480)Depreciation (632) (600)Other 79 8
Excess interest expense carryforward 5,676 2,010Net operating loss carryforward 134 1,961
Net deferred income tax asset (liability) $(1,511) $(6,101)Current income tax asset (payable) (160) (239)
Income tax asset (liability) $(1,671) $(6,340)
80
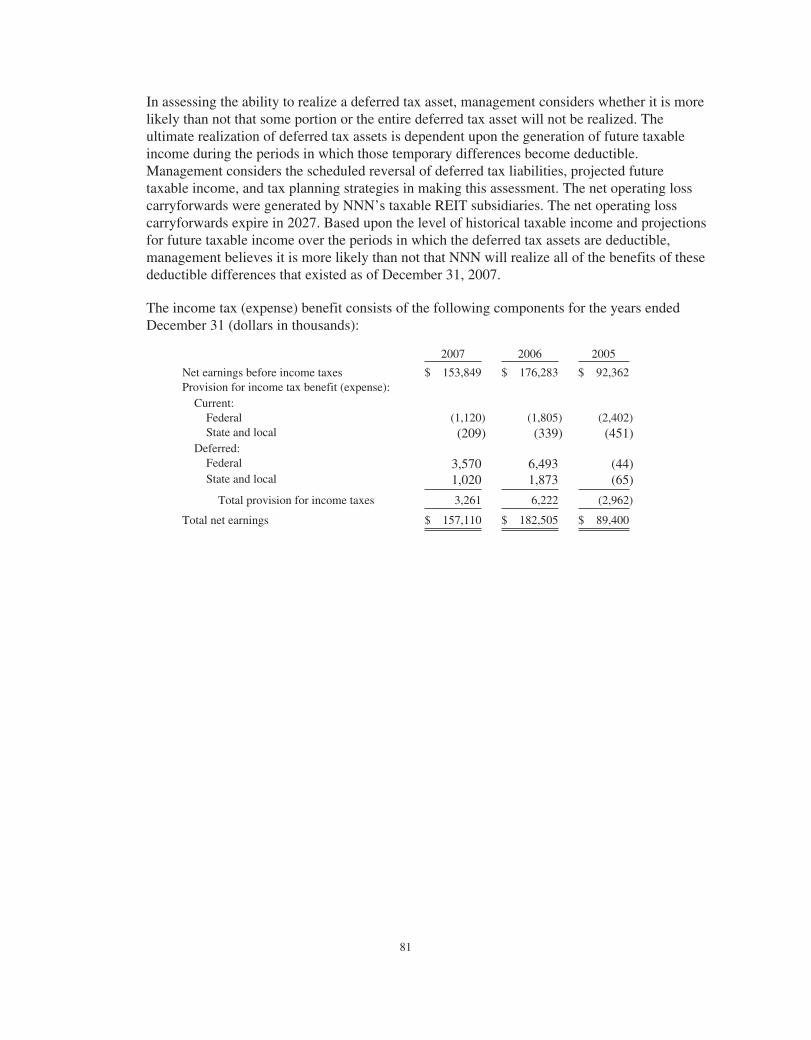
In assessing the ability to realize a deferred tax asset, management considers whether it is morelikely than not that some portion or the entire deferred tax asset will not be realized. Theultimate realization of deferred tax assets is dependent upon the generation of future taxableincome during the periods in which those temporary differences become deductible.Management considers the scheduled reversal of deferred tax liabilities, projected futuretaxable income, and tax planning strategies in making this assessment. The net operating losscarryforwards were generated by NNN’s taxable REIT subsidiaries. The net operating losscarryforwards expire in 2027. Based upon the level of historical taxable income and projectionsfor future taxable income over the periods in which the deferred tax assets are deductible,management believes it is more likely than not that NNN will realize all of the benefits of thesedeductible differences that existed as of December 31, 2007.
The income tax (expense) benefit consists of the following components for the years endedDecember 31 (dollars in thousands):
2007 2006 2005
Net earnings before income taxes $ 153,849 $ 176,283 $ 92,362Provision for income tax benefit (expense):
Current:Federal (1,120) (1,805) (2,402)State and local (209) (339) (451)
Deferred:Federal 3,570 6,493 (44)State and local 1,020 1,873 (65)
Total provision for income taxes 3,261 6,222 (2,962)
Total net earnings $ 157,110 $ 182,505 $ 89,400
81
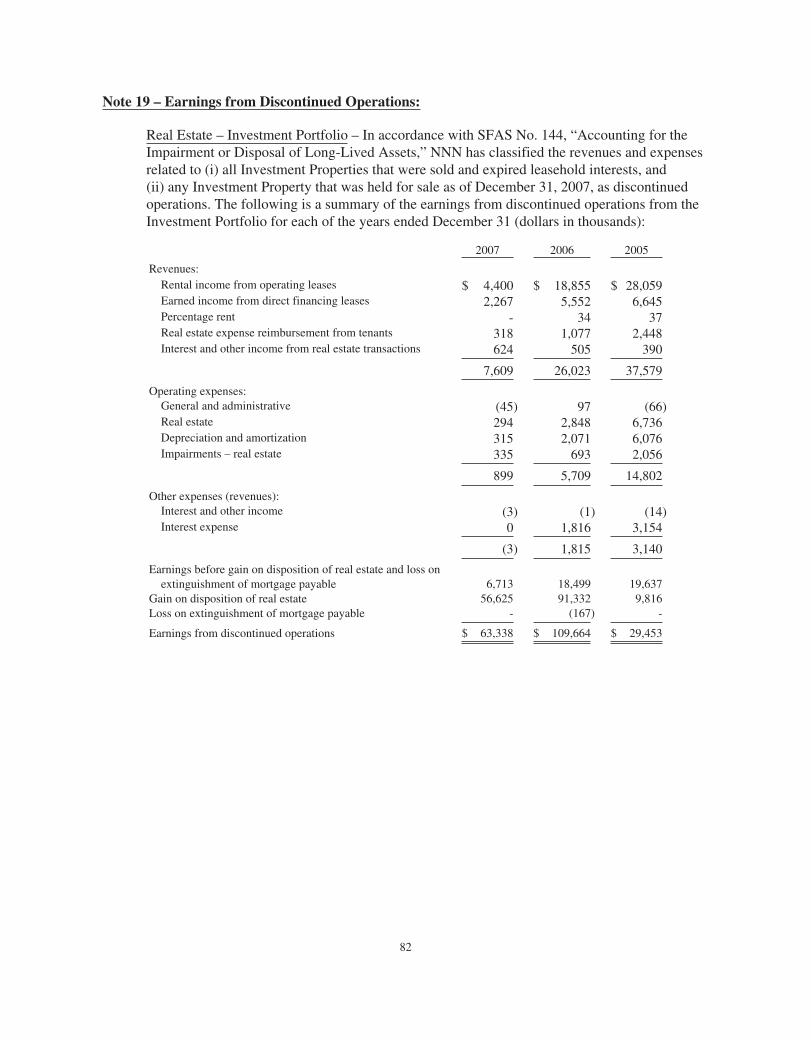
Note 19 – Earnings from Discontinued Operations:
Real Estate – Investment Portfolio – In accordance with SFAS No. 144, “Accounting for theImpairment or Disposal of Long-Lived Assets,” NNN has classified the revenues and expensesrelated to (i) all Investment Properties that were sold and expired leasehold interests, and(ii) any Investment Property that was held for sale as of December 31, 2007, as discontinuedoperations. The following is a summary of the earnings from discontinued operations from theInvestment Portfolio for each of the years ended December 31 (dollars in thousands):
2007 2006 2005
Revenues:Rental income from operating leases $ 4,400 $ 18,855 $ 28,059Earned income from direct financing leases 2,267 5,552 6,645Percentage rent - 34 37Real estate expense reimbursement from tenants 318 1,077 2,448Interest and other income from real estate transactions 624 505 390
7,609 26,023 37,579
Operating expenses:General and administrative (45) 97 (66)Real estate 294 2,848 6,736Depreciation and amortization 315 2,071 6,076Impairments – real estate 335 693 2,056
899 5,709 14,802
Other expenses (revenues):Interest and other income (3) (1) (14)Interest expense 0 1,816 3,154
(3) 1,815 3,140
Earnings before gain on disposition of real estate and loss onextinguishment of mortgage payable 6,713 18,499 19,637
Gain on disposition of real estate 56,625 91,332 9,816Loss on extinguishment of mortgage payable - (167) -
Earnings from discontinued operations $ 63,338 $ 109,664 $ 29,453
82
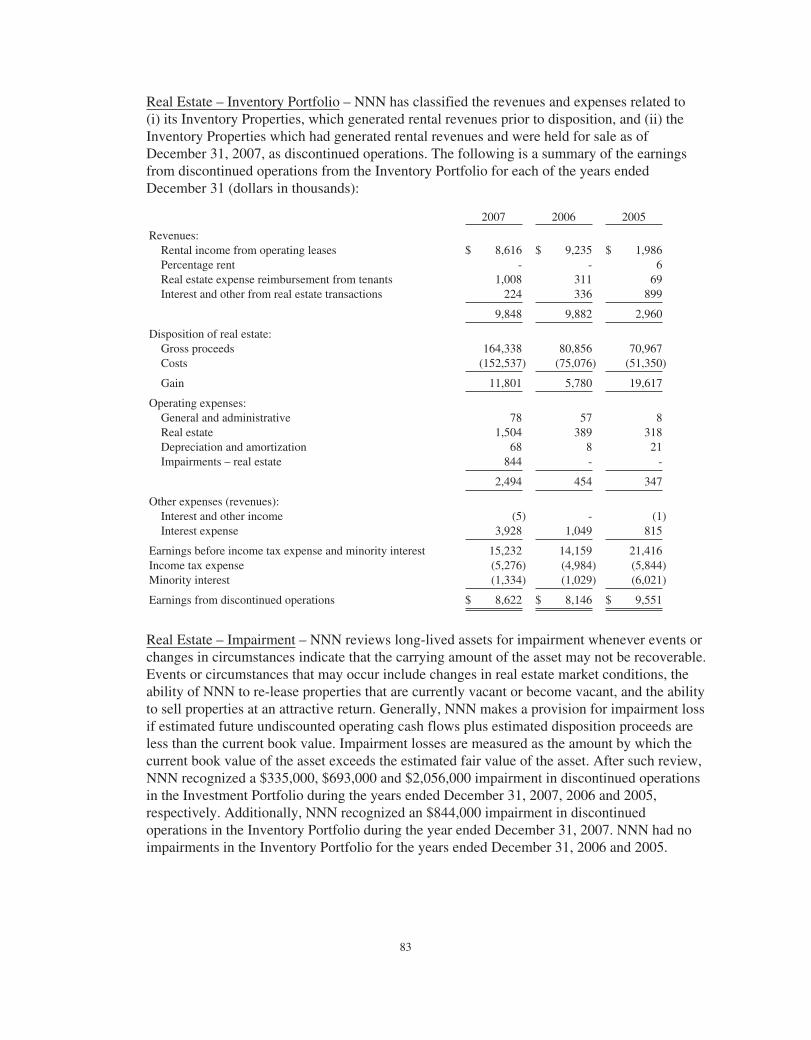
Real Estate – Inventory Portfolio – NNN has classified the revenues and expenses related to(i) its Inventory Properties, which generated rental revenues prior to disposition, and (ii) theInventory Properties which had generated rental revenues and were held for sale as ofDecember 31, 2007, as discontinued operations. The following is a summary of the earningsfrom discontinued operations from the Inventory Portfolio for each of the years endedDecember 31 (dollars in thousands):
2007 2006 2005
Revenues:Rental income from operating leases $ 8,616 $ 9,235 $ 1,986Percentage rent - - 6Real estate expense reimbursement from tenants 1,008 311 69Interest and other from real estate transactions 224 336 899
9,848 9,882 2,960
Disposition of real estate:Gross proceeds 164,338 80,856 70,967Costs (152,537) (75,076) (51,350)
Gain 11,801 5,780 19,617
Operating expenses:General and administrative 78 57 8Real estate 1,504 389 318Depreciation and amortization 68 8 21Impairments – real estate 844 - -
2,494 454 347
Other expenses (revenues):Interest and other income (5) - (1)Interest expense 3,928 1,049 815
Earnings before income tax expense and minority interest 15,232 14,159 21,416Income tax expense (5,276) (4,984) (5,844)Minority interest (1,334) (1,029) (6,021)
Earnings from discontinued operations $ 8,622 $ 8,146 $ 9,551
Real Estate – Impairment – NNN reviews long-lived assets for impairment whenever events orchanges in circumstances indicate that the carrying amount of the asset may not be recoverable.Events or circumstances that may occur include changes in real estate market conditions, theability of NNN to re-lease properties that are currently vacant or become vacant, and the abilityto sell properties at an attractive return. Generally, NNN makes a provision for impairment lossif estimated future undiscounted operating cash flows plus estimated disposition proceeds areless than the current book value. Impairment losses are measured as the amount by which thecurrent book value of the asset exceeds the estimated fair value of the asset. After such review,NNN recognized a $335,000, $693,000 and $2,056,000 impairment in discontinued operationsin the Investment Portfolio during the years ended December 31, 2007, 2006 and 2005,respectively. Additionally, NNN recognized an $844,000 impairment in discontinuedoperations in the Inventory Portfolio during the year ended December 31, 2007. NNN had noimpairments in the Inventory Portfolio for the years ended December 31, 2006 and 2005.
83
Note 20 – Derivatives:
SFAS No. 133, “Accounting for Derivative Instruments and Hedging Activities,” as amendedand interpreted, establishes accounting and reporting standards for derivative instruments,including certain derivative instruments embedded in other contracts, and for hedgingactivities. As required by SFAS No. 133, NNN records all derivatives on the balance sheet atfair value. The accounting for changes in the fair value of derivatives depends on the intendeduse of the derivative and the resulting designation. Derivatives used to hedge the exposure tochanges in the fair value of an asset, liability, or firm commitment attributable to a particularrisk, such as interest rate risk, are considered fair value hedges. Derivatives used to hedge theexposure to variability in expected future cash flows, or other types of forecasted transactions,are considered cash flow hedges.
NNN’s objective in using derivatives is to add stability to interest expense and to manage itsexposure to interest rate movements or other identified risks. To accomplish this objective,NNN primarily uses treasury locks and interest rate swaps as part of its cash flow hedgingstrategy. Treasury locks designated as cash flow hedges lock in the yield or price of a treasurysecurity. Treasury locks are cash settled either as a cash inflow or outflow, depending onmovements in interest rates. Interest rate swaps designated as cash flow hedges involve thereceipt of variable rate amounts in exchange for fixed-rate payments over the life of theagreements without exchange of the underlying principal amount. To date, such derivativeshave been used to hedge the variable cash flows associated with floating rate debt andforecasted interest payments of a forecasted issuance of debt.
For derivatives designated as cash flow hedges, the effective portion of changes in the fairvalue of the derivative is initially reported in other comprehensive income (outside of earnings)and subsequently reclassified to earnings when the hedged transaction affects earnings, and theineffective portion of changes in the fair value of the derivative is recognized directly inearnings.
NNN discontinues hedge accounting prospectively when it is determined that the derivative isno longer highly effective in offsetting changes in the cash flows of the hedged item, thederivative expires or is sold, terminated, or exercised, the derivative is re-designated as ahedging instrument or management determines that designation of the derivative as a hedginginstrument is no longer appropriate.
When hedge accounting is discontinued, NNN continues to carry the derivative at its fair valueon the balance sheet, and recognizes any changes in its fair value in earnings or may choose tocash settle the derivative at that time.
NNN is hedging its exposure to the variability in future cash flows for forecasted transactionsover a maximum period of 6 months (excluding forecasted transactions related to the paymentof variable interest on existing financial instruments).
In September 2007, NNN terminated two interest rate hedges with a combined notional amountof $100,000,000 that were hedging the risk of changes in forecasted interest payments on aforecasted issuance of long-term debt. The fair value of the interest rate hedges whenterminated was a liability of $3,260,000, of which $3,228,000 was deferred in othercomprehensive income.
84
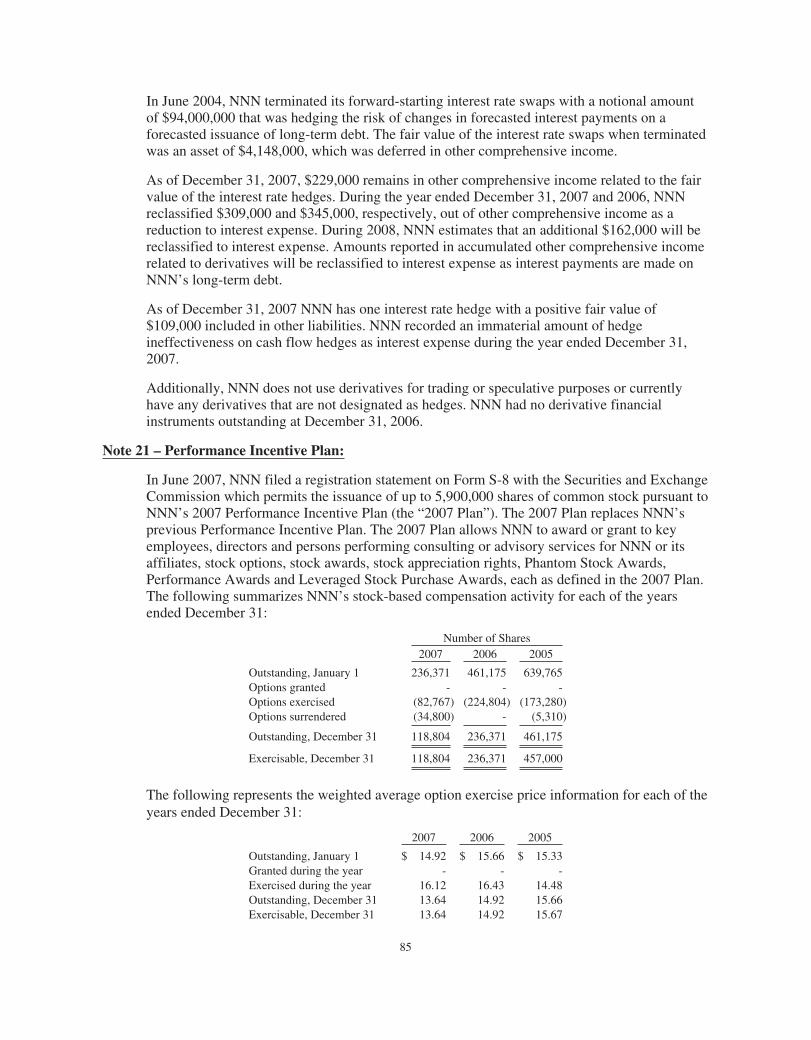
In June 2004, NNN terminated its forward-starting interest rate swaps with a notional amountof $94,000,000 that was hedging the risk of changes in forecasted interest payments on aforecasted issuance of long-term debt. The fair value of the interest rate swaps when terminatedwas an asset of $4,148,000, which was deferred in other comprehensive income.
As of December 31, 2007, $229,000 remains in other comprehensive income related to the fairvalue of the interest rate hedges. During the year ended December 31, 2007 and 2006, NNNreclassified $309,000 and $345,000, respectively, out of other comprehensive income as areduction to interest expense. During 2008, NNN estimates that an additional $162,000 will bereclassified to interest expense. Amounts reported in accumulated other comprehensive incomerelated to derivatives will be reclassified to interest expense as interest payments are made onNNN’s long-term debt.
As of December 31, 2007 NNN has one interest rate hedge with a positive fair value of$109,000 included in other liabilities. NNN recorded an immaterial amount of hedgeineffectiveness on cash flow hedges as interest expense during the year ended December 31,2007.
Additionally, NNN does not use derivatives for trading or speculative purposes or currentlyhave any derivatives that are not designated as hedges. NNN had no derivative financialinstruments outstanding at December 31, 2006.
Note 21 – Performance Incentive Plan:
In June 2007, NNN filed a registration statement on Form S-8 with the Securities and ExchangeCommission which permits the issuance of up to 5,900,000 shares of common stock pursuant toNNN’s 2007 Performance Incentive Plan (the “2007 Plan”). The 2007 Plan replaces NNN’sprevious Performance Incentive Plan. The 2007 Plan allows NNN to award or grant to keyemployees, directors and persons performing consulting or advisory services for NNN or itsaffiliates, stock options, stock awards, stock appreciation rights, Phantom Stock Awards,Performance Awards and Leveraged Stock Purchase Awards, each as defined in the 2007 Plan.The following summarizes NNN’s stock-based compensation activity for each of the yearsended December 31:
Number of Shares2007 2006 2005
Outstanding, January 1 236,371 461,175 639,765Options granted - - -Options exercised (82,767) (224,804) (173,280)Options surrendered (34,800) - (5,310)
Outstanding, December 31 118,804 236,371 461,175
Exercisable, December 31 118,804 236,371 457,000
The following represents the weighted average option exercise price information for each of theyears ended December 31:
2007 2006 2005
Outstanding, January 1 $ 14.92 $ 15.66 $ 15.33Granted during the year - - -Exercised during the year 16.12 16.43 14.48Outstanding, December 31 13.64 14.92 15.66Exercisable, December 31 13.64 14.92 15.67
85
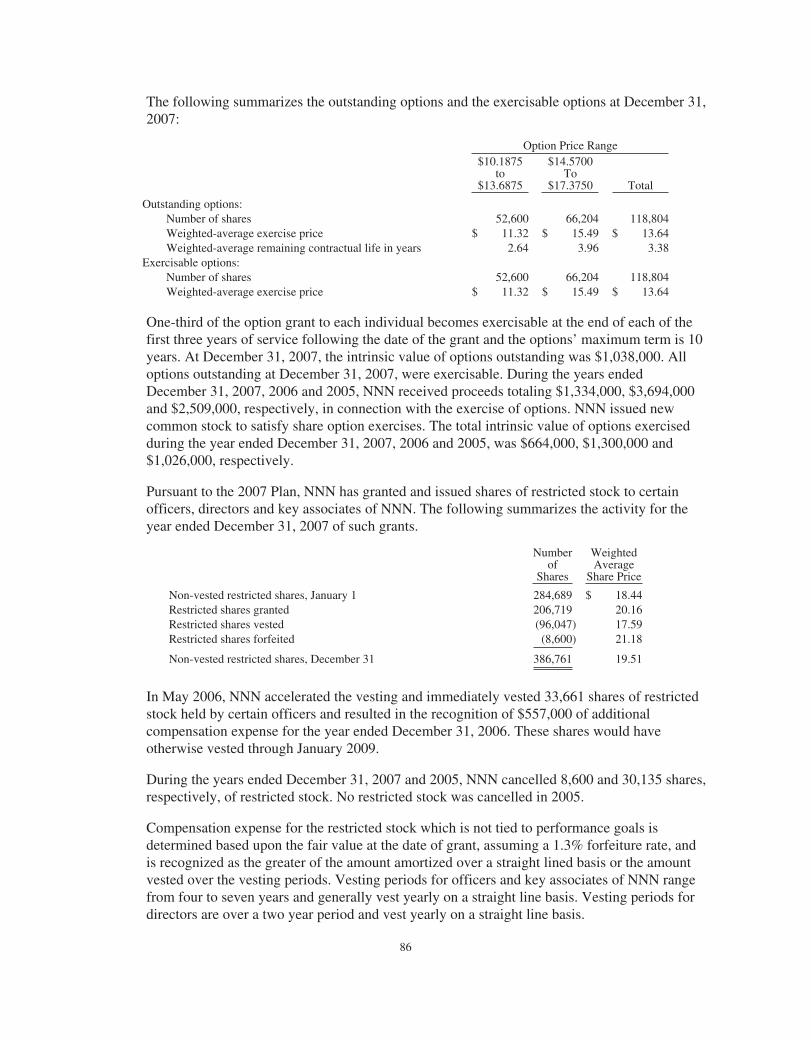
The following summarizes the outstanding options and the exercisable options at December 31,2007:
Option Price Range$10.1875
to$13.6875
$14.5700To
$17.3750 Total
Outstanding options:Number of shares 52,600 66,204 118,804Weighted-average exercise price $ 11.32 $ 15.49 $ 13.64Weighted-average remaining contractual life in years 2.64 3.96 3.38
Exercisable options:Number of shares 52,600 66,204 118,804Weighted-average exercise price $ 11.32 $ 15.49 $ 13.64
One-third of the option grant to each individual becomes exercisable at the end of each of thefirst three years of service following the date of the grant and the options’ maximum term is 10years. At December 31, 2007, the intrinsic value of options outstanding was $1,038,000. Alloptions outstanding at December 31, 2007, were exercisable. During the years endedDecember 31, 2007, 2006 and 2005, NNN received proceeds totaling $1,334,000, $3,694,000and $2,509,000, respectively, in connection with the exercise of options. NNN issued newcommon stock to satisfy share option exercises. The total intrinsic value of options exercisedduring the year ended December 31, 2007, 2006 and 2005, was $664,000, $1,300,000 and$1,026,000, respectively.
Pursuant to the 2007 Plan, NNN has granted and issued shares of restricted stock to certainofficers, directors and key associates of NNN. The following summarizes the activity for theyear ended December 31, 2007 of such grants.
Numberof
Shares
WeightedAverage
Share Price
Non-vested restricted shares, January 1 284,689 $ 18.44Restricted shares granted 206,719 20.16Restricted shares vested (96,047) 17.59Restricted shares forfeited (8,600) 21.18
Non-vested restricted shares, December 31 386,761 19.51
In May 2006, NNN accelerated the vesting and immediately vested 33,661 shares of restrictedstock held by certain officers and resulted in the recognition of $557,000 of additionalcompensation expense for the year ended December 31, 2006. These shares would haveotherwise vested through January 2009.
During the years ended December 31, 2007 and 2005, NNN cancelled 8,600 and 30,135 shares,respectively, of restricted stock. No restricted stock was cancelled in 2005.
Compensation expense for the restricted stock which is not tied to performance goals isdetermined based upon the fair value at the date of grant, assuming a 1.3% forfeiture rate, andis recognized as the greater of the amount amortized over a straight lined basis or the amountvested over the vesting periods. Vesting periods for officers and key associates of NNN rangefrom four to seven years and generally vest yearly on a straight line basis. Vesting periods fordirectors are over a two year period and vest yearly on a straight line basis.
86

During the year ended December 31, 2007, NNN granted 79,000 performance based shareswith a weighted average grant price of $12.94 to certain executive officers of NNN. Thecompensation expense for the grant is based upon the fair value of the grant lattice model withthe following assumptions: (i) risk free interest rate of 4.8%, (ii) a dividend rate of 5.3%, (iii) aterm of five years, and (iv) volatility of 17.5%. Volatility is based upon the historical volatilityof NNN’s stock and other factors. The term is assumed to be the vesting date for each tranche.The vesting of these shares is contingent upon achievement of certain performance goals byJanuary 1, 2012.
During the year ended December 31, 2005, NNN granted 38,273 performance based shareswith a weighted average grant price of $11.23 to certain executive officers of NNN.Compensation expense for the grant is based upon the fair value of the grant calculated by athird party using a Monte Carlo Simulation model coupled with a binomial lattice model usingthe following assumptions: (i) average interest rate of 4.43%, (ii) $0.01 increase in annualdividend, (iii) expected life of five years, and (iv) volatility of 21.26%. Volatility is based uponthe historical volatility of NNN’s stock and other factors. The term is assumed to be the vestingdate for each tranche. Vesting of these shares is contingent upon achievement of certainperformance goals by January 1, 2010. As of December 31, 2007, 15,309 of these shares havevested as a result of the achievement of certain of these performance goals.
The following summarizes other grants made during the year ended December 31, 2007,pursuant to the 2000 Plan.
Shares
WeightedAverage
Share Price
Other share grants under the 2007 Plan:Directors’ fees 7,750 23.54Deferred Directors’ fees 16,346 23.59Non-restricted grant 4,400 24.70
28,496 23.75
Shares available under the 2007 Plan for grant, end of period 2,964,191
The total compensation cost for share-based payments for the years ended December 31, 2007,2006 and 2005, totaled $2,583,000, $3,766,000 and $2,156,000, respectively, of suchcompensation expense. At December 31, 2007, NNN had $5,321,000 of unrecognizedcompensation cost related to non-vested share-based compensation arrangements under the2007 Plan. This cost is expected to be recognized over a weighted average period of 3.1 years.
Note 22 – Business Combinations:
Orange Avenue Mortgage Investments, Inc. – On May 2, 2005, NNN exercised its option toacquire 78.9 percent of the common shares of OAMI for $9,379,000. In December 2004,OAMI sold its loan origination, securitization and servicing operations and the majority of itsassets and liabilities to a third party, resulting in OAMI becoming a passive owner in a pool ofseven commercial real estate loan securitization residual interests. The loans in each of thesecuritizations are secured by first mortgages on commercial real estate and generally borrowerpersonal guarantees. As a result of the option exercise, NNN has consolidated OAMI in itsconsolidated financial statements.
87
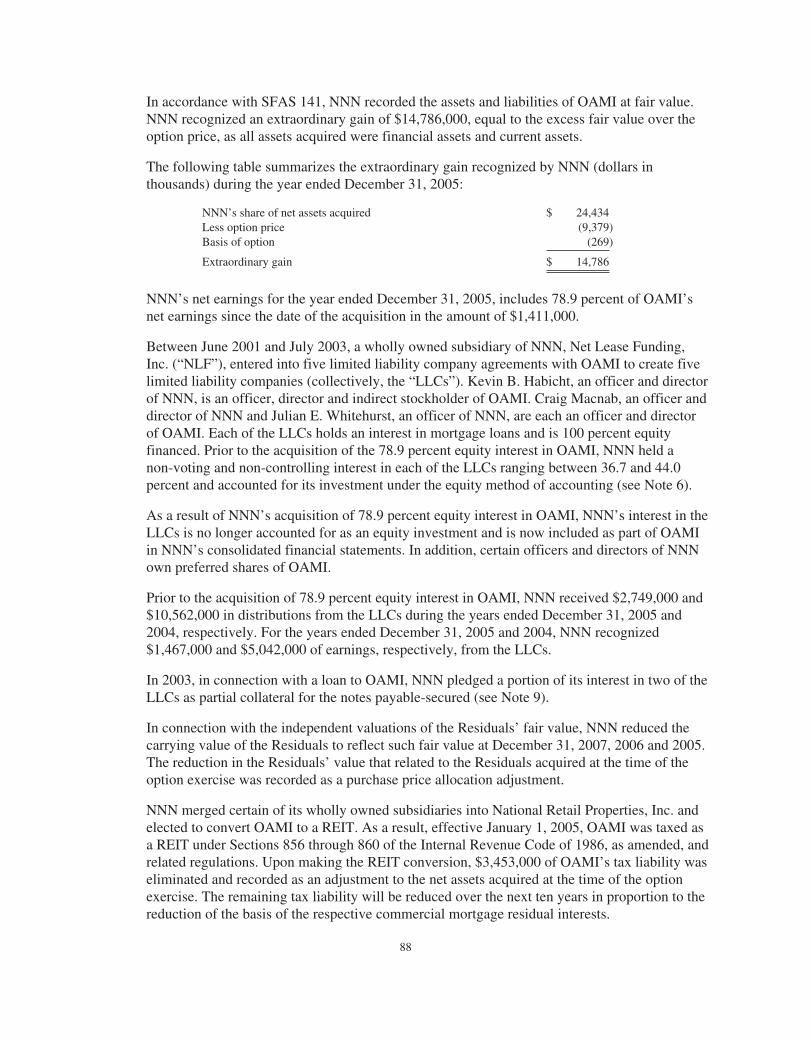
In accordance with SFAS 141, NNN recorded the assets and liabilities of OAMI at fair value.NNN recognized an extraordinary gain of $14,786,000, equal to the excess fair value over theoption price, as all assets acquired were financial assets and current assets.
The following table summarizes the extraordinary gain recognized by NNN (dollars inthousands) during the year ended December 31, 2005:
NNN’s share of net assets acquired $ 24,434Less option price (9,379)Basis of option (269)
Extraordinary gain $ 14,786
NNN’s net earnings for the year ended December 31, 2005, includes 78.9 percent of OAMI’snet earnings since the date of the acquisition in the amount of $1,411,000.
Between June 2001 and July 2003, a wholly owned subsidiary of NNN, Net Lease Funding,Inc. (“NLF”), entered into five limited liability company agreements with OAMI to create fivelimited liability companies (collectively, the “LLCs”). Kevin B. Habicht, an officer and directorof NNN, is an officer, director and indirect stockholder of OAMI. Craig Macnab, an officer anddirector of NNN and Julian E. Whitehurst, an officer of NNN, are each an officer and directorof OAMI. Each of the LLCs holds an interest in mortgage loans and is 100 percent equityfinanced. Prior to the acquisition of the 78.9 percent equity interest in OAMI, NNN held anon-voting and non-controlling interest in each of the LLCs ranging between 36.7 and 44.0percent and accounted for its investment under the equity method of accounting (see Note 6).
As a result of NNN’s acquisition of 78.9 percent equity interest in OAMI, NNN’s interest in theLLCs is no longer accounted for as an equity investment and is now included as part of OAMIin NNN’s consolidated financial statements. In addition, certain officers and directors of NNNown preferred shares of OAMI.
Prior to the acquisition of 78.9 percent equity interest in OAMI, NNN received $2,749,000 and$10,562,000 in distributions from the LLCs during the years ended December 31, 2005 and2004, respectively. For the years ended December 31, 2005 and 2004, NNN recognized$1,467,000 and $5,042,000 of earnings, respectively, from the LLCs.
In 2003, in connection with a loan to OAMI, NNN pledged a portion of its interest in two of theLLCs as partial collateral for the notes payable-secured (see Note 9).
In connection with the independent valuations of the Residuals’ fair value, NNN reduced thecarrying value of the Residuals to reflect such fair value at December 31, 2007, 2006 and 2005.The reduction in the Residuals’ value that related to the Residuals acquired at the time of theoption exercise was recorded as a purchase price allocation adjustment.
NNN merged certain of its wholly owned subsidiaries into National Retail Properties, Inc. andelected to convert OAMI to a REIT. As a result, effective January 1, 2005, OAMI was taxed asa REIT under Sections 856 through 860 of the Internal Revenue Code of 1986, as amended, andrelated regulations. Upon making the REIT conversion, $3,453,000 of OAMI’s tax liability waseliminated and recorded as an adjustment to the net assets acquired at the time of the optionexercise. The remaining tax liability will be reduced over the next ten years in proportion to thereduction of the basis of the respective commercial mortgage residual interests.
88

National Properties Corporation – On June 16, 2005, NNN acquired 100 percent of NationalProperties Corporation (“NAPE”), a publicly traded company, which owned 43 freestandingproperties located in 12 states. Results of NAPE operations have been included in theconsolidated financial statements since the date of acquisition. NAPE stockholders received1,636,532 newly issued shares of NNN’s common stock.
NNN’s net earnings for the year ended December 31, 2005, includes NAPE’s net earningssince the date of acquisition in the amount of $1,867,000.
Note 23 – Fair Value of Financial Instruments:
NNN believes the carrying value of its Credit Facility approximates fair value based upon itsnature, terms and variable interest rate. NNN believes that the carrying value of its cash andcash equivalents, restricted cash, mortgages, notes and accrued interest receivable, receivables,mortgages payable, note payable – secured, accrued interest payable, financing lease obligationand other liabilities at December 31, 2007 and 2006, approximate fair value based upon currentmarket prices of similar issues. At December 31, 2007 and 2006, the fair value of NNN’s notesand convertible notes, collectively, was $921,507, 000 and $690,198,000, respectively, basedupon the quoted market price.
Note 24 – Related Party Transactions:
For additional related party disclosures see Note 4 and Note 22.
In June 2005, James M. Seneff, Jr. and Robert A. Bourne each retired from the Board ofDirectors (“Retired Directors”).
NNN has revolving lines of credit with the TRS that allow for an aggregate borrowing capacityof $280,000,000, as of December 31, 2007. The lines of credit each bear interest at 75 percentof the Prime rate plus 4.10% per annum and expire on May 8, 2009 and are secured by a pledgeof the real estate and/or the other assets owned by the respective borrower. The outstandingaggregate principal balance of the lines of credit at December 31, 2007 and 2006 was$220,515,000 and $208,395,000, and bore interest at a rate of 9.54% and 10.29%, respectively.In connection with the lines of credit from the TRS, NNN earned $15,851,000, $16,287,000and $3,511,000 in interest and fees during the years ended December 31, 2007, 2006 and 2005,respectively, each of which was eliminated in consolidation.
In 2005, NNN provided disposition and development services to an affiliate of the RetiredDirectors. In connection therewith, NNN received an aggregate of $886,000 in fees during theyears ended December 31, 2005. There were no fees recognized during the years endedDecember 31, 2007 and 2006.
In 2002, NNN extended the maturity dates to dates between June and December 2007 of fourmortgages securing an original aggregate principal indebtedness totaling $8,514,000 fromaffiliates of the Retired Directors. In June 2005, NNN received the outstanding principalbalance for three of the mortgage loans. In July 2005, NNN received the entire outstandingprincipal balance for the remaining mortgage loan. In connection therewith, NNN recorded$96,000, as interest and other income from real estate transactions during the year endedDecember 31, 2005.
89
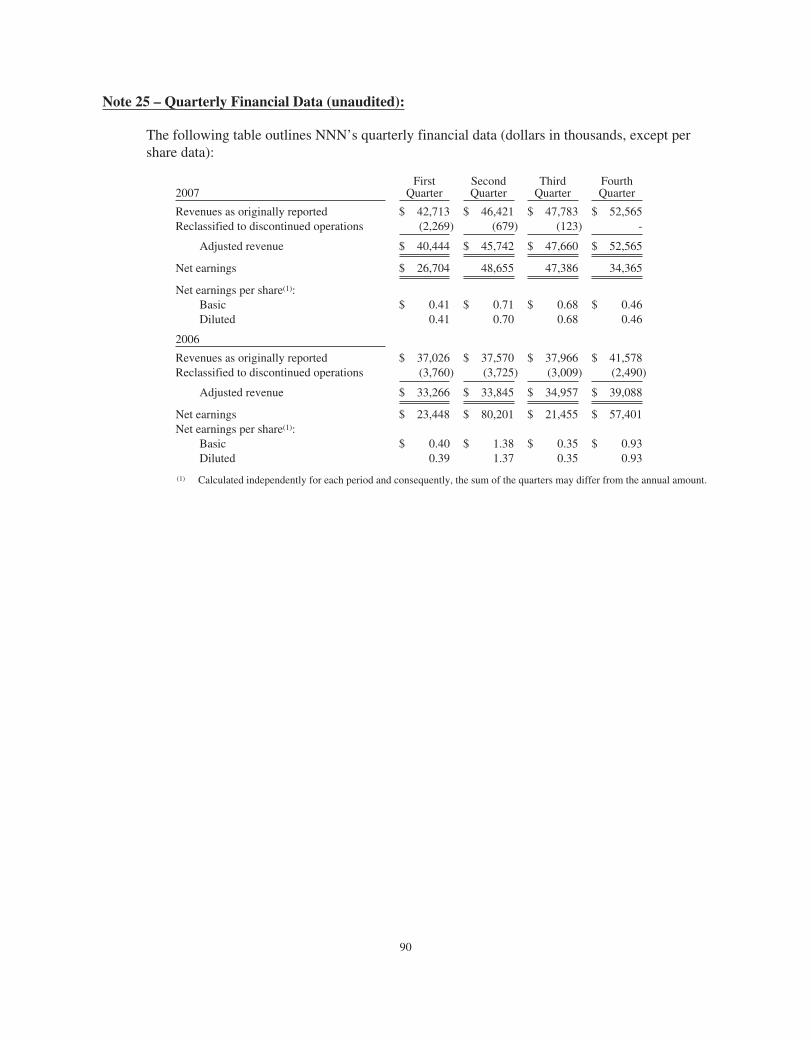
Note 25 – Quarterly Financial Data (unaudited):
The following table outlines NNN’s quarterly financial data (dollars in thousands, except pershare data):
2007First
QuarterSecondQuarter
ThirdQuarter
FourthQuarter
Revenues as originally reported $ 42,713 $ 46,421 $ 47,783 $ 52,565Reclassified to discontinued operations (2,269) (679) (123) -
Adjusted revenue $ 40,444 $ 45,742 $ 47,660 $ 52,565
Net earnings $ 26,704 48,655 47,386 34,365
Net earnings per share(1):Basic $ 0.41 $ 0.71 $ 0.68 $ 0.46Diluted 0.41 0.70 0.68 0.46
2006
Revenues as originally reported $ 37,026 $ 37,570 $ 37,966 $ 41,578Reclassified to discontinued operations (3,760) (3,725) (3,009) (2,490)
Adjusted revenue $ 33,266 $ 33,845 $ 34,957 $ 39,088
Net earnings $ 23,448 $ 80,201 $ 21,455 $ 57,401Net earnings per share(1):
Basic $ 0.40 $ 1.38 $ 0.35 $ 0.93Diluted 0.39 1.37 0.35 0.93
(1) Calculated independently for each period and consequently, the sum of the quarters may differ from the annual amount.
90
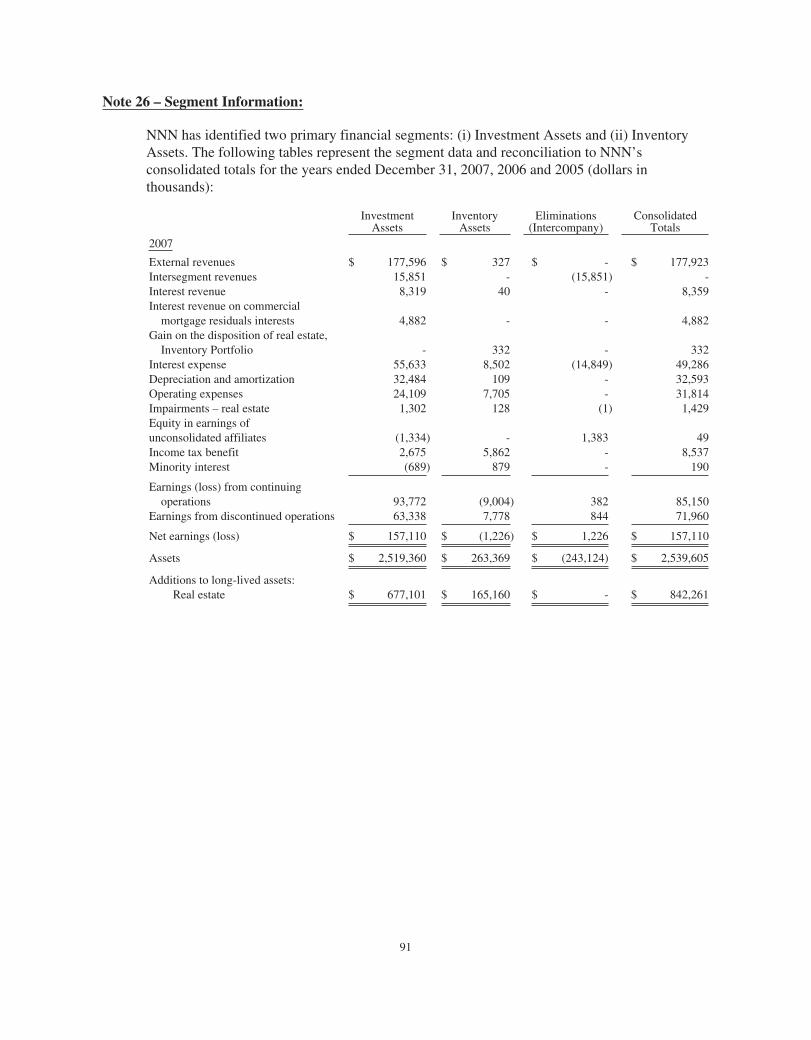
Note 26 – Segment Information:
NNN has identified two primary financial segments: (i) Investment Assets and (ii) InventoryAssets. The following tables represent the segment data and reconciliation to NNN’sconsolidated totals for the years ended December 31, 2007, 2006 and 2005 (dollars inthousands):
InvestmentAssets
InventoryAssets
Eliminations(Intercompany)
ConsolidatedTotals
2007
External revenues $ 177,596 $ 327 $ - $ 177,923Intersegment revenues 15,851 - (15,851) -Interest revenue 8,319 40 - 8,359Interest revenue on commercial
mortgage residuals interests 4,882 - - 4,882Gain on the disposition of real estate,
Inventory Portfolio - 332 - 332Interest expense 55,633 8,502 (14,849) 49,286Depreciation and amortization 32,484 109 - 32,593Operating expenses 24,109 7,705 - 31,814Impairments – real estate 1,302 128 (1) 1,429Equity in earnings ofunconsolidated affiliates (1,334) - 1,383 49Income tax benefit 2,675 5,862 - 8,537Minority interest (689) 879 - 190
Earnings (loss) from continuingoperations 93,772 (9,004) 382 85,150
Earnings from discontinued operations 63,338 7,778 844 71,960
Net earnings (loss) $ 157,110 $ (1,226) $ 1,226 $ 157,110
Assets $ 2,519,360 $ 263,369 $ (243,124) $ 2,539,605
Additions to long-lived assets:Real estate $ 677,101 $ 165,160 $ - $ 842,261
91
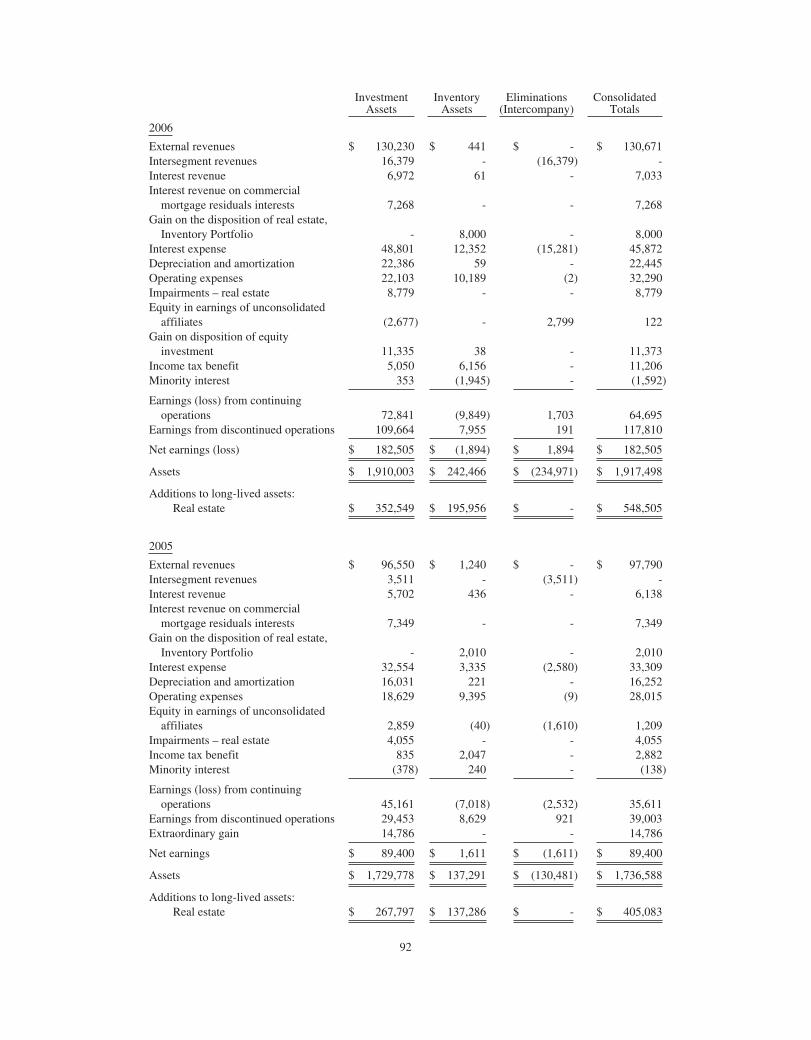
InvestmentAssets
InventoryAssets
Eliminations(Intercompany)
ConsolidatedTotals
2006
External revenues $ 130,230 $ 441 $ - $ 130,671Intersegment revenues 16,379 - (16,379) -Interest revenue 6,972 61 - 7,033Interest revenue on commercial
mortgage residuals interests 7,268 - - 7,268Gain on the disposition of real estate,
Inventory Portfolio - 8,000 - 8,000Interest expense 48,801 12,352 (15,281) 45,872Depreciation and amortization 22,386 59 - 22,445Operating expenses 22,103 10,189 (2) 32,290Impairments – real estate 8,779 - - 8,779Equity in earnings of unconsolidated
affiliates (2,677) - 2,799 122Gain on disposition of equity
investment 11,335 38 - 11,373Income tax benefit 5,050 6,156 - 11,206Minority interest 353 (1,945) - (1,592)
Earnings (loss) from continuingoperations 72,841 (9,849) 1,703 64,695
Earnings from discontinued operations 109,664 7,955 191 117,810
Net earnings (loss) $ 182,505 $ (1,894) $ 1,894 $ 182,505
Assets $ 1,910,003 $ 242,466 $ (234,971) $ 1,917,498
Additions to long-lived assets:Real estate $ 352,549 $ 195,956 $ - $ 548,505
2005
External revenues $ 96,550 $ 1,240 $ - $ 97,790Intersegment revenues 3,511 - (3,511) -Interest revenue 5,702 436 - 6,138Interest revenue on commercial
mortgage residuals interests 7,349 - - 7,349Gain on the disposition of real estate,
Inventory Portfolio - 2,010 - 2,010Interest expense 32,554 3,335 (2,580) 33,309Depreciation and amortization 16,031 221 - 16,252Operating expenses 18,629 9,395 (9) 28,015Equity in earnings of unconsolidated
affiliates 2,859 (40) (1,610) 1,209Impairments – real estate 4,055 - - 4,055Income tax benefit 835 2,047 - 2,882Minority interest (378) 240 - (138)
Earnings (loss) from continuingoperations 45,161 (7,018) (2,532) 35,611
Earnings from discontinued operations 29,453 8,629 921 39,003Extraordinary gain 14,786 - - 14,786
Net earnings $ 89,400 $ 1,611 $ (1,611) $ 89,400
Assets $ 1,729,778 $ 137,291 $ (130,481) $ 1,736,588
Additions to long-lived assets:Real estate $ 267,797 $ 137,286 $ - $ 405,083
92
Note 27 – Major Tenants:
In the year ended December 31, 2005, NNN recorded rental and earned income from one of itstenants, the United States of America, of $18,827,000. The rental and earned income from theUnited States of America represented more than 10 percent of NNN’s rental and earned incomefor the year ended December 2005. As of December 31, 2007 and 2006, NNN did not have anyone tenant that accounts for ten percent or more of its rental and earned income.
Note 28 – Commitments and Contingencies:
As of December 31, 2007, NNN had letters of credit totaling $2,685,000 outstanding under itsCredit Facility.
In the ordinary course of its business, NNN is a party to various other legal actions whichmanagement believes is routine in nature and incidental to the operation of the business ofNNN. Management believes that the outcome of the proceedings will not have a materialadverse effect upon its operations, financial condition or liquidity.
93
Item 9. Changes in and Disagreements With Accountants on Accounting and FinancialDisclosure
None.
Item 9A. Controls and Procedures
Process for Assessment and Evaluation of Disclosure Controls and Procedures and Internal Controlover Financing Reporting.
NNN carried out an assessment as of December 31, 2007 of the effectiveness of the design andoperation of its disclosure controls and procedures and its internal control over financial reporting. Thisassessment was done under the supervision and with the participation of management, includingNNN’s Chief Executive Officer and Chief Financial Officer. Rules adopted by the Commission requireNNN to present the conclusions of the Chief Executive Officer and Chief Financial Officer about theeffectiveness of NNN’s disclosure controls and procedures and the conclusions of NNN’s managementabout the effectiveness of NNN’s internal control over financial reporting as of the end of the periodcovered by this annual report.
CEO and CFO Certifications. Included as Exhibits 31.1 and 31.2 to this Annual Report on Form 10-Kare forms of “Certification” of NNN’s Chief Executive Officer and Chief Financial Officer. The formsof Certification are required in accordance with Section 302 of the Sarbanes-Oxley Act of 2002. Thissection of the Annual Report on Form 10-K that you are currently reading is the informationconcerning the assessment referred to in the Section 302 certifications and this information should beread in conjunction with the Section 302 certifications for a more complete understanding of the topicspresented.
Disclosure Controls and Procedures and Internal Control over Financial Reporting. Disclosurecontrols and procedures are designed with the objective of providing reasonable assurance thatinformation required to be disclosed in NNN’s reports filed or submitted under the Exchange Act, suchas this Annual Report on Form 10-K, is recorded, processed, summarized and reported within the timeperiods specified in the Commission’s rules and forms. Disclosure controls and procedures are alsodesigned with the objective of providing reasonable assurance that such information is accumulatedand communicated to NNN’s management, including the Chief Executive Officer and Chief FinancialOfficer, as appropriate, to allow timely decisions regarding required disclosure.
Internal control over financial reporting is a process designed by, or under the supervision of, NNN’sChief Executive Officer and Chief Financial Officer, and affected by NNN’s Board of Directors,management and other personnel, to provide reasonable assurance regarding the reliability of financialreporting and the preparation of financial statements for external purposes in accordance with generallyaccepted accounting principles (“GAAP”) and includes those policies and procedures that:
• pertain to the maintenance of records that in reasonable detail accurately and fairly reflectthe transactions and dispositions of NNN’s assets;
• provide reasonable assurance that transactions are recorded as necessary to permitpreparation of financial statements in accordance with generally accepted accountingprinciples, and that NNN’s receipts and expenditures are being made in accordance withauthorizations of management or the Board of Directors; and
• provide reasonable assurance regarding prevention or timely detection of unauthorizedacquisition, use or disposition of NNN’s assets that could have a material adverse effect onNNN’s financial statements.
94
Scope of the Assessments. The assessment by NNN’s Chief Executive Officer and Chief FinancialOfficer of NNN’s disclosure controls and procedures and the assessment by NNN’s management,including NNN’s Chief Executive Officer and Chief Financial Officer, of NNN’s internal control overfinancial reporting included a review of procedures and discussions with NNN’s management andothers at NNN. In the course of the assessments, NNN sought to identify data errors, control problemsor acts of fraud and to confirm that appropriate corrective action, including process improvements,were being undertaken.
NNN’s internal control over financial reporting is also assessed on an ongoing basis by personnel inNNN’s Accounting department and by NNN’s internal auditors in connection with their internal auditactivities. The overall goals of these various assessment activities are to monitor NNN’s disclosurecontrols and procedures and NNN’s internal control over financial reporting and to make modificationsas necessary. NNN’s intent in this regard is that the disclosure controls and procedures and the internalcontrol over financial reporting will be maintained and updated (including with improvements andcorrections) as conditions warrant. Management also sought to deal with other control matters in theassessment, and in each case if a problem was identified, management considered what revision,improvement and/or correction was necessary to be made in accordance with NNN’s on-goingprocedures. The assessments of NNN’s disclosure controls and procedures and NNN’s internal controlover financial reporting is done on a quarterly basis so that the conclusions concerning effectiveness ofthose controls can be reported in NNN’s Quarterly Reports on Form 10-Q and Annual Report on Form10-K.
Assessment of Effectiveness of Disclosure Controls and Procedures.
Based upon the assessments, NNN’s Chief Executive Officer and Chief Financial Officer haveconcluded that, as of December 31, 2007, NNN’s disclosure controls and procedures were effective.
Management’s Report on Internal Control over Financial Reporting.
Management, including NNN’s Chief Executive Officer and Chief Financial Officer, are responsiblefor establishing and maintaining adequate internal control over financial reporting for NNN.Management used the criteria issued by the Committee of Sponsoring Organizations of the TreadwayCommission in Internal Control—Integrated Framework to assess the effectiveness of NNN’s internalcontrol over financial reporting. Based upon the assessments, NNN’s Chief Executive Officer andChief Financial Officer have concluded that, as of December 31, 2007, NNN’s internal control overfinancial reporting was effective. NNN’s independent registered public accounting firm has audited theconsolidated financial statements in this Annual Report on Form 10-K and have issued an attestationreport on management’s assessment of NNN’s internal control over financial reporting and its opinionon the effectiveness of internal control over financial reporting, which appears in this Annual Reporton Form 10-K.
Changes in Internal Control over Financial Reporting.
During the three months ended December 31, 2007, there were no changes in NNN’s internal controlover financial reporting that has materially affected, or are reasonably likely to materially affect,NNN’s internal control for financial reporting.
95
Limitations on the Effectiveness of Controls.
Management, including NNN’s Chief Executive Officer and Chief Financial Officer, do not expect thatNNN’s disclosure controls and procedures or NNN’s internal control over financial reporting willprevent all errors and all fraud. A control system, no matter how well conceived and operated, canprovide only reasonable, not absolute, assurance that the objectives of the control system are met.Further, the design of a control system must reflect the fact that there are resource constraints, and thebenefits of controls must be considered relative to their costs. Because of the inherent limitations in allcontrol systems, no evaluation of controls can provide absolute assurance that all control issues andinstances of fraud, if any, within NNN have been detected. These inherent limitations include therealities that judgments in decision-making can be faulty, and that breakdowns can occur because ofsimple error or mistake. Additionally, controls can be circumvented by the individual acts of somepersons, by collusion of two or more people, or by management’s override of the control. The designof any system of controls also is based in part upon certain assumptions about the likelihood of futureevents, and there can be no assurance that any design will succeed in achieving its stated goals underall potential future conditions; over time, controls may become inadequate because of changes inconditions, or the degree of compliance with the policies or procedures may deteriorate. Because of theinherent limitations in a cost-effective control system, misstatements due to error or fraud may occurand not be detected.
Item 9B. Other Information.
None.
96
PART III
Item 10. Directors, Executive Officers and Corporate Governance
Reference is made to the Registrant's definitive proxy statement to be filed with the Commissionpursuant to Regulation 14(a); information responsive to this Item is contained in the sections thereofcaptioned “Proposal I: Election of Directors – Nominees,” “Proposal I: Election of Directors –Executive Officers,” “Proposal I: Election of Directors – Code of Business Conduct” and “SecurityOwnership,” and the information in such sections is incorporated herein by reference.
Item 11. Executive Compensation
Reference is made to the Registrant's definitive proxy statement to be filed with the Commissionpursuant to Regulation 14(a); information responsive to this Item is contained in the sections thereofcaptioned “Proposal I: Election of Directors – Compensation of Directors,” “Executive Compensation”and “Compensation Committee Report,” and the information in such sections are incorporated hereinby reference.
Item 12. Security Ownership of Certain Beneficial Owners and Management and RelatedStockholder Matters
Reference is made to the Registrant's definitive proxy statement to be filed with the Commissionpursuant to Regulation 14(a); information responsive to this Item is contained in the section thereofcaptioned “Executive Compensation – Equity Compensation Plan Information,” and “SecurityOwnership,” and the information in such sections are incorporated herein by reference.
Item 13. Certain Relationships and Related Transactions, and Director Independence
Reference is made to the Registrant's definitive proxy statement to be filed with the Commissionpursuant to Regulation 14(a); information responsive to this Item is contained in the section thereofcaptioned “Certain Transactions and the information in such section is incorporated herein byreference.
Item 14. Principal Accountant Fees and Services
Reference is made to the Registrant's definitive proxy statement to be filed with the Commissionpursuant to Regulation 14(a); information responsive to this Item is contained in the section thereofcaptioned “Audit Committee Report,” and the information in such section is incorporated herein byreference.
97
PART IV
Item 15. Exhibits and Financial Statement Schedules
(a) The following documents are filed as part of this report.
(1) Financial Statements
Reports of Independent Registered Public Accounting Firm
Consolidated Balance Sheets as of December 31, 2007 and 2006
Consolidated Statements of Earnings for the years ended December 31, 2007, 2006 and2005
Consolidated Statements of Stockholders' Equity for the years ended December 31, 2007,2006 and 2005
Consolidated Statements of Cash Flows for the years ended December 31, 2007, 2006 and2005
Notes to Consolidated Financial Statements
(2) Financial Statement Schedules
Schedule III – Real Estate and Accumulated Depreciation and Amortization and Notes asof December 31, 2007
Schedule IV – Mortgage Loans on Real Estate and Notes as of December 31, 2007
All other schedules are omitted because they are not applicable or because the requiredinformation is shown in the financial statements or the notes thereto.
(3) Exhibits
The following exhibits are filed as a part of this report.
3. Articles of Incorporation and By-laws
3.1 First Amended and Restated Articles of Incorporation of the Registrant, asamended (filed as Exhibit 3.1 to the Registrant’s Current Report on Form8-K dated May 1, 2006, and incorporated herein by reference).
3.2 Articles Supplementary Establishing and Fixing the Rights and Preferencesof 7.375% Series C Cumulative Preferred Stock, par value $0.01 per share,dated October 11, 2006 (filed as Exhibit 3.2 to the Registrant’s Form 8-Adated October 11, 2006 and filed with the Securities and ExchangeCommission on October 12, 2006, and incorporated herein by reference).
3.3 Third Amended and Restated Bylaws of the Registrant, as amended (filedas Exhibit 3.2 to the Registrant's Current Report on Form 8-K dated May 1,2006, and incorporated herein by reference).
98
4. Instruments Defining the Rights of Security Holders, Including Indentures
4.1 Specimen Certificate of Common Stock, par value $0.01 per share, of theRegistrant (filed as Exhibit 3.4 to the Registrant's Registration StatementNo. 1-11290 on Form 8-B and incorporated herein by reference).
4.2 Indenture, dated as of March 25, 1998, between the Registrant and FirstUnion National Bank, as trustee (filed as Exhibit 4.4 to the Registrant’sForm S-3 (Registration No. 333-132095) filed with the Securities andExchange Commission on February 28, 2006, and incorporated herein byreference).
4.3 Form of Supplemental Indenture No. 1 dated March 25, 1998, by andamong Registrant and First Union National Bank, Trustee, relating to$100,000,000 of 7.125% Notes due 2008 (filed as Exhibit 4.2 to theRegistrant’s Current Report on Form 8-K dated March 20, 1998, andincorporated herein by reference).
4.4 Form of 7.125% Note due 2008 (filed as Exhibit 4.3 to the Registrant’sCurrent Report on Form 8-K dated March 20, 1998, and incorporated hereinby reference).
4.5 Form of Supplemental Indenture No. 3 dated September 20, 2000, by andamong Registrant and First Union National Bank, Trustee, relating to$20,000,000 of 8.5% Notes due 2010 (filed as Exhibit 4.2 to theRegistrant’s Current Report on Form 8-K dated September 20, 2000, andincorporated herein by reference).
4.6 Form of 8.5% Notes due 2010 (filed as Exhibit 4.3 to the Registrant’sCurrent Report on Form 8-K dated September 20, 2000, and incorporatedherein by reference).
4.7 Form of Supplemental Indenture No. 4 dated as of May 30, 2002, by andamong Registrant and Wachovia Bank, National Association, Trustee,relating to $50,000,000 of 7.75% Notes due 2012 (filed as Exhibit 4.2 to theRegistrant’s Current Report on Form 8-K dated June 4, 2002, andincorporated herein by reference).
4.8 Form of 7.75% Notes due 2012 (filed as Exhibit 4.3 to the Registrant’sCurrent Report on Form 8-K dated June 4, 2002, and incorporated herein byreference).
4.9 Form of Supplemental Indenture No. 5 dated as of June 18, 2004, by andamong Registrant and Wachovia Bank, National Association, Trustee,relating to $150,000,000 of 6.25% Notes due 2014 (filed as Exhibit 4.1 tothe Registrant’s Current Report on Form 8-K dated June 15, 2004, andincorporated herein by reference).
4.10 Form of 6.25% Notes due 2014 (filed as Exhibit 4.2 to the Registrant’sCurrent Report on Form 8-K dated June 15, 2004, and incorporated hereinby reference).
99
4.11 Form of Supplemental Indenture No. 6 dated as of November 17, 2005, byand among Registrant and Wachovia Bank, National Association, Trustee,relating to $150,000,000 of 6.15% Notes due 2015 (filed as Exhibit 4.1 tothe Registrant’s Current Report on Form 8-K dated November 14, 2005,and incorporated herein by reference).
4.12 Seventh Supplemental Indenture, dated as of September 13, 2006, betweenNational Retail Properties, Inc. and U.S. Bank National Association (filedas Exhibit 4.1 to the Registrant’s Current Report on Form 8-K datedSeptember 7, 2006, and incorporated herein by reference).
4.13 Form of 6.15% Notes due 2015 (filed as Exhibit 4.2 to the Registrant’sCurrent Report on Form 8-K dated November 14, 2005, and incorporatedherein by reference).
4.14 Form of 3.95% Convertible Senior Notes due 2026 (filed as Exhibit 4.2 tothe Registrant’s Current Report on Form 8-K dated September 7, 2006, andincorporated herein by reference).
4.15 Specimen certificate representing the 7.375% Series C CumulativeRedeemable Preferred Stock, par value $.01 per share, of the Registrant(filed as Exhibit 4.4 to the Registrant’s Form 8-A dated October 11, 2006and filed with the Securities and Exchange Commission on October 12,2006, and incorporated herein by reference).
4.16 Deposit Agreement, among the Registrant, American Stock Transfer &Trust Company, as Depositary, and the holders of depositary receipts (filedas Exhibit 4.18 to the Registrant’s Form 10-Q filed with the Securities andExchange Commission on November 6, 2006, and incorporated herein byreference).
4.17 Form of 6.875% Notes due 2017 (filed as Exhibit 4.2 to the Registrant’sCurrent Report on Form 8-K dated September 4, 2007 and incorporatedherein by reference).
4.18 Form of Eighth Supplemental Indenture between National Retail Properties,Inc. and U.S. Bank National Association (filed as Exhibit 4.1 toRegistrant’s Current Report on Form 8-K dated September 4, 2007, andincorporated hereby by reference).
10. Material Contracts
10.1 2000 Performance Incentive Plan (filed as Exhibit 99 to the Registrant’sRegistration Statement No. 333-64794 on Form S-8 and incorporated hereinby reference).
10.2 Form of Restricted Stock Agreement between NNN and the Participant ofNNN (filed as Exhibit 10.2 to the Registrant’s Form 10-K dated March 14,2005, and filed with the Securities and Exchange Commission on March 15,2005, and incorporated herein by reference).
100
10.3 Employment Agreement dated May 16, 2006, between the Registrant andCraig Macnab (filed as Exhibit 10.3 to the Registrant’s Form 10-Q filedwith the Securities and Exchange Commission on August 3, 2006, andincorporated herein by reference).
10.4 Employment Agreement dated August 17, 2006, between the Registrant andJulian E. Whitehurst (filed as Exhibit 10.1 to the Registrant’s Form 8-Kdated August 17, 2006, and filed with the Securities and ExchangeCommission on August 22, 2006, and incorporated herein by reference).
10.5 Employment Agreement dated August 17, 2006, as amended, between theRegistrant and Kevin B. Habicht (filed as Exhibit 10.2 to the Registrant’sForm 8-K dated August 17, 2006, and filed with the Securities andExchange Commission on August 22, 2006, and incorporated herein byreference).
10.6 Eighth Amended and Restated Line of Credit and Security Agreement,dated December 13, 2005, by and among Registrant, certain lenders andWachovia Bank, N.A., as the Agent, relating to a $300,000,000 loan (filedas Exhibit 10.1 to the Registrant’s Current Report on Form 8-K datedDecember 15, 2005, and incorporated herein by reference).
10.7 First Amendment to Eighth Amended and Restated Line of Credit andSecurity Agreement, dated February 20, 2007, by and among Registrant,certain lenders and Wachovia Bank, N.A., as the Agent, relating to a$300,000,000 loan (filed as Exhibit 10.8 with the Securities and ExchangeCommission on February 21, 2007, and incorporated herein by reference).
10.8 Employment Agreement dated January 2, 2007, between the Registrant andPaul Bayer (filed herewith).
10.9 Employment Agreement dated January 2, 2007, between Christopher P.Tessitore (filed herewith).
12. Statement of Computation of Ratios of Earnings to Fixed Charges (filed herewith).
21. Subsidiaries of the Registrant (filed herewith).
23. Consent of Independent Accountants
23.1 Ernst & Young LLP dated February 22, 2008 (filed herewith).
23.2 KPMG LLP dated February 22, 2008 (filed herewith).
24. Power of Attorney (included on signature page).
31. Section 302 Certifications
31.1 Certification of Chief Executive Officer pursuant to Rule 13a-14(a) of theSecurities Exchange Act of 1934, as adopted pursuant to Section 302 of theSarbanes-Oxley Act of 2002 (filed herewith).
101
31.2 Certification of Chief Financial Officer pursuant to Rule 13a-14(a) of theSecurities Exchange Act of 1934, as adopted pursuant to Section 302 of theSarbanes-Oxley Act of 2002 (filed herewith).
32. Section 906 Certifications
32.1 Certification of Chief Executive Officer pursuant to 18 U.S.C. Section 1350, asadopted pursuant to Section 906 of the Sarbanes-Oxley Act of 2002 (filedherewith).
32.2 Certification of Chief Financial Officer pursuant to 18 U.S.C. Section 1350, asadopted pursuant to Section 906 of the Sarbanes-Oxley Act of 2002 (filedherewith).
99. Additional Exhibits
99.1 Certification of Chief Executive Officer pursuant to Section 303A.12(a) of theNew York Stock Exchange Listed Company Manual (filed herewith).
102
SIGNATURES
Pursuant to the requirements of Section 13 or 15(d) of the Securities Exchange Act of 1934, theRegistrant has duly caused this report to be signed on its behalf by the undersigned, thereunto dulyauthorized, on the 25th day of February, 2008.
NATIONAL RETAIL PROPERTIES, INC.
By: /s/ Craig MacnabCraig MacnabChairman of the Board andChief Executive Officer
Pursuant to the requirements of the Securities Exchange Act of 1934, this report has been signed belowby the following persons on behalf of the Registrant and in the capacities and on the dates indicated.
Title Date
/s/ Craig MacnabCraig Macnab
Chairman of the Board andChief Executive Officer
February 25, 2008
/s/ Clifford R. Hinkle*Clifford R. Hinkle
Lead Director February 25, 2008
Dennis GershensonDirector February 25, 2008
/s/ Richard B. Jennings*Richard B. Jennings
Director February 25, 2008
/s/ Ted B. Lanier*Ted B. Lanier
Director February 25, 2008
/s/ Robert C. Legler*Robert C. Legler
Director February 25, 2008
/s/ Robert Martinez*Robert Martinez
Director February 25, 2008
/s/ Kevin B. HabichtKevin B. Habicht
Director, Chief FinancialOfficer (Principal Financialand Accounting Officer),Executive Vice President,Assistant Secretary andTreasurer
February 25, 2008
*By: /s/ Craig MacnabCraig MacnabAttorney-in-fact
103
Exhibit Index
3. Articles of Incorporation and By-laws
3.1 First Amended and Restated Articles of Incorporation of the Registrant, asamended (filed as Exhibit 3.1 to the Registrant’s Current Report on Form 8-Kdated May 1, 2006, and incorporated herein by reference).
3.2 Articles Supplementary Establishing and Fixing the Rights and Preferences of7.375% Series C Cumulative Preferred Stock, par value $0.01 per share, datedOctober 11, 2006 (filed as Exhibit 3.2 to the Registrant’s Form 8-A datedOctober 11, 2006 and filed with the Securities and Exchange Commission onOctober 12, 2006, and incorporated herein by reference).
3.3 Third Amended and Restated Bylaws of the Registrant, as amended (filed asExhibit 3.2 to the Registrant's Current Report on Form 8-K dated May 1, 2006,and incorporated herein by reference).
4. Instruments Defining the Rights of Security Holders, Including Indentures
4.1 Specimen Certificate of Common Stock, par value $0.01 per share, of theRegistrant (filed as Exhibit 3.4 to the Registrant's Registration Statement No.1-11290 on Form 8-B and incorporated herein by reference).
4.2 Indenture, dated as of March 25, 1998, between the Registrant and First UnionNational Bank, as trustee (filed as Exhibit 4.4 to the Registrant’s Form S-3(Registration No. 333-132095) filed with the Securities and ExchangeCommission on February 28, 2006, and incorporated herein by reference).
4.3 Form of Supplemental Indenture No. 1 dated March 25, 1998, by and amongRegistrant and First Union National Bank, Trustee, relating to $100,000,000 of7.125% Notes due 2008 (filed as Exhibit 4.2 to the Registrant’s Current Reporton Form 8-K dated March 20, 1998, and incorporated herein by reference).
4.4 Form of 7.125% Note due 2008 (filed as Exhibit 4.3 to the Registrant’s CurrentReport on Form 8-K dated March 20, 1998, and incorporated herein byreference).
4.5 Form of Supplemental Indenture No. 3 dated September 20, 2000, by and amongRegistrant and First Union National Bank, Trustee, relating to $20,000,000 of8.5% Notes due 2010 (filed as Exhibit 4.2 to the Registrant’s Current Report onForm 8-K dated September 20, 2000, and incorporated herein by reference).
4.6 Form of 8.5% Notes due 2010 (filed as Exhibit 4.3 to the Registrant’s CurrentReport on Form 8-K dated September 20, 2000, and incorporated herein byreference).
4.7 Form of Supplemental Indenture No. 4 dated as of May 30, 2002, by and amongRegistrant and Wachovia Bank, National Association, Trustee, relating to
104
$50,000,000 of 7.75% Notes due 2012 (filed as Exhibit 4.2 to the Registrant’sCurrent Report on Form 8-K dated June 4, 2002, and incorporated herein byreference).
4.8 Form of 7.75% Notes due 2012 (filed as Exhibit 4.3 to the Registrant’s CurrentReport on Form 8-K dated June 4, 2002, and incorporated herein by reference).
4.9 Form of Supplemental Indenture No. 5 dated as of June 18, 2004, by and amongRegistrant and Wachovia Bank, National Association, Trustee, relating to$150,000,000 of 6.25% Notes due 2014 (filed as Exhibit 4.1 to the Registrant’sCurrent Report on Form 8-K dated June 15, 2004, and incorporated herein byreference).
4.10 Form of 6.25% Notes due 2014 (filed as Exhibit 4.2 to the Registrant’s CurrentReport on Form 8-K dated June 15, 2004, and incorporated herein by reference).
4.11 Form of Supplemental Indenture No. 6 dated as of November 17, 2005, by andamong Registrant and Wachovia Bank, National Association, Trustee, relating to$150,000,000 of 6.15% Notes due 2015 (filed as Exhibit 4.1 to the Registrant’sCurrent Report on Form 8-K dated November 14, 2005, and incorporated hereinby reference).
4.12 Seventh Supplemental Indenture, dated as of September 13, 2006, betweenNational Retail Properties, Inc. and U.S. Bank National Association (filed asExhibit 4.1 to the Registrant’s Current Report on Form 8-K dated September 7,2006, and incorporated herein by reference).
4.13 Form of 6.15% Notes due 2015 (filed as Exhibit 4.2 to the Registrant’s CurrentReport on Form 8-K dated November 14, 2005, and incorporated herein byreference).
4.14 Form of 3.95% Convertible Senior Notes due 2026 (filed as Exhibit 4.2 to theRegistrant’s Current Report on Form 8-K dated September 7, 2006, andincorporated herein by reference).
4.15 Specimen certificate representing the 7.375% Series C Cumulative RedeemablePreferred Stock, par value $.01 per share, of the Registrant (filed as Exhibit 4.4 tothe Registrant’s Form 8-A dated October 11, 2006 and filed with the Securitiesand Exchange Commission on October 12, 2006, and incorporated herein byreference).
4.16 Deposit Agreement, among the Registrant, American Stock Transfer & TrustCompany, as Depositary, and the holders of depositary receipts (filed as Exhibit4.18 to the Registrant’s Form 10-Q filed with the Securities and ExchangeCommission on November 6, 2006, and incorporated herein by reference).
4.17 Form of 6.875% Notes due 2017 (filed as Exhibit 4.2 to the Registrant’s CurrentReport on Form 8-K dated September 4, 2007 and incorporated herein byreference).
105
4.18 Form of Eighth Supplemental Indenture between National Retail Properties, Inc.and U.S. Bank National Association (filed as Exhibit 4.1 to Registrant’s CurrentReport on Form 8-K dated September 4, 2007, and incorporated hereby byreference).
10. Material Contracts
10.1 2000 Performance Incentive Plan (filed as Exhibit 99 to the Registrant’sRegistration Statement No. 333-64794 on Form S-8 and incorporated herein byreference).
10.2 Form of Restricted Stock Agreement between NNN and the Participant of NNN(filed as Exhibit 10.2 to the Registrant’s Form 10-K dated March 14, 2005, andfiled with the Securities and Exchange Commission on March 15, 2005, andincorporated herein by reference).
10.3 Employment Agreement dated May 16, 2006, between the Registrant and CraigMacnab (filed as Exhibit 10.3 to the Registrant’s Form 10-Q filed with theSecurities and Exchange Commission on August 3, 2006, and incorporated hereinby reference).
10.4 Employment Agreement dated August 17, 2006, between the Registrant andJulian E. Whitehurst (filed as Exhibit 10.1 to the Registrant’s Form 8-K datedAugust 17, 2006, and filed with the Securities and Exchange Commission onAugust 22, 2006, and incorporated herein by reference).
10.5 Employment Agreement dated August 17, 2006, as amended, between theRegistrant and Kevin B. Habicht (filed as Exhibit 10.2 to the Registrant’s Form8-K dated August 17, 2006, and filed with the Securities and ExchangeCommission on August 22, 2006, and incorporated herein by reference).
10.6 Eighth Amended and Restated Line of Credit and Security Agreement, datedDecember 13, 2005, by and among Registrant, certain lenders and WachoviaBank, N.A., as the Agent, relating to a $300,000,000 loan (filed as Exhibit 10.1 tothe Registrant’s Current Report on Form 8-K dated December 15, 2005, andincorporated herein by reference).
10.7 First Amendment to Eighth Amended and Restated Line of Credit and SecurityAgreement, dated February 20, 2007, by and among Registrant, certain lendersand Wachovia Bank, N.A., as the Agent, relating to a $300,000,000 loan (filed asExhibit 10.8 with the Securities and Exchange Commission on February 21,2007, and incorporated herein by reference).
10.8 Employment Agreement dated January 2, 2007, between the Registrant and PaulBayer (filed herewith).
10.9 Employment Agreement dated January 2, 2007, between Christopher P. Tessitore(filed herewith).
106
12. Statement of Computation of Ratios of Earnings to Fixed Charges (filed herewith).
21. Subsidiaries of the Registrant (filed herewith).
23. Consent of Independent Accountants
23.1 Ernst & Young LLP dated February 22, 2008 (filed herewith).
23.2 KPMG LLP dated February 22, 2008 (filed herewith).
24. Power of Attorney (included on signature page).
31. Section 302 Certifications
31.1 Certification of Chief Executive Officer pursuant to Rule 13a-14(a) of theSecurities Exchange Act of 1934, as adopted pursuant to Section 302 of theSarbanes-Oxley Act of 2002 (filed herewith).
31.2 Certification of Chief Financial Officer pursuant to Rule 13a-14(a) of theSecurities Exchange Act of 1934, as adopted pursuant to Section 302 of theSarbanes-Oxley Act of 2002 (filed herewith).
32. Section 906 Certifications
32.1 Certification of Chief Executive Officer pursuant to 18 U.S.C. Section 1350, asadopted pursuant to Section 906 of the Sarbanes-Oxley Act of 2002 (filedherewith).
32.2 Certification of Chief Financial Officer pursuant to 18 U.S.C. Section 1350, asadopted pursuant to Section 906 of the Sarbanes-Oxley Act of 2002 (filedherewith).
99. Additional Exhibits
99.1 Certification of Chief Executive Officer pursuant to Section 303A.12(a) of theNew York Stock Exchange Listed Company Manual (filed herewith).
107
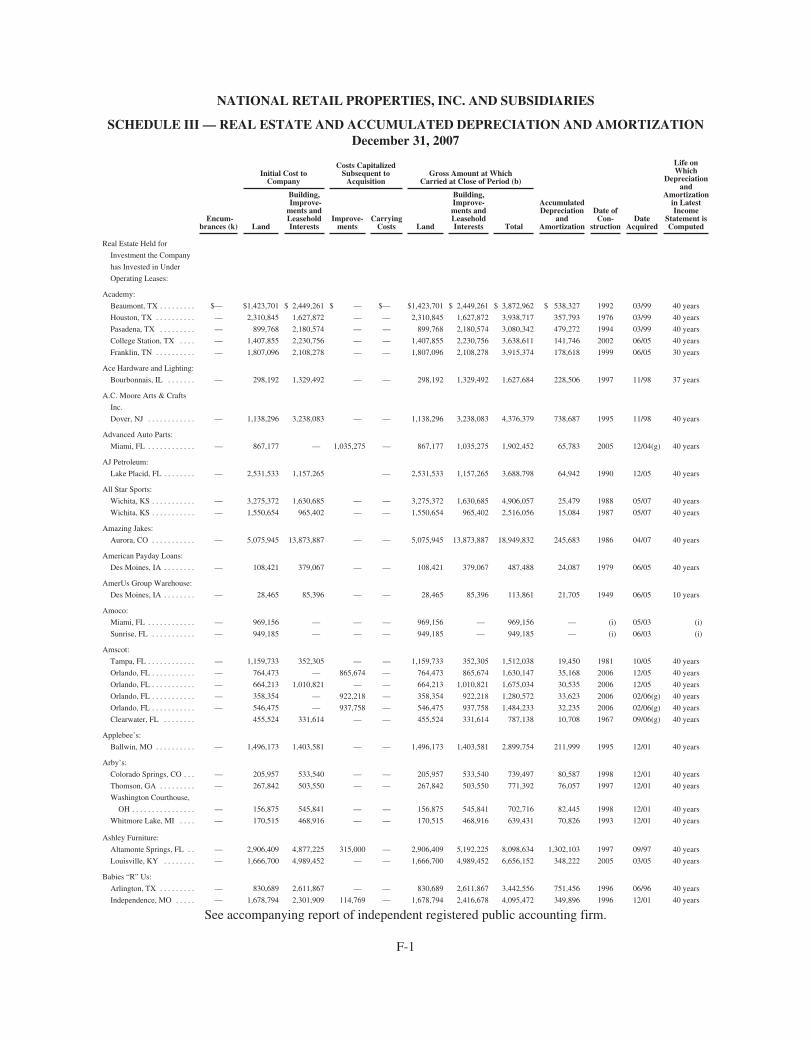
NATIONAL RETAIL PROPERTIES, INC. AND SUBSIDIARIES
SCHEDULE III — REAL ESTATE AND ACCUMULATED DEPRECIATION AND AMORTIZATIONDecember 31, 2007
Encum-brances (k)
Initial Cost toCompany
Costs CapitalizedSubsequent to
AcquisitionGross Amount at Which
Carried at Close of Period (b)
AccumulatedDepreciation
andAmortization
Date ofCon-
structionDate
Acquired
Life onWhich
Depreciationand
Amortizationin LatestIncome
Statement isComputedLand
Building,Improve-
ments andLeaseholdInterests
Improve-ments
CarryingCosts Land
Building,Improve-ments andLeaseholdInterests Total
Real Estate Held for
Investment the Company
has Invested in Under
Operating Leases:
Academy:
Beaumont, TX . . . . . . . . . $— $1,423,701 $ 2,449,261 $ — $— $1,423,701 $ 2,449,261 $ 3,872,962 $ 538,327 1992 03/99 40 years
Houston, TX . . . . . . . . . . — 2,310,845 1,627,872 — — 2,310,845 1,627,872 3,938,717 357,793 1976 03/99 40 years
Pasadena, TX . . . . . . . . . — 899,768 2,180,574 — — 899,768 2,180,574 3,080,342 479,272 1994 03/99 40 years
College Station, TX . . . . — 1,407,855 2,230,756 — — 1,407,855 2,230,756 3,638,611 141,746 2002 06/05 40 years
Franklin, TN . . . . . . . . . . — 1,807,096 2,108,278 — — 1,807,096 2,108,278 3,915,374 178,618 1999 06/05 30 years
Ace Hardware and Lighting:
Bourbonnais, IL . . . . . . . — 298,192 1,329,492 — — 298,192 1,329,492 1,627,684 228,506 1997 11/98 37 years
A.C. Moore Arts & Crafts
Inc.
Dover, NJ . . . . . . . . . . . . — 1,138,296 3,238,083 — — 1,138,296 3,238,083 4,376,379 738,687 1995 11/98 40 years
Advanced Auto Parts:
Miami, FL . . . . . . . . . . . . — 867,177 — 1,035,275 — 867,177 1,035,275 1,902,452 65,783 2005 12/04(g) 40 years
AJ Petroleum:
Lake Placid, FL . . . . . . . . — 2,531,533 1,157,265 — 2,531,533 1,157,265 3,688,798 64,942 1990 12/05 40 years
All Star Sports:
Wichita, KS . . . . . . . . . . . — 3,275,372 1,630,685 — — 3,275,372 1,630,685 4,906,057 25,479 1988 05/07 40 years
Wichita, KS . . . . . . . . . . . — 1,550,654 965,402 — — 1,550,654 965,402 2,516,056 15,084 1987 05/07 40 years
Amazing Jakes:
Aurora, CO . . . . . . . . . . . — 5,075,945 13,873,887 — — 5,075,945 13,873,887 18,949,832 245,683 1986 04/07 40 years
American Payday Loans:
Des Moines, IA . . . . . . . . — 108,421 379,067 — — 108,421 379,067 487,488 24,087 1979 06/05 40 years
AmerUs Group Warehouse:
Des Moines, IA . . . . . . . . — 28,465 85,396 — — 28,465 85,396 113,861 21,705 1949 06/05 10 years
Amoco:
Miami, FL . . . . . . . . . . . . — 969,156 — — — 969,156 — 969,156 — (i) 05/03 (i)
Sunrise, FL . . . . . . . . . . . — 949,185 — — — 949,185 — 949,185 — (i) 06/03 (i)
Amscot:
Tampa, FL . . . . . . . . . . . . — 1,159,733 352,305 — — 1,159,733 352,305 1,512,038 19,450 1981 10/05 40 years
Orlando, FL . . . . . . . . . . . — 764,473 — 865,674 — 764,473 865,674 1,630,147 35,168 2006 12/05 40 years
Orlando, FL . . . . . . . . . . . — 664,213 1,010,821 — — 664,213 1,010,821 1,675,034 30,535 2006 12/05 40 years
Orlando, FL . . . . . . . . . . . — 358,354 — 922,218 — 358,354 922,218 1,280,572 33,623 2006 02/06(g) 40 years
Orlando, FL . . . . . . . . . . . — 546,475 — 937,758 — 546,475 937,758 1,484,233 32,235 2006 02/06(g) 40 years
Clearwater, FL . . . . . . . . 455,524 331,614 — — 455,524 331,614 787,138 10,708 1967 09/06(g) 40 years
Applebee’s:
Ballwin, MO . . . . . . . . . . — 1,496,173 1,403,581 — — 1,496,173 1,403,581 2,899,754 211,999 1995 12/01 40 years
Arby’s:
Colorado Springs, CO . . . — 205,957 533,540 — — 205,957 533,540 739,497 80,587 1998 12/01 40 years
Thomson, GA . . . . . . . . . — 267,842 503,550 — — 267,842 503,550 771,392 76,057 1997 12/01 40 years
Washington Courthouse,
OH . . . . . . . . . . . . . . . . — 156,875 545,841 — — 156,875 545,841 702,716 82,445 1998 12/01 40 years
Whitmore Lake, MI . . . . — 170,515 468,916 — — 170,515 468,916 639,431 70,826 1993 12/01 40 years
Ashley Furniture:
Altamonte Springs, FL . . — 2,906,409 4,877,225 315,000 — 2,906,409 5,192,225 8,098,634 1,302,103 1997 09/97 40 years
Louisville, KY . . . . . . . . — 1,666,700 4,989,452 — — 1,666,700 4,989,452 6,656,152 348,222 2005 03/05 40 years
Babies “R” Us:
Arlington, TX . . . . . . . . . — 830,689 2,611,867 — — 830,689 2,611,867 3,442,556 751,456 1996 06/96 40 years
Independence, MO . . . . . — 1,678,794 2,301,909 114,769 — 1,678,794 2,416,678 4,095,472 349,896 1996 12/01 40 years
See accompanying report of independent registered public accounting firm.
F-1
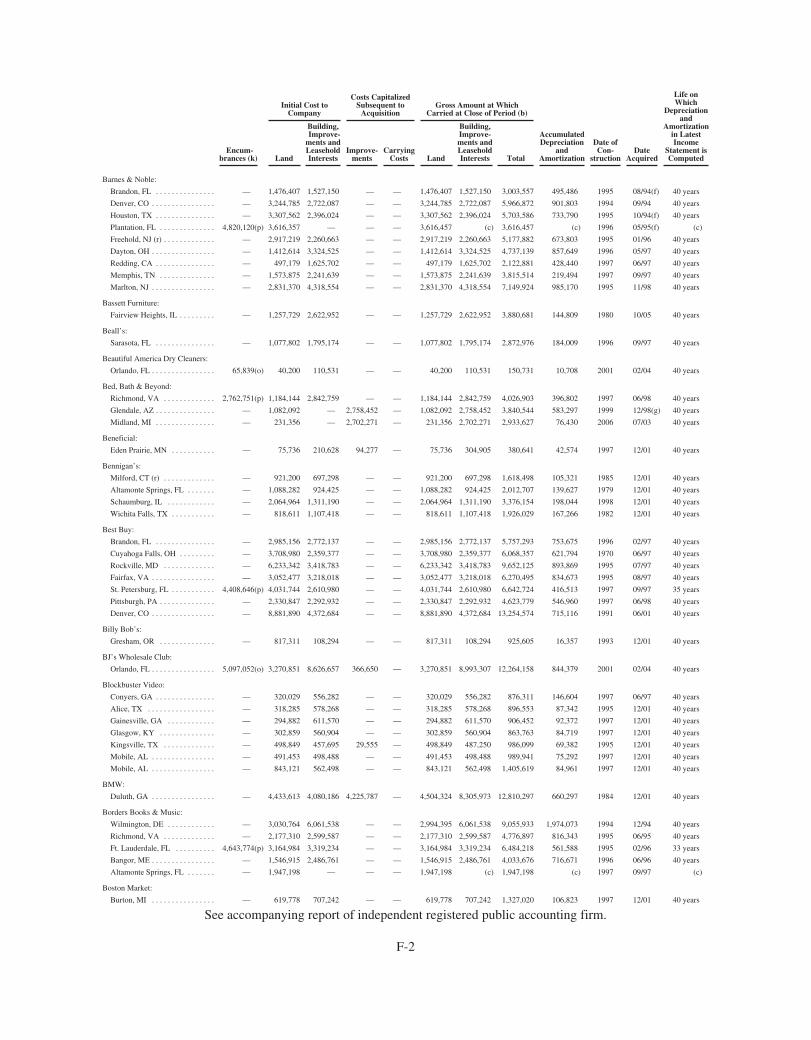
Encum-brances (k)
Initial Cost toCompany
Costs CapitalizedSubsequent to
AcquisitionGross Amount at Which
Carried at Close of Period (b)
AccumulatedDepreciation
andAmortization
Date ofCon-
structionDate
Acquired
Life onWhich
Depreciationand
Amortizationin LatestIncome
Statement isComputedLand
Building,Improve-
ments andLeaseholdInterests
Improve-ments
CarryingCosts Land
Building,Improve-ments andLeaseholdInterests Total
Barnes & Noble:
Brandon, FL . . . . . . . . . . . . . . . — 1,476,407 1,527,150 — — 1,476,407 1,527,150 3,003,557 495,486 1995 08/94(f) 40 years
Denver, CO . . . . . . . . . . . . . . . . — 3,244,785 2,722,087 — — 3,244,785 2,722,087 5,966,872 901,803 1994 09/94 40 years
Houston, TX . . . . . . . . . . . . . . . — 3,307,562 2,396,024 — — 3,307,562 2,396,024 5,703,586 733,790 1995 10/94(f) 40 years
Plantation, FL . . . . . . . . . . . . . . 4,820,120(p) 3,616,357 — — — 3,616,457 (c) 3,616,457 (c) 1996 05/95(f) (c)
Freehold, NJ (r) . . . . . . . . . . . . . — 2,917,219 2,260,663 — — 2,917,219 2,260,663 5,177,882 673,803 1995 01/96 40 years
Dayton, OH . . . . . . . . . . . . . . . . — 1,412,614 3,324,525 — — 1,412,614 3,324,525 4,737,139 857,649 1996 05/97 40 years
Redding, CA . . . . . . . . . . . . . . . — 497,179 1,625,702 — — 497,179 1,625,702 2,122,881 428,440 1997 06/97 40 years
Memphis, TN . . . . . . . . . . . . . . — 1,573,875 2,241,639 — — 1,573,875 2,241,639 3,815,514 219,494 1997 09/97 40 years
Marlton, NJ . . . . . . . . . . . . . . . . — 2,831,370 4,318,554 — — 2,831,370 4,318,554 7,149,924 985,170 1995 11/98 40 years
Bassett Furniture:
Fairview Heights, IL . . . . . . . . . — 1,257,729 2,622,952 — — 1,257,729 2,622,952 3,880,681 144,809 1980 10/05 40 years
Beall’s:
Sarasota, FL . . . . . . . . . . . . . . . — 1,077,802 1,795,174 — — 1,077,802 1,795,174 2,872,976 184,009 1996 09/97 40 years
Beautiful America Dry Cleaners:
Orlando, FL . . . . . . . . . . . . . . . . 65,839(o) 40,200 110,531 — — 40,200 110,531 150,731 10,708 2001 02/04 40 years
Bed, Bath & Beyond:
Richmond, VA . . . . . . . . . . . . . 2,762,751(p) 1,184,144 2,842,759 — — 1,184,144 2,842,759 4,026,903 396,802 1997 06/98 40 years
Glendale, AZ . . . . . . . . . . . . . . . — 1,082,092 — 2,758,452 — 1,082,092 2,758,452 3,840,544 583,297 1999 12/98(g) 40 years
Midland, MI . . . . . . . . . . . . . . . — 231,356 — 2,702,271 — 231,356 2,702,271 2,933,627 76,430 2006 07/03 40 years
Beneficial:
Eden Prairie, MN . . . . . . . . . . . — 75,736 210,628 94,277 — 75,736 304,905 380,641 42,574 1997 12/01 40 years
Bennigan’s:
Milford, CT (r) . . . . . . . . . . . . . — 921,200 697,298 — — 921,200 697,298 1,618,498 105,321 1985 12/01 40 years
Altamonte Springs, FL . . . . . . . — 1,088,282 924,425 — — 1,088,282 924,425 2,012,707 139,627 1979 12/01 40 years
Schaumburg, IL . . . . . . . . . . . . — 2,064,964 1,311,190 — — 2,064,964 1,311,190 3,376,154 198,044 1998 12/01 40 years
Wichita Falls, TX . . . . . . . . . . . — 818,611 1,107,418 — — 818,611 1,107,418 1,926,029 167,266 1982 12/01 40 years
Best Buy:
Brandon, FL . . . . . . . . . . . . . . . — 2,985,156 2,772,137 — — 2,985,156 2,772,137 5,757,293 753,675 1996 02/97 40 years
Cuyahoga Falls, OH . . . . . . . . . — 3,708,980 2,359,377 — — 3,708,980 2,359,377 6,068,357 621,794 1970 06/97 40 years
Rockville, MD . . . . . . . . . . . . . — 6,233,342 3,418,783 — — 6,233,342 3,418,783 9,652,125 893,869 1995 07/97 40 years
Fairfax, VA . . . . . . . . . . . . . . . . — 3,052,477 3,218,018 — — 3,052,477 3,218,018 6,270,495 834,673 1995 08/97 40 years
St. Petersburg, FL . . . . . . . . . . . 4,408,646(p) 4,031,744 2,610,980 — — 4,031,744 2,610,980 6,642,724 416,513 1997 09/97 35 years
Pittsburgh, PA . . . . . . . . . . . . . . — 2,330,847 2,292,932 — — 2,330,847 2,292,932 4,623,779 546,960 1997 06/98 40 years
Denver, CO . . . . . . . . . . . . . . . . — 8,881,890 4,372,684 — — 8,881,890 4,372,684 13,254,574 715,116 1991 06/01 40 years
Billy Bob’s:
Gresham, OR . . . . . . . . . . . . . . — 817,311 108,294 — — 817,311 108,294 925,605 16,357 1993 12/01 40 years
BJ’s Wholesale Club:
Orlando, FL . . . . . . . . . . . . . . . . 5,097,052(o) 3,270,851 8,626,657 366,650 — 3,270,851 8,993,307 12,264,158 844,379 2001 02/04 40 years
Blockbuster Video:
Conyers, GA . . . . . . . . . . . . . . . — 320,029 556,282 — — 320,029 556,282 876,311 146,604 1997 06/97 40 years
Alice, TX . . . . . . . . . . . . . . . . . — 318,285 578,268 — — 318,285 578,268 896,553 87,342 1995 12/01 40 years
Gainesville, GA . . . . . . . . . . . . — 294,882 611,570 — — 294,882 611,570 906,452 92,372 1997 12/01 40 years
Glasgow, KY . . . . . . . . . . . . . . — 302,859 560,904 — — 302,859 560,904 863,763 84,719 1997 12/01 40 years
Kingsville, TX . . . . . . . . . . . . . — 498,849 457,695 29,555 — 498,849 487,250 986,099 69,382 1995 12/01 40 years
Mobile, AL . . . . . . . . . . . . . . . . — 491,453 498,488 — — 491,453 498,488 989,941 75,292 1997 12/01 40 years
Mobile, AL . . . . . . . . . . . . . . . . — 843,121 562,498 — — 843,121 562,498 1,405,619 84,961 1997 12/01 40 years
BMW:
Duluth, GA . . . . . . . . . . . . . . . . — 4,433,613 4,080,186 4,225,787 — 4,504,324 8,305,973 12,810,297 660,297 1984 12/01 40 years
Borders Books & Music:
Wilmington, DE . . . . . . . . . . . . — 3,030,764 6,061,538 — — 2,994,395 6,061,538 9,055,933 1,974,073 1994 12/94 40 years
Richmond, VA . . . . . . . . . . . . . — 2,177,310 2,599,587 — — 2,177,310 2,599,587 4,776,897 816,343 1995 06/95 40 years
Ft. Lauderdale, FL . . . . . . . . . . 4,643,774(p) 3,164,984 3,319,234 — — 3,164,984 3,319,234 6,484,218 561,588 1995 02/96 33 years
Bangor, ME . . . . . . . . . . . . . . . . — 1,546,915 2,486,761 — — 1,546,915 2,486,761 4,033,676 716,671 1996 06/96 40 years
Altamonte Springs, FL . . . . . . . — 1,947,198 — — — 1,947,198 (c) 1,947,198 (c) 1997 09/97 (c)
Boston Market:
Burton, MI . . . . . . . . . . . . . . . . — 619,778 707,242 — — 619,778 707,242 1,327,020 106,823 1997 12/01 40 years
See accompanying report of independent registered public accounting firm.
F-2
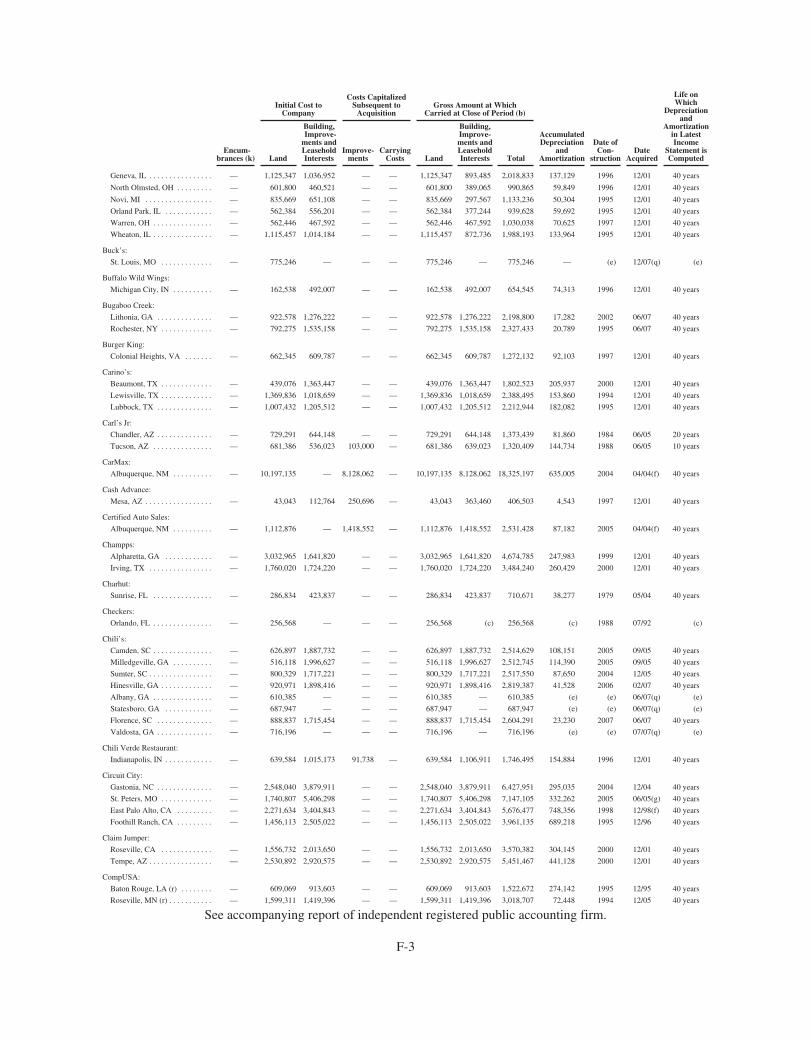
Encum-brances (k)
Initial Cost toCompany
Costs CapitalizedSubsequent to
AcquisitionGross Amount at Which
Carried at Close of Period (b)
AccumulatedDepreciation
andAmortization
Date ofCon-
structionDate
Acquired
Life onWhich
Depreciationand
Amortizationin LatestIncome
Statement isComputedLand
Building,Improve-
ments andLeaseholdInterests
Improve-ments
CarryingCosts Land
Building,Improve-ments andLeaseholdInterests Total
Geneva, IL . . . . . . . . . . . . . . . . — 1,125,347 1,036,952 — — 1,125,347 893,485 2,018,833 137,129 1996 12/01 40 years
North Olmsted, OH . . . . . . . . . — 601,800 460,521 — — 601,800 389,065 990,865 59,849 1996 12/01 40 years
Novi, MI . . . . . . . . . . . . . . . . . — 835,669 651,108 — — 835,669 297,567 1,133,236 50,304 1995 12/01 40 years
Orland Park, IL . . . . . . . . . . . . — 562,384 556,201 — — 562,384 377,244 939,628 59,692 1995 12/01 40 years
Warren, OH . . . . . . . . . . . . . . . — 562,446 467,592 — — 562,446 467,592 1,030,038 70,625 1997 12/01 40 years
Wheaton, IL . . . . . . . . . . . . . . . — 1,115,457 1,014,184 — — 1,115,457 872,736 1,988,193 133,964 1995 12/01 40 years
Buck’s:
St. Louis, MO . . . . . . . . . . . . . — 775,246 — — — 775,246 — 775,246 — (e) 12/07(q) (e)
Buffalo Wild Wings:
Michigan City, IN . . . . . . . . . . — 162,538 492,007 — — 162,538 492,007 654,545 74,313 1996 12/01 40 years
Bugaboo Creek:
Lithonia, GA . . . . . . . . . . . . . . — 922,578 1,276,222 — — 922,578 1,276,222 2,198,800 17,282 2002 06/07 40 years
Rochester, NY . . . . . . . . . . . . . — 792,275 1,535,158 — — 792,275 1,535,158 2,327,433 20,789 1995 06/07 40 years
Burger King:
Colonial Heights, VA . . . . . . . — 662,345 609,787 — — 662,345 609,787 1,272,132 92,103 1997 12/01 40 years
Carino’s:
Beaumont, TX . . . . . . . . . . . . . — 439,076 1,363,447 — — 439,076 1,363,447 1,802,523 205,937 2000 12/01 40 years
Lewisville, TX . . . . . . . . . . . . . — 1,369,836 1,018,659 — — 1,369,836 1,018,659 2,388,495 153,860 1994 12/01 40 years
Lubbock, TX . . . . . . . . . . . . . . — 1,007,432 1,205,512 — — 1,007,432 1,205,512 2,212,944 182,082 1995 12/01 40 years
Carl’s Jr:
Chandler, AZ . . . . . . . . . . . . . . — 729,291 644,148 — — 729,291 644,148 1,373,439 81,860 1984 06/05 20 years
Tucson, AZ . . . . . . . . . . . . . . . — 681,386 536,023 103,000 — 681,386 639,023 1,320,409 144,734 1988 06/05 10 years
CarMax:
Albuquerque, NM . . . . . . . . . . — 10,197,135 — 8,128,062 — 10,197,135 8,128,062 18,325,197 635,005 2004 04/04(f) 40 years
Cash Advance:
Mesa, AZ . . . . . . . . . . . . . . . . . — 43,043 112,764 250,696 — 43,043 363,460 406,503 4,543 1997 12/01 40 years
Certified Auto Sales:
Albuquerque, NM . . . . . . . . . . — 1,112,876 — 1,418,552 — 1,112,876 1,418,552 2,531,428 87,182 2005 04/04(f) 40 years
Champps:
Alpharetta, GA . . . . . . . . . . . . — 3,032,965 1,641,820 — — 3,032,965 1,641,820 4,674,785 247,983 1999 12/01 40 years
Irving, TX . . . . . . . . . . . . . . . . — 1,760,020 1,724,220 — — 1,760,020 1,724,220 3,484,240 260,429 2000 12/01 40 years
Charhut:
Sunrise, FL . . . . . . . . . . . . . . . — 286,834 423,837 — — 286,834 423,837 710,671 38,277 1979 05/04 40 years
Checkers:
Orlando, FL . . . . . . . . . . . . . . . — 256,568 — — — 256,568 (c) 256,568 (c) 1988 07/92 (c)
Chili’s:
Camden, SC . . . . . . . . . . . . . . . — 626,897 1,887,732 — — 626,897 1,887,732 2,514,629 108,151 2005 09/05 40 years
Milledgeville, GA . . . . . . . . . . — 516,118 1,996,627 — — 516,118 1,996,627 2,512,745 114,390 2005 09/05 40 years
Sumter, SC . . . . . . . . . . . . . . . . — 800,329 1,717,221 — — 800,329 1,717,221 2,517,550 87,650 2004 12/05 40 years
Hinesville, GA . . . . . . . . . . . . . — 920,971 1,898,416 — — 920,971 1,898,416 2,819,387 41,528 2006 02/07 40 years
Albany, GA . . . . . . . . . . . . . . . — 610,385 — — — 610,385 — 610,385 (e) (e) 06/07(q) (e)
Statesboro, GA . . . . . . . . . . . . — 687,947 — — — 687,947 — 687,947 (e) (e) 06/07(q) (e)
Florence, SC . . . . . . . . . . . . . . — 888,837 1,715,454 — — 888,837 1,715,454 2,604,291 23,230 2007 06/07 40 years
Valdosta, GA . . . . . . . . . . . . . . — 716,196 — — — 716,196 — 716,196 (e) (e) 07/07(q) (e)
Chili Verde Restaurant:
Indianapolis, IN . . . . . . . . . . . . — 639,584 1,015,173 91,738 — 639,584 1,106,911 1,746,495 154,884 1996 12/01 40 years
Circuit City:
Gastonia, NC . . . . . . . . . . . . . . — 2,548,040 3,879,911 — — 2,548,040 3,879,911 6,427,951 295,035 2004 12/04 40 years
St. Peters, MO . . . . . . . . . . . . . — 1,740,807 5,406,298 — — 1,740,807 5,406,298 7,147,105 332,262 2005 06/05(g) 40 years
East Palo Alto, CA . . . . . . . . . — 2,271,634 3,404,843 — — 2,271,634 3,404,843 5,676,477 748,356 1998 12/98(f) 40 years
Foothill Ranch, CA . . . . . . . . . — 1,456,113 2,505,022 — — 1,456,113 2,505,022 3,961,135 689,218 1995 12/96 40 years
Claim Jumper:
Roseville, CA . . . . . . . . . . . . . — 1,556,732 2,013,650 — — 1,556,732 2,013,650 3,570,382 304,145 2000 12/01 40 years
Tempe, AZ . . . . . . . . . . . . . . . . — 2,530,892 2,920,575 — — 2,530,892 2,920,575 5,451,467 441,128 2000 12/01 40 years
CompUSA:
Baton Rouge, LA (r) . . . . . . . . — 609,069 913,603 — — 609,069 913,603 1,522,672 274,142 1995 12/95 40 years
Roseville, MN (r) . . . . . . . . . . . — 1,599,311 1,419,396 — — 1,599,311 1,419,396 3,018,707 72,448 1994 12/05 40 years
See accompanying report of independent registered public accounting firm.
F-3

Encum-brances (k)
Initial Cost toCompany
Costs CapitalizedSubsequent to
AcquisitionGross Amount at Which
Carried at Close of Period (b)
AccumulatedDepreciation
andAmortization
Date ofCon-
structionDate
Acquired
Life onWhich
Depreciationand
Amortizationin LatestIncome
Statement isComputedLand
Building,Improve-
ments andLeaseholdInterests
Improve-ments
CarryingCosts Land
Building,Improve-ments andLeaseholdInterests Total
Cool Crest:
Independence, MO . . . . . . . . . . . . — 1,837,672 1,533,729 — — 1,837,672 1,533,729 3,371,401 23,965 1988 05/07 40 years
CORA Rehabilitation Clinics:
Orlando, FL . . . . . . . . . . . . . . . . . . 131,678(o) 80,400 221,063 — — 80,400 221,063 301,463 21,415 2001 02/04 40 years
Corpus Christi Flea Market:
Corpus Christi, TX . . . . . . . . . . . . — 223,998 2,158,955 — — 223,998 2,158,955 2,382,953 474,520 1983 03/99 40 years
CVS:
San Antonio, TX . . . . . . . . . . . . . . — 440,985 — — — 440,985 (c) 440,985 (c) 1993 12/93 (c)
Lafayette, LA . . . . . . . . . . . . . . . . . — 967,528 — — — 967,528 (c) 967,528 (c) 1995 01/96 (c)
Midwest City, OK . . . . . . . . . . . . . — 673,369 1,103,351 — — 673,369 1,103,351 1,776,720 326,185 1996 03/96 40 years
Irving, TX (r) . . . . . . . . . . . . . . . . . — 1,000,222 — — — 1,000,222 (c) 1,000,222 (c) 1996 12/96 (c)
Pantego, TX . . . . . . . . . . . . . . . . . . — 1,016,062 1,448,911 — — 1,016,062 1,448,911 2,464,973 381,848 1997 06/97 40 years
Ellenwood, GA . . . . . . . . . . . . . . . — 616,289 921,173 — — 616,289 921,173 1,537,462 90,198 1996 09/97 40 years
Flower Mound, TX . . . . . . . . . . . . — 932,233 881,448 — — 932,233 881,448 1,813,681 86,308 1996 09/97 40 years
Ft. Worth, TX . . . . . . . . . . . . . . . . — 558,657 — — — 558,657 (c) 558,657 (c) 1996 09/97 (c)
Arlington, TX . . . . . . . . . . . . . . . . — 2,078,542 — 1,396,508 — 2,078,542 1,396,508 3,475,050 327,306 1998 11/97(g) 40 years
Leavenworth, KS . . . . . . . . . . . . . . — 726,438 — 1,330,830 — 726,438 1,330,830 2,057,268 317,458 1998 11/97(g) 40 years
Lewisville, TX . . . . . . . . . . . . . . . . — 789,237 — 1,335,426 — 789,237 1,335,426 2,124,663 310,208 1998 04/98(g) 40 years
Forest Hill, TX . . . . . . . . . . . . . . . . — 692,165 — 1,174,549 — 692,165 1,174,549 1,866,714 275,285 1998 04/98(g) 40 years
Garland, TX . . . . . . . . . . . . . . . . . . — 1,476,838 — 1,400,278 — 1,476,838 1,400,278 2,877,116 319,439 1998 06/98(g) 40 years
Garland, TX . . . . . . . . . . . . . . . . . . — 522,461 — 1,418,531 — 522,461 1,418,531 1,940,992 320,647 1998 06/98(g) 40 years
Oklahoma City, OK . . . . . . . . . . . . — 1,581,480 — 1,471,105 — 1,581,480 1,471,105 3,052,585 329,466 1999 08/98(g) 40 years
Dallas, TX . . . . . . . . . . . . . . . . . . . — 2,617,656 — 2,570,569 — 2,617,656 2,570,569 5,188,225 270,445 2003 06/99 40 years
Gladstone, MO . . . . . . . . . . . . . . . 94,795 1,851,374 — 1,739,568 — 1,851,374 1,739,568 3,590,942 320,733 2000 12/99(g) 40 years
Dave & Buster’s:
Hilliard, OH . . . . . . . . . . . . . . . . . . — 934,210 4,689,004 — — 934,210 4,689,004 5,623,214 131,878 1998 11/06 40 years
Denny’s:
Columbus, TX . . . . . . . . . . . . . . . . — 428,429 816,644 — — 428,429 816,644 1,245,073 123,347 1997 12/01 40 years
Alexandria, VA . . . . . . . . . . . . . . . — 603,730 195,658 — — 603,730 195,658 799,388 12,636 1981 09/06 20 years
Amarillo, TX . . . . . . . . . . . . . . . . . — 589,996 632,121 — — 589,996 632,121 1,222,117 40,824 1982 09/06 20 years
Arlington Heights, IL . . . . . . . . . . — 469,593 227,673 — — 469,593 227,673 697,266 14,703 1977 09/06 20 years
Austintown, OH . . . . . . . . . . . . . . . — 466,124 397,387 — — 466,124 397,387 863,511 25,665 1980 09/06 20 years
Boardman Township, OH . . . . . . . — 497,083 257,518 — — 497,083 257,518 754,601 16,631 1977 09/06 20 years
Campbell, CA . . . . . . . . . . . . . . . . — 459,751 238,205 — — 459,751 238,205 697,956 15,384 1976 09/06 20 years
Carson, CA . . . . . . . . . . . . . . . . . . — 1,245,768 157,375 — — 1,245,768 157,375 1,403,143 10,164 1975 09/06 20 years
Chelais, WA . . . . . . . . . . . . . . . . . — 414,994 287,174 — — 414,994 287,174 702,168 18,546 1977 09/06 20 years
Chubbock, ID . . . . . . . . . . . . . . . . — 350,461 394,243 — — 350,461 394,243 744,704 25,461 1983 09/06 20 years
Clackamus, OR . . . . . . . . . . . . . . . — 468,281 407,268 — — 468,281 407,268 875,549 26,303 1993 09/06 20 years
Collinsville, IL . . . . . . . . . . . . . . . . — 675,704 282,912 — — 675,704 282,912 958,616 18,271 1979 09/06 20 years
Colorado Springs, CO . . . . . . . . . . — 321,006 376,744 — — 321,006 376,744 697,750 24,331 1984 09/06 20 years
Colorado Springs, CO . . . . . . . . . . — 585,425 390,275 — — 585,425 390,275 975,700 25,202 1978 09/06 20 years
Corpus Christi, TX . . . . . . . . . . . . — 344,821 775,618 — — 344,821 775,618 1,120,439 50,092 1980 09/06 20 years
Dallas, TX . . . . . . . . . . . . . . . . . . . — 497,170 149,862 — — 497,170 149,862 647,032 9,679 1979 09/06 20 years
Enfield, CT . . . . . . . . . . . . . . . . . . — 684,235 228,981 — — 684,235 228,981 913,216 14,788 1976 09/06 20 years
Fairfax, VA . . . . . . . . . . . . . . . . . . — 768,438 682,921 — — 768,438 682,921 1,451,359 44,105 1979 09/06 20 years
Federal Way, WA . . . . . . . . . . . . . — 542,951 192,650 — — 542,951 192,650 735,601 12,441 1977 09/06 20 years
Florissant, MO . . . . . . . . . . . . . . . . — 442,700 237,959 — — 442,700 237,959 680,659 15,368 1977 09/06 20 years
Ft. Worth, TX . . . . . . . . . . . . . . . . — 392,306 314,262 — — 392,306 314,262 706,568 20,296 1974 09/06 20 years
Hermitage, PA . . . . . . . . . . . . . . . . — 320,918 419,980 — — 320,918 419,980 740,898 27,123 1980 09/06 20 years
Hialeah, FL . . . . . . . . . . . . . . . . . . — 432,479 175,245 — — 432,479 175,245 607,724 11,318 1978 09/06 20 years
Houston, TX . . . . . . . . . . . . . . . . . — 503,797 347,749 — — 503,797 347,749 851,546 22,459 1976 09/06 20 years
Indianapolis, IN . . . . . . . . . . . . . . . — 325,937 511,345 — — 325,937 511,345 837,282 33,024 1978 09/06 20 years
Indianapolis, IN . . . . . . . . . . . . . . . — 310,383 589,689 — — 310,383 589,689 900,072 38,084 1981 09/06 20 years
Indianapolis, IN . . . . . . . . . . . . . . . — 358,295 766,627 — — 358,295 766,627 1,124,922 49,511 1978 09/06 20 years
Indianapolis, IN . . . . . . . . . . . . . . . — 222,629 482,909 — — 222,629 482,909 705,538 31,188 1979 09/06 20 years
Indianapolis, IN . . . . . . . . . . . . . . . — 231,236 511,175 — — 231,236 511,175 742,411 33,013 1974 09/06 20 years
Kernersville, NC . . . . . . . . . . . . . . — 406,544 557,465 — — 406,544 557,465 964,009 36,002 2000 09/06 20 years
Lafayette, IN . . . . . . . . . . . . . . . . . — 423,516 773,096 — — 423,516 773,096 1,196,612 49,929 1978 09/06 20 years
Laurel, MD . . . . . . . . . . . . . . . . . . — 527,596 379,327 — — 527,596 379,327 906,923 24,498 1976 09/06 20 years
Little Rock, AR . . . . . . . . . . . . . . . — 671,665 76,507 — — 671,665 76,507 748,172 4,941 1979 09/06 20 years
See accompanying report of independent registered public accounting firm.
F-4
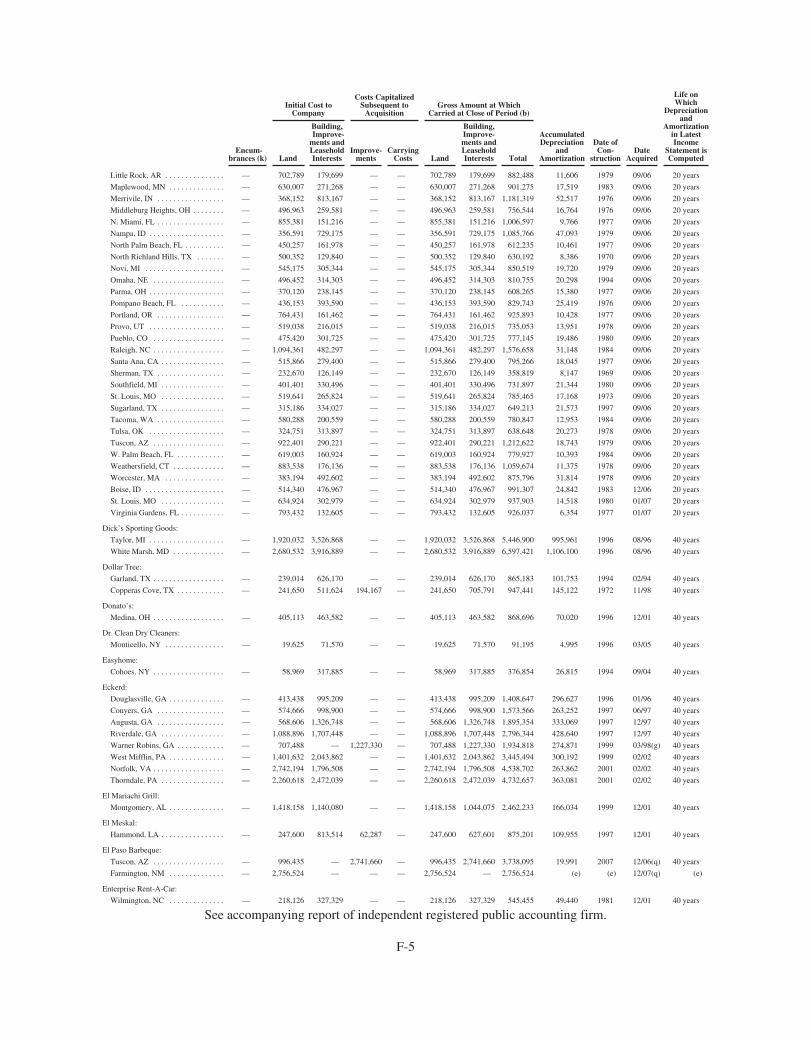
Encum-brances (k)
Initial Cost toCompany
Costs CapitalizedSubsequent to
AcquisitionGross Amount at Which
Carried at Close of Period (b)
AccumulatedDepreciation
andAmortization
Date ofCon-
structionDate
Acquired
Life onWhich
Depreciationand
Amortizationin LatestIncome
Statement isComputedLand
Building,Improve-
ments andLeaseholdInterests
Improve-ments
CarryingCosts Land
Building,Improve-ments andLeaseholdInterests Total
Little Rock, AR . . . . . . . . . . . . . . . — 702,789 179,699 — — 702,789 179,699 882,488 11,606 1979 09/06 20 years
Maplewood, MN . . . . . . . . . . . . . . — 630,007 271,268 — — 630,007 271,268 901,275 17,519 1983 09/06 20 years
Merrivile, IN . . . . . . . . . . . . . . . . . — 368,152 813,167 — — 368,152 813,167 1,181,319 52,517 1976 09/06 20 years
Middleburg Heights, OH . . . . . . . . — 496,963 259,581 — — 496,963 259,581 756,544 16,764 1976 09/06 20 years
N. Miami, FL . . . . . . . . . . . . . . . . . — 855,381 151,216 — — 855,381 151,216 1,006,597 9,766 1977 09/06 20 years
Nampa, ID . . . . . . . . . . . . . . . . . . . — 356,591 729,175 — — 356,591 729,175 1,085,766 47,093 1979 09/06 20 years
North Palm Beach, FL . . . . . . . . . . — 450,257 161,978 — — 450,257 161,978 612,235 10,461 1977 09/06 20 years
North Richland Hills, TX . . . . . . . — 500,352 129,840 — — 500,352 129,840 630,192 8,386 1970 09/06 20 years
Novi, MI . . . . . . . . . . . . . . . . . . . . — 545,175 305,344 — — 545,175 305,344 850,519 19,720 1979 09/06 20 years
Omaha, NE . . . . . . . . . . . . . . . . . . — 496,452 314,303 — — 496,452 314,303 810,755 20,298 1994 09/06 20 years
Parma, OH . . . . . . . . . . . . . . . . . . . — 370,120 238,145 — — 370,120 238,145 608,265 15,380 1977 09/06 20 years
Pompano Beach, FL . . . . . . . . . . . — 436,153 393,590 — — 436,153 393,590 829,743 25,419 1976 09/06 20 years
Portland, OR . . . . . . . . . . . . . . . . . — 764,431 161,462 — — 764,431 161,462 925,893 10,428 1977 09/06 20 years
Provo, UT . . . . . . . . . . . . . . . . . . . — 519,038 216,015 — — 519,038 216,015 735,053 13,951 1978 09/06 20 years
Pueblo, CO . . . . . . . . . . . . . . . . . . — 475,420 301,725 — — 475,420 301,725 777,145 19,486 1980 09/06 20 years
Raleigh, NC . . . . . . . . . . . . . . . . . . — 1,094,361 482,297 — — 1,094,361 482,297 1,576,658 31,148 1984 09/06 20 years
Santa Ana, CA . . . . . . . . . . . . . . . . — 515,866 279,400 — — 515,866 279,400 795,266 18,045 1977 09/06 20 years
Sherman, TX . . . . . . . . . . . . . . . . . — 232,670 126,149 — — 232,670 126,149 358,819 8,147 1969 09/06 20 years
Southfield, MI . . . . . . . . . . . . . . . . — 401,401 330,496 — — 401,401 330,496 731,897 21,344 1980 09/06 20 years
St. Louis, MO . . . . . . . . . . . . . . . . — 519,641 265,824 — — 519,641 265,824 785,465 17,168 1973 09/06 20 years
Sugarland, TX . . . . . . . . . . . . . . . . — 315,186 334,027 — — 315,186 334,027 649,213 21,573 1997 09/06 20 years
Tacoma, WA . . . . . . . . . . . . . . . . . — 580,288 200,559 — — 580,288 200,559 780,847 12,953 1984 09/06 20 years
Tulsa, OK . . . . . . . . . . . . . . . . . . . — 324,751 313,897 — — 324,751 313,897 638,648 20,273 1978 09/06 20 years
Tuscon, AZ . . . . . . . . . . . . . . . . . . — 922,401 290,221 — — 922,401 290,221 1,212,622 18,743 1979 09/06 20 years
W. Palm Beach, FL . . . . . . . . . . . . — 619,003 160,924 — — 619,003 160,924 779,927 10,393 1984 09/06 20 years
Weathersfield, CT . . . . . . . . . . . . . — 883,538 176,136 — — 883,538 176,136 1,059,674 11,375 1978 09/06 20 years
Worcester, MA . . . . . . . . . . . . . . . — 383,194 492,602 — — 383,194 492,602 875,796 31,814 1978 09/06 20 years
Boise, ID . . . . . . . . . . . . . . . . . . . . — 514,340 476,967 — — 514,340 476,967 991,307 24,842 1983 12/06 20 years
St. Louis, MO . . . . . . . . . . . . . . . . — 634,924 302,979 — — 634,924 302,979 937,903 14,518 1980 01/07 20 years
Virginia Gardens, FL . . . . . . . . . . . — 793,432 132,605 — — 793,432 132,605 926,037 6,354 1977 01/07 20 years
Dick’s Sporting Goods:
Taylor, MI . . . . . . . . . . . . . . . . . . . — 1,920,032 3,526,868 — — 1,920,032 3,526,868 5,446,900 995,961 1996 08/96 40 years
White Marsh, MD . . . . . . . . . . . . . — 2,680,532 3,916,889 — — 2,680,532 3,916,889 6,597,421 1,106,100 1996 08/96 40 years
Dollar Tree:
Garland, TX . . . . . . . . . . . . . . . . . . — 239,014 626,170 — — 239,014 626,170 865,183 101,753 1994 02/94 40 years
Copperas Cove, TX . . . . . . . . . . . . — 241,650 511,624 194,167 — 241,650 705,791 947,441 145,122 1972 11/98 40 years
Donato’s:
Medina, OH . . . . . . . . . . . . . . . . . . — 405,113 463,582 — — 405,113 463,582 868,696 70,020 1996 12/01 40 years
Dr. Clean Dry Cleaners:
Monticello, NY . . . . . . . . . . . . . . . — 19,625 71,570 — — 19,625 71,570 91,195 4,995 1996 03/05 40 years
Easyhome:
Cohoes, NY . . . . . . . . . . . . . . . . . . — 58,969 317,885 — — 58,969 317,885 376,854 26,815 1994 09/04 40 years
Eckerd:
Douglasville, GA . . . . . . . . . . . . . . — 413,438 995,209 — — 413,438 995,209 1,408,647 296,627 1996 01/96 40 years
Conyers, GA . . . . . . . . . . . . . . . . . — 574,666 998,900 — — 574,666 998,900 1,573,566 263,252 1997 06/97 40 years
Augusta, GA . . . . . . . . . . . . . . . . . — 568,606 1,326,748 — — 568,606 1,326,748 1,895,354 333,069 1997 12/97 40 years
Riverdale, GA . . . . . . . . . . . . . . . . — 1,088,896 1,707,448 — — 1,088,896 1,707,448 2,796,344 428,640 1997 12/97 40 years
Warner Robins, GA . . . . . . . . . . . . — 707,488 — 1,227,330 — 707,488 1,227,330 1,934,818 274,871 1999 03/98(g) 40 years
West Mifflin, PA . . . . . . . . . . . . . . — 1,401,632 2,043,862 — — 1,401,632 2,043,862 3,445,494 300,192 1999 02/02 40 years
Norfolk, VA . . . . . . . . . . . . . . . . . . — 2,742,194 1,796,508 — — 2,742,194 1,796,508 4,538,702 263,862 2001 02/02 40 years
Thorndale, PA . . . . . . . . . . . . . . . . — 2,260,618 2,472,039 — — 2,260,618 2,472,039 4,732,657 363,081 2001 02/02 40 years
El Mariachi Grill:
Montgomery, AL . . . . . . . . . . . . . . — 1,418,158 1,140,080 — — 1,418,158 1,044,075 2,462,233 166,034 1999 12/01 40 years
El Meskal:
Hammond, LA . . . . . . . . . . . . . . . . — 247,600 813,514 62,287 — 247,600 627,601 875,201 109,955 1997 12/01 40 years
El Paso Barbeque:
Tuscon, AZ . . . . . . . . . . . . . . . . . . — 996,435 — 2,741,660 — 996,435 2,741,660 3,738,095 19,991 2007 12/06(q) 40 years
Farmington, NM . . . . . . . . . . . . . . — 2,756,524 — — — 2,756,524 — 2,756,524 (e) (e) 12/07(q) (e)
Enterprise Rent-A-Car:
Wilmington, NC . . . . . . . . . . . . . . — 218,126 327,329 — — 218,126 327,329 545,455 49,440 1981 12/01 40 years
See accompanying report of independent registered public accounting firm.
F-5
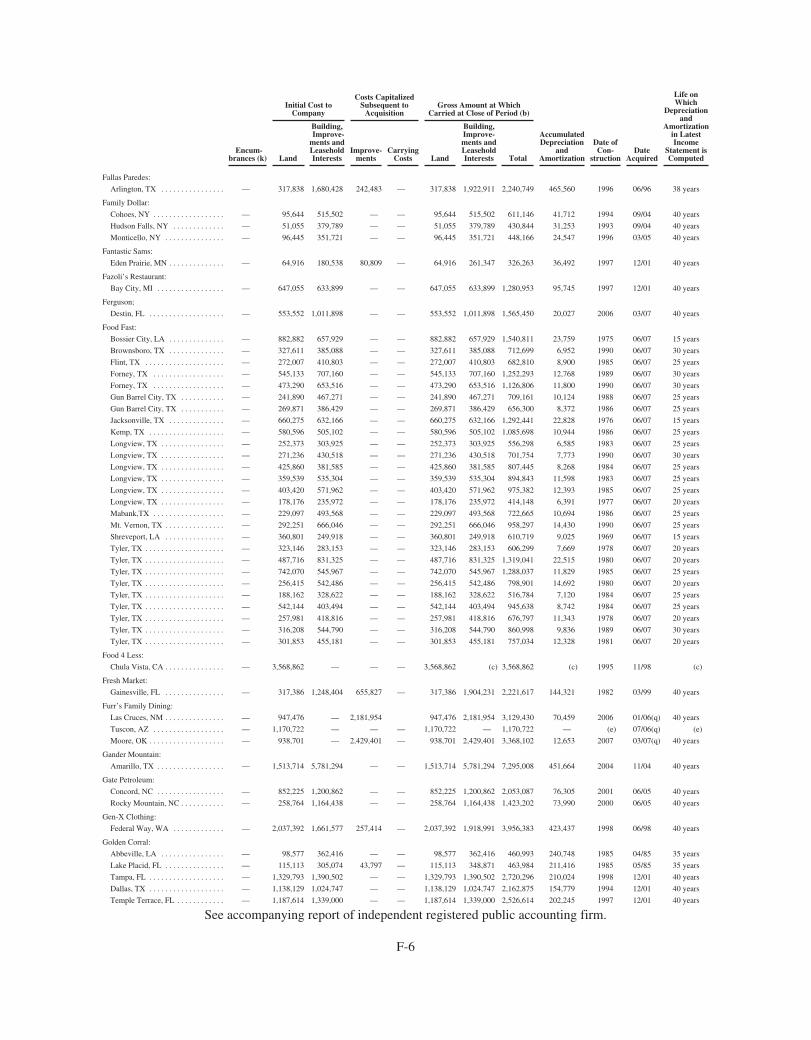
Encum-brances (k)
Initial Cost toCompany
Costs CapitalizedSubsequent to
AcquisitionGross Amount at Which
Carried at Close of Period (b)
AccumulatedDepreciation
andAmortization
Date ofCon-
structionDate
Acquired
Life onWhich
Depreciationand
Amortizationin LatestIncome
Statement isComputedLand
Building,Improve-
ments andLeaseholdInterests
Improve-ments
CarryingCosts Land
Building,Improve-ments andLeaseholdInterests Total
Fallas Paredes:
Arlington, TX . . . . . . . . . . . . . . . . — 317,838 1,680,428 242,483 — 317,838 1,922,911 2,240,749 465,560 1996 06/96 38 years
Family Dollar:
Cohoes, NY . . . . . . . . . . . . . . . . . . — 95,644 515,502 — — 95,644 515,502 611,146 41,712 1994 09/04 40 years
Hudson Falls, NY . . . . . . . . . . . . . — 51,055 379,789 — — 51,055 379,789 430,844 31,253 1993 09/04 40 years
Monticello, NY . . . . . . . . . . . . . . . — 96,445 351,721 — — 96,445 351,721 448,166 24,547 1996 03/05 40 years
Fantastic Sams:
Eden Prairie, MN . . . . . . . . . . . . . . — 64,916 180,538 80,809 — 64,916 261,347 326,263 36,492 1997 12/01 40 years
Fazoli’s Restaurant:
Bay City, MI . . . . . . . . . . . . . . . . . — 647,055 633,899 — — 647,055 633,899 1,280,953 95,745 1997 12/01 40 years
Ferguson;
Destin, FL . . . . . . . . . . . . . . . . . . . — 553,552 1,011,898 — — 553,552 1,011,898 1,565,450 20,027 2006 03/07 40 years
Food Fast:
Bossier City, LA . . . . . . . . . . . . . . — 882,882 657,929 — — 882,882 657,929 1,540,811 23,759 1975 06/07 15 years
Brownsboro, TX . . . . . . . . . . . . . . — 327,611 385,088 — — 327,611 385,088 712,699 6,952 1990 06/07 30 years
Flint, TX . . . . . . . . . . . . . . . . . . . . — 272,007 410,803 — — 272,007 410,803 682,810 8,900 1985 06/07 25 years
Forney, TX . . . . . . . . . . . . . . . . . . — 545,133 707,160 — — 545,133 707,160 1,252,293 12,768 1989 06/07 30 years
Forney, TX . . . . . . . . . . . . . . . . . . — 473,290 653,516 — — 473,290 653,516 1,126,806 11,800 1990 06/07 30 years
Gun Barrel City, TX . . . . . . . . . . . — 241,890 467,271 — — 241,890 467,271 709,161 10,124 1988 06/07 25 years
Gun Barrel City, TX . . . . . . . . . . . — 269,871 386,429 — — 269,871 386,429 656,300 8,372 1986 06/07 25 years
Jacksonville, TX . . . . . . . . . . . . . . — 660,275 632,166 — — 660,275 632,166 1,292,441 22,828 1976 06/07 15 years
Kemp, TX . . . . . . . . . . . . . . . . . . . — 580,596 505,102 — — 580,596 505,102 1,085,698 10,944 1986 06/07 25 years
Longview, TX . . . . . . . . . . . . . . . . — 252,373 303,925 — — 252,373 303,925 556,298 6,585 1983 06/07 25 years
Longview, TX . . . . . . . . . . . . . . . . — 271,236 430,518 — — 271,236 430,518 701,754 7,773 1990 06/07 30 years
Longview, TX . . . . . . . . . . . . . . . . — 425,860 381,585 — — 425,860 381,585 807,445 8,268 1984 06/07 25 years
Longview, TX . . . . . . . . . . . . . . . . — 359,539 535,304 — — 359,539 535,304 894,843 11,598 1983 06/07 25 years
Longview, TX . . . . . . . . . . . . . . . . — 403,420 571,962 — — 403,420 571,962 975,382 12,393 1985 06/07 25 years
Longview, TX . . . . . . . . . . . . . . . . — 178,176 235,972 — — 178,176 235,972 414,148 6,391 1977 06/07 20 years
Mabank,TX . . . . . . . . . . . . . . . . . . — 229,097 493,568 — — 229,097 493,568 722,665 10,694 1986 06/07 25 years
Mt. Vernon, TX . . . . . . . . . . . . . . . — 292,251 666,046 — — 292,251 666,046 958,297 14,430 1990 06/07 25 years
Shreveport, LA . . . . . . . . . . . . . . . — 360,801 249,918 — — 360,801 249,918 610,719 9,025 1969 06/07 15 years
Tyler, TX . . . . . . . . . . . . . . . . . . . . — 323,146 283,153 — — 323,146 283,153 606,299 7,669 1978 06/07 20 years
Tyler, TX . . . . . . . . . . . . . . . . . . . . — 487,716 831,325 — — 487,716 831,325 1,319,041 22,515 1980 06/07 20 years
Tyler, TX . . . . . . . . . . . . . . . . . . . . — 742,070 545,967 — — 742,070 545,967 1,288,037 11,829 1985 06/07 25 years
Tyler, TX . . . . . . . . . . . . . . . . . . . . — 256,415 542,486 — — 256,415 542,486 798,901 14,692 1980 06/07 20 years
Tyler, TX . . . . . . . . . . . . . . . . . . . . — 188,162 328,622 — — 188,162 328,622 516,784 7,120 1984 06/07 25 years
Tyler, TX . . . . . . . . . . . . . . . . . . . . — 542,144 403,494 — — 542,144 403,494 945,638 8,742 1984 06/07 25 years
Tyler, TX . . . . . . . . . . . . . . . . . . . . — 257,981 418,816 — — 257,981 418,816 676,797 11,343 1978 06/07 20 years
Tyler, TX . . . . . . . . . . . . . . . . . . . . — 316,208 544,790 — — 316,208 544,790 860,998 9,836 1989 06/07 30 years
Tyler, TX . . . . . . . . . . . . . . . . . . . . — 301,853 455,181 — — 301,853 455,181 757,034 12,328 1981 06/07 20 years
Food 4 Less:
Chula Vista, CA . . . . . . . . . . . . . . . — 3,568,862 — — — 3,568,862 (c) 3,568,862 (c) 1995 11/98 (c)
Fresh Market:
Gainesville, FL . . . . . . . . . . . . . . . — 317,386 1,248,404 655,827 — 317,386 1,904,231 2,221,617 144,321 1982 03/99 40 years
Furr’s Family Dining:
Las Cruces, NM . . . . . . . . . . . . . . . — 947,476 — 2,181,954 947,476 2,181,954 3,129,430 70,459 2006 01/06(q) 40 years
Tuscon, AZ . . . . . . . . . . . . . . . . . . — 1,170,722 — — — 1,170,722 — 1,170,722 — (e) 07/06(q) (e)
Moore, OK . . . . . . . . . . . . . . . . . . . — 938,701 — 2,429,401 — 938,701 2,429,401 3,368,102 12,653 2007 03/07(q) 40 years
Gander Mountain:
Amarillo, TX . . . . . . . . . . . . . . . . . — 1,513,714 5,781,294 — — 1,513,714 5,781,294 7,295,008 451,664 2004 11/04 40 years
Gate Petroleum:
Concord, NC . . . . . . . . . . . . . . . . . — 852,225 1,200,862 — — 852,225 1,200,862 2,053,087 76,305 2001 06/05 40 years
Rocky Mountain, NC . . . . . . . . . . . — 258,764 1,164,438 — — 258,764 1,164,438 1,423,202 73,990 2000 06/05 40 years
Gen-X Clothing:
Federal Way, WA . . . . . . . . . . . . . — 2,037,392 1,661,577 257,414 — 2,037,392 1,918,991 3,956,383 423,437 1998 06/98 40 years
Golden Corral:
Abbeville, LA . . . . . . . . . . . . . . . . — 98,577 362,416 — — 98,577 362,416 460,993 240,748 1985 04/85 35 years
Lake Placid, FL . . . . . . . . . . . . . . . — 115,113 305,074 43,797 — 115,113 348,871 463,984 211,416 1985 05/85 35 years
Tampa, FL . . . . . . . . . . . . . . . . . . . — 1,329,793 1,390,502 — — 1,329,793 1,390,502 2,720,296 210,024 1998 12/01 40 years
Dallas, TX . . . . . . . . . . . . . . . . . . . — 1,138,129 1,024,747 — — 1,138,129 1,024,747 2,162,875 154,779 1994 12/01 40 years
Temple Terrace, FL . . . . . . . . . . . . — 1,187,614 1,339,000 — — 1,187,614 1,339,000 2,526,614 202,245 1997 12/01 40 years
See accompanying report of independent registered public accounting firm.
F-6
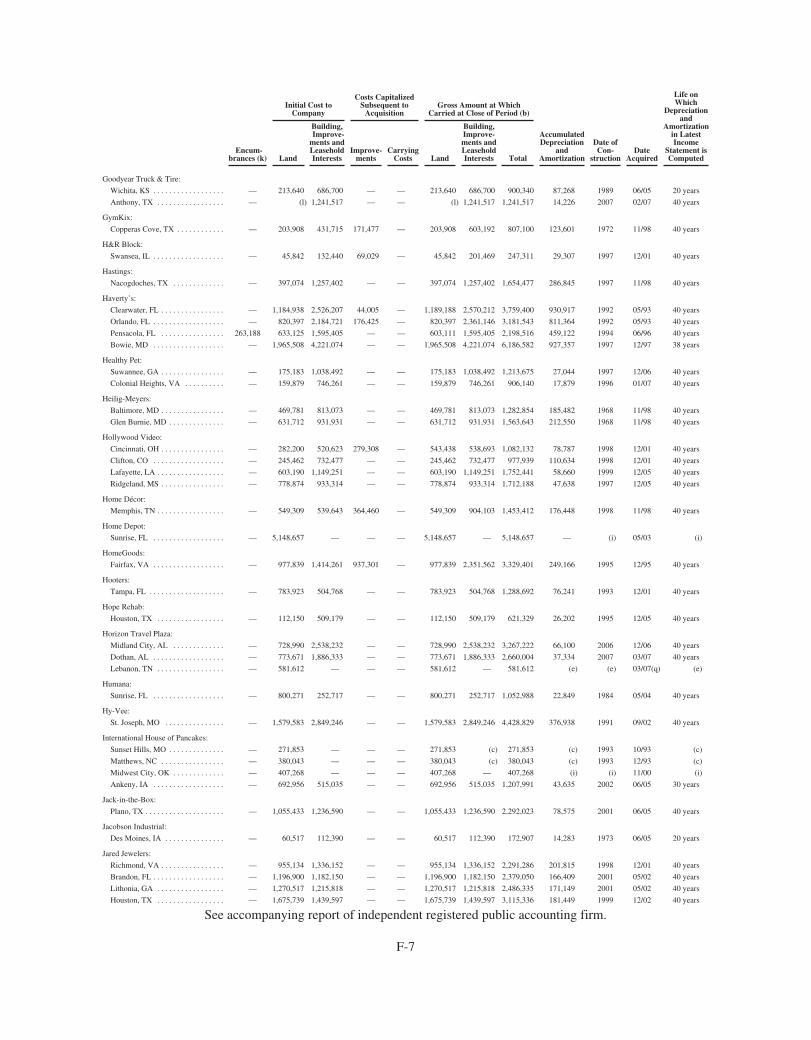
Encum-brances (k)
Initial Cost toCompany
Costs CapitalizedSubsequent to
AcquisitionGross Amount at Which
Carried at Close of Period (b)
AccumulatedDepreciation
andAmortization
Date ofCon-
structionDate
Acquired
Life onWhich
Depreciationand
Amortizationin LatestIncome
Statement isComputedLand
Building,Improve-
ments andLeaseholdInterests
Improve-ments
CarryingCosts Land
Building,Improve-ments andLeaseholdInterests Total
Goodyear Truck & Tire:
Wichita, KS . . . . . . . . . . . . . . . . . . — 213,640 686,700 — — 213,640 686,700 900,340 87,268 1989 06/05 20 years
Anthony, TX . . . . . . . . . . . . . . . . . — (l) 1,241,517 — — (l) 1,241,517 1,241,517 14,226 2007 02/07 40 years
GymKix:
Copperas Cove, TX . . . . . . . . . . . . — 203,908 431,715 171,477 — 203,908 603,192 807,100 123,601 1972 11/98 40 years
H&R Block:
Swansea, IL . . . . . . . . . . . . . . . . . . — 45,842 132,440 69,029 — 45,842 201,469 247,311 29,307 1997 12/01 40 years
Hastings:
Nacogdoches, TX . . . . . . . . . . . . . — 397,074 1,257,402 — — 397,074 1,257,402 1,654,477 286,845 1997 11/98 40 years
Haverty’s:
Clearwater, FL . . . . . . . . . . . . . . . . — 1,184,938 2,526,207 44,005 — 1,189,188 2,570,212 3,759,400 930,917 1992 05/93 40 years
Orlando, FL . . . . . . . . . . . . . . . . . . — 820,397 2,184,721 176,425 — 820,397 2,361,146 3,181,543 811,364 1992 05/93 40 years
Pensacola, FL . . . . . . . . . . . . . . . . 263,188 633,125 1,595,405 — — 603,111 1,595,405 2,198,516 459,122 1994 06/96 40 years
Bowie, MD . . . . . . . . . . . . . . . . . . — 1,965,508 4,221,074 — — 1,965,508 4,221,074 6,186,582 927,357 1997 12/97 38 years
Healthy Pet:
Suwannee, GA . . . . . . . . . . . . . . . . — 175,183 1,038,492 — — 175,183 1,038,492 1,213,675 27,044 1997 12/06 40 years
Colonial Heights, VA . . . . . . . . . . — 159,879 746,261 — — 159,879 746,261 906,140 17,879 1996 01/07 40 years
Heilig-Meyers:
Baltimore, MD . . . . . . . . . . . . . . . . — 469,781 813,073 — — 469,781 813,073 1,282,854 185,482 1968 11/98 40 years
Glen Burnie, MD . . . . . . . . . . . . . . — 631,712 931,931 — — 631,712 931,931 1,563,643 212,550 1968 11/98 40 years
Hollywood Video:
Cincinnati, OH . . . . . . . . . . . . . . . . — 282,200 520,623 279,308 — 543,438 538,693 1,082,132 78,787 1998 12/01 40 years
Clifton, CO . . . . . . . . . . . . . . . . . . — 245,462 732,477 — — 245,462 732,477 977,939 110,634 1998 12/01 40 years
Lafayette, LA . . . . . . . . . . . . . . . . . — 603,190 1,149,251 — — 603,190 1,149,251 1,752,441 58,660 1999 12/05 40 years
Ridgeland, MS . . . . . . . . . . . . . . . . — 778,874 933,314 — — 778,874 933,314 1,712,188 47,638 1997 12/05 40 years
Home Décor:
Memphis, TN . . . . . . . . . . . . . . . . . — 549,309 539,643 364,460 — 549,309 904,103 1,453,412 176,448 1998 11/98 40 years
Home Depot:
Sunrise, FL . . . . . . . . . . . . . . . . . . — 5,148,657 — — — 5,148,657 — 5,148,657 — (i) 05/03 (i)
HomeGoods:
Fairfax, VA . . . . . . . . . . . . . . . . . . — 977,839 1,414,261 937,301 — 977,839 2,351,562 3,329,401 249,166 1995 12/95 40 years
Hooters:
Tampa, FL . . . . . . . . . . . . . . . . . . . — 783,923 504,768 — — 783,923 504,768 1,288,692 76,241 1993 12/01 40 years
Hope Rehab:
Houston, TX . . . . . . . . . . . . . . . . . — 112,150 509,179 — — 112,150 509,179 621,329 26,202 1995 12/05 40 years
Horizon Travel Plaza:
Midland City, AL . . . . . . . . . . . . . — 728,990 2,538,232 — — 728,990 2,538,232 3,267,222 66,100 2006 12/06 40 years
Dothan, AL . . . . . . . . . . . . . . . . . . — 773,671 1,886,333 — — 773,671 1,886,333 2,660,004 37,334 2007 03/07 40 years
Lebanon, TN . . . . . . . . . . . . . . . . . — 581,612 — — — 581,612 — 581,612 (e) (e) 03/07(q) (e)
Humana:
Sunrise, FL . . . . . . . . . . . . . . . . . . — 800,271 252,717 — — 800,271 252,717 1,052,988 22,849 1984 05/04 40 years
Hy-Vee:
St. Joseph, MO . . . . . . . . . . . . . . . — 1,579,583 2,849,246 — — 1,579,583 2,849,246 4,428,829 376,938 1991 09/02 40 years
International House of Pancakes:
Sunset Hills, MO . . . . . . . . . . . . . . — 271,853 — — — 271,853 (c) 271,853 (c) 1993 10/93 (c)
Matthews, NC . . . . . . . . . . . . . . . . — 380,043 — — — 380,043 (c) 380,043 (c) 1993 12/93 (c)
Midwest City, OK . . . . . . . . . . . . . — 407,268 — — — 407,268 — 407,268 (i) (i) 11/00 (i)
Ankeny, IA . . . . . . . . . . . . . . . . . . — 692,956 515,035 — — 692,956 515,035 1,207,991 43,635 2002 06/05 30 years
Jack-in-the-Box:
Plano, TX . . . . . . . . . . . . . . . . . . . . — 1,055,433 1,236,590 — — 1,055,433 1,236,590 2,292,023 78,575 2001 06/05 40 years
Jacobson Industrial:
Des Moines, IA . . . . . . . . . . . . . . . — 60,517 112,390 — — 60,517 112,390 172,907 14,283 1973 06/05 20 years
Jared Jewelers:
Richmond, VA . . . . . . . . . . . . . . . . — 955,134 1,336,152 — — 955,134 1,336,152 2,291,286 201,815 1998 12/01 40 years
Brandon, FL . . . . . . . . . . . . . . . . . . — 1,196,900 1,182,150 — — 1,196,900 1,182,150 2,379,050 166,409 2001 05/02 40 years
Lithonia, GA . . . . . . . . . . . . . . . . . — 1,270,517 1,215,818 — — 1,270,517 1,215,818 2,486,335 171,149 2001 05/02 40 years
Houston, TX . . . . . . . . . . . . . . . . . — 1,675,739 1,439,597 — — 1,675,739 1,439,597 3,115,336 181,449 1999 12/02 40 years
See accompanying report of independent registered public accounting firm.
F-7
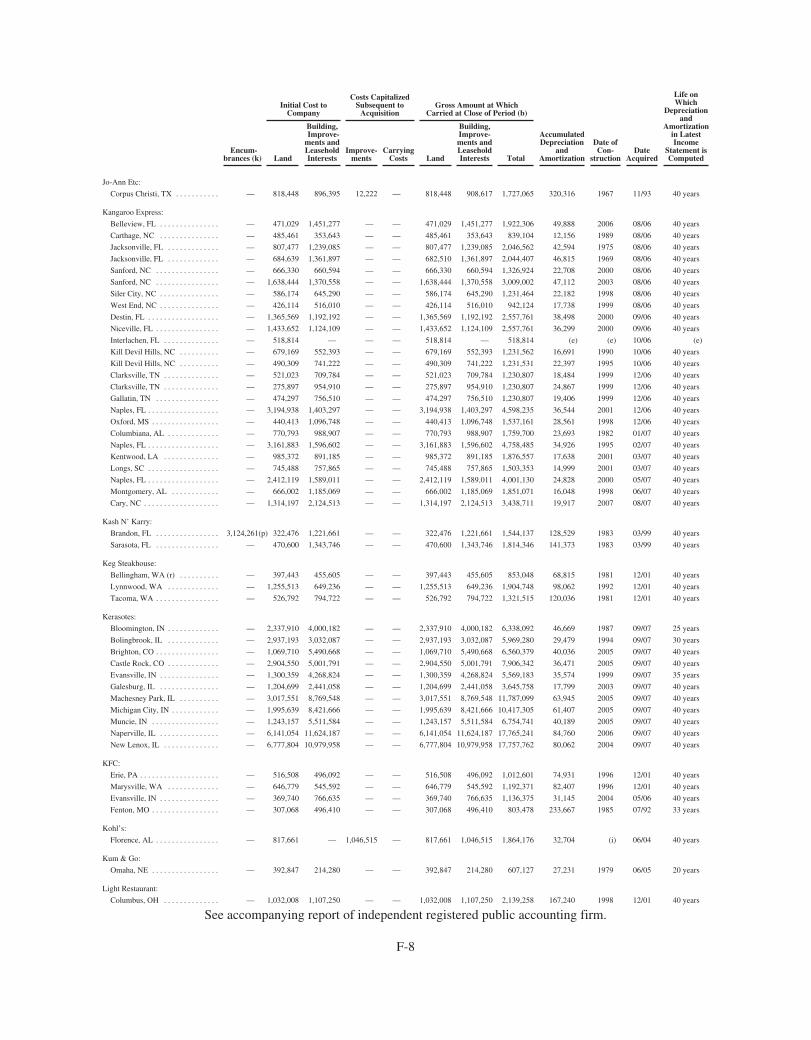
Encum-brances (k)
Initial Cost toCompany
Costs CapitalizedSubsequent to
AcquisitionGross Amount at Which
Carried at Close of Period (b)
AccumulatedDepreciation
andAmortization
Date ofCon-
structionDate
Acquired
Life onWhich
Depreciationand
Amortizationin LatestIncome
Statement isComputedLand
Building,Improve-
ments andLeaseholdInterests
Improve-ments
CarryingCosts Land
Building,Improve-ments andLeaseholdInterests Total
Jo-Ann Etc:
Corpus Christi, TX . . . . . . . . . . . — 818,448 896,395 12,222 — 818,448 908,617 1,727,065 320,316 1967 11/93 40 years
Kangaroo Express:
Belleview, FL . . . . . . . . . . . . . . . — 471,029 1,451,277 — — 471,029 1,451,277 1,922,306 49,888 2006 08/06 40 years
Carthage, NC . . . . . . . . . . . . . . . — 485,461 353,643 — — 485,461 353,643 839,104 12,156 1989 08/06 40 years
Jacksonville, FL . . . . . . . . . . . . . — 807,477 1,239,085 — — 807,477 1,239,085 2,046,562 42,594 1975 08/06 40 years
Jacksonville, FL . . . . . . . . . . . . . — 684,639 1,361,897 — — 682,510 1,361,897 2,044,407 46,815 1969 08/06 40 years
Sanford, NC . . . . . . . . . . . . . . . . — 666,330 660,594 — — 666,330 660,594 1,326,924 22,708 2000 08/06 40 years
Sanford, NC . . . . . . . . . . . . . . . . — 1,638,444 1,370,558 — — 1,638,444 1,370,558 3,009,002 47,112 2003 08/06 40 years
Siler City, NC . . . . . . . . . . . . . . . — 586,174 645,290 — — 586,174 645,290 1,231,464 22,182 1998 08/06 40 years
West End, NC . . . . . . . . . . . . . . . — 426,114 516,010 — — 426,114 516,010 942,124 17,738 1999 08/06 40 years
Destin, FL . . . . . . . . . . . . . . . . . . — 1,365,569 1,192,192 — — 1,365,569 1,192,192 2,557,761 38,498 2000 09/06 40 years
Niceville, FL . . . . . . . . . . . . . . . . — 1,433,652 1,124,109 — — 1,433,652 1,124,109 2,557,761 36,299 2000 09/06 40 years
Interlachen, FL . . . . . . . . . . . . . . — 518,814 — — — 518,814 — 518,814 (e) (e) 10/06 (e)
Kill Devil Hills, NC . . . . . . . . . . — 679,169 552,393 — — 679,169 552,393 1,231,562 16,691 1990 10/06 40 years
Kill Devil Hills, NC . . . . . . . . . . — 490,309 741,222 — — 490,309 741,222 1,231,531 22,397 1995 10/06 40 years
Clarksville, TN . . . . . . . . . . . . . . — 521,023 709,784 — — 521,023 709,784 1,230,807 18,484 1999 12/06 40 years
Clarksville, TN . . . . . . . . . . . . . . — 275,897 954,910 — — 275,897 954,910 1,230,807 24,867 1999 12/06 40 years
Gallatin, TN . . . . . . . . . . . . . . . . — 474,297 756,510 — — 474,297 756,510 1,230,807 19,406 1999 12/06 40 years
Naples, FL . . . . . . . . . . . . . . . . . . — 3,194,938 1,403,297 — — 3,194,938 1,403,297 4,598,235 36,544 2001 12/06 40 years
Oxford, MS . . . . . . . . . . . . . . . . . — 440,413 1,096,748 — — 440,413 1,096,748 1,537,161 28,561 1998 12/06 40 years
Columbiana, AL . . . . . . . . . . . . . — 770,793 988,907 — — 770,793 988,907 1,759,700 23,693 1982 01/07 40 years
Naples, FL . . . . . . . . . . . . . . . . . . — 3,161,883 1,596,602 — — 3,161,883 1,596,602 4,758,485 34,926 1995 02/07 40 years
Kentwood, LA . . . . . . . . . . . . . . — 985,372 891,185 — — 985,372 891,185 1,876,557 17,638 2001 03/07 40 years
Longs, SC . . . . . . . . . . . . . . . . . . — 745,488 757,865 — — 745,488 757,865 1,503,353 14,999 2001 03/07 40 years
Naples, FL . . . . . . . . . . . . . . . . . . — 2,412,119 1,589,011 — — 2,412,119 1,589,011 4,001,130 24,828 2000 05/07 40 years
Montgomery, AL . . . . . . . . . . . . — 666,002 1,185,069 — — 666,002 1,185,069 1,851,071 16,048 1998 06/07 40 years
Cary, NC . . . . . . . . . . . . . . . . . . . — 1,314,197 2,124,513 — — 1,314,197 2,124,513 3,438,711 19,917 2007 08/07 40 years
Kash N’ Karry:
Brandon, FL . . . . . . . . . . . . . . . . 3,124,261(p) 322,476 1,221,661 — — 322,476 1,221,661 1,544,137 128,529 1983 03/99 40 years
Sarasota, FL . . . . . . . . . . . . . . . . — 470,600 1,343,746 — — 470,600 1,343,746 1,814,346 141,373 1983 03/99 40 years
Keg Steakhouse:
Bellingham, WA (r) . . . . . . . . . . — 397,443 455,605 — — 397,443 455,605 853,048 68,815 1981 12/01 40 years
Lynnwood, WA . . . . . . . . . . . . . — 1,255,513 649,236 — — 1,255,513 649,236 1,904,748 98,062 1992 12/01 40 years
Tacoma, WA . . . . . . . . . . . . . . . . — 526,792 794,722 — — 526,792 794,722 1,321,515 120,036 1981 12/01 40 years
Kerasotes:
Bloomington, IN . . . . . . . . . . . . . — 2,337,910 4,000,182 — — 2,337,910 4,000,182 6,338,092 46,669 1987 09/07 25 years
Bolingbrook, IL . . . . . . . . . . . . . — 2,937,193 3,032,087 — — 2,937,193 3,032,087 5,969,280 29,479 1994 09/07 30 years
Brighton, CO . . . . . . . . . . . . . . . . — 1,069,710 5,490,668 — — 1,069,710 5,490,668 6,560,379 40,036 2005 09/07 40 years
Castle Rock, CO . . . . . . . . . . . . . — 2,904,550 5,001,791 — — 2,904,550 5,001,791 7,906,342 36,471 2005 09/07 40 years
Evansville, IN . . . . . . . . . . . . . . . — 1,300,359 4,268,824 — — 1,300,359 4,268,824 5,569,183 35,574 1999 09/07 35 years
Galesburg, IL . . . . . . . . . . . . . . . — 1,204,699 2,441,058 — — 1,204,699 2,441,058 3,645,758 17,799 2003 09/07 40 years
Machesney Park, IL . . . . . . . . . . — 3,017,551 8,769,548 — — 3,017,551 8,769,548 11,787,099 63,945 2005 09/07 40 years
Michigan City, IN . . . . . . . . . . . . — 1,995,639 8,421,666 — — 1,995,639 8,421,666 10,417,305 61,407 2005 09/07 40 years
Muncie, IN . . . . . . . . . . . . . . . . . — 1,243,157 5,511,584 — — 1,243,157 5,511,584 6,754,741 40,189 2005 09/07 40 years
Naperville, IL . . . . . . . . . . . . . . . — 6,141,054 11,624,187 — — 6,141,054 11,624,187 17,765,241 84,760 2006 09/07 40 years
New Lenox, IL . . . . . . . . . . . . . . — 6,777,804 10,979,958 — — 6,777,804 10,979,958 17,757,762 80,062 2004 09/07 40 years
KFC:
Erie, PA . . . . . . . . . . . . . . . . . . . . — 516,508 496,092 — — 516,508 496,092 1,012,601 74,931 1996 12/01 40 years
Marysville, WA . . . . . . . . . . . . . — 646,779 545,592 — — 646,779 545,592 1,192,371 82,407 1996 12/01 40 years
Evansville, IN . . . . . . . . . . . . . . . — 369,740 766,635 — — 369,740 766,635 1,136,375 31,145 2004 05/06 40 years
Fenton, MO . . . . . . . . . . . . . . . . . — 307,068 496,410 — — 307,068 496,410 803,478 233,667 1985 07/92 33 years
Kohl’s:
Florence, AL . . . . . . . . . . . . . . . . — 817,661 — 1,046,515 — 817,661 1,046,515 1,864,176 32,704 (i) 06/04 40 years
Kum & Go:
Omaha, NE . . . . . . . . . . . . . . . . . — 392,847 214,280 — — 392,847 214,280 607,127 27,231 1979 06/05 20 years
Light Restaurant:
Columbus, OH . . . . . . . . . . . . . . — 1,032,008 1,107,250 — — 1,032,008 1,107,250 2,139,258 167,240 1998 12/01 40 years
See accompanying report of independent registered public accounting firm.
F-8
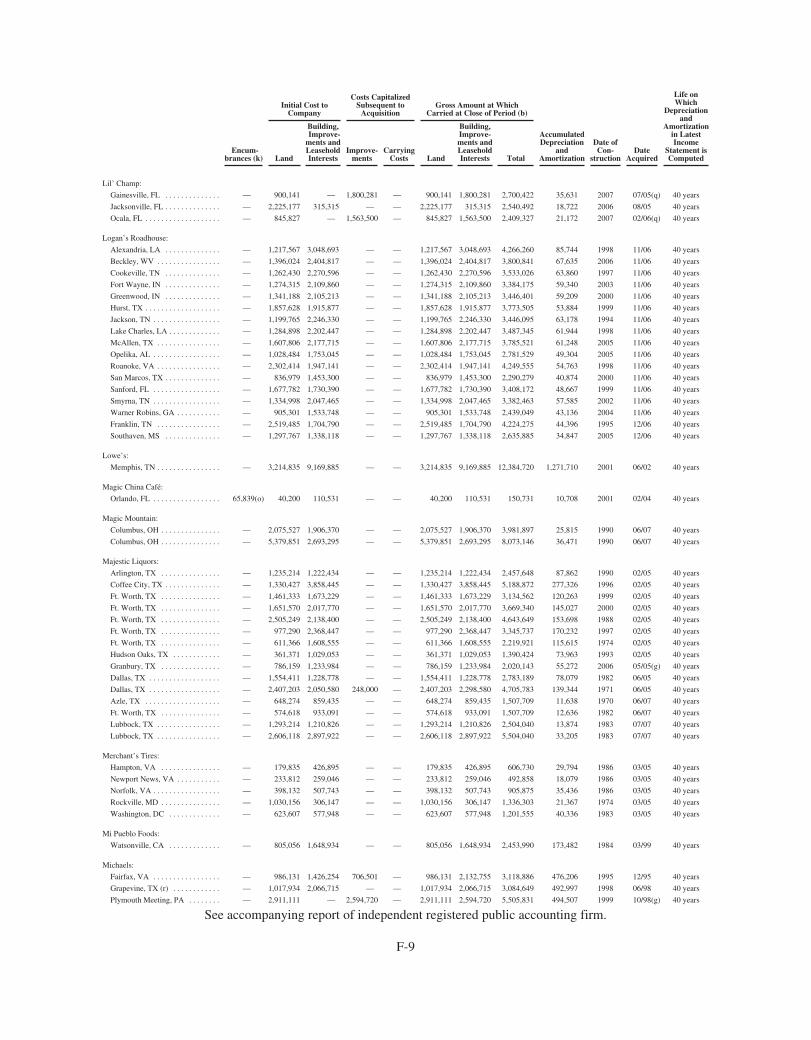
Encum-brances (k)
Initial Cost toCompany
Costs CapitalizedSubsequent to
AcquisitionGross Amount at Which
Carried at Close of Period (b)
AccumulatedDepreciation
andAmortization
Date ofCon-
structionDate
Acquired
Life onWhich
Depreciationand
Amortizationin LatestIncome
Statement isComputedLand
Building,Improve-
ments andLeaseholdInterests
Improve-ments
CarryingCosts Land
Building,Improve-ments andLeaseholdInterests Total
Lil’ Champ:
Gainesville, FL . . . . . . . . . . . . . . — 900,141 — 1,800,281 — 900,141 1,800,281 2,700,422 35,631 2007 07/05(q) 40 years
Jacksonville, FL . . . . . . . . . . . . . . — 2,225,177 315,315 — — 2,225,177 315,315 2,540,492 18,722 2006 08/05 40 years
Ocala, FL . . . . . . . . . . . . . . . . . . . — 845,827 — 1,563,500 — 845,827 1,563,500 2,409,327 21,172 2007 02/06(q) 40 years
Logan’s Roadhouse:
Alexandria, LA . . . . . . . . . . . . . . — 1,217,567 3,048,693 — — 1,217,567 3,048,693 4,266,260 85,744 1998 11/06 40 years
Beckley, WV . . . . . . . . . . . . . . . . — 1,396,024 2,404,817 — — 1,396,024 2,404,817 3,800,841 67,635 2006 11/06 40 years
Cookeville, TN . . . . . . . . . . . . . . — 1,262,430 2,270,596 — — 1,262,430 2,270,596 3,533,026 63,860 1997 11/06 40 years
Fort Wayne, IN . . . . . . . . . . . . . . — 1,274,315 2,109,860 — — 1,274,315 2,109,860 3,384,175 59,340 2003 11/06 40 years
Greenwood, IN . . . . . . . . . . . . . . — 1,341,188 2,105,213 — — 1,341,188 2,105,213 3,446,401 59,209 2000 11/06 40 years
Hurst, TX . . . . . . . . . . . . . . . . . . . — 1,857,628 1,915,877 — — 1,857,628 1,915,877 3,773,505 53,884 1999 11/06 40 years
Jackson, TN . . . . . . . . . . . . . . . . . — 1,199,765 2,246,330 — — 1,199,765 2,246,330 3,446,095 63,178 1994 11/06 40 years
Lake Charles, LA . . . . . . . . . . . . . — 1,284,898 2,202,447 — — 1,284,898 2,202,447 3,487,345 61,944 1998 11/06 40 years
McAllen, TX . . . . . . . . . . . . . . . . — 1,607,806 2,177,715 — — 1,607,806 2,177,715 3,785,521 61,248 2005 11/06 40 years
Opelika, AL . . . . . . . . . . . . . . . . . — 1,028,484 1,753,045 — — 1,028,484 1,753,045 2,781,529 49,304 2005 11/06 40 years
Roanoke, VA . . . . . . . . . . . . . . . . — 2,302,414 1,947,141 — — 2,302,414 1,947,141 4,249,555 54,763 1998 11/06 40 years
San Marcos, TX . . . . . . . . . . . . . . — 836,979 1,453,300 — — 836,979 1,453,300 2,290,279 40,874 2000 11/06 40 years
Sanford, FL . . . . . . . . . . . . . . . . . — 1,677,782 1,730,390 — — 1,677,782 1,730,390 3,408,172 48,667 1999 11/06 40 years
Smyrna, TN . . . . . . . . . . . . . . . . . — 1,334,998 2,047,465 — — 1,334,998 2,047,465 3,382,463 57,585 2002 11/06 40 years
Warner Robins, GA . . . . . . . . . . . — 905,301 1,533,748 — — 905,301 1,533,748 2,439,049 43,136 2004 11/06 40 years
Franklin, TN . . . . . . . . . . . . . . . . — 2,519,485 1,704,790 — — 2,519,485 1,704,790 4,224,275 44,396 1995 12/06 40 years
Southaven, MS . . . . . . . . . . . . . . — 1,297,767 1,338,118 — — 1,297,767 1,338,118 2,635,885 34,847 2005 12/06 40 years
Lowe’s:
Memphis, TN . . . . . . . . . . . . . . . . — 3,214,835 9,169,885 — — 3,214,835 9,169,885 12,384,720 1,271,710 2001 06/02 40 years
Magic China Café:
Orlando, FL . . . . . . . . . . . . . . . . . 65,839(o) 40,200 110,531 — — 40,200 110,531 150,731 10,708 2001 02/04 40 years
Magic Mountain:
Columbus, OH . . . . . . . . . . . . . . . — 2,075,527 1,906,370 — — 2,075,527 1,906,370 3,981,897 25,815 1990 06/07 40 years
Columbus, OH . . . . . . . . . . . . . . . — 5,379,851 2,693,295 — — 5,379,851 2,693,295 8,073,146 36,471 1990 06/07 40 years
Majestic Liquors:
Arlington, TX . . . . . . . . . . . . . . . — 1,235,214 1,222,434 — — 1,235,214 1,222,434 2,457,648 87,862 1990 02/05 40 years
Coffee City, TX . . . . . . . . . . . . . . — 1,330,427 3,858,445 — — 1,330,427 3,858,445 5,188,872 277,326 1996 02/05 40 years
Ft. Worth, TX . . . . . . . . . . . . . . . — 1,461,333 1,673,229 — — 1,461,333 1,673,229 3,134,562 120,263 1999 02/05 40 years
Ft. Worth, TX . . . . . . . . . . . . . . . — 1,651,570 2,017,770 — — 1,651,570 2,017,770 3,669,340 145,027 2000 02/05 40 years
Ft. Worth, TX . . . . . . . . . . . . . . . — 2,505,249 2,138,400 — — 2,505,249 2,138,400 4,643,649 153,698 1988 02/05 40 years
Ft. Worth, TX . . . . . . . . . . . . . . . — 977,290 2,368,447 — — 977,290 2,368,447 3,345,737 170,232 1997 02/05 40 years
Ft. Worth, TX . . . . . . . . . . . . . . . — 611,366 1,608,555 — — 611,366 1,608,555 2,219,921 115,615 1974 02/05 40 years
Hudson Oaks, TX . . . . . . . . . . . . — 361,371 1,029,053 — — 361,371 1,029,053 1,390,424 73,963 1993 02/05 40 years
Granbury, TX . . . . . . . . . . . . . . . — 786,159 1,233,984 — — 786,159 1,233,984 2,020,143 55,272 2006 05/05(g) 40 years
Dallas, TX . . . . . . . . . . . . . . . . . . — 1,554,411 1,228,778 — — 1,554,411 1,228,778 2,783,189 78,079 1982 06/05 40 years
Dallas, TX . . . . . . . . . . . . . . . . . . — 2,407,203 2,050,580 248,000 — 2,407,203 2,298,580 4,705,783 139,344 1971 06/05 40 years
Azle, TX . . . . . . . . . . . . . . . . . . . — 648,274 859,435 — — 648,274 859,435 1,507,709 11,638 1970 06/07 40 years
Ft. Worth, TX . . . . . . . . . . . . . . . — 574,618 933,091 — — 574,618 933,091 1,507,709 12,636 1982 06/07 40 years
Lubbock, TX . . . . . . . . . . . . . . . . — 1,293,214 1,210,826 — — 1,293,214 1,210,826 2,504,040 13,874 1983 07/07 40 years
Lubbock, TX . . . . . . . . . . . . . . . . — 2,606,118 2,897,922 — — 2,606,118 2,897,922 5,504,040 33,205 1983 07/07 40 years
Merchant’s Tires:
Hampton, VA . . . . . . . . . . . . . . . — 179,835 426,895 — — 179,835 426,895 606,730 29,794 1986 03/05 40 years
Newport News, VA . . . . . . . . . . . — 233,812 259,046 — — 233,812 259,046 492,858 18,079 1986 03/05 40 years
Norfolk, VA . . . . . . . . . . . . . . . . . — 398,132 507,743 — — 398,132 507,743 905,875 35,436 1986 03/05 40 years
Rockville, MD . . . . . . . . . . . . . . . — 1,030,156 306,147 — — 1,030,156 306,147 1,336,303 21,367 1974 03/05 40 years
Washington, DC . . . . . . . . . . . . . — 623,607 577,948 — — 623,607 577,948 1,201,555 40,336 1983 03/05 40 years
Mi Pueblo Foods:
Watsonville, CA . . . . . . . . . . . . . — 805,056 1,648,934 — — 805,056 1,648,934 2,453,990 173,482 1984 03/99 40 years
Michaels:
Fairfax, VA . . . . . . . . . . . . . . . . . — 986,131 1,426,254 706,501 — 986,131 2,132,755 3,118,886 476,206 1995 12/95 40 years
Grapevine, TX (r) . . . . . . . . . . . . — 1,017,934 2,066,715 — — 1,017,934 2,066,715 3,084,649 492,997 1998 06/98 40 years
Plymouth Meeting, PA . . . . . . . . — 2,911,111 — 2,594,720 — 2,911,111 2,594,720 5,505,831 494,507 1999 10/98(g) 40 years
See accompanying report of independent registered public accounting firm.
F-9
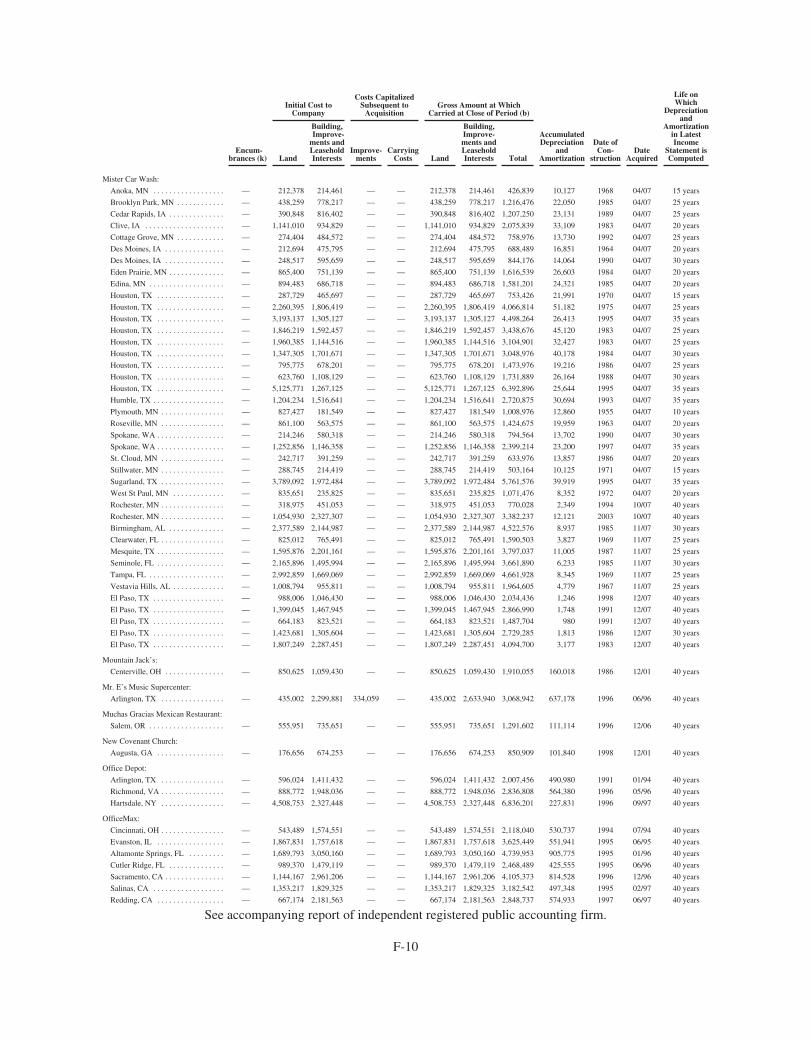
Encum-brances (k)
Initial Cost toCompany
Costs CapitalizedSubsequent to
AcquisitionGross Amount at Which
Carried at Close of Period (b)
AccumulatedDepreciation
andAmortization
Date ofCon-
structionDate
Acquired
Life onWhich
Depreciationand
Amortizationin LatestIncome
Statement isComputedLand
Building,Improve-
ments andLeaseholdInterests
Improve-ments
CarryingCosts Land
Building,Improve-ments andLeaseholdInterests Total
Mister Car Wash:
Anoka, MN . . . . . . . . . . . . . . . . . . — 212,378 214,461 — — 212,378 214,461 426,839 10,127 1968 04/07 15 years
Brooklyn Park, MN . . . . . . . . . . . . — 438,259 778,217 — — 438,259 778,217 1,216,476 22,050 1985 04/07 25 years
Cedar Rapids, IA . . . . . . . . . . . . . . — 390,848 816,402 — — 390,848 816,402 1,207,250 23,131 1989 04/07 25 years
Clive, IA . . . . . . . . . . . . . . . . . . . . — 1,141,010 934,829 — — 1,141,010 934,829 2,075,839 33,109 1983 04/07 20 years
Cottage Grove, MN . . . . . . . . . . . . — 274,404 484,572 — — 274,404 484,572 758,976 13,730 1992 04/07 25 years
Des Moines, IA . . . . . . . . . . . . . . . — 212,694 475,795 — — 212,694 475,795 688,489 16,851 1964 04/07 20 years
Des Moines, IA . . . . . . . . . . . . . . . — 248,517 595,659 — — 248,517 595,659 844,176 14,064 1990 04/07 30 years
Eden Prairie, MN . . . . . . . . . . . . . . — 865,400 751,139 — — 865,400 751,139 1,616,539 26,603 1984 04/07 20 years
Edina, MN . . . . . . . . . . . . . . . . . . . — 894,483 686,718 — — 894,483 686,718 1,581,201 24,321 1985 04/07 20 years
Houston, TX . . . . . . . . . . . . . . . . . — 287,729 465,697 — — 287,729 465,697 753,426 21,991 1970 04/07 15 years
Houston, TX . . . . . . . . . . . . . . . . . — 2,260,395 1,806,419 — — 2,260,395 1,806,419 4,066,814 51,182 1975 04/07 25 years
Houston, TX . . . . . . . . . . . . . . . . . — 3,193,137 1,305,127 — — 3,193,137 1,305,127 4,498,264 26,413 1995 04/07 35 years
Houston, TX . . . . . . . . . . . . . . . . . — 1,846,219 1,592,457 — — 1,846,219 1,592,457 3,438,676 45,120 1983 04/07 25 years
Houston, TX . . . . . . . . . . . . . . . . . — 1,960,385 1,144,516 — — 1,960,385 1,144,516 3,104,901 32,427 1983 04/07 25 years
Houston, TX . . . . . . . . . . . . . . . . . — 1,347,305 1,701,671 — — 1,347,305 1,701,671 3,048,976 40,178 1984 04/07 30 years
Houston, TX . . . . . . . . . . . . . . . . . — 795,775 678,201 — — 795,775 678,201 1,473,976 19,216 1986 04/07 25 years
Houston, TX . . . . . . . . . . . . . . . . . — 623,760 1,108,129 — — 623,760 1,108,129 1,731,889 26,164 1988 04/07 30 years
Houston, TX . . . . . . . . . . . . . . . . . — 5,125,771 1,267,125 — — 5,125,771 1,267,125 6,392,896 25,644 1995 04/07 35 years
Humble, TX . . . . . . . . . . . . . . . . . . — 1,204,234 1,516,641 — — 1,204,234 1,516,641 2,720,875 30,694 1993 04/07 35 years
Plymouth, MN . . . . . . . . . . . . . . . . — 827,427 181,549 — — 827,427 181,549 1,008,976 12,860 1955 04/07 10 years
Roseville, MN . . . . . . . . . . . . . . . . — 861,100 563,575 — — 861,100 563,575 1,424,675 19,959 1963 04/07 20 years
Spokane, WA . . . . . . . . . . . . . . . . . — 214,246 580,318 — — 214,246 580,318 794,564 13,702 1990 04/07 30 years
Spokane, WA . . . . . . . . . . . . . . . . . — 1,252,856 1,146,358 — — 1,252,856 1,146,358 2,399,214 23,200 1997 04/07 35 years
St. Cloud, MN . . . . . . . . . . . . . . . . — 242,717 391,259 — — 242,717 391,259 633,976 13,857 1986 04/07 20 years
Stillwater, MN . . . . . . . . . . . . . . . . — 288,745 214,419 — — 288,745 214,419 503,164 10,125 1971 04/07 15 years
Sugarland, TX . . . . . . . . . . . . . . . . — 3,789,092 1,972,484 — — 3,789,092 1,972,484 5,761,576 39,919 1995 04/07 35 years
West St Paul, MN . . . . . . . . . . . . . — 835,651 235,825 — — 835,651 235,825 1,071,476 8,352 1972 04/07 20 years
Rochester, MN . . . . . . . . . . . . . . . . — 318,975 451,053 — — 318,975 451,053 770,028 2,349 1994 10/07 40 years
Rochester, MN . . . . . . . . . . . . . . . . — 1,054,930 2,327,307 — — 1,054,930 2,327,307 3,382,237 12,121 2003 10/07 40 years
Birmingham, AL . . . . . . . . . . . . . . — 2,377,589 2,144,987 — — 2,377,589 2,144,987 4,522,576 8,937 1985 11/07 30 years
Clearwater, FL . . . . . . . . . . . . . . . . — 825,012 765,491 — — 825,012 765,491 1,590,503 3,827 1969 11/07 25 years
Mesquite, TX . . . . . . . . . . . . . . . . . — 1,595,876 2,201,161 — — 1,595,876 2,201,161 3,797,037 11,005 1987 11/07 25 years
Seminole, FL . . . . . . . . . . . . . . . . . — 2,165,896 1,495,994 — — 2,165,896 1,495,994 3,661,890 6,233 1985 11/07 30 years
Tampa, FL . . . . . . . . . . . . . . . . . . . — 2,992,859 1,669,069 — — 2,992,859 1,669,069 4,661,928 8,345 1969 11/07 25 years
Vestavia Hills, AL . . . . . . . . . . . . . — 1,008,794 955,811 — — 1,008,794 955,811 1,964,605 4,779 1967 11/07 25 years
El Paso, TX . . . . . . . . . . . . . . . . . . — 988,006 1,046,430 — — 988,006 1,046,430 2,034,436 1,246 1998 12/07 40 years
El Paso, TX . . . . . . . . . . . . . . . . . . — 1,399,045 1,467,945 — — 1,399,045 1,467,945 2,866,990 1,748 1991 12/07 40 years
El Paso, TX . . . . . . . . . . . . . . . . . . — 664,183 823,521 — — 664,183 823,521 1,487,704 980 1991 12/07 40 years
El Paso, TX . . . . . . . . . . . . . . . . . . — 1,423,681 1,305,604 — — 1,423,681 1,305,604 2,729,285 1,813 1986 12/07 30 years
El Paso, TX . . . . . . . . . . . . . . . . . . — 1,807,249 2,287,451 — — 1,807,249 2,287,451 4,094,700 3,177 1983 12/07 40 years
Mountain Jack’s:
Centerville, OH . . . . . . . . . . . . . . . — 850,625 1,059,430 — — 850,625 1,059,430 1,910,055 160,018 1986 12/01 40 years
Mr. E’s Music Supercenter:
Arlington, TX . . . . . . . . . . . . . . . . — 435,002 2,299,881 334,059 — 435,002 2,633,940 3,068,942 637,178 1996 06/96 40 years
Muchas Gracias Mexican Restaurant:
Salem, OR . . . . . . . . . . . . . . . . . . . — 555,951 735,651 — — 555,951 735,651 1,291,602 111,114 1996 12/06 40 years
New Covenant Church:
Augusta, GA . . . . . . . . . . . . . . . . . — 176,656 674,253 — — 176,656 674,253 850,909 101,840 1998 12/01 40 years
Office Depot:
Arlington, TX . . . . . . . . . . . . . . . . — 596,024 1,411,432 — — 596,024 1,411,432 2,007,456 490,980 1991 01/94 40 years
Richmond, VA . . . . . . . . . . . . . . . . — 888,772 1,948,036 — — 888,772 1,948,036 2,836,808 564,380 1996 05/96 40 years
Hartsdale, NY . . . . . . . . . . . . . . . . — 4,508,753 2,327,448 — — 4,508,753 2,327,448 6,836,201 227,831 1996 09/97 40 years
OfficeMax:
Cincinnati, OH . . . . . . . . . . . . . . . . — 543,489 1,574,551 — — 543,489 1,574,551 2,118,040 530,737 1994 07/94 40 years
Evanston, IL . . . . . . . . . . . . . . . . . — 1,867,831 1,757,618 — — 1,867,831 1,757,618 3,625,449 551,941 1995 06/95 40 years
Altamonte Springs, FL . . . . . . . . . — 1,689,793 3,050,160 — — 1,689,793 3,050,160 4,739,953 905,775 1995 01/96 40 years
Cutler Ridge, FL . . . . . . . . . . . . . . — 989,370 1,479,119 — — 989,370 1,479,119 2,468,489 425,555 1995 06/96 40 years
Sacramento, CA . . . . . . . . . . . . . . . — 1,144,167 2,961,206 — — 1,144,167 2,961,206 4,105,373 814,528 1996 12/96 40 years
Salinas, CA . . . . . . . . . . . . . . . . . . — 1,353,217 1,829,325 — — 1,353,217 1,829,325 3,182,542 497,348 1995 02/97 40 years
Redding, CA . . . . . . . . . . . . . . . . . — 667,174 2,181,563 — — 667,174 2,181,563 2,848,737 574,933 1997 06/97 40 years
See accompanying report of independent registered public accounting firm.
F-10
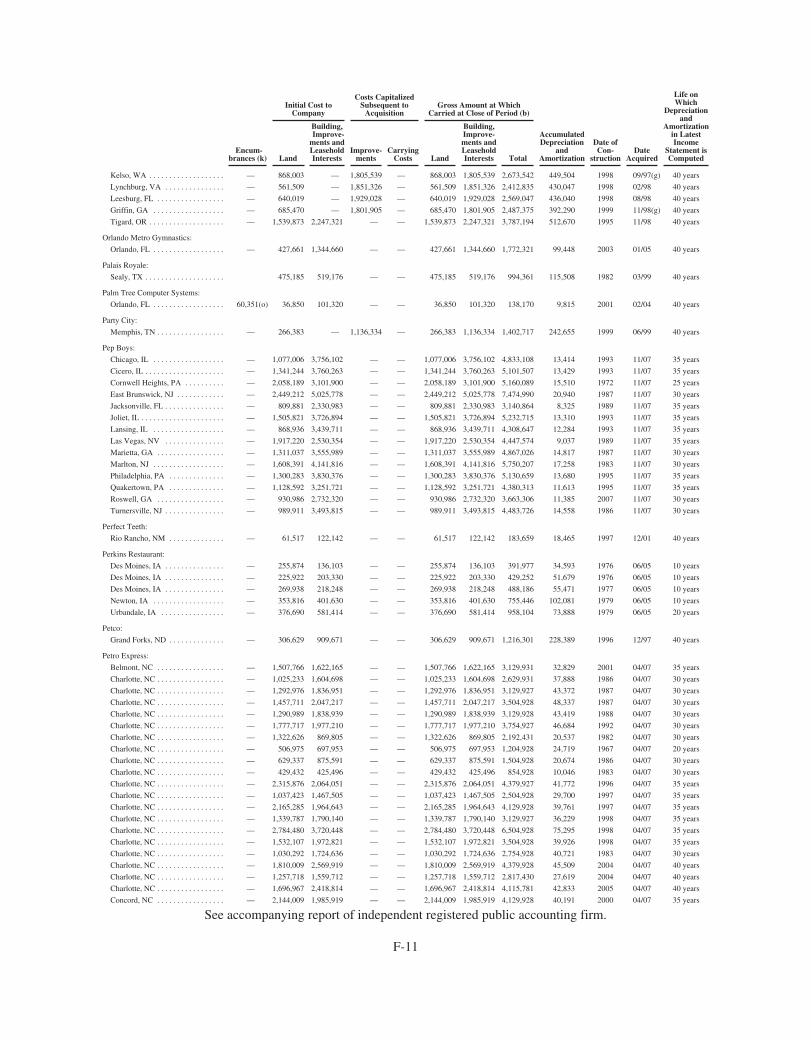
Encum-brances (k)
Initial Cost toCompany
Costs CapitalizedSubsequent to
AcquisitionGross Amount at Which
Carried at Close of Period (b)
AccumulatedDepreciation
andAmortization
Date ofCon-
structionDate
Acquired
Life onWhich
Depreciationand
Amortizationin LatestIncome
Statement isComputedLand
Building,Improve-
ments andLeaseholdInterests
Improve-ments
CarryingCosts Land
Building,Improve-ments andLeaseholdInterests Total
Kelso, WA . . . . . . . . . . . . . . . . . . . — 868,003 — 1,805,539 — 868,003 1,805,539 2,673,542 449,504 1998 09/97(g) 40 years
Lynchburg, VA . . . . . . . . . . . . . . . — 561,509 — 1,851,326 — 561,509 1,851,326 2,412,835 430,047 1998 02/98 40 years
Leesburg, FL . . . . . . . . . . . . . . . . . — 640,019 — 1,929,028 — 640,019 1,929,028 2,569,047 436,040 1998 08/98 40 years
Griffin, GA . . . . . . . . . . . . . . . . . . — 685,470 — 1,801,905 — 685,470 1,801,905 2,487,375 392,290 1999 11/98(g) 40 years
Tigard, OR . . . . . . . . . . . . . . . . . . . — 1,539,873 2,247,321 — — 1,539,873 2,247,321 3,787,194 512,670 1995 11/98 40 years
Orlando Metro Gymnastics:
Orlando, FL . . . . . . . . . . . . . . . . . . — 427,661 1,344,660 — — 427,661 1,344,660 1,772,321 99,448 2003 01/05 40 years
Palais Royale:
Sealy, TX . . . . . . . . . . . . . . . . . . . . 475,185 519,176 — — 475,185 519,176 994,361 115,508 1982 03/99 40 years
Palm Tree Computer Systems:
Orlando, FL . . . . . . . . . . . . . . . . . . 60,351(o) 36,850 101,320 — — 36,850 101,320 138,170 9,815 2001 02/04 40 years
Party City:
Memphis, TN . . . . . . . . . . . . . . . . . — 266,383 — 1,136,334 — 266,383 1,136,334 1,402,717 242,655 1999 06/99 40 years
Pep Boys:
Chicago, IL . . . . . . . . . . . . . . . . . . — 1,077,006 3,756,102 — — 1,077,006 3,756,102 4,833,108 13,414 1993 11/07 35 years
Cicero, IL . . . . . . . . . . . . . . . . . . . . — 1,341,244 3,760,263 — — 1,341,244 3,760,263 5,101,507 13,429 1993 11/07 35 years
Cornwell Heights, PA . . . . . . . . . . — 2,058,189 3,101,900 — — 2,058,189 3,101,900 5,160,089 15,510 1972 11/07 25 years
East Brunswick, NJ . . . . . . . . . . . . — 2,449,212 5,025,778 — — 2,449,212 5,025,778 7,474,990 20,940 1987 11/07 30 years
Jacksonville, FL . . . . . . . . . . . . . . . — 809,881 2,330,983 — — 809,881 2,330,983 3,140,864 8,325 1989 11/07 35 years
Joliet, IL . . . . . . . . . . . . . . . . . . . . . — 1,505,821 3,726,894 — — 1,505,821 3,726,894 5,232,715 13,310 1993 11/07 35 years
Lansing, IL . . . . . . . . . . . . . . . . . . — 868,936 3,439,711 — — 868,936 3,439,711 4,308,647 12,284 1993 11/07 35 years
Las Vegas, NV . . . . . . . . . . . . . . . — 1,917,220 2,530,354 — — 1,917,220 2,530,354 4,447,574 9,037 1989 11/07 35 years
Marietta, GA . . . . . . . . . . . . . . . . . — 1,311,037 3,555,989 — — 1,311,037 3,555,989 4,867,026 14,817 1987 11/07 30 years
Marlton, NJ . . . . . . . . . . . . . . . . . . — 1,608,391 4,141,816 — — 1,608,391 4,141,816 5,750,207 17,258 1983 11/07 30 years
Philadelphia, PA . . . . . . . . . . . . . . — 1,300,283 3,830,376 — — 1,300,283 3,830,376 5,130,659 13,680 1995 11/07 35 years
Quakertown, PA . . . . . . . . . . . . . . — 1,128,592 3,251,721 — — 1,128,592 3,251,721 4,380,313 11,613 1995 11/07 35 years
Roswell, GA . . . . . . . . . . . . . . . . . — 930,986 2,732,320 — — 930,986 2,732,320 3,663,306 11,385 2007 11/07 30 years
Turnersville, NJ . . . . . . . . . . . . . . . — 989,911 3,493,815 — — 989,911 3,493,815 4,483,726 14,558 1986 11/07 30 years
Perfect Teeth:
Rio Rancho, NM . . . . . . . . . . . . . . — 61,517 122,142 — — 61,517 122,142 183,659 18,465 1997 12/01 40 years
Perkins Restaurant:
Des Moines, IA . . . . . . . . . . . . . . . — 255,874 136,103 — — 255,874 136,103 391,977 34,593 1976 06/05 10 years
Des Moines, IA . . . . . . . . . . . . . . . — 225,922 203,330 — — 225,922 203,330 429,252 51,679 1976 06/05 10 years
Des Moines, IA . . . . . . . . . . . . . . . — 269,938 218,248 — — 269,938 218,248 488,186 55,471 1977 06/05 10 years
Newton, IA . . . . . . . . . . . . . . . . . . — 353,816 401,630 — — 353,816 401,630 755,446 102,081 1979 06/05 10 years
Urbandale, IA . . . . . . . . . . . . . . . . — 376,690 581,414 — — 376,690 581,414 958,104 73,888 1979 06/05 20 years
Petco:
Grand Forks, ND . . . . . . . . . . . . . . — 306,629 909,671 — — 306,629 909,671 1,216,301 228,389 1996 12/97 40 years
Petro Express:
Belmont, NC . . . . . . . . . . . . . . . . . — 1,507,766 1,622,165 — — 1,507,766 1,622,165 3,129,931 32,829 2001 04/07 35 years
Charlotte, NC . . . . . . . . . . . . . . . . . — 1,025,233 1,604,698 — — 1,025,233 1,604,698 2,629,931 37,888 1986 04/07 30 years
Charlotte, NC . . . . . . . . . . . . . . . . . — 1,292,976 1,836,951 — — 1,292,976 1,836,951 3,129,927 43,372 1987 04/07 30 years
Charlotte, NC . . . . . . . . . . . . . . . . . — 1,457,711 2,047,217 — — 1,457,711 2,047,217 3,504,928 48,337 1987 04/07 30 years
Charlotte, NC . . . . . . . . . . . . . . . . . — 1,290,989 1,838,939 — — 1,290,989 1,838,939 3,129,928 43,419 1988 04/07 30 years
Charlotte, NC . . . . . . . . . . . . . . . . . — 1,777,717 1,977,210 — — 1,777,717 1,977,210 3,754,927 46,684 1992 04/07 30 years
Charlotte, NC . . . . . . . . . . . . . . . . . — 1,322,626 869,805 — — 1,322,626 869,805 2,192,431 20,537 1982 04/07 30 years
Charlotte, NC . . . . . . . . . . . . . . . . . — 506,975 697,953 — — 506,975 697,953 1,204,928 24,719 1967 04/07 20 years
Charlotte, NC . . . . . . . . . . . . . . . . . — 629,337 875,591 — — 629,337 875,591 1,504,928 20,674 1986 04/07 30 years
Charlotte, NC . . . . . . . . . . . . . . . . . — 429,432 425,496 — — 429,432 425,496 854,928 10,046 1983 04/07 30 years
Charlotte, NC . . . . . . . . . . . . . . . . . — 2,315,876 2,064,051 — — 2,315,876 2,064,051 4,379,927 41,772 1996 04/07 35 years
Charlotte, NC . . . . . . . . . . . . . . . . . — 1,037,423 1,467,505 — — 1,037,423 1,467,505 2,504,928 29,700 1997 04/07 35 years
Charlotte, NC . . . . . . . . . . . . . . . . . — 2,165,285 1,964,643 — — 2,165,285 1,964,643 4,129,928 39,761 1997 04/07 35 years
Charlotte, NC . . . . . . . . . . . . . . . . . — 1,339,787 1,790,140 — — 1,339,787 1,790,140 3,129,927 36,229 1998 04/07 35 years
Charlotte, NC . . . . . . . . . . . . . . . . . — 2,784,480 3,720,448 — — 2,784,480 3,720,448 6,504,928 75,295 1998 04/07 35 years
Charlotte, NC . . . . . . . . . . . . . . . . . — 1,532,107 1,972,821 — — 1,532,107 1,972,821 3,504,928 39,926 1998 04/07 35 years
Charlotte, NC . . . . . . . . . . . . . . . . . — 1,030,292 1,724,636 — — 1,030,292 1,724,636 2,754,928 40,721 1983 04/07 30 years
Charlotte, NC . . . . . . . . . . . . . . . . . — 1,810,009 2,569,919 — — 1,810,009 2,569,919 4,379,928 45,509 2004 04/07 40 years
Charlotte, NC . . . . . . . . . . . . . . . . . — 1,257,718 1,559,712 — — 1,257,718 1,559,712 2,817,430 27,619 2004 04/07 40 years
Charlotte, NC . . . . . . . . . . . . . . . . . — 1,696,967 2,418,814 — — 1,696,967 2,418,814 4,115,781 42,833 2005 04/07 40 years
Concord, NC . . . . . . . . . . . . . . . . . — 2,144,009 1,985,919 — — 2,144,009 1,985,919 4,129,928 40,191 2000 04/07 35 years
See accompanying report of independent registered public accounting firm.
F-11

Encum-brances (k)
Initial Cost toCompany
Costs CapitalizedSubsequent to
AcquisitionGross Amount at Which
Carried at Close of Period (b)
AccumulatedDepreciation
andAmortization
Date ofCon-
structionDate
Acquired
Life onWhich
Depreciationand
Amortizationin LatestIncome
Statement isComputedLand
Building,Improve-
ments andLeaseholdInterests
Improve-ments
CarryingCosts Land
Building,Improve-ments andLeaseholdInterests Total
Concord, NC . . . . . . . . . . . . . . . . . — 1,828,292 1,676,647 — — 1,828,292 1,676,647 3,504,939 33,932 2002 04/07 35 years
Conover, NC . . . . . . . . . . . . . . . . . — 917,090 1,275,337 — — 917,090 1,275,337 2,192,427 25,810 1999 04/07 35 years
Cornelius, NC . . . . . . . . . . . . . . . . — 1,653,202 2,664,228 — — 1,653,202 2,664,228 4,317,430 53,919 2000 04/07 35 years
Denver, NC . . . . . . . . . . . . . . . . . . — 2,317,321 1,750,110 — — 2,317,321 1,750,110 4,067,431 35,418 1999 04/07 35 years
Fort Mill, SC . . . . . . . . . . . . . . . . . — 3,825,461 2,554,459 — — 3,825,461 2,554,459 6,379,920 51,697 1998 04/07 35 years
Fort Mill, SC . . . . . . . . . . . . . . . . . — 1,883,231 1,559,190 — — 1,883,231 1,559,190 3,442,421 36,814 1988 04/07 30 years
Gastonia, NC . . . . . . . . . . . . . . . . . — 964,906 1,227,521 — — 964,906 1,227,521 2,192,427 24,843 2001 04/07 35 years
Gastonia, NC . . . . . . . . . . . . . . . . . — 335,424 544,504 — — 335,424 544,504 879,928 9,642 2000 04/07 40 years
Gastonia, NC . . . . . . . . . . . . . . . . . — 1,070,390 1,184,517 — — 1,070,390 1,184,517 2,254,907 23,972 1990 04/07 35 years
Gastonia, NC . . . . . . . . . . . . . . . . . — 744,571 760,356 — — 744,571 760,356 1,504,927 13,465 2003 04/07 40 years
Hickory, NC . . . . . . . . . . . . . . . . . — 1,975,267 1,529,667 — — 1,975,267 1,529,667 3,504,934 30,957 2002 04/07 35 years
Kings Mountain, NC . . . . . . . . . . . — 1,210,397 982,031 — — 1,210,397 982,031 2,192,428 19,874 1988 04/07 35 years
Lake Wylie, SC . . . . . . . . . . . . . . . — 1,972,180 1,282,737 — — 1,972,180 1,282,737 3,254,917 25,960 2003 04/07 35 years
Lake Wylie, SC . . . . . . . . . . . . . . . — 1,380,939 2,061,482 — — 1,380,939 2,061,482 3,442,421 41,720 1998 04/07 35 years
Lincolnton, NC . . . . . . . . . . . . . . . — 722,773 532,154 — — 722,773 532,154 1,254,927 12,565 1989 04/07 30 years
Lincolnton, NC . . . . . . . . . . . . . . . — 2,358,754 1,771,201 — — 2,358,754 1,771,201 4,129,955 35,846 2000 04/07 35 years
Matthews, NC . . . . . . . . . . . . . . . . — 1,196,544 1,745,883 — — 1,196,544 1,745,883 2,942,427 41,222 1987 04/07 30 years
Mineral Springs, NC . . . . . . . . . . . — 677,575 577,353 — — 677,575 577,353 1,254,928 10,224 2002 04/07 40 years
Monroe, NC . . . . . . . . . . . . . . . . . . — 420,625 834,302 — — 420,625 834,302 1,254,927 16,885 1997 04/07 35 years
Monroe, NC . . . . . . . . . . . . . . . . . . — 709,082 795,846 — — 709,082 795,846 1,504,928 16,106 1999 04/07 35 years
Monroe, NC . . . . . . . . . . . . . . . . . . — 857,369 1,022,565 — — 857,369 1,022,565 1,879,934 18,108 2004 04/07 40 years
Rock Hill, SC . . . . . . . . . . . . . . . . . — 2,118,790 1,886,128 — — 2,118,790 1,886,128 4,004,918 38,172 1998 04/07 35 years
Rock Hill, SC . . . . . . . . . . . . . . . . . — 3,095,160 1,909,758 — — 3,095,160 1,909,758 5,004,918 38,650 1999 04/07 35 years
Rock Hill, SC . . . . . . . . . . . . . . . . . — 777,836 727,082 — — 777,836 727,082 1,504,918 17,167 1990 04/07 30 years
Statesville, NC . . . . . . . . . . . . . . . . — 1,885,746 2,181,682 — — 1,885,746 2,181,682 4,067,428 44,153 1999 04/07 35 years
Thomasville, NC . . . . . . . . . . . . . . — 993,898 1,761,032 — — 993,898 1,761,032 2,754,930 35,640 2000 04/07 35 years
Waxhaw, NC . . . . . . . . . . . . . . . . . — 508,235 746,698 — — 508,235 746,698 1,254,933 13,223 2002 04/07 40 years
York, SC . . . . . . . . . . . . . . . . . . . . — 2,306,150 1,448,777 — — 2,306,150 1,448,777 3,754,927 29,320 1999 04/07 35 years
Charlotte, NC . . . . . . . . . . . . . . . . . — 1,231,265 1,214,175 — — 1,231,265 1,214,175 2,445,440 18,971 1997 05/07 40 years
Charlotte, NC . . . . . . . . . . . . . . . . . — 1,849,143 2,279,590 — — 1,849,143 2,279,590 4,128,733 35,618 2005 05/07 40 years
Rock Hill, SC . . . . . . . . . . . . . . . . . — 3,107,907 2,145,815 — — 3,107,907 2,145,815 5,253,722 33,528 1999 05/07 40 years
PETsMART:
Chicago, IL . . . . . . . . . . . . . . . . . . — 2,724,138 3,565,721 — — 2,724,138 3,565,721 6,289,859 828,279 1998 09/98 40 years
Picture Factory:
Sarasota, FL . . . . . . . . . . . . . . . . . . — 1,167,618 1,903,810 218,564 — 1,167,618 2,122,374 3,289,992 205,716 1996 09/97 40 years
Pier 1 Imports:
Anchorage, AK . . . . . . . . . . . . . . . — 928,321 1,662,584 — — 928,321 1,662,584 2,590,905 492,087 1995 02/96 40 years
Memphis, TN . . . . . . . . . . . . . . . . . — 713,319 821,770 — — 713,319 821,770 1,535,089 216,571 1997 09/96(f) 40 years
Sanford, FL . . . . . . . . . . . . . . . . . . — 738,051 803,082 — — 738,051 803,082 1,541,133 196,588 1998 06/97(f) 40 years
Knoxville, TN . . . . . . . . . . . . . . . . — 467,169 734,833 — — 467,169 734,833 1,202,002 164,571 1999 01/98(f) 40 years
Mason, OH . . . . . . . . . . . . . . . . . . — 593,571 885,047 — — 593,571 885,047 1,478,617 188,994 1999 06/98(f) 40 years
Harlingen, TX . . . . . . . . . . . . . . . . — 316,640 756,406 — — 316,640 756,406 1,073,046 155,221 1999 11/98(f) 40 years
Valdosta, GA . . . . . . . . . . . . . . . . . — 390,838 805,912 — — 390,838 805,912 1,196,750 163,701 1999 01/99(f) 40 years
Pizza Hut:
Monroeville, AL . . . . . . . . . . . . . . — 547,300 44,237 — — 547,300 44,237 591,537 6,682 1976 12/01 40 years
Pizza Place, The:
Cohoes, NY . . . . . . . . . . . . . . . . . . — 16,396 88,372 — — 16,396 88,372 104,768 7,151 1994 09/04 40 years
Popeye’s:
Snellville, GA . . . . . . . . . . . . . . . . — 642,169 436,512 — — 642,169 436,512 1,078,681 65,931 1995 12/01 40 years
Pueblo Viejo Restaurant:
Chandler, AZ . . . . . . . . . . . . . . . . . — 654,765 765,164 7,500 — 654,765 772,664 1,427,429 122,640 1997 12/01 40 years
Pull-A-Part:
Birmingham, AL . . . . . . . . . . . . . . — 1,164,780 2,090,094 — — 1,164,780 2,090,094 3,254,874 71,847 1964 08/06 40 years
Augusta, GA . . . . . . . . . . . . . . . . . — 1,414,381 — 1,450,906 — 1,414,381 1,450,906 2,865,287 19,648 2007 08/06(q) 40 years
Conley, GA . . . . . . . . . . . . . . . . . . — 1,685,604 1,387,170 — — 1,685,604 1,387,170 3,072,774 47,684 1999 08/06 40 years
Norcross, GA . . . . . . . . . . . . . . . . . — 1,831,129 1,040,317 — — 1,831,129 1,040,317 2,871,446 35,761 1998 08/06 40 years
Louisville, KY . . . . . . . . . . . . . . . . — 3,205,591 1,531,842 — — 3,205,591 1,531,842 4,737,433 52,657 2006 08/06 40 years
Harvey, LA . . . . . . . . . . . . . . . . . . — 1,881,371 — — — 1,881,371 — 1,881,371 (e) (e) 08/06(q) (e)
Charlotte, NC . . . . . . . . . . . . . . . . . — 2,912,842 1,724,045 — — 2,912,842 1,724,045 4,636,887 59,264 2006 08/06 40 years
Knoxville, TN . . . . . . . . . . . . . . . . — 961,067 — 2,384,443 — 961,067 2,384,443 3,345,510 27,322 2007 08/06(q) 40 years
Nashville, TN . . . . . . . . . . . . . . . . — 2,164,234 1,414,129 — — 2,164,234 1,414,129 3,578,363 48,611 2006 08/06 40 years
See accompanying report of independent registered public accounting firm.
F-12
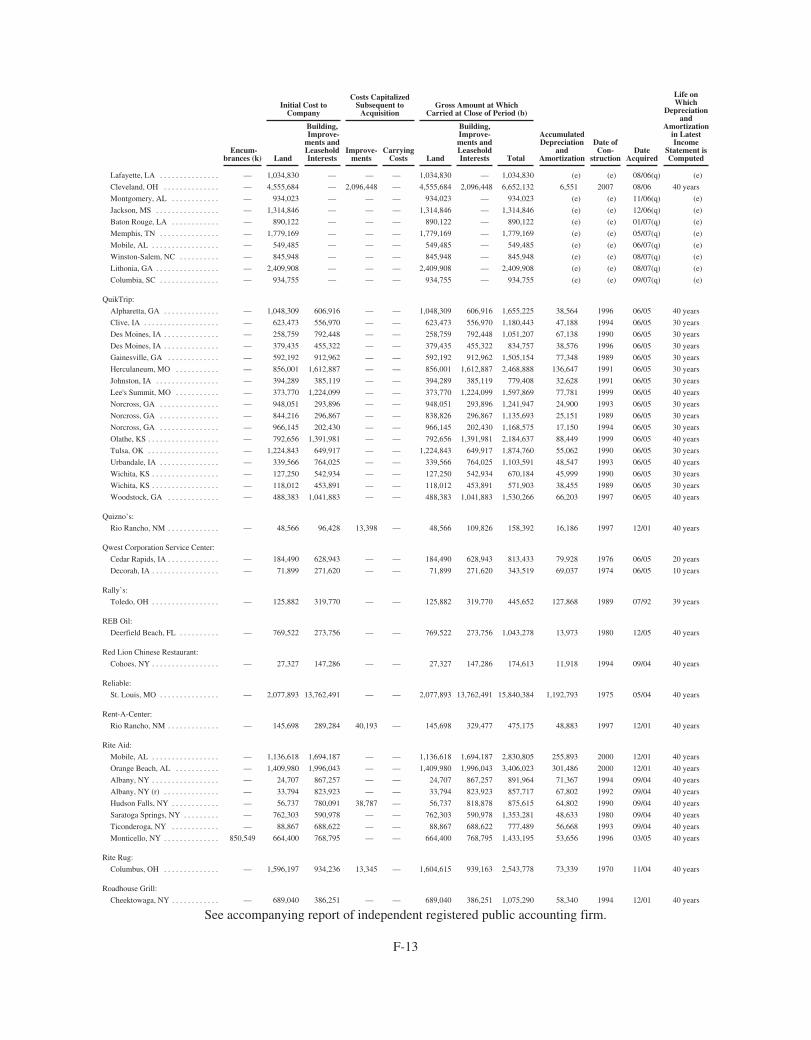
Encum-brances (k)
Initial Cost toCompany
Costs CapitalizedSubsequent to
AcquisitionGross Amount at Which
Carried at Close of Period (b)
AccumulatedDepreciation
andAmortization
Date ofCon-
structionDate
Acquired
Life onWhich
Depreciationand
Amortizationin LatestIncome
Statement isComputedLand
Building,Improve-
ments andLeaseholdInterests
Improve-ments
CarryingCosts Land
Building,Improve-ments andLeaseholdInterests Total
Lafayette, LA . . . . . . . . . . . . . . . — 1,034,830 — — — 1,034,830 — 1,034,830 (e) (e) 08/06(q) (e)
Cleveland, OH . . . . . . . . . . . . . . — 4,555,684 — 2,096,448 — 4,555,684 2,096,448 6,652,132 6,551 2007 08/06 40 years
Montgomery, AL . . . . . . . . . . . . — 934,023 — — — 934,023 — 934,023 (e) (e) 11/06(q) (e)
Jackson, MS . . . . . . . . . . . . . . . . — 1,314,846 — — — 1,314,846 — 1,314,846 (e) (e) 12/06(q) (e)
Baton Rouge, LA . . . . . . . . . . . . — 890,122 — — — 890,122 — 890,122 (e) (e) 01/07(q) (e)
Memphis, TN . . . . . . . . . . . . . . . — 1,779,169 — — — 1,779,169 — 1,779,169 (e) (e) 05/07(q) (e)
Mobile, AL . . . . . . . . . . . . . . . . . — 549,485 — — — 549,485 — 549,485 (e) (e) 06/07(q) (e)
Winston-Salem, NC . . . . . . . . . . — 845,948 — — — 845,948 — 845,948 (e) (e) 08/07(q) (e)
Lithonia, GA . . . . . . . . . . . . . . . . — 2,409,908 — — — 2,409,908 — 2,409,908 (e) (e) 08/07(q) (e)
Columbia, SC . . . . . . . . . . . . . . . — 934,755 — — — 934,755 — 934,755 (e) (e) 09/07(q) (e)
QuikTrip:
Alpharetta, GA . . . . . . . . . . . . . . — 1,048,309 606,916 — — 1,048,309 606,916 1,655,225 38,564 1996 06/05 40 years
Clive, IA . . . . . . . . . . . . . . . . . . . — 623,473 556,970 — — 623,473 556,970 1,180,443 47,188 1994 06/05 30 years
Des Moines, IA . . . . . . . . . . . . . . — 258,759 792,448 — — 258,759 792,448 1,051,207 67,138 1990 06/05 30 years
Des Moines, IA . . . . . . . . . . . . . . — 379,435 455,322 — — 379,435 455,322 834,757 38,576 1996 06/05 30 years
Gainesville, GA . . . . . . . . . . . . . — 592,192 912,962 — — 592,192 912,962 1,505,154 77,348 1989 06/05 30 years
Herculaneum, MO . . . . . . . . . . . — 856,001 1,612,887 — — 856,001 1,612,887 2,468,888 136,647 1991 06/05 30 years
Johnston, IA . . . . . . . . . . . . . . . . — 394,289 385,119 — — 394,289 385,119 779,408 32,628 1991 06/05 30 years
Lee's Summit, MO . . . . . . . . . . . — 373,770 1,224,099 — — 373,770 1,224,099 1,597,869 77,781 1999 06/05 40 years
Norcross, GA . . . . . . . . . . . . . . . — 948,051 293,896 — — 948,051 293,896 1,241,947 24,900 1993 06/05 30 years
Norcross, GA . . . . . . . . . . . . . . . — 844,216 296,867 — — 838,826 296,867 1,135,693 25,151 1989 06/05 30 years
Norcross, GA . . . . . . . . . . . . . . . — 966,145 202,430 — — 966,145 202,430 1,168,575 17,150 1994 06/05 30 years
Olathe, KS . . . . . . . . . . . . . . . . . . — 792,656 1,391,981 — — 792,656 1,391,981 2,184,637 88,449 1999 06/05 40 years
Tulsa, OK . . . . . . . . . . . . . . . . . . — 1,224,843 649,917 — — 1,224,843 649,917 1,874,760 55,062 1990 06/05 30 years
Urbandale, IA . . . . . . . . . . . . . . . — 339,566 764,025 — — 339,566 764,025 1,103,591 48,547 1993 06/05 40 years
Wichita, KS . . . . . . . . . . . . . . . . . — 127,250 542,934 — — 127,250 542,934 670,184 45,999 1990 06/05 30 years
Wichita, KS . . . . . . . . . . . . . . . . . — 118,012 453,891 — — 118,012 453,891 571,903 38,455 1989 06/05 30 years
Woodstock, GA . . . . . . . . . . . . . — 488,383 1,041,883 — — 488,383 1,041,883 1,530,266 66,203 1997 06/05 40 years
Quizno’s:
Rio Rancho, NM . . . . . . . . . . . . . — 48,566 96,428 13,398 — 48,566 109,826 158,392 16,186 1997 12/01 40 years
Qwest Corporation Service Center:
Cedar Rapids, IA . . . . . . . . . . . . . — 184,490 628,943 — — 184,490 628,943 813,433 79,928 1976 06/05 20 years
Decorah, IA . . . . . . . . . . . . . . . . . — 71,899 271,620 — — 71,899 271,620 343,519 69,037 1974 06/05 10 years
Rally’s:
Toledo, OH . . . . . . . . . . . . . . . . . — 125,882 319,770 — — 125,882 319,770 445,652 127,868 1989 07/92 39 years
REB Oil:
Deerfield Beach, FL . . . . . . . . . . — 769,522 273,756 — — 769,522 273,756 1,043,278 13,973 1980 12/05 40 years
Red Lion Chinese Restaurant:
Cohoes, NY . . . . . . . . . . . . . . . . . — 27,327 147,286 — — 27,327 147,286 174,613 11,918 1994 09/04 40 years
Reliable:
St. Louis, MO . . . . . . . . . . . . . . . — 2,077,893 13,762,491 — — 2,077,893 13,762,491 15,840,384 1,192,793 1975 05/04 40 years
Rent-A-Center:
Rio Rancho, NM . . . . . . . . . . . . . — 145,698 289,284 40,193 — 145,698 329,477 475,175 48,883 1997 12/01 40 years
Rite Aid:
Mobile, AL . . . . . . . . . . . . . . . . . — 1,136,618 1,694,187 — — 1,136,618 1,694,187 2,830,805 255,893 2000 12/01 40 years
Orange Beach, AL . . . . . . . . . . . — 1,409,980 1,996,043 — — 1,409,980 1,996,043 3,406,023 301,486 2000 12/01 40 years
Albany, NY . . . . . . . . . . . . . . . . . — 24,707 867,257 — — 24,707 867,257 891,964 71,367 1994 09/04 40 years
Albany, NY (r) . . . . . . . . . . . . . . — 33,794 823,923 — — 33,794 823,923 857,717 67,802 1992 09/04 40 years
Hudson Falls, NY . . . . . . . . . . . . — 56,737 780,091 38,787 — 56,737 818,878 875,615 64,802 1990 09/04 40 years
Saratoga Springs, NY . . . . . . . . . — 762,303 590,978 — — 762,303 590,978 1,353,281 48,633 1980 09/04 40 years
Ticonderoga, NY . . . . . . . . . . . . — 88,867 688,622 — — 88,867 688,622 777,489 56,668 1993 09/04 40 years
Monticello, NY . . . . . . . . . . . . . . 850,549 664,400 768,795 — — 664,400 768,795 1,433,195 53,656 1996 03/05 40 years
Rite Rug:
Columbus, OH . . . . . . . . . . . . . . — 1,596,197 934,236 13,345 — 1,604,615 939,163 2,543,778 73,339 1970 11/04 40 years
Roadhouse Grill:
Cheektowaga, NY . . . . . . . . . . . . — 689,040 386,251 — — 689,040 386,251 1,075,290 58,340 1994 12/01 40 years
See accompanying report of independent registered public accounting firm.
F-13
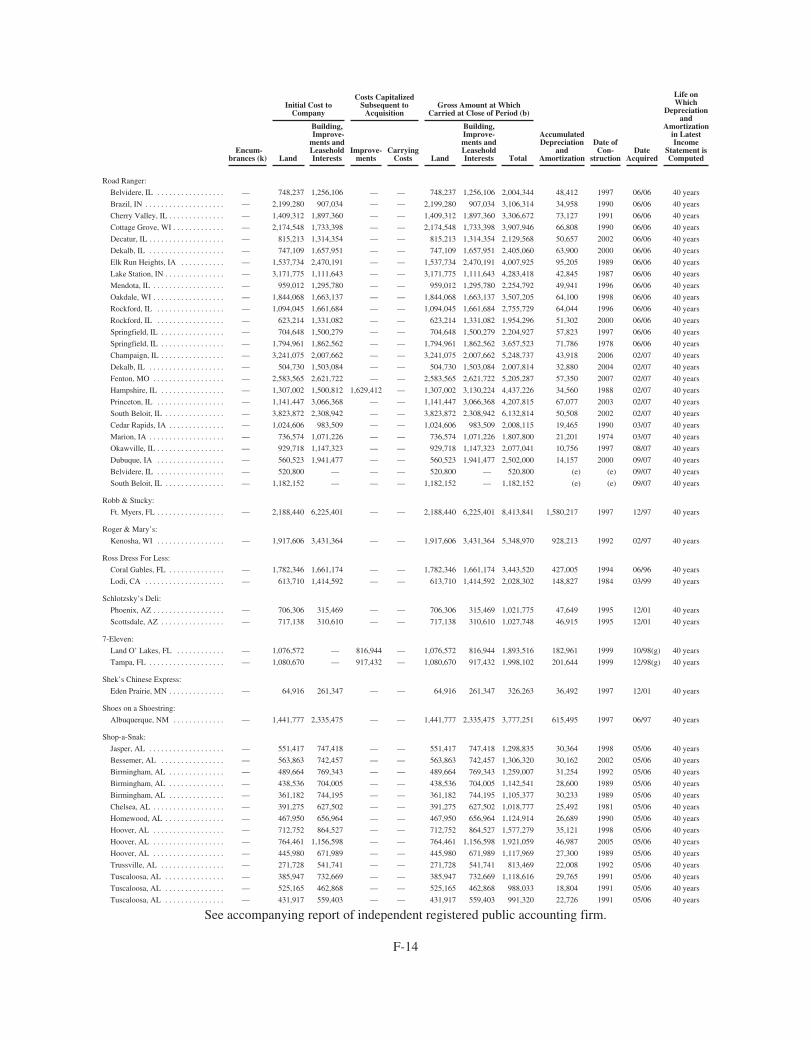
Encum-brances (k)
Initial Cost toCompany
Costs CapitalizedSubsequent to
AcquisitionGross Amount at Which
Carried at Close of Period (b)
AccumulatedDepreciation
andAmortization
Date ofCon-
structionDate
Acquired
Life onWhich
Depreciationand
Amortizationin LatestIncome
Statement isComputedLand
Building,Improve-
ments andLeaseholdInterests
Improve-ments
CarryingCosts Land
Building,Improve-ments andLeaseholdInterests Total
Road Ranger:
Belvidere, IL . . . . . . . . . . . . . . . . . — 748,237 1,256,106 — — 748,237 1,256,106 2,004,344 48,412 1997 06/06 40 years
Brazil, IN . . . . . . . . . . . . . . . . . . . . — 2,199,280 907,034 — — 2,199,280 907,034 3,106,314 34,958 1990 06/06 40 years
Cherry Valley, IL . . . . . . . . . . . . . . — 1,409,312 1,897,360 — — 1,409,312 1,897,360 3,306,672 73,127 1991 06/06 40 years
Cottage Grove, WI . . . . . . . . . . . . . — 2,174,548 1,733,398 — — 2,174,548 1,733,398 3,907,946 66,808 1990 06/06 40 years
Decatur, IL . . . . . . . . . . . . . . . . . . . — 815,213 1,314,354 — — 815,213 1,314,354 2,129,568 50,657 2002 06/06 40 years
Dekalb, IL . . . . . . . . . . . . . . . . . . . — 747,109 1,657,951 — — 747,109 1,657,951 2,405,060 63,900 2000 06/06 40 years
Elk Run Heights, IA . . . . . . . . . . . — 1,537,734 2,470,191 — — 1,537,734 2,470,191 4,007,925 95,205 1989 06/06 40 years
Lake Station, IN . . . . . . . . . . . . . . . — 3,171,775 1,111,643 — — 3,171,775 1,111,643 4,283,418 42,845 1987 06/06 40 years
Mendota, IL . . . . . . . . . . . . . . . . . . — 959,012 1,295,780 — — 959,012 1,295,780 2,254,792 49,941 1996 06/06 40 years
Oakdale, WI . . . . . . . . . . . . . . . . . . — 1,844,068 1,663,137 — — 1,844,068 1,663,137 3,507,205 64,100 1998 06/06 40 years
Rockford, IL . . . . . . . . . . . . . . . . . — 1,094,045 1,661,684 — — 1,094,045 1,661,684 2,755,729 64,044 1996 06/06 40 years
Rockford, IL . . . . . . . . . . . . . . . . . — 623,214 1,331,082 — — 623,214 1,331,082 1,954,296 51,302 2000 06/06 40 years
Springfield, IL . . . . . . . . . . . . . . . . — 704,648 1,500,279 — — 704,648 1,500,279 2,204,927 57,823 1997 06/06 40 years
Springfield, IL . . . . . . . . . . . . . . . . — 1,794,961 1,862,562 — — 1,794,961 1,862,562 3,657,523 71,786 1978 06/06 40 years
Champaign, IL . . . . . . . . . . . . . . . . — 3,241,075 2,007,662 — — 3,241,075 2,007,662 5,248,737 43,918 2006 02/07 40 years
Dekalb, IL . . . . . . . . . . . . . . . . . . . — 504,730 1,503,084 — — 504,730 1,503,084 2,007,814 32,880 2004 02/07 40 years
Fenton, MO . . . . . . . . . . . . . . . . . . — 2,583,565 2,621,722 — — 2,583,565 2,621,722 5,205,287 57,350 2007 02/07 40 years
Hampshire, IL . . . . . . . . . . . . . . . . — 1,307,002 1,500,812 1,629,412 — 1,307,002 3,130,224 4,437,226 34,560 1988 02/07 40 years
Princeton, IL . . . . . . . . . . . . . . . . . — 1,141,447 3,066,368 — — 1,141,447 3,066,368 4,207,815 67,077 2003 02/07 40 years
South Beloit, IL . . . . . . . . . . . . . . . — 3,823,872 2,308,942 — — 3,823,872 2,308,942 6,132,814 50,508 2002 02/07 40 years
Cedar Rapids, IA . . . . . . . . . . . . . . — 1,024,606 983,509 — — 1,024,606 983,509 2,008,115 19,465 1990 03/07 40 years
Marion, IA . . . . . . . . . . . . . . . . . . . — 736,574 1,071,226 — — 736,574 1,071,226 1,807,800 21,201 1974 03/07 40 years
Okawville, IL . . . . . . . . . . . . . . . . . — 929,718 1,147,323 — — 929,718 1,147,323 2,077,041 10,756 1997 08/07 40 years
Dubuque, IA . . . . . . . . . . . . . . . . . — 560,523 1,941,477 — — 560,523 1,941,477 2,502,000 14,157 2000 09/07 40 years
Belvidere, IL . . . . . . . . . . . . . . . . . — 520,800 — — — 520,800 — 520,800 (e) (e) 09/07 40 years
South Beloit, IL . . . . . . . . . . . . . . . — 1,182,152 — — — 1,182,152 — 1,182,152 (e) (e) 09/07 40 years
Robb & Stucky:
Ft. Myers, FL . . . . . . . . . . . . . . . . . — 2,188,440 6,225,401 — — 2,188,440 6,225,401 8,413,841 1,580,217 1997 12/97 40 years
Roger & Mary’s:
Kenosha, WI . . . . . . . . . . . . . . . . . — 1,917,606 3,431,364 — — 1,917,606 3,431,364 5,348,970 928,213 1992 02/97 40 years
Ross Dress For Less:
Coral Gables, FL . . . . . . . . . . . . . . — 1,782,346 1,661,174 — — 1,782,346 1,661,174 3,443,520 427,005 1994 06/96 40 years
Lodi, CA . . . . . . . . . . . . . . . . . . . . — 613,710 1,414,592 — — 613,710 1,414,592 2,028,302 148,827 1984 03/99 40 years
Schlotzsky’s Deli:
Phoenix, AZ . . . . . . . . . . . . . . . . . . — 706,306 315,469 — — 706,306 315,469 1,021,775 47,649 1995 12/01 40 years
Scottsdale, AZ . . . . . . . . . . . . . . . . — 717,138 310,610 — — 717,138 310,610 1,027,748 46,915 1995 12/01 40 years
7-Eleven:
Land O’ Lakes, FL . . . . . . . . . . . . — 1,076,572 — 816,944 — 1,076,572 816,944 1,893,516 182,961 1999 10/98(g) 40 years
Tampa, FL . . . . . . . . . . . . . . . . . . . — 1,080,670 — 917,432 — 1,080,670 917,432 1,998,102 201,644 1999 12/98(g) 40 years
Shek’s Chinese Express:
Eden Prairie, MN . . . . . . . . . . . . . . — 64,916 261,347 — — 64,916 261,347 326,263 36,492 1997 12/01 40 years
Shoes on a Shoestring:
Albuquerque, NM . . . . . . . . . . . . . — 1,441,777 2,335,475 — — 1,441,777 2,335,475 3,777,251 615,495 1997 06/97 40 years
Shop-a-Snak:
Jasper, AL . . . . . . . . . . . . . . . . . . . — 551,417 747,418 — — 551,417 747,418 1,298,835 30,364 1998 05/06 40 years
Bessemer, AL . . . . . . . . . . . . . . . . — 563,863 742,457 — — 563,863 742,457 1,306,320 30,162 2002 05/06 40 years
Birmingham, AL . . . . . . . . . . . . . . — 489,664 769,343 — — 489,664 769,343 1,259,007 31,254 1992 05/06 40 years
Birmingham, AL . . . . . . . . . . . . . . — 438,536 704,005 — — 438,536 704,005 1,142,541 28,600 1989 05/06 40 years
Birmingham, AL . . . . . . . . . . . . . . — 361,182 744,195 — — 361,182 744,195 1,105,377 30,233 1989 05/06 40 years
Chelsea, AL . . . . . . . . . . . . . . . . . . — 391,275 627,502 — — 391,275 627,502 1,018,777 25,492 1981 05/06 40 years
Homewood, AL . . . . . . . . . . . . . . . — 467,950 656,964 — — 467,950 656,964 1,124,914 26,689 1990 05/06 40 years
Hoover, AL . . . . . . . . . . . . . . . . . . — 712,752 864,527 — — 712,752 864,527 1,577,279 35,121 1998 05/06 40 years
Hoover, AL . . . . . . . . . . . . . . . . . . — 764,461 1,156,598 — — 764,461 1,156,598 1,921,059 46,987 2005 05/06 40 years
Hoover, AL . . . . . . . . . . . . . . . . . . — 445,980 671,989 — — 445,980 671,989 1,117,969 27,300 1989 05/06 40 years
Trussville, AL . . . . . . . . . . . . . . . . — 271,728 541,741 — — 271,728 541,741 813,469 22,008 1992 05/06 40 years
Tuscaloosa, AL . . . . . . . . . . . . . . . — 385,947 732,669 — — 385,947 732,669 1,118,616 29,765 1991 05/06 40 years
Tuscaloosa, AL . . . . . . . . . . . . . . . — 525,165 462,868 — — 525,165 462,868 988,033 18,804 1991 05/06 40 years
Tuscaloosa, AL . . . . . . . . . . . . . . . — 431,917 559,403 — — 431,917 559,403 991,320 22,726 1991 05/06 40 years
See accompanying report of independent registered public accounting firm.
F-14
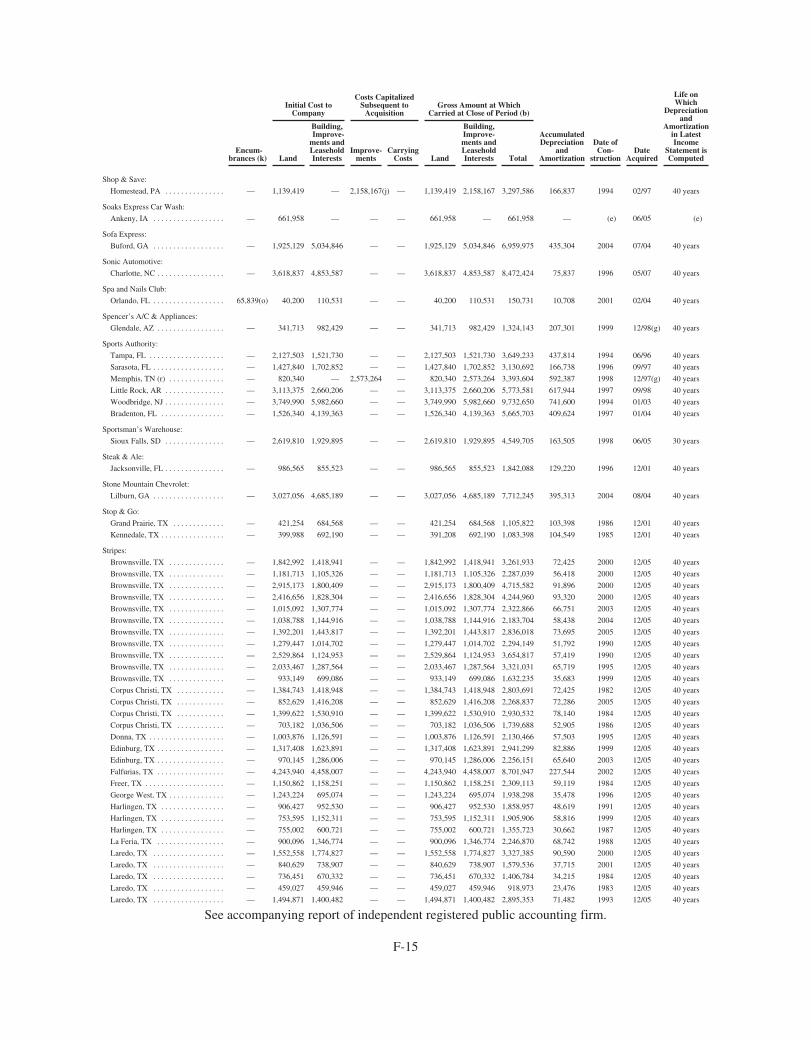
Encum-brances (k)
Initial Cost toCompany
Costs CapitalizedSubsequent to
AcquisitionGross Amount at Which
Carried at Close of Period (b)
AccumulatedDepreciation
andAmortization
Date ofCon-
structionDate
Acquired
Life onWhich
Depreciationand
Amortizationin LatestIncome
Statement isComputedLand
Building,Improve-
ments andLeaseholdInterests
Improve-ments
CarryingCosts Land
Building,Improve-ments andLeaseholdInterests Total
Shop & Save:
Homestead, PA . . . . . . . . . . . . . . . — 1,139,419 — 2,158,167(j) — 1,139,419 2,158,167 3,297,586 166,837 1994 02/97 40 years
Soaks Express Car Wash:
Ankeny, IA . . . . . . . . . . . . . . . . . . — 661,958 — — — 661,958 — 661,958 — (e) 06/05 (e)
Sofa Express:
Buford, GA . . . . . . . . . . . . . . . . . . — 1,925,129 5,034,846 — — 1,925,129 5,034,846 6,959,975 435,304 2004 07/04 40 years
Sonic Automotive:
Charlotte, NC . . . . . . . . . . . . . . . . . — 3,618,837 4,853,587 — — 3,618,837 4,853,587 8,472,424 75,837 1996 05/07 40 years
Spa and Nails Club:
Orlando, FL . . . . . . . . . . . . . . . . . . 65,839(o) 40,200 110,531 — — 40,200 110,531 150,731 10,708 2001 02/04 40 years
Spencer’s A/C & Appliances:
Glendale, AZ . . . . . . . . . . . . . . . . . — 341,713 982,429 — — 341,713 982,429 1,324,143 207,301 1999 12/98(g) 40 years
Sports Authority:
Tampa, FL . . . . . . . . . . . . . . . . . . . — 2,127,503 1,521,730 — — 2,127,503 1,521,730 3,649,233 437,814 1994 06/96 40 years
Sarasota, FL . . . . . . . . . . . . . . . . . . — 1,427,840 1,702,852 — — 1,427,840 1,702,852 3,130,692 166,738 1996 09/97 40 years
Memphis, TN (r) . . . . . . . . . . . . . . — 820,340 — 2,573,264 — 820,340 2,573,264 3,393,604 592,387 1998 12/97(g) 40 years
Little Rock, AR . . . . . . . . . . . . . . . — 3,113,375 2,660,206 — — 3,113,375 2,660,206 5,773,581 617,944 1997 09/98 40 years
Woodbridge, NJ . . . . . . . . . . . . . . . — 3,749,990 5,982,660 — — 3,749,990 5,982,660 9,732,650 741,600 1994 01/03 40 years
Bradenton, FL . . . . . . . . . . . . . . . . — 1,526,340 4,139,363 — — 1,526,340 4,139,363 5,665,703 409,624 1997 01/04 40 years
Sportsman’s Warehouse:
Sioux Falls, SD . . . . . . . . . . . . . . . — 2,619,810 1,929,895 — — 2,619,810 1,929,895 4,549,705 163,505 1998 06/05 30 years
Steak & Ale:
Jacksonville, FL . . . . . . . . . . . . . . . — 986,565 855,523 — — 986,565 855,523 1,842,088 129,220 1996 12/01 40 years
Stone Mountain Chevrolet:
Lilburn, GA . . . . . . . . . . . . . . . . . . — 3,027,056 4,685,189 — — 3,027,056 4,685,189 7,712,245 395,313 2004 08/04 40 years
Stop & Go:
Grand Prairie, TX . . . . . . . . . . . . . — 421,254 684,568 — — 421,254 684,568 1,105,822 103,398 1986 12/01 40 years
Kennedale, TX . . . . . . . . . . . . . . . . — 399,988 692,190 — — 391,208 692,190 1,083,398 104,549 1985 12/01 40 years
Stripes:
Brownsville, TX . . . . . . . . . . . . . . — 1,842,992 1,418,941 — — 1,842,992 1,418,941 3,261,933 72,425 2000 12/05 40 years
Brownsville, TX . . . . . . . . . . . . . . — 1,181,713 1,105,326 — — 1,181,713 1,105,326 2,287,039 56,418 2000 12/05 40 years
Brownsville, TX . . . . . . . . . . . . . . — 2,915,173 1,800,409 — — 2,915,173 1,800,409 4,715,582 91,896 2000 12/05 40 years
Brownsville, TX . . . . . . . . . . . . . . — 2,416,656 1,828,304 — — 2,416,656 1,828,304 4,244,960 93,320 2000 12/05 40 years
Brownsville, TX . . . . . . . . . . . . . . — 1,015,092 1,307,774 — — 1,015,092 1,307,774 2,322,866 66,751 2003 12/05 40 years
Brownsville, TX . . . . . . . . . . . . . . — 1,038,788 1,144,916 — — 1,038,788 1,144,916 2,183,704 58,438 2004 12/05 40 years
Brownsville, TX . . . . . . . . . . . . . . — 1,392,201 1,443,817 — — 1,392,201 1,443,817 2,836,018 73,695 2005 12/05 40 years
Brownsville, TX . . . . . . . . . . . . . . — 1,279,447 1,014,702 — — 1,279,447 1,014,702 2,294,149 51,792 1990 12/05 40 years
Brownsville, TX . . . . . . . . . . . . . . — 2,529,864 1,124,953 — — 2,529,864 1,124,953 3,654,817 57,419 1990 12/05 40 years
Brownsville, TX . . . . . . . . . . . . . . — 2,033,467 1,287,564 — — 2,033,467 1,287,564 3,321,031 65,719 1995 12/05 40 years
Brownsville, TX . . . . . . . . . . . . . . — 933,149 699,086 — — 933,149 699,086 1,632,235 35,683 1999 12/05 40 years
Corpus Christi, TX . . . . . . . . . . . . — 1,384,743 1,418,948 — — 1,384,743 1,418,948 2,803,691 72,425 1982 12/05 40 years
Corpus Christi, TX . . . . . . . . . . . . — 852,629 1,416,208 — — 852,629 1,416,208 2,268,837 72,286 2005 12/05 40 years
Corpus Christi, TX . . . . . . . . . . . . — 1,399,622 1,530,910 — — 1,399,622 1,530,910 2,930,532 78,140 1984 12/05 40 years
Corpus Christi, TX . . . . . . . . . . . . — 703,182 1,036,506 — — 703,182 1,036,506 1,739,688 52,905 1986 12/05 40 years
Donna, TX . . . . . . . . . . . . . . . . . . . — 1,003,876 1,126,591 — — 1,003,876 1,126,591 2,130,466 57,503 1995 12/05 40 years
Edinburg, TX . . . . . . . . . . . . . . . . . — 1,317,408 1,623,891 — — 1,317,408 1,623,891 2,941,299 82,886 1999 12/05 40 years
Edinburg, TX . . . . . . . . . . . . . . . . . — 970,145 1,286,006 — — 970,145 1,286,006 2,256,151 65,640 2003 12/05 40 years
Falfurias, TX . . . . . . . . . . . . . . . . . — 4,243,940 4,458,007 — — 4,243,940 4,458,007 8,701,947 227,544 2002 12/05 40 years
Freer, TX . . . . . . . . . . . . . . . . . . . . — 1,150,862 1,158,251 — — 1,150,862 1,158,251 2,309,113 59,119 1984 12/05 40 years
George West, TX . . . . . . . . . . . . . . — 1,243,224 695,074 — — 1,243,224 695,074 1,938,298 35,478 1996 12/05 40 years
Harlingen, TX . . . . . . . . . . . . . . . . — 906,427 952,530 — — 906,427 952,530 1,858,957 48,619 1991 12/05 40 years
Harlingen, TX . . . . . . . . . . . . . . . . — 753,595 1,152,311 — — 753,595 1,152,311 1,905,906 58,816 1999 12/05 40 years
Harlingen, TX . . . . . . . . . . . . . . . . — 755,002 600,721 — — 755,002 600,721 1,355,723 30,662 1987 12/05 40 years
La Feria, TX . . . . . . . . . . . . . . . . . — 900,096 1,346,774 — — 900,096 1,346,774 2,246,870 68,742 1988 12/05 40 years
Laredo, TX . . . . . . . . . . . . . . . . . . — 1,552,558 1,774,827 — — 1,552,558 1,774,827 3,327,385 90,590 2000 12/05 40 years
Laredo, TX . . . . . . . . . . . . . . . . . . — 840,629 738,907 — — 840,629 738,907 1,579,536 37,715 2001 12/05 40 years
Laredo, TX . . . . . . . . . . . . . . . . . . — 736,451 670,332 — — 736,451 670,332 1,406,784 34,215 1984 12/05 40 years
Laredo, TX . . . . . . . . . . . . . . . . . . — 459,027 459,946 — — 459,027 459,946 918,973 23,476 1983 12/05 40 years
Laredo, TX . . . . . . . . . . . . . . . . . . — 1,494,871 1,400,482 — — 1,494,871 1,400,482 2,895,353 71,482 1993 12/05 40 years
See accompanying report of independent registered public accounting firm.
F-15
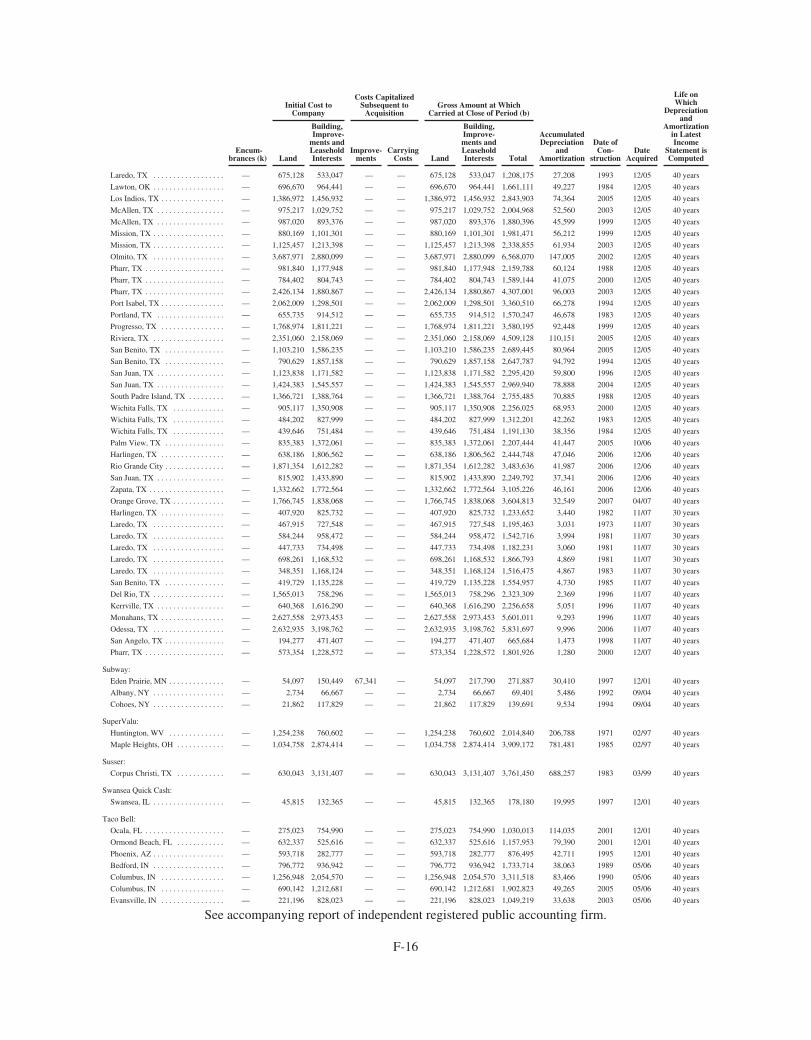
Encum-brances (k)
Initial Cost toCompany
Costs CapitalizedSubsequent to
AcquisitionGross Amount at Which
Carried at Close of Period (b)
AccumulatedDepreciation
andAmortization
Date ofCon-
structionDate
Acquired
Life onWhich
Depreciationand
Amortizationin LatestIncome
Statement isComputedLand
Building,Improve-
ments andLeaseholdInterests
Improve-ments
CarryingCosts Land
Building,Improve-ments andLeaseholdInterests Total
Laredo, TX . . . . . . . . . . . . . . . . . . — 675,128 533,047 — — 675,128 533,047 1,208,175 27,208 1993 12/05 40 years
Lawton, OK . . . . . . . . . . . . . . . . . . — 696,670 964,441 — — 696,670 964,441 1,661,111 49,227 1984 12/05 40 years
Los Indios, TX . . . . . . . . . . . . . . . . — 1,386,972 1,456,932 — — 1,386,972 1,456,932 2,843,903 74,364 2005 12/05 40 years
McAllen, TX . . . . . . . . . . . . . . . . . — 975,217 1,029,752 — — 975,217 1,029,752 2,004,968 52,560 2003 12/05 40 years
McAllen, TX . . . . . . . . . . . . . . . . . — 987,020 893,376 — — 987,020 893,376 1,880,396 45,599 1999 12/05 40 years
Mission, TX . . . . . . . . . . . . . . . . . . — 880,169 1,101,301 — — 880,169 1,101,301 1,981,471 56,212 1999 12/05 40 years
Mission, TX . . . . . . . . . . . . . . . . . . — 1,125,457 1,213,398 — — 1,125,457 1,213,398 2,338,855 61,934 2003 12/05 40 years
Olmito, TX . . . . . . . . . . . . . . . . . . — 3,687,971 2,880,099 — — 3,687,971 2,880,099 6,568,070 147,005 2002 12/05 40 years
Pharr, TX . . . . . . . . . . . . . . . . . . . . — 981,840 1,177,948 — — 981,840 1,177,948 2,159,788 60,124 1988 12/05 40 years
Pharr, TX . . . . . . . . . . . . . . . . . . . . — 784,402 804,743 — — 784,402 804,743 1,589,144 41,075 2000 12/05 40 years
Pharr, TX . . . . . . . . . . . . . . . . . . . . — 2,426,134 1,880,867 — — 2,426,134 1,880,867 4,307,001 96,003 2003 12/05 40 years
Port Isabel, TX . . . . . . . . . . . . . . . . — 2,062,009 1,298,501 — — 2,062,009 1,298,501 3,360,510 66,278 1994 12/05 40 years
Portland, TX . . . . . . . . . . . . . . . . . — 655,735 914,512 — — 655,735 914,512 1,570,247 46,678 1983 12/05 40 years
Progresso, TX . . . . . . . . . . . . . . . . — 1,768,974 1,811,221 — — 1,768,974 1,811,221 3,580,195 92,448 1999 12/05 40 years
Riviera, TX . . . . . . . . . . . . . . . . . . — 2,351,060 2,158,069 — — 2,351,060 2,158,069 4,509,128 110,151 2005 12/05 40 years
San Benito, TX . . . . . . . . . . . . . . . — 1,103,210 1,586,235 — — 1,103,210 1,586,235 2,689,445 80,964 2005 12/05 40 years
San Benito, TX . . . . . . . . . . . . . . . — 790,629 1,857,158 — — 790,629 1,857,158 2,647,787 94,792 1994 12/05 40 years
San Juan, TX . . . . . . . . . . . . . . . . . — 1,123,838 1,171,582 — — 1,123,838 1,171,582 2,295,420 59,800 1996 12/05 40 years
San Juan, TX . . . . . . . . . . . . . . . . . — 1,424,383 1,545,557 — — 1,424,383 1,545,557 2,969,940 78,888 2004 12/05 40 years
South Padre Island, TX . . . . . . . . . — 1,366,721 1,388,764 — — 1,366,721 1,388,764 2,755,485 70,885 1988 12/05 40 years
Wichita Falls, TX . . . . . . . . . . . . . — 905,117 1,350,908 — — 905,117 1,350,908 2,256,025 68,953 2000 12/05 40 years
Wichita Falls, TX . . . . . . . . . . . . . — 484,202 827,999 — — 484,202 827,999 1,312,201 42,262 1983 12/05 40 years
Wichita Falls, TX . . . . . . . . . . . . . — 439,646 751,484 — — 439,646 751,484 1,191,130 38,356 1984 12/05 40 years
Palm View, TX . . . . . . . . . . . . . . . — 835,383 1,372,061 — — 835,383 1,372,061 2,207,444 41,447 2005 10/06 40 years
Harlingen, TX . . . . . . . . . . . . . . . . — 638,186 1,806,562 — — 638,186 1,806,562 2,444,748 47,046 2006 12/06 40 years
Rio Grande City . . . . . . . . . . . . . . . — 1,871,354 1,612,282 — — 1,871,354 1,612,282 3,483,636 41,987 2006 12/06 40 years
San Juan, TX . . . . . . . . . . . . . . . . . — 815,902 1,433,890 — — 815,902 1,433,890 2,249,792 37,341 2006 12/06 40 years
Zapata, TX . . . . . . . . . . . . . . . . . . . — 1,332,662 1,772,564 — — 1,332,662 1,772,564 3,105,226 46,161 2006 12/06 40 years
Orange Grove, TX . . . . . . . . . . . . . — 1,766,745 1,838,068 — — 1,766,745 1,838,068 3,604,813 32,549 2007 04/07 40 years
Harlingen, TX . . . . . . . . . . . . . . . . — 407,920 825,732 — — 407,920 825,732 1,233,652 3,440 1982 11/07 30 years
Laredo, TX . . . . . . . . . . . . . . . . . . — 467,915 727,548 — — 467,915 727,548 1,195,463 3,031 1973 11/07 30 years
Laredo, TX . . . . . . . . . . . . . . . . . . — 584,244 958,472 — — 584,244 958,472 1,542,716 3,994 1981 11/07 30 years
Laredo, TX . . . . . . . . . . . . . . . . . . — 447,733 734,498 — — 447,733 734,498 1,182,231 3,060 1981 11/07 30 years
Laredo, TX . . . . . . . . . . . . . . . . . . — 698,261 1,168,532 — — 698,261 1,168,532 1,866,793 4,869 1981 11/07 30 years
Laredo, TX . . . . . . . . . . . . . . . . . . — 348,351 1,168,124 — — 348,351 1,168,124 1,516,475 4,867 1983 11/07 30 years
San Benito, TX . . . . . . . . . . . . . . . — 419,729 1,135,228 — — 419,729 1,135,228 1,554,957 4,730 1985 11/07 40 years
Del Rio, TX . . . . . . . . . . . . . . . . . . — 1,565,013 758,296 — — 1,565,013 758,296 2,323,309 2,369 1996 11/07 40 years
Kerrville, TX . . . . . . . . . . . . . . . . . — 640,368 1,616,290 — — 640,368 1,616,290 2,256,658 5,051 1996 11/07 40 years
Monahans, TX . . . . . . . . . . . . . . . . — 2,627,558 2,973,453 — — 2,627,558 2,973,453 5,601,011 9,293 1996 11/07 40 years
Odessa, TX . . . . . . . . . . . . . . . . . . — 2,632,935 3,198,762 — — 2,632,935 3,198,762 5,831,697 9,996 2006 11/07 40 years
San Angelo, TX . . . . . . . . . . . . . . . — 194,277 471,407 — — 194,277 471,407 665,684 1,473 1998 11/07 40 years
Pharr, TX . . . . . . . . . . . . . . . . . . . . — 573,354 1,228,572 — — 573,354 1,228,572 1,801,926 1,280 2000 12/07 40 years
Subway:
Eden Prairie, MN . . . . . . . . . . . . . . — 54,097 150,449 67,341 — 54,097 217,790 271,887 30,410 1997 12/01 40 years
Albany, NY . . . . . . . . . . . . . . . . . . — 2,734 66,667 — — 2,734 66,667 69,401 5,486 1992 09/04 40 years
Cohoes, NY . . . . . . . . . . . . . . . . . . — 21,862 117,829 — — 21,862 117,829 139,691 9,534 1994 09/04 40 years
SuperValu:
Huntington, WV . . . . . . . . . . . . . . — 1,254,238 760,602 — — 1,254,238 760,602 2,014,840 206,788 1971 02/97 40 years
Maple Heights, OH . . . . . . . . . . . . — 1,034,758 2,874,414 — — 1,034,758 2,874,414 3,909,172 781,481 1985 02/97 40 years
Susser:
Corpus Christi, TX . . . . . . . . . . . . — 630,043 3,131,407 — — 630,043 3,131,407 3,761,450 688,257 1983 03/99 40 years
Swansea Quick Cash:
Swansea, IL . . . . . . . . . . . . . . . . . . — 45,815 132,365 — — 45,815 132,365 178,180 19,995 1997 12/01 40 years
Taco Bell:
Ocala, FL . . . . . . . . . . . . . . . . . . . . — 275,023 754,990 — — 275,023 754,990 1,030,013 114,035 2001 12/01 40 years
Ormond Beach, FL . . . . . . . . . . . . — 632,337 525,616 — — 632,337 525,616 1,157,953 79,390 2001 12/01 40 years
Phoenix, AZ . . . . . . . . . . . . . . . . . . — 593,718 282,777 — — 593,718 282,777 876,495 42,711 1995 12/01 40 years
Bedford, IN . . . . . . . . . . . . . . . . . . — 796,772 936,942 — — 796,772 936,942 1,733,714 38,063 1989 05/06 40 years
Columbus, IN . . . . . . . . . . . . . . . . — 1,256,948 2,054,570 — — 1,256,948 2,054,570 3,311,518 83,466 1990 05/06 40 years
Columbus, IN . . . . . . . . . . . . . . . . — 690,142 1,212,681 — — 690,142 1,212,681 1,902,823 49,265 2005 05/06 40 years
Evansville, IN . . . . . . . . . . . . . . . . — 221,196 828,023 — — 221,196 828,023 1,049,219 33,638 2003 05/06 40 years
See accompanying report of independent registered public accounting firm.
F-16
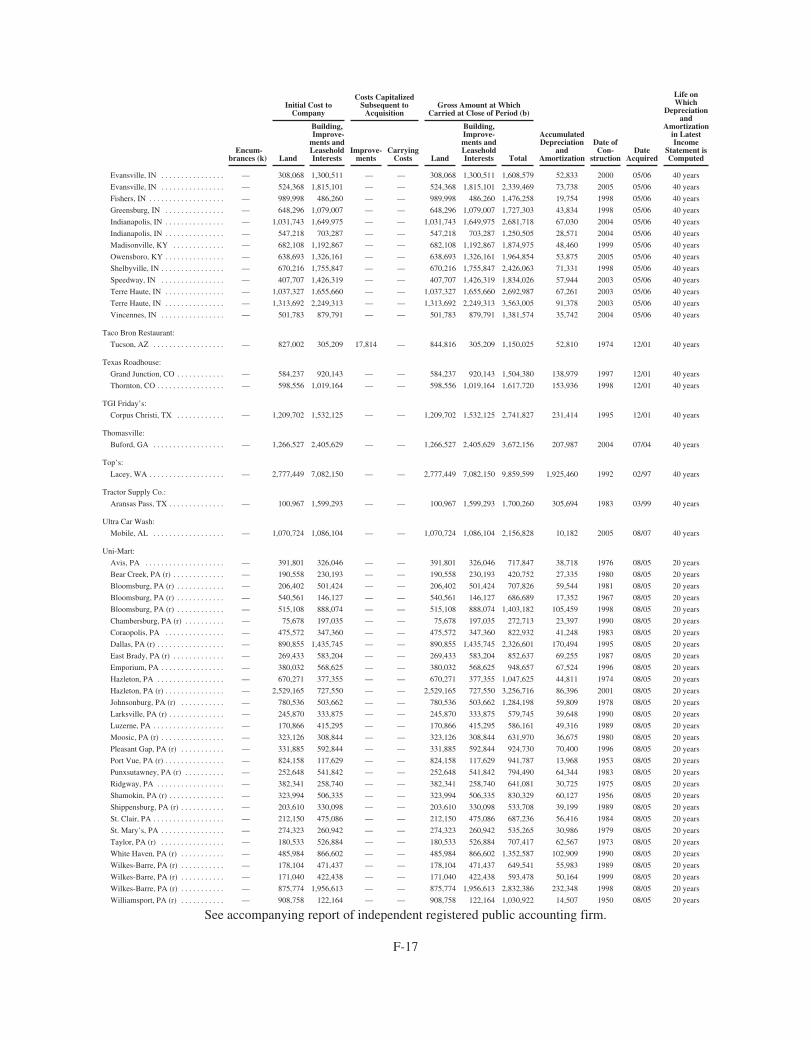
Encum-brances (k)
Initial Cost toCompany
Costs CapitalizedSubsequent to
AcquisitionGross Amount at Which
Carried at Close of Period (b)
AccumulatedDepreciation
andAmortization
Date ofCon-
structionDate
Acquired
Life onWhich
Depreciationand
Amortizationin LatestIncome
Statement isComputedLand
Building,Improve-
ments andLeaseholdInterests
Improve-ments
CarryingCosts Land
Building,Improve-ments andLeaseholdInterests Total
Evansville, IN . . . . . . . . . . . . . . . . — 308,068 1,300,511 — — 308,068 1,300,511 1,608,579 52,833 2000 05/06 40 years
Evansville, IN . . . . . . . . . . . . . . . . — 524,368 1,815,101 — — 524,368 1,815,101 2,339,469 73,738 2005 05/06 40 years
Fishers, IN . . . . . . . . . . . . . . . . . . . — 989,998 486,260 — — 989,998 486,260 1,476,258 19,754 1998 05/06 40 years
Greensburg, IN . . . . . . . . . . . . . . . — 648,296 1,079,007 — — 648,296 1,079,007 1,727,303 43,834 1998 05/06 40 years
Indianapolis, IN . . . . . . . . . . . . . . . — 1,031,743 1,649,975 — — 1,031,743 1,649,975 2,681,718 67,030 2004 05/06 40 years
Indianapolis, IN . . . . . . . . . . . . . . . — 547,218 703,287 — — 547,218 703,287 1,250,505 28,571 2004 05/06 40 years
Madisonville, KY . . . . . . . . . . . . . — 682,108 1,192,867 — — 682,108 1,192,867 1,874,975 48,460 1999 05/06 40 years
Owensboro, KY . . . . . . . . . . . . . . . — 638,693 1,326,161 — — 638,693 1,326,161 1,964,854 53,875 2005 05/06 40 years
Shelbyville, IN . . . . . . . . . . . . . . . . — 670,216 1,755,847 — — 670,216 1,755,847 2,426,063 71,331 1998 05/06 40 years
Speedway, IN . . . . . . . . . . . . . . . . — 407,707 1,426,319 — — 407,707 1,426,319 1,834,026 57,944 2003 05/06 40 years
Terre Haute, IN . . . . . . . . . . . . . . . — 1,037,327 1,655,660 — — 1,037,327 1,655,660 2,692,987 67,261 2003 05/06 40 years
Terre Haute, IN . . . . . . . . . . . . . . . — 1,313,692 2,249,313 — — 1,313,692 2,249,313 3,563,005 91,378 2003 05/06 40 years
Vincennes, IN . . . . . . . . . . . . . . . . — 501,783 879,791 — — 501,783 879,791 1,381,574 35,742 2004 05/06 40 years
Taco Bron Restaurant:
Tucson, AZ . . . . . . . . . . . . . . . . . . — 827,002 305,209 17,814 — 844,816 305,209 1,150,025 52,810 1974 12/01 40 years
Texas Roadhouse:
Grand Junction, CO . . . . . . . . . . . . — 584,237 920,143 — — 584,237 920,143 1,504,380 138,979 1997 12/01 40 years
Thornton, CO . . . . . . . . . . . . . . . . . — 598,556 1,019,164 — — 598,556 1,019,164 1,617,720 153,936 1998 12/01 40 years
TGI Friday’s:
Corpus Christi, TX . . . . . . . . . . . . — 1,209,702 1,532,125 — — 1,209,702 1,532,125 2,741,827 231,414 1995 12/01 40 years
Thomasville:
Buford, GA . . . . . . . . . . . . . . . . . . — 1,266,527 2,405,629 — — 1,266,527 2,405,629 3,672,156 207,987 2004 07/04 40 years
Top’s:
Lacey, WA . . . . . . . . . . . . . . . . . . . — 2,777,449 7,082,150 — — 2,777,449 7,082,150 9,859,599 1,925,460 1992 02/97 40 years
Tractor Supply Co.:
Aransas Pass, TX . . . . . . . . . . . . . . — 100,967 1,599,293 — — 100,967 1,599,293 1,700,260 305,694 1983 03/99 40 years
Ultra Car Wash:
Mobile, AL . . . . . . . . . . . . . . . . . . — 1,070,724 1,086,104 — — 1,070,724 1,086,104 2,156,828 10,182 2005 08/07 40 years
Uni-Mart:
Avis, PA . . . . . . . . . . . . . . . . . . . . — 391,801 326,046 — — 391,801 326,046 717,847 38,718 1976 08/05 20 years
Bear Creek, PA (r) . . . . . . . . . . . . . — 190,558 230,193 — — 190,558 230,193 420,752 27,335 1980 08/05 20 years
Bloomsburg, PA (r) . . . . . . . . . . . . — 206,402 501,424 — — 206,402 501,424 707,826 59,544 1981 08/05 20 years
Bloomsburg, PA (r) . . . . . . . . . . . . — 540,561 146,127 — — 540,561 146,127 686,689 17,352 1967 08/05 20 years
Bloomsburg, PA (r) . . . . . . . . . . . . — 515,108 888,074 — — 515,108 888,074 1,403,182 105,459 1998 08/05 20 years
Chambersburg, PA (r) . . . . . . . . . . — 75,678 197,035 — — 75,678 197,035 272,713 23,397 1990 08/05 20 years
Coraopolis, PA . . . . . . . . . . . . . . . — 475,572 347,360 — — 475,572 347,360 822,932 41,248 1983 08/05 20 years
Dallas, PA (r) . . . . . . . . . . . . . . . . . — 890,855 1,435,745 — — 890,855 1,435,745 2,326,601 170,494 1995 08/05 20 years
East Brady, PA (r) . . . . . . . . . . . . . — 269,433 583,204 — — 269,433 583,204 852,637 69,255 1987 08/05 20 years
Emporium, PA . . . . . . . . . . . . . . . . — 380,032 568,625 — — 380,032 568,625 948,657 67,524 1996 08/05 20 years
Hazleton, PA . . . . . . . . . . . . . . . . . — 670,271 377,355 — — 670,271 377,355 1,047,625 44,811 1974 08/05 20 years
Hazleton, PA (r) . . . . . . . . . . . . . . . — 2,529,165 727,550 — — 2,529,165 727,550 3,256,716 86,396 2001 08/05 20 years
Johnsonburg, PA (r) . . . . . . . . . . . — 780,536 503,662 — — 780,536 503,662 1,284,198 59,809 1978 08/05 20 years
Larksville, PA (r) . . . . . . . . . . . . . . — 245,870 333,875 — — 245,870 333,875 579,745 39,648 1990 08/05 20 years
Luzerne, PA . . . . . . . . . . . . . . . . . . — 170,866 415,295 — — 170,866 415,295 586,161 49,316 1989 08/05 20 years
Moosic, PA (r) . . . . . . . . . . . . . . . . — 323,126 308,844 — — 323,126 308,844 631,970 36,675 1980 08/05 20 years
Pleasant Gap, PA (r) . . . . . . . . . . . — 331,885 592,844 — — 331,885 592,844 924,730 70,400 1996 08/05 20 years
Port Vue, PA (r) . . . . . . . . . . . . . . . — 824,158 117,629 — — 824,158 117,629 941,787 13,968 1953 08/05 20 years
Punxsutawney, PA (r) . . . . . . . . . . — 252,648 541,842 — — 252,648 541,842 794,490 64,344 1983 08/05 20 years
Ridgway, PA . . . . . . . . . . . . . . . . . — 382,341 258,740 — — 382,341 258,740 641,081 30,725 1975 08/05 20 years
Shamokin, PA (r) . . . . . . . . . . . . . . — 323,994 506,335 — — 323,994 506,335 830,329 60,127 1956 08/05 20 years
Shippensburg, PA (r) . . . . . . . . . . . — 203,610 330,098 — — 203,610 330,098 533,708 39,199 1989 08/05 20 years
St. Clair, PA . . . . . . . . . . . . . . . . . . — 212,150 475,086 — — 212,150 475,086 687,236 56,416 1984 08/05 20 years
St. Mary’s, PA . . . . . . . . . . . . . . . . — 274,323 260,942 — — 274,323 260,942 535,265 30,986 1979 08/05 20 years
Taylor, PA (r) . . . . . . . . . . . . . . . . — 180,533 526,884 — — 180,533 526,884 707,417 62,567 1973 08/05 20 years
White Haven, PA (r) . . . . . . . . . . . — 485,984 866,602 — — 485,984 866,602 1,352,587 102,909 1990 08/05 20 years
Wilkes-Barre, PA (r) . . . . . . . . . . . — 178,104 471,437 — — 178,104 471,437 649,541 55,983 1989 08/05 20 years
Wilkes-Barre, PA (r) . . . . . . . . . . . — 171,040 422,438 — — 171,040 422,438 593,478 50,164 1999 08/05 20 years
Wilkes-Barre, PA (r) . . . . . . . . . . . — 875,774 1,956,613 — — 875,774 1,956,613 2,832,386 232,348 1998 08/05 20 years
Williamsport, PA (r) . . . . . . . . . . . — 908,758 122,164 — — 908,758 122,164 1,030,922 14,507 1950 08/05 20 years
See accompanying report of independent registered public accounting firm.
F-17
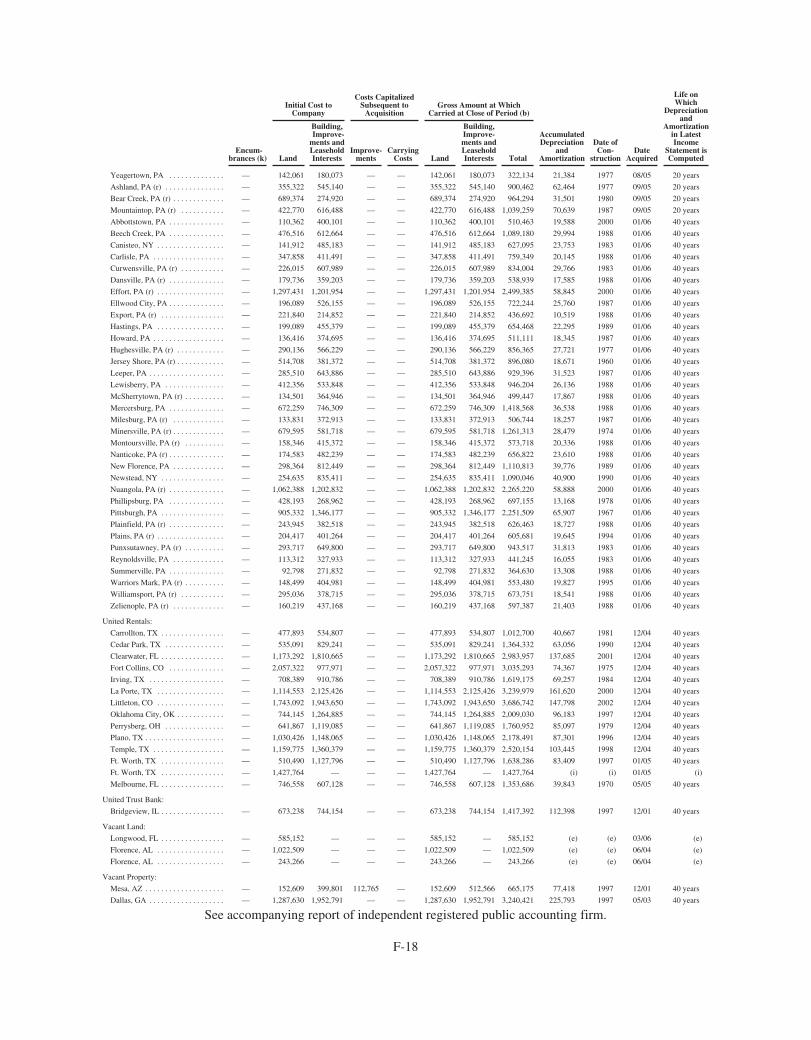
Encum-brances (k)
Initial Cost toCompany
Costs CapitalizedSubsequent to
AcquisitionGross Amount at Which
Carried at Close of Period (b)
AccumulatedDepreciation
andAmortization
Date ofCon-
structionDate
Acquired
Life onWhich
Depreciationand
Amortizationin LatestIncome
Statement isComputedLand
Building,Improve-
ments andLeaseholdInterests
Improve-ments
CarryingCosts Land
Building,Improve-ments andLeaseholdInterests Total
Yeagertown, PA . . . . . . . . . . . . . . — 142,061 180,073 — — 142,061 180,073 322,134 21,384 1977 08/05 20 years
Ashland, PA (r) . . . . . . . . . . . . . . . — 355,322 545,140 — — 355,322 545,140 900,462 62,464 1977 09/05 20 years
Bear Creek, PA (r) . . . . . . . . . . . . . — 689,374 274,920 — — 689,374 274,920 964,294 31,501 1980 09/05 20 years
Mountaintop, PA (r) . . . . . . . . . . . — 422,770 616,488 — — 422,770 616,488 1,039,259 70,639 1987 09/05 20 years
Abbottstown, PA . . . . . . . . . . . . . . — 110,362 400,101 — — 110,362 400,101 510,463 19,588 2000 01/06 40 years
Beech Creek, PA . . . . . . . . . . . . . . — 476,516 612,664 — — 476,516 612,664 1,089,180 29,994 1988 01/06 40 years
Canisteo, NY . . . . . . . . . . . . . . . . . — 141,912 485,183 — — 141,912 485,183 627,095 23,753 1983 01/06 40 years
Carlisle, PA . . . . . . . . . . . . . . . . . . — 347,858 411,491 — — 347,858 411,491 759,349 20,145 1988 01/06 40 years
Curwensville, PA (r) . . . . . . . . . . . — 226,015 607,989 — — 226,015 607,989 834,004 29,766 1983 01/06 40 years
Dansville, PA (r) . . . . . . . . . . . . . . — 179,736 359,203 — — 179,736 359,203 538,939 17,585 1988 01/06 40 years
Effort, PA (r) . . . . . . . . . . . . . . . . . — 1,297,431 1,201,954 — — 1,297,431 1,201,954 2,499,385 58,845 2000 01/06 40 years
Ellwood City, PA . . . . . . . . . . . . . . — 196,089 526,155 — — 196,089 526,155 722,244 25,760 1987 01/06 40 years
Export, PA (r) . . . . . . . . . . . . . . . . — 221,840 214,852 — — 221,840 214,852 436,692 10,519 1988 01/06 40 years
Hastings, PA . . . . . . . . . . . . . . . . . — 199,089 455,379 — — 199,089 455,379 654,468 22,295 1989 01/06 40 years
Howard, PA . . . . . . . . . . . . . . . . . . — 136,416 374,695 — — 136,416 374,695 511,111 18,345 1987 01/06 40 years
Hughesville, PA (r) . . . . . . . . . . . . — 290,136 566,229 — — 290,136 566,229 856,365 27,721 1977 01/06 40 years
Jersey Shore, PA (r) . . . . . . . . . . . . — 514,708 381,372 — — 514,708 381,372 896,080 18,671 1960 01/06 40 years
Leeper, PA . . . . . . . . . . . . . . . . . . . — 285,510 643,886 — — 285,510 643,886 929,396 31,523 1987 01/06 40 years
Lewisberry, PA . . . . . . . . . . . . . . . — 412,356 533,848 — — 412,356 533,848 946,204 26,136 1988 01/06 40 years
McSherrytown, PA (r) . . . . . . . . . . — 134,501 364,946 — — 134,501 364,946 499,447 17,867 1988 01/06 40 years
Mercersburg, PA . . . . . . . . . . . . . . — 672,259 746,309 — — 672,259 746,309 1,418,568 36,538 1988 01/06 40 years
Milesburg, PA (r) . . . . . . . . . . . . . — 133,831 372,913 — — 133,831 372,913 506,744 18,257 1987 01/06 40 years
Minersville, PA (r) . . . . . . . . . . . . . — 679,595 581,718 — — 679,595 581,718 1,261,313 28,479 1974 01/06 40 years
Montoursville, PA (r) . . . . . . . . . . — 158,346 415,372 — — 158,346 415,372 573,718 20,336 1988 01/06 40 years
Nanticoke, PA (r) . . . . . . . . . . . . . . — 174,583 482,239 — — 174,583 482,239 656,822 23,610 1988 01/06 40 years
New Florence, PA . . . . . . . . . . . . . — 298,364 812,449 — — 298,364 812,449 1,110,813 39,776 1989 01/06 40 years
Newstead, NY . . . . . . . . . . . . . . . . — 254,635 835,411 — — 254,635 835,411 1,090,046 40,900 1990 01/06 40 years
Nuangola, PA (r) . . . . . . . . . . . . . . — 1,062,388 1,202,832 — — 1,062,388 1,202,832 2,265,220 58,888 2000 01/06 40 years
Phillipsburg, PA . . . . . . . . . . . . . . — 428,193 268,962 — — 428,193 268,962 697,155 13,168 1978 01/06 40 years
Pittsburgh, PA . . . . . . . . . . . . . . . . — 905,332 1,346,177 — — 905,332 1,346,177 2,251,509 65,907 1967 01/06 40 years
Plainfield, PA (r) . . . . . . . . . . . . . . — 243,945 382,518 — — 243,945 382,518 626,463 18,727 1988 01/06 40 years
Plains, PA (r) . . . . . . . . . . . . . . . . . — 204,417 401,264 — — 204,417 401,264 605,681 19,645 1994 01/06 40 years
Punxsutawney, PA (r) . . . . . . . . . . — 293,717 649,800 — — 293,717 649,800 943,517 31,813 1983 01/06 40 years
Reynoldsville, PA . . . . . . . . . . . . . — 113,312 327,933 — — 113,312 327,933 441,245 16,055 1983 01/06 40 years
Summerville, PA . . . . . . . . . . . . . . — 92,798 271,832 — — 92,798 271,832 364,630 13,308 1988 01/06 40 years
Warriors Mark, PA (r) . . . . . . . . . . — 148,499 404,981 — — 148,499 404,981 553,480 19,827 1995 01/06 40 years
Williamsport, PA (r) . . . . . . . . . . . — 295,036 378,715 — — 295,036 378,715 673,751 18,541 1988 01/06 40 years
Zelienople, PA (r) . . . . . . . . . . . . . — 160,219 437,168 — — 160,219 437,168 597,387 21,403 1988 01/06 40 years
United Rentals:
Carrollton, TX . . . . . . . . . . . . . . . . — 477,893 534,807 — — 477,893 534,807 1,012,700 40,667 1981 12/04 40 years
Cedar Park, TX . . . . . . . . . . . . . . . — 535,091 829,241 — — 535,091 829,241 1,364,332 63,056 1990 12/04 40 years
Clearwater, FL . . . . . . . . . . . . . . . . — 1,173,292 1,810,665 — — 1,173,292 1,810,665 2,983,957 137,685 2001 12/04 40 years
Fort Collins, CO . . . . . . . . . . . . . . — 2,057,322 977,971 — — 2,057,322 977,971 3,035,293 74,367 1975 12/04 40 years
Irving, TX . . . . . . . . . . . . . . . . . . . — 708,389 910,786 — — 708,389 910,786 1,619,175 69,257 1984 12/04 40 years
La Porte, TX . . . . . . . . . . . . . . . . . — 1,114,553 2,125,426 — — 1,114,553 2,125,426 3,239,979 161,620 2000 12/04 40 years
Littleton, CO . . . . . . . . . . . . . . . . . — 1,743,092 1,943,650 — — 1,743,092 1,943,650 3,686,742 147,798 2002 12/04 40 years
Oklahoma City, OK . . . . . . . . . . . . — 744,145 1,264,885 — — 744,145 1,264,885 2,009,030 96,183 1997 12/04 40 years
Perrysberg, OH . . . . . . . . . . . . . . . — 641,867 1,119,085 — — 641,867 1,119,085 1,760,952 85,097 1979 12/04 40 years
Plano, TX . . . . . . . . . . . . . . . . . . . . — 1,030,426 1,148,065 — — 1,030,426 1,148,065 2,178,491 87,301 1996 12/04 40 years
Temple, TX . . . . . . . . . . . . . . . . . . — 1,159,775 1,360,379 — — 1,159,775 1,360,379 2,520,154 103,445 1998 12/04 40 years
Ft. Worth, TX . . . . . . . . . . . . . . . . — 510,490 1,127,796 — — 510,490 1,127,796 1,638,286 83,409 1997 01/05 40 years
Ft. Worth, TX . . . . . . . . . . . . . . . . — 1,427,764 — — — 1,427,764 — 1,427,764 (i) (i) 01/05 (i)
Melbourne, FL . . . . . . . . . . . . . . . . — 746,558 607,128 — — 746,558 607,128 1,353,686 39,843 1970 05/05 40 years
United Trust Bank:
Bridgeview, IL . . . . . . . . . . . . . . . . — 673,238 744,154 — — 673,238 744,154 1,417,392 112,398 1997 12/01 40 years
Vacant Land:
Longwood, FL . . . . . . . . . . . . . . . . — 585,152 — — — 585,152 — 585,152 (e) (e) 03/06 (e)
Florence, AL . . . . . . . . . . . . . . . . . — 1,022,509 — — — 1,022,509 — 1,022,509 (e) (e) 06/04 (e)
Florence, AL . . . . . . . . . . . . . . . . . — 243,266 — — — 243,266 — 243,266 (e) (e) 06/04 (e)
Vacant Property:
Mesa, AZ . . . . . . . . . . . . . . . . . . . . — 152,609 399,801 112,765 — 152,609 512,566 665,175 77,418 1997 12/01 40 years
Dallas, GA . . . . . . . . . . . . . . . . . . . — 1,287,630 1,952,791 — — 1,287,630 1,952,791 3,240,421 225,793 1997 05/03 40 years
See accompanying report of independent registered public accounting firm.
F-18
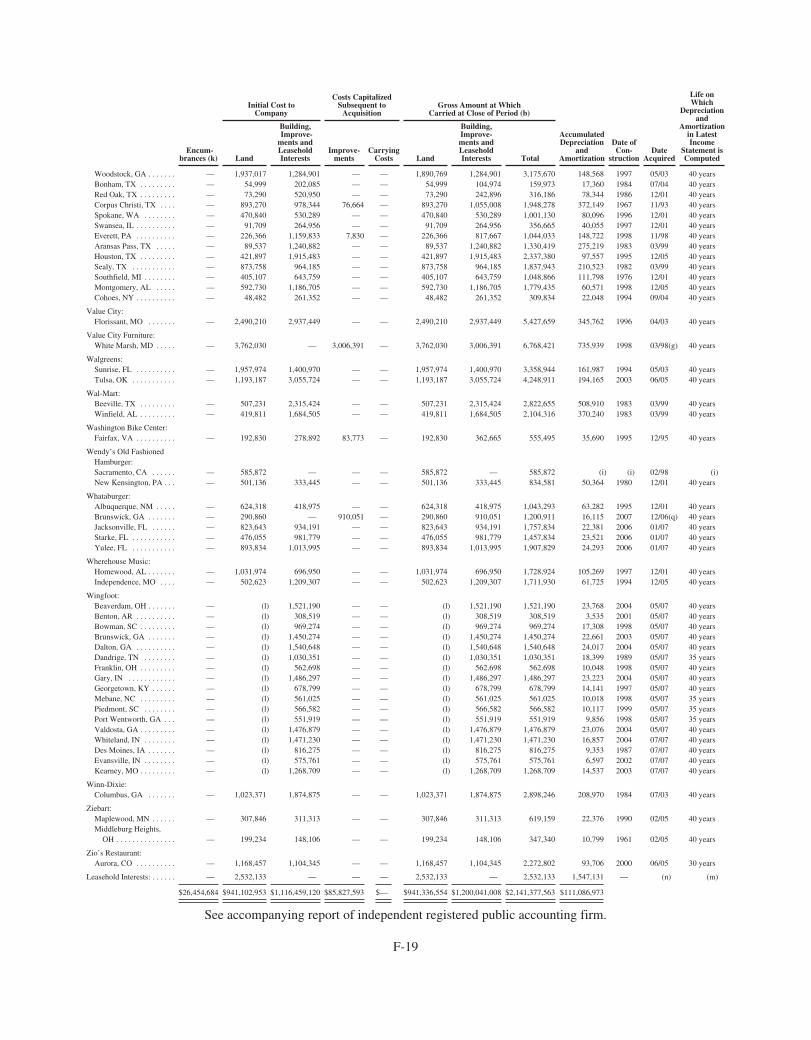
Encum-brances (k)
Initial Cost toCompany
Costs CapitalizedSubsequent to
AcquisitionGross Amount at Which
Carried at Close of Period (b)
AccumulatedDepreciation
andAmortization
Date ofCon-
structionDate
Acquired
Life onWhich
Depreciationand
Amortizationin LatestIncome
Statement isComputedLand
Building,Improve-
ments andLeaseholdInterests
Improve-ments
CarryingCosts Land
Building,Improve-ments andLeaseholdInterests Total
Woodstock, GA . . . . . . . — 1,937,017 1,284,901 — — 1,890,769 1,284,901 3,175,670 148,568 1997 05/03 40 yearsBonham, TX . . . . . . . . . — 54,999 202,085 — — 54,999 104,974 159,973 17,360 1984 07/04 40 yearsRed Oak, TX . . . . . . . . . — 73,290 520,950 — — 73,290 242,896 316,186 78,344 1986 12/01 40 yearsCorpus Christi, TX . . . . — 893,270 978,344 76,664 — 893,270 1,055,008 1,948,278 372,149 1967 11/93 40 yearsSpokane, WA . . . . . . . . — 470,840 530,289 — — 470,840 530,289 1,001,130 80,096 1996 12/01 40 yearsSwansea, IL . . . . . . . . . . — 91,709 264,956 — — 91,709 264,956 356,665 40,055 1997 12/01 40 yearsEverett, PA . . . . . . . . . . — 226,366 1,159,833 7,830 — 226,366 817,667 1,044,033 148,722 1998 11/98 40 yearsAransas Pass, TX . . . . . — 89,537 1,240,882 — — 89,537 1,240,882 1,330,419 275,219 1983 03/99 40 yearsHouston, TX . . . . . . . . . — 421,897 1,915,483 — — 421,897 1,915,483 2,337,380 97,557 1995 12/05 40 yearsSealy, TX . . . . . . . . . . . — 873,758 964,185 — — 873,758 964,185 1,837,943 210,523 1982 03/99 40 yearsSouthfield, MI . . . . . . . . — 405,107 643,759 — — 405,107 643,759 1,048,866 111,798 1976 12/01 40 yearsMontgomery, AL . . . . . — 592,730 1,186,705 — — 592,730 1,186,705 1,779,435 60,571 1998 12/05 40 yearsCohoes, NY . . . . . . . . . . — 48,482 261,352 — — 48,482 261,352 309,834 22,048 1994 09/04 40 years
Value City:Florissant, MO . . . . . . . — 2,490,210 2,937,449 — — 2,490,210 2,937,449 5,427,659 345,762 1996 04/03 40 years
Value City Furniture:White Marsh, MD . . . . . — 3,762,030 — 3,006,391 — 3,762,030 3,006,391 6,768,421 735,939 1998 03/98(g) 40 years
Walgreens:Sunrise, FL . . . . . . . . . . — 1,957,974 1,400,970 — — 1,957,974 1,400,970 3,358,944 161,987 1994 05/03 40 yearsTulsa, OK . . . . . . . . . . . — 1,193,187 3,055,724 — — 1,193,187 3,055,724 4,248,911 194,165 2003 06/05 40 years
Wal-Mart:Beeville, TX . . . . . . . . . — 507,231 2,315,424 — — 507,231 2,315,424 2,822,655 508,910 1983 03/99 40 yearsWinfield, AL . . . . . . . . . — 419,811 1,684,505 — — 419,811 1,684,505 2,104,316 370,240 1983 03/99 40 years
Washington Bike Center:Fairfax, VA . . . . . . . . . . — 192,830 278,892 83,773 — 192,830 362,665 555,495 35,690 1995 12/95 40 years
Wendy’s Old FashionedHamburger:Sacramento, CA . . . . . . — 585,872 — — — 585,872 — 585,872 (i) (i) 02/98 (i)New Kensington, PA . . . — 501,136 333,445 — — 501,136 333,445 834,581 50,364 1980 12/01 40 years
Whataburger:Albuquerque, NM . . . . . — 624,318 418,975 — — 624,318 418,975 1,043,293 63,282 1995 12/01 40 yearsBrunswick, GA . . . . . . . — 290,860 — 910,051 — 290,860 910,051 1,200,911 16,115 2007 12/06(q) 40 yearsJacksonville, FL . . . . . . — 823,643 934,191 — — 823,643 934,191 1,757,834 22,381 2006 01/07 40 yearsStarke, FL . . . . . . . . . . . — 476,055 981,779 — — 476,055 981,779 1,457,834 23,521 2006 01/07 40 yearsYulee, FL . . . . . . . . . . . — 893,834 1,013,995 — — 893,834 1,013,995 1,907,829 24,293 2006 01/07 40 years
Wherehouse Music:Homewood, AL . . . . . . . — 1,031,974 696,950 — — 1,031,974 696,950 1,728,924 105,269 1997 12/01 40 yearsIndependence, MO . . . . — 502,623 1,209,307 — — 502,623 1,209,307 1,711,930 61,725 1994 12/05 40 years
Wingfoot:Beaverdam, OH . . . . . . . — (l) 1,521,190 — — (l) 1,521,190 1,521,190 23,768 2004 05/07 40 yearsBenton, AR . . . . . . . . . . — (l) 308,519 — — (l) 308,519 308,519 3,535 2001 05/07 40 yearsBowman, SC . . . . . . . . . — (l) 969,274 — — (l) 969,274 969,274 17,308 1998 05/07 40 yearsBrunswick, GA . . . . . . . — (l) 1,450,274 — — (l) 1,450,274 1,450,274 22,661 2003 05/07 40 yearsDalton, GA . . . . . . . . . . — (l) 1,540,648 — — (l) 1,540,648 1,540,648 24,017 2004 05/07 40 yearsDandrige, TN . . . . . . . . — (l) 1,030,351 — — (l) 1,030,351 1,030,351 18,399 1989 05/07 35 yearsFranklin, OH . . . . . . . . . — (l) 562,698 — — (l) 562,698 562,698 10,048 1998 05/07 40 yearsGary, IN . . . . . . . . . . . . — (l) 1,486,297 — — (l) 1,486,297 1,486,297 23,223 2004 05/07 40 yearsGeorgetown, KY . . . . . . — (l) 678,799 — — (l) 678,799 678,799 14,141 1997 05/07 40 yearsMebane, NC . . . . . . . . . — (l) 561,025 — — (l) 561,025 561,025 10,018 1998 05/07 35 yearsPiedmont, SC . . . . . . . . — (l) 566,582 — — (l) 566,582 566,582 10,117 1999 05/07 35 yearsPort Wentworth, GA . . . — (l) 551,919 — — (l) 551,919 551,919 9,856 1998 05/07 35 yearsValdosta, GA . . . . . . . . . — (l) 1,476,879 — — (l) 1,476,879 1,476,879 23,076 2004 05/07 40 yearsWhiteland, IN . . . . . . . . — (l) 1,471,230 — — (l) 1,471,230 1,471,230 16,857 2004 07/07 40 yearsDes Moines, IA . . . . . . . — (l) 816,275 — — (l) 816,275 816,275 9,353 1987 07/07 40 yearsEvansville, IN . . . . . . . . — (l) 575,761 — — (l) 575,761 575,761 6,597 2002 07/07 40 yearsKearney, MO . . . . . . . . . — (l) 1,268,709 — — (l) 1,268,709 1,268,709 14,537 2003 07/07 40 years
Winn-Dixie:Columbus, GA . . . . . . . — 1,023,371 1,874,875 — — 1,023,371 1,874,875 2,898,246 208,970 1984 07/03 40 years
Ziebart:Maplewood, MN . . . . . . — 307,846 311,313 — — 307,846 311,313 619,159 22,376 1990 02/05 40 yearsMiddleburg Heights,
OH . . . . . . . . . . . . . . . — 199,234 148,106 — — 199,234 148,106 347,340 10,799 1961 02/05 40 years
Zio’s Restaurant:Aurora, CO . . . . . . . . . . — 1,168,457 1,104,345 — — 1,168,457 1,104,345 2,272,802 93,706 2000 06/05 30 years
Leasehold Interests: . . . . . . — 2,532,133 — — — 2,532,133 — 2,532,133 1,547,131 — (n) (m)
$26,454,684 $941,102,953 $1,116,459,120 $85,827,593 $— $941,336,554 $1,200,041,008 $2,141,377,563 $111,086,973
See accompanying report of independent registered public accounting firm.
F-19
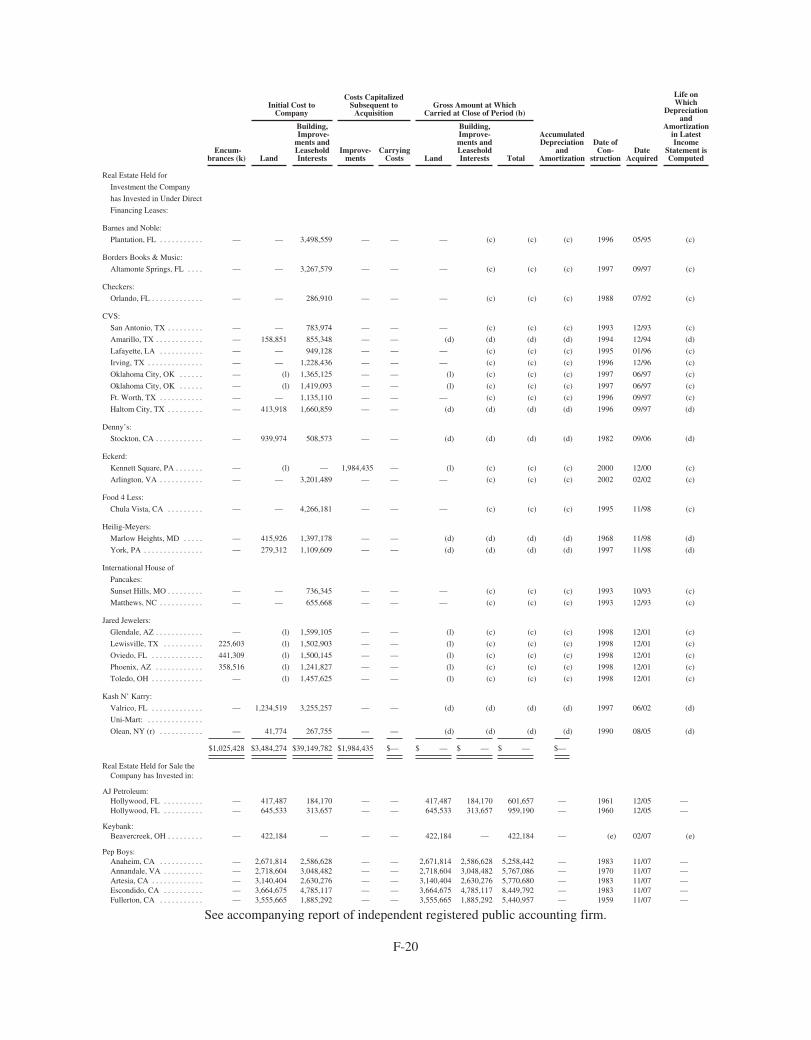
Encum-brances (k)
Initial Cost toCompany
Costs CapitalizedSubsequent to
AcquisitionGross Amount at Which
Carried at Close of Period (b)
AccumulatedDepreciation
andAmortization
Date ofCon-
structionDate
Acquired
Life onWhich
Depreciationand
Amortizationin LatestIncome
Statement isComputedLand
Building,Improve-
ments andLeaseholdInterests
Improve-ments
CarryingCosts Land
Building,Improve-ments andLeaseholdInterests Total
Real Estate Held for
Investment the Company
has Invested in Under Direct
Financing Leases:
Barnes and Noble:
Plantation, FL . . . . . . . . . . . — — 3,498,559 — — — (c) (c) (c) 1996 05/95 (c)
Borders Books & Music:
Altamonte Springs, FL . . . . — — 3,267,579 — — — (c) (c) (c) 1997 09/97 (c)
Checkers:
Orlando, FL . . . . . . . . . . . . . — — 286,910 — — — (c) (c) (c) 1988 07/92 (c)
CVS:
San Antonio, TX . . . . . . . . . — — 783,974 — — — (c) (c) (c) 1993 12/93 (c)
Amarillo, TX . . . . . . . . . . . . — 158,851 855,348 — — (d) (d) (d) (d) 1994 12/94 (d)
Lafayette, LA . . . . . . . . . . . — — 949,128 — — — (c) (c) (c) 1995 01/96 (c)
Irving, TX . . . . . . . . . . . . . . — — 1,228,436 — — — (c) (c) (c) 1996 12/96 (c)
Oklahoma City, OK . . . . . . — (l) 1,365,125 — — (l) (c) (c) (c) 1997 06/97 (c)
Oklahoma City, OK . . . . . . — (l) 1,419,093 — — (l) (c) (c) (c) 1997 06/97 (c)
Ft. Worth, TX . . . . . . . . . . . — — 1,135,110 — — — (c) (c) (c) 1996 09/97 (c)
Haltom City, TX . . . . . . . . . — 413,918 1,660,859 — — (d) (d) (d) (d) 1996 09/97 (d)
Denny’s:
Stockton, CA . . . . . . . . . . . . — 939,974 508,573 — — (d) (d) (d) (d) 1982 09/06 (d)
Eckerd:
Kennett Square, PA . . . . . . . — (l) — 1,984,435 — (l) (c) (c) (c) 2000 12/00 (c)
Arlington, VA . . . . . . . . . . . — — 3,201,489 — — — (c) (c) (c) 2002 02/02 (c)
Food 4 Less:
Chula Vista, CA . . . . . . . . . — — 4,266,181 — — — (c) (c) (c) 1995 11/98 (c)
Heilig-Meyers:
Marlow Heights, MD . . . . . — 415,926 1,397,178 — — (d) (d) (d) (d) 1968 11/98 (d)
York, PA . . . . . . . . . . . . . . . — 279,312 1,109,609 — — (d) (d) (d) (d) 1997 11/98 (d)
International House of
Pancakes:
Sunset Hills, MO . . . . . . . . . — — 736,345 — — — (c) (c) (c) 1993 10/93 (c)
Matthews, NC . . . . . . . . . . . — — 655,668 — — — (c) (c) (c) 1993 12/93 (c)
Jared Jewelers:
Glendale, AZ . . . . . . . . . . . . — (l) 1,599,105 — — (l) (c) (c) (c) 1998 12/01 (c)
Lewisville, TX . . . . . . . . . . 225,603 (l) 1,502,903 — — (l) (c) (c) (c) 1998 12/01 (c)
Oviedo, FL . . . . . . . . . . . . . 441,309 (l) 1,500,145 — — (l) (c) (c) (c) 1998 12/01 (c)
Phoenix, AZ . . . . . . . . . . . . 358,516 (l) 1,241,827 — — (l) (c) (c) (c) 1998 12/01 (c)
Toledo, OH . . . . . . . . . . . . . — (l) 1,457,625 — — (l) (c) (c) (c) 1998 12/01 (c)
Kash N’ Karry:
Valrico, FL . . . . . . . . . . . . . — 1,234,519 3,255,257 — — (d) (d) (d) (d) 1997 06/02 (d)
Uni-Mart: . . . . . . . . . . . . . .
Olean, NY (r) . . . . . . . . . . . — 41,774 267,755 — — (d) (d) (d) (d) 1990 08/05 (d)
$1,025,428 $3,484,274 $39,149,782 $1,984,435 $— $ — $ — $ — $—
Real Estate Held for Sale theCompany has Invested in:
AJ Petroleum:Hollywood, FL . . . . . . . . . . — 417,487 184,170 — — 417,487 184,170 601,657 — 1961 12/05 —Hollywood, FL . . . . . . . . . . — 645,533 313,657 — — 645,533 313,657 959,190 — 1960 12/05 —
Keybank:Beavercreek, OH . . . . . . . . . — 422,184 — — — 422,184 — 422,184 — (e) 02/07 (e)
Pep Boys:Anaheim, CA . . . . . . . . . . . — 2,671,814 2,586,628 — — 2,671,814 2,586,628 5,258,442 — 1983 11/07 —Annandale, VA . . . . . . . . . . — 2,718,604 3,048,482 — — 2,718,604 3,048,482 5,767,086 — 1970 11/07 —Artesia, CA . . . . . . . . . . . . . — 3,140,404 2,630,276 — — 3,140,404 2,630,276 5,770,680 — 1983 11/07 —Escondido, CA . . . . . . . . . . — 3,664,675 4,785,117 — — 3,664,675 4,785,117 8,449,792 — 1983 11/07 —Fullerton, CA . . . . . . . . . . . — 3,555,665 1,885,292 — — 3,555,665 1,885,292 5,440,957 — 1959 11/07 —
See accompanying report of independent registered public accounting firm.
F-20
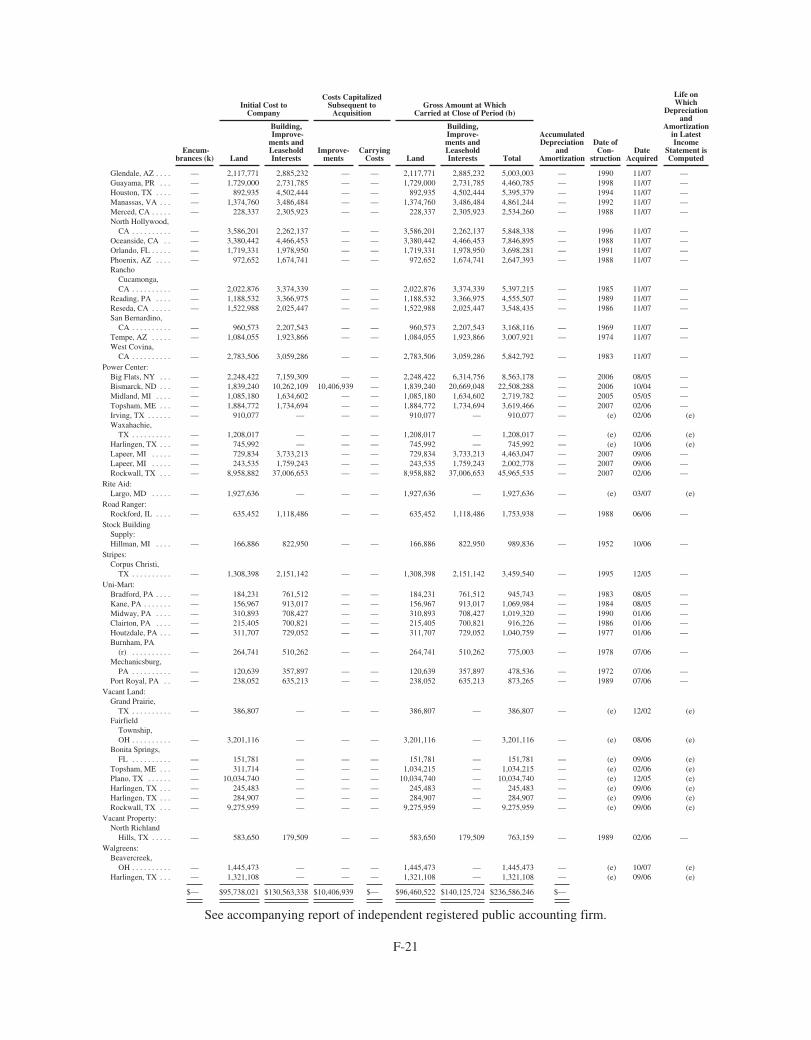
Encum-brances (k)
Initial Cost toCompany
Costs CapitalizedSubsequent to
AcquisitionGross Amount at Which
Carried at Close of Period (b)
AccumulatedDepreciation
andAmortization
Date ofCon-
structionDate
Acquired
Life onWhich
Depreciationand
Amortizationin LatestIncome
Statement isComputedLand
Building,Improve-
ments andLeaseholdInterests
Improve-ments
CarryingCosts Land
Building,Improve-ments andLeaseholdInterests Total
Glendale, AZ . . . . — 2,117,771 2,885,232 — — 2,117,771 2,885,232 5,003,003 — 1990 11/07 —Guayama, PR . . . — 1,729,000 2,731,785 — — 1,729,000 2,731,785 4,460,785 — 1998 11/07 —Houston, TX . . . . — 892,935 4,502,444 — — 892,935 4,502,444 5,395,379 — 1994 11/07 —Manassas, VA . . . — 1,374,760 3,486,484 — — 1,374,760 3,486,484 4,861,244 — 1992 11/07 —Merced, CA . . . . . — 228,337 2,305,923 — — 228,337 2,305,923 2,534,260 — 1988 11/07 —North Hollywood,
CA . . . . . . . . . . — 3,586,201 2,262,137 — — 3,586,201 2,262,137 5,848,338 — 1996 11/07 —Oceanside, CA . . — 3,380,442 4,466,453 — — 3,380,442 4,466,453 7,846,895 — 1988 11/07 —Orlando, FL . . . . . — 1,719,331 1,978,950 — — 1,719,331 1,978,950 3,698,281 — 1991 11/07 —Phoenix, AZ . . . . — 972,652 1,674,741 — — 972,652 1,674,741 2,647,393 — 1988 11/07 —Rancho
Cucamonga,CA . . . . . . . . . . — 2,022,876 3,374,339 — — 2,022,876 3,374,339 5,397,215 — 1985 11/07 —
Reading, PA . . . . — 1,188,532 3,366,975 — — 1,188,532 3,366,975 4,555,507 — 1989 11/07 —Reseda, CA . . . . . — 1,522,988 2,025,447 — — 1,522,988 2,025,447 3,548,435 — 1986 11/07 —San Bernardino,
CA . . . . . . . . . . — 960,573 2,207,543 — — 960,573 2,207,543 3,168,116 — 1969 11/07 —Tempe, AZ . . . . . — 1,084,055 1,923,866 — — 1,084,055 1,923,866 3,007,921 — 1974 11/07 —West Covina,
CA . . . . . . . . . . — 2,783,506 3,059,286 — — 2,783,506 3,059,286 5,842,792 — 1983 11/07 —Power Center:
Big Flats, NY . . . — 2,248,422 7,159,309 — — 2,248,422 6,314,756 8,563,178 — 2006 08/05 —Bismarck, ND . . . — 1,839,240 10,262,109 10,406,939 — 1,839,240 20,669,048 22,508,288 — 2006 10/04 —Midland, MI . . . . — 1,085,180 1,634,602 — — 1,085,180 1,634,602 2,719,782 — 2005 05/05 —Topsham, ME . . . — 1,884,772 1,734,694 — — 1,884,772 1,734,694 3,619,466 — 2007 02/06 —Irving, TX . . . . . . — 910,077 — — — 910,077 — 910,077 — (e) 02/06 (e)Waxahachie,
TX . . . . . . . . . . — 1,208,017 — — — 1,208,017 — 1,208,017 — (e) 02/06 (e)Harlingen, TX . . . — 745,992 — — — 745,992 — 745,992 — (e) 10/06 (e)Lapeer, MI . . . . . — 729,834 3,733,213 — — 729,834 3,733,213 4,463,047 — 2007 09/06 —Lapeer, MI . . . . . — 243,535 1,759,243 — — 243,535 1,759,243 2,002,778 — 2007 09/06 —Rockwall, TX . . . — 8,958,882 37,006,653 — — 8,958,882 37,006,653 45,965,535 — 2007 02/06 —
Rite Aid:Largo, MD . . . . . — 1,927,636 — — — 1,927,636 — 1,927,636 — (e) 03/07 (e)
Road Ranger:Rockford, IL . . . . — 635,452 1,118,486 — — 635,452 1,118,486 1,753,938 — 1988 06/06 —
Stock BuildingSupply:Hillman, MI . . . . — 166,886 822,950 — — 166,886 822,950 989,836 — 1952 10/06 —
Stripes:Corpus Christi,
TX . . . . . . . . . . — 1,308,398 2,151,142 — — 1,308,398 2,151,142 3,459,540 — 1995 12/05 —Uni-Mart:
Bradford, PA . . . . — 184,231 761,512 — — 184,231 761,512 945,743 — 1983 08/05 —Kane, PA . . . . . . . — 156,967 913,017 — — 156,967 913,017 1,069,984 — 1984 08/05 —Midway, PA . . . . — 310,893 708,427 — — 310,893 708,427 1,019,320 — 1990 01/06 —Clairton, PA . . . . — 215,405 700,821 — — 215,405 700,821 916,226 — 1986 01/06 —Houtzdale, PA . . . — 311,707 729,052 — — 311,707 729,052 1,040,759 — 1977 01/06 —Burnham, PA
(r) . . . . . . . . . . — 264,741 510,262 — — 264,741 510,262 775,003 — 1978 07/06 —Mechanicsburg,
PA . . . . . . . . . . — 120,639 357,897 — — 120,639 357,897 478,536 — 1972 07/06 —Port Royal, PA . . — 238,052 635,213 — — 238,052 635,213 873,265 — 1989 07/06 —
Vacant Land:Grand Prairie,
TX . . . . . . . . . . — 386,807 — — — 386,807 — 386,807 — (e) 12/02 (e)Fairfield
Township,OH . . . . . . . . . . — 3,201,116 — — — 3,201,116 — 3,201,116 — (e) 08/06 (e)
Bonita Springs,FL . . . . . . . . . . — 151,781 — — — 151,781 — 151,781 — (e) 09/06 (e)
Topsham, ME . . . — 311,714 — — — 1,034,215 — 1,034,215 — (e) 02/06 (e)Plano, TX . . . . . . — 10,034,740 — — — 10,034,740 — 10,034,740 — (e) 12/05 (e)Harlingen, TX . . . — 245,483 — — — 245,483 — 245,483 — (e) 09/06 (e)Harlingen, TX . . . — 284,907 — — — 284,907 — 284,907 — (e) 09/06 (e)Rockwall, TX . . . — 9,275,959 — — — 9,275,959 — 9,275,959 — (e) 09/06 (e)
Vacant Property:North Richland
Hills, TX . . . . . — 583,650 179,509 — — 583,650 179,509 763,159 — 1989 02/06 —Walgreens:
Beavercreek,OH . . . . . . . . . . — 1,445,473 — — — 1,445,473 — 1,445,473 — (e) 10/07 (e)
Harlingen, TX . . . — 1,321,108 — — — 1,321,108 — 1,321,108 — (e) 09/06 (e)
$— $95,738,021 $130,563,338 $10,406,939 $— $96,460,522 $140,125,724 $236,586,246 $—
See accompanying report of independent registered public accounting firm.
F-21
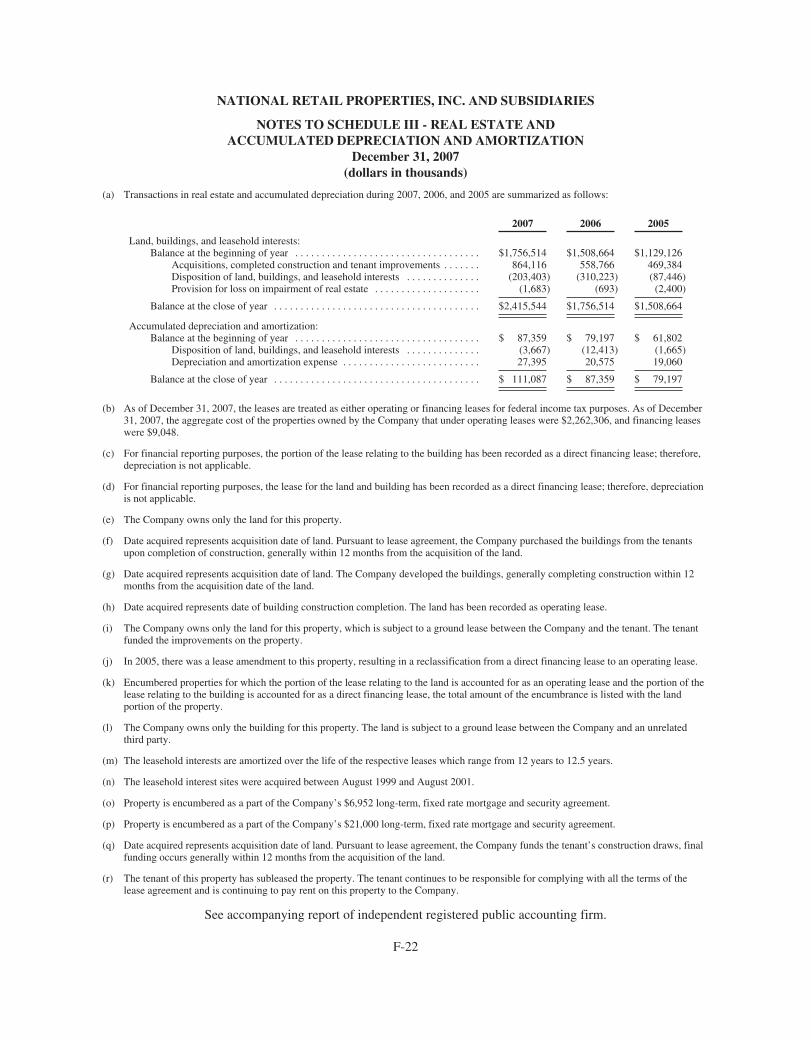
NATIONAL RETAIL PROPERTIES, INC. AND SUBSIDIARIES
NOTES TO SCHEDULE III - REAL ESTATE ANDACCUMULATED DEPRECIATION AND AMORTIZATION
December 31, 2007(dollars in thousands)
(a) Transactions in real estate and accumulated depreciation during 2007, 2006, and 2005 are summarized as follows:
2007 2006 2005
Land, buildings, and leasehold interests:Balance at the beginning of year . . . . . . . . . . . . . . . . . . . . . . . . . . . . . . . . . . . $1,756,514 $1,508,664 $1,129,126
Acquisitions, completed construction and tenant improvements . . . . . . . 864,116 558,766 469,384Disposition of land, buildings, and leasehold interests . . . . . . . . . . . . . . (203,403) (310,223) (87,446)Provision for loss on impairment of real estate . . . . . . . . . . . . . . . . . . . . (1,683) (693) (2,400)
Balance at the close of year . . . . . . . . . . . . . . . . . . . . . . . . . . . . . . . . . . . . . . . $2,415,544 $1,756,514 $1,508,664
Accumulated depreciation and amortization:Balance at the beginning of year . . . . . . . . . . . . . . . . . . . . . . . . . . . . . . . . . . . $ 87,359 $ 79,197 $ 61,802
Disposition of land, buildings, and leasehold interests . . . . . . . . . . . . . . (3,667) (12,413) (1,665)Depreciation and amortization expense . . . . . . . . . . . . . . . . . . . . . . . . . . 27,395 20,575 19,060
Balance at the close of year . . . . . . . . . . . . . . . . . . . . . . . . . . . . . . . . . . . . . . . $ 111,087 $ 87,359 $ 79,197
(b) As of December 31, 2007, the leases are treated as either operating or financing leases for federal income tax purposes. As of December31, 2007, the aggregate cost of the properties owned by the Company that under operating leases were $2,262,306, and financing leaseswere $9,048.
(c) For financial reporting purposes, the portion of the lease relating to the building has been recorded as a direct financing lease; therefore,depreciation is not applicable.
(d) For financial reporting purposes, the lease for the land and building has been recorded as a direct financing lease; therefore, depreciationis not applicable.
(e) The Company owns only the land for this property.
(f) Date acquired represents acquisition date of land. Pursuant to lease agreement, the Company purchased the buildings from the tenantsupon completion of construction, generally within 12 months from the acquisition of the land.
(g) Date acquired represents acquisition date of land. The Company developed the buildings, generally completing construction within 12months from the acquisition date of the land.
(h) Date acquired represents date of building construction completion. The land has been recorded as operating lease.
(i) The Company owns only the land for this property, which is subject to a ground lease between the Company and the tenant. The tenantfunded the improvements on the property.
(j) In 2005, there was a lease amendment to this property, resulting in a reclassification from a direct financing lease to an operating lease.
(k) Encumbered properties for which the portion of the lease relating to the land is accounted for as an operating lease and the portion of thelease relating to the building is accounted for as a direct financing lease, the total amount of the encumbrance is listed with the landportion of the property.
(l) The Company owns only the building for this property. The land is subject to a ground lease between the Company and an unrelatedthird party.
(m) The leasehold interests are amortized over the life of the respective leases which range from 12 years to 12.5 years.
(n) The leasehold interest sites were acquired between August 1999 and August 2001.
(o) Property is encumbered as a part of the Company’s $6,952 long-term, fixed rate mortgage and security agreement.
(p) Property is encumbered as a part of the Company’s $21,000 long-term, fixed rate mortgage and security agreement.
(q) Date acquired represents acquisition date of land. Pursuant to lease agreement, the Company funds the tenant’s construction draws, finalfunding occurs generally within 12 months from the acquisition of the land.
(r) The tenant of this property has subleased the property. The tenant continues to be responsible for complying with all the terms of thelease agreement and is continuing to pay rent on this property to the Company.
See accompanying report of independent registered public accounting firm.
F-22
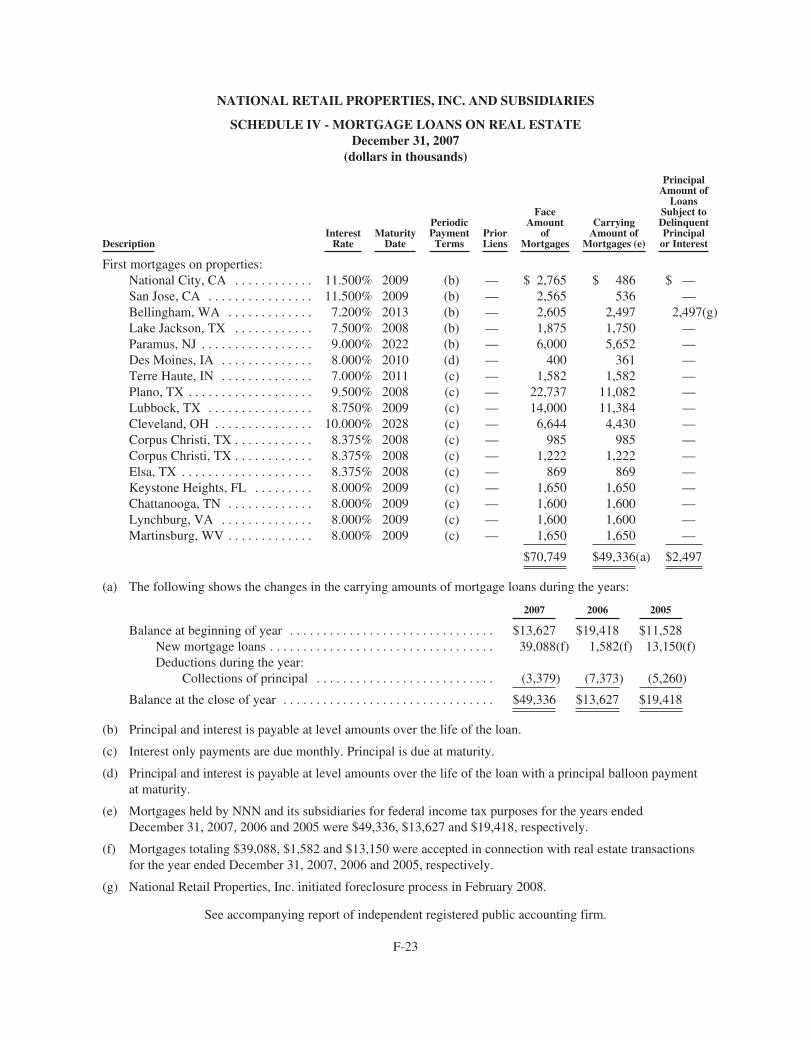
NATIONAL RETAIL PROPERTIES, INC. AND SUBSIDIARIES
SCHEDULE IV - MORTGAGE LOANS ON REAL ESTATEDecember 31, 2007
(dollars in thousands)
DescriptionInterest
RateMaturity
Date
PeriodicPaymentTerms
PriorLiens
FaceAmount
ofMortgages
CarryingAmount of
Mortgages (e)
PrincipalAmount of
LoansSubject toDelinquentPrincipal
or Interest
First mortgages on properties:National City, CA . . . . . . . . . . . . 11.500% 2009 (b) — $ 2,765 $ 486 $ —San Jose, CA . . . . . . . . . . . . . . . . 11.500% 2009 (b) — 2,565 536 —Bellingham, WA . . . . . . . . . . . . . 7.200% 2013 (b) — 2,605 2,497 2,497(g)Lake Jackson, TX . . . . . . . . . . . . 7.500% 2008 (b) — 1,875 1,750 —Paramus, NJ . . . . . . . . . . . . . . . . . 9.000% 2022 (b) — 6,000 5,652 —Des Moines, IA . . . . . . . . . . . . . . 8.000% 2010 (d) — 400 361 —Terre Haute, IN . . . . . . . . . . . . . . 7.000% 2011 (c) — 1,582 1,582 —Plano, TX . . . . . . . . . . . . . . . . . . . 9.500% 2008 (c) — 22,737 11,082 —Lubbock, TX . . . . . . . . . . . . . . . . 8.750% 2009 (c) — 14,000 11,384 —Cleveland, OH . . . . . . . . . . . . . . . 10.000% 2028 (c) — 6,644 4,430 —Corpus Christi, TX . . . . . . . . . . . . 8.375% 2008 (c) — 985 985 —Corpus Christi, TX . . . . . . . . . . . . 8.375% 2008 (c) — 1,222 1,222 —Elsa, TX . . . . . . . . . . . . . . . . . . . . 8.375% 2008 (c) — 869 869 —Keystone Heights, FL . . . . . . . . . 8.000% 2009 (c) — 1,650 1,650 —Chattanooga, TN . . . . . . . . . . . . . 8.000% 2009 (c) — 1,600 1,600 —Lynchburg, VA . . . . . . . . . . . . . . 8.000% 2009 (c) — 1,600 1,600 —Martinsburg, WV . . . . . . . . . . . . . 8.000% 2009 (c) — 1,650 1,650 —
$70,749 $49,336(a) $2,497
(a) The following shows the changes in the carrying amounts of mortgage loans during the years:
2007 2006 2005
Balance at beginning of year . . . . . . . . . . . . . . . . . . . . . . . . . . . . . . . $13,627 $19,418 $11,528New mortgage loans . . . . . . . . . . . . . . . . . . . . . . . . . . . . . . . . . . 39,088(f) 1,582(f) 13,150(f)Deductions during the year:
Collections of principal . . . . . . . . . . . . . . . . . . . . . . . . . . . (3,379) (7,373) (5,260)
Balance at the close of year . . . . . . . . . . . . . . . . . . . . . . . . . . . . . . . . $49,336 $13,627 $19,418
(b) Principal and interest is payable at level amounts over the life of the loan.
(c) Interest only payments are due monthly. Principal is due at maturity.
(d) Principal and interest is payable at level amounts over the life of the loan with a principal balloon paymentat maturity.
(e) Mortgages held by NNN and its subsidiaries for federal income tax purposes for the years endedDecember 31, 2007, 2006 and 2005 were $49,336, $13,627 and $19,418, respectively.
(f) Mortgages totaling $39,088, $1,582 and $13,150 were accepted in connection with real estate transactionsfor the year ended December 31, 2007, 2006 and 2005, respectively.
(g) National Retail Properties, Inc. initiated foreclosure process in February 2008.
See accompanying report of independent registered public accounting firm.
F-23
EXHIBIT 10.8
EMPLOYMENT AGREEMENT
THIS EMPLOYMENT AGREEMENT (the “Agreement”) dated as of January 2, 2007, by and between National Retail Properties, Inc., with its principal place of business at 450 South Orange Avenue, Suite 900, Orlando, Florida 32801 (the “Company”), and Paul E. Bayer, residing at the address set forth on the signature page hereof (“Executive”).
WHEREAS, the Company desires to continue to employ Executive, and Executive desires to continue to be employed by the Company; and
WHEREAS, the Company and Executive desire to enter into an Employment Agreement which sets forth the terms and conditions of Executive’s continuing employment by the Company.
Accordingly, the parties hereto agree as follows: 1. Term. The Company hereby employs Executive, and Executive hereby accepts such employment, for a term (as the same may
be extended, the “Term”) commencing as of the date hereof and continuing for a two-year period, unless terminated earlier in accordance with the provisions of Section 4. On the second anniversary of the date hereof, the Term shall automatically be extended for successive two-year periods in accordance with the terms of this Agreement (subject to termination as aforesaid) unless either party notifies the other party of non-renewal in writing, in accordance with Section 8, 180 days prior to the expiration of the initial two-year period or any subsequent renewal period.
2. Duties. During the Term, Executive shall be employed by the Company as Executive Vice President, and, as such, Executive shall faithfully perform for the Company the duties of said office and shall perform such other duties of an executive, managerial or administrative nature as shall be specified and designated from time to time by the Board of Directors of the Company (the “Board”) or the Chief Executive Officer of the Company, which duties shall not be materially inconsistent with the duties performed by executives holding similar offices with real estate investment trusts. Executive shall devote substantially all of his business time and effort to the performance of his duties hereunder, except that Executive may devote reasonable time and attention to civic, charitable, business or social activities so long as such activities do not interfere with Executive’s employment duties. Executive shall comply with the policies, standards, and regulations established from time to time by the Company.
3. Compensation. 3.1 Salary. For purposes of this Agreement, a “Contract Year” shall mean each calendar year during the Term. During the
first Contract Year of the Term, the Company shall pay Executive a base salary at the rate of $170,000 per annum, in accordance with the customary payroll practices of the Company applicable to senior executives, but not less frequently than monthly. The Compensation Committee of the Board shall review Executive’s base salary each Contract Year during the Term and may increase such amount as it may deem advisable (such salary, as the same may be increased, the “Annual Salary”).
3.2 Bonus and Incentive Compensation. Executive will be entitled to participate in the Company’s Annual Bonus Program (the “Bonus Plan”) as follows:
(a) Annual Bonus Compensation. Executive shall be eligible to receive a bonus each Contract Year (“Annual Bonus”) as the Compensation Committee of the Board of Directors shall determine. Executive’s Annual Bonus shall be determined in accordance with the Company’s executive compensation policies as in effect from time to time during the Term and shall be based, in part, on his achieving his individual performance goals for the year and, in part, on the Company’s achieving its performance goals for the year.
(b) Equity Incentive Awards. Executive shall be eligible to participate each Contract Year in the Company’s equity incentive plans pursuant to the Company’s 2000 Performance Incentive Plan or such other plans or programs as the Compensation Committee shall determine.
3.3 Benefits - In General. Except with respect to benefits of a type otherwise provided for under Section 3.4, Executive shall be permitted during the Term to participate in any group life, hospitalization or disability insurance plans, health programs, retirement plans, fringe benefit programs and similar benefits that may be available to other senior executives of the Company generally, on the same terms as such other executives, in each case to the extent that Executive is eligible under the terms of such plans or programs.
3.4 Specific Benefits. Without limiting the generality of Section 3.3, the Company shall make available to Executive the fringe benefits set forth on Attachment “A” to this Agreement. Executive shall be entitled to 20 days of paid time off (“PTO”) per Contract Year. Unless otherwise required by law, no more than 10 days of unused PTO may be carried forward (on a “first-in, first-out” basis) to the immediately following year (but not thereafter).
3.5 Expenses. The Company shall pay or reimburse Executive for all ordinary and reasonable out-of-pocket expenses incurred by Executive during the Term in the performance of Executive’s services under this Agreement; provided that such expenses are incurred and accounted for by Executive in accordance with the policies and procedures established from time to time by the Company.
4. Termination of Employment. 4.1 Termination upon Death or Disability. If Executive dies during the Term, the obligations of the Company to or with
respect to Executive shall terminate in their entirety except as otherwise provided under this Section 4.1. If Executive becomes eligible for disability benefits under the Company’s long-term disability plans and arrangements (or, if none, if Executive by virtue of ill health or other disability is unable to perform substantially and continuously the duties assigned to him for at least 120 consecutive or non-consecutive days out of any consecutive 12-month period), the Company shall have the right, to the extent permitted by law, to terminate the employment of Executive upon notice in writing to Executive; provided that the Company will have no right to terminate Executive’s employment if, in the reasonable opinion of a qualified physician acceptable to the Company, it is substantially certain that Executive will be able to resume Executive’s duties on a regular full-time basis within 30 days of the date Executive receives notice of such termination. Upon death or other termination of employment by virtue of disability in accordance with this Section 4.1, Executive (or Executive’s estate or beneficiaries in the case of the death of Executive) shall have no right to receive any compensation or benefit hereunder on and after the effective date of the termination of employment other than (i) Annual Salary and other benefits earned and accrued under this Agreement prior to the date of termination (and reimbursement under this Agreement for expenses incurred prior to the date of termination); (ii) a cash payment equal to the prorated portion of the Annual Bonus at the “target” level for the Contract Year or partial Contract Year in which
2
Executive’s employment hereunder terminates; (iii) elimination of any exclusively time-based vesting conditions on any restricted stock, stock option or other equity awards in the Company he had been granted which he then continues to hold, to the extent then unvested (it being expressly understood and agreed that any performance-based vesting conditions (whether or not in tandem with such time-based vesting conditions) will continue in effect in accordance with their terms, except as may otherwise be provided to the contrary in the applicable award agreements); (iv) in the event of Executive’s death, (A) a cash payment equal to two months of Executive’s Annual Salary payable no later than 10 days after such termination, and (B) continuation to Executive’s spouse and dependents of fully paid health insurance benefits under the Company’s health plans and programs applicable to senior executives of the Company generally (if and as in effect from time to time) during the one year following the date of termination; and (v) Executive (or, in the case of his death, his estate and beneficiaries) shall have no further rights to any other compensation or benefits hereunder on or after the termination of employment, or any other rights hereunder.
4.2 Termination by the Company for Cause; Termination by Executive without Good Reason. (a) For purposes of this Agreement, “Cause” shall mean Executive’s:
provided, that the Company shall not be permitted to terminate Executive for Cause except on written notice given to Executive at any time following the occurrence of any of the events described in clause (i), (ii), (iii) or (iv) above. Notwithstanding the foregoing, Executive shall not be deemed to have been terminated for Cause under clause (ii) or (iv) above unless the Company provided written notice to Executive setting forth in reasonable detail the reasons for the Company’s intention to terminate for Cause, Executive has been provided the opportunity, together with counsel, not later than 14 days following such notice to be heard before the Board and Executive failed within 30 days (or, if later, five business days after such hearing) to cure the event or deficiency set forth in the written notice.
(b) The Company may terminate Executive’s employment hereunder for Cause, and Executive may terminate his employment at any time upon 60 days prior written notice to the Company. If the Company terminates Executive for Cause, or Executive terminates his employment
3
(i) conviction of (or pleading nolo contendere to), or an indictment or information is filed against Executive and is not discharged or otherwise resolved within 12 months thereafter, and said indictment or information charged Executive with a felony, any crime of moral turpitude, or any crime which is likely to result in material injury to the Company;
(ii) the continued failure by Executive substantially to perform his duties or to carry out the lawful directives of the
Board of Directors;
(iii) material breach of a fiduciary duty relating to Executive’s employment with the Company, or otherwise
engaging in gross misconduct or willful or gross neglect (in connection with the performance of his duties) which is materially injurious to the Company; or
(iv) material breach of any of Section 6 or any other provisions of this Agreement
and the termination by Executive is not covered by Section 4.3, (i) Executive shall receive Annual Salary and other benefits (but, in all events, and without increasing Executive’s rights under any other provision hereof, excluding any Annual Bonus not yet paid) earned and accrued under this Agreement prior to the termination of employment (and reimbursement under this Agreement for expenses incurred prior to the termination of employment), and (ii) Executive shall have no further rights to any other compensation or benefits hereunder on or after the termination of employment, or any other rights hereunder.
4.3 Termination by the Company without Cause; Termination by Executive for Good Reason. (a) For purposes of this Agreement, “Good Reason” shall mean, unless otherwise consented to by Executive:
Notwithstanding the foregoing, Good Reason under clause (i), (ii), (iii) or (iv) above shall not be deemed to exist unless notice of termination on account thereof (specifying a termination date no later than 15 days from the date of such notice) is given by Executive to the Company no later than 30 days after the time at which Executive first becomes or should have become aware of the event or condition purportedly giving rise to Good Reason; and, in such event, the Company shall have 30 days from the date notice of such a termination is given to cure such event or condition and, if the Company does so, such event or condition shall not constitute Good Reason hereunder.
(b) The Company may terminate Executive’s employment at any time for any reason or no reason upon 30 days’ prior written notice to Executive and Executive may terminate Executive’s employment with the Company for Good Reason. If the Company terminates Executive’s employment and the termination is not covered by Sections 4.1, 4.2 or 4.4 or Executive terminates his employment for Good Reason:
4
(i) a material reduction in Executive’s position, authority, duties or responsibilities;
(ii) a reduction in Annual Salary of Executive;
(iii) the relocation of Executive’s office to more than 50 miles from the Company’s principal place of business in
Orlando, Florida;
(iv) the Company’s material breach of this Agreement; or
(v) the Company’s failure to obtain an agreement from any successor to the business of the Company by which the
successor assumes and agrees to perform this Agreement.
(i) Executive shall (subject, in the case of the following clauses (C), (D), (E) and (H), to Executive’s delivery of a
general release reasonably acceptable to the Company which shall have become irrevocable) be entitled to:
(A) any accrued but unpaid Annual Salary and PTO due to Executive as of the termination of employment;
provided that the amounts referred to in clauses (A), (B), (E) and (H) shall be paid to Executive in a single sum no later than 10 days following delivery of the release referenced above, except to the extent that a six-month delay is necessary to avoid tax under Section 409A of the Code; and
5
(B) reimbursement under this Agreement for expenses incurred but unpaid prior to the termination of
employment;
(C) a cash payment equal to 200% of Executive’s Annual Salary, payable in equal installments over a 12–month period in accordance with the Company’s usual and customary payroll practices, commencing on the first payday following Executive’s termination; provided, however, that, in the event of such a termination upon or after a Change of Control, such payment shall be paid to Executive in a single sum no later than 10 days following delivery of the release referenced above and the release having become irrevocable; and provided, further, that no payments shall be made less than six months after termination to the extent required to comply with Section 409A of the Code (in which case any payments deferred under this provision shall be paid upon the six-month anniversary of termination);
(D) a cash payment equal to 200% of Executive’s average Annual Bonus for the three Contract Years immediately preceding the date of termination, payable in equal installments over a 12-month period in accordance with the Company’s usual and customary payroll practices, commencing on the first payday following Executive’s termination; provided, however, that, in the event of such a termination upon or after a Change of Control, such payment shall be paid to Executive in a single sum no later than 10 days following delivery of the release referenced above and the release’s having become irrevocable; and provided, further, that no payments shall be made less than six months after termination to the extent required to comply with Section 409A of the Code (in which case any payments deferred under this provision shall be paid upon the six-month anniversary of termination);
(E) any payment due under Section 5 hereof;
(F) vesting of any restricted stock, stock options or other equity awards in the Company Executive had been
granted which Executive then continues to hold, to the extent then unvested;
(G) for a period of one year after termination, such health benefits under the Company’s health plans and programs applicable to senior executives of the Company generally (if and as in effect from time to time) as Executive would have received under this Agreement (and at such costs to Executive as would have applied in the absence of such termination); provided, however, that the Company shall in no event be required to provide any benefits otherwise required by this clause (G) after such time as Executive becomes entitled to receive benefits of the same type from another employer or recipient of Executive’s services (such entitlement being determined without regard to any individual waivers or other similar arrangements); and
(H) in the event of such a termination upon or after a Change of Control, a prorated Annual Bonus at the
“target” level for the Contract Year or partial Contract Year in which Executive’s employment hereunder terminates;
(ii) Executive shall have no further rights to any other compensation or benefits hereunder on or after the
termination of employment, or any other rights hereunder.
4.4 Natural Termination. In the event that Executive’s employment by the Company pursuant to this Agreement terminates at the scheduled expiration of the Term because of a non-renewal of the Term as a result of a decision by the Company not to renew as contemplated by and in accordance with the last sentence of Section 1 (and not theretofore under Section 4.1, 4.2 or 4.3),
provided that the amounts referred to in clauses (A), (B), (D) and (F) shall be paid to Executive in a single sum no later than 10 days following delivery of the release referenced above, except to the extent that a six-month delay is necessary to avoid tax under Section 409A of the Code; and
6
(i) Executive shall (subject, in the case of the following clauses (C), (D) and (F), to Executive’s delivery of a
general release reasonably acceptable to the Company which shall have become irrevocable) be entitled to:
(A) any accrued but unpaid Annual Salary and PTO due to Executive as of the termination of employment;
(B) reimbursement under this Agreement for expenses incurred but unpaid prior to the termination of
employment;
(C) a cash payment equal to 200% of Executive’s Annual Salary in the case of expiration of the initial Term, or 100% of Executive’s Annual Salary in the case of expiration of a renewal of the Term, payable in equal installments over a 12–month period in accordance with the Company’s usual and customary payroll practices, commencing on the first payday following termination of this Agreement; provided, however, that no payments shall be made less than six months after termination to the extent required to comply with Section 409A of the Code (in which case any payments deferred under this provision shall be paid upon the six-month anniversary of termination);
(D) any payment due under Section 5 hereof;
(E) for a period of one year after termination, such health benefits under the Company’s health plans and programs applicable to senior executives of the Company generally (if and as in effect from time to time) as Executive would have received under this Agreement (and at such costs to Executive as would have applied in the absence of such termination upon expiration); provided, however, that the Company shall in no event be required to provide any benefits otherwise required by this clause (E) after such time as Executive becomes entitled to receive benefits of the same type from another employer or recipient of Executive’s services (such entitlement being determined without regard to any individual waivers or other similar arrangements);
(F) a prorated Annual Bonus at the “target” level for the Contract Year or partial Contract Year in which
Executive’s employment hereunder terminates; and
(G) only in the case of expiration of the initial Term, elimination of any exclusively time-based vesting conditions on any restricted stock, stock option or other equity awards in the Company Executive had been granted which Executive then continues to hold, to the extent then unvested (it being expressly understood and agreed that any performance-based vesting conditions (whether or not in tandem with such time-based vesting conditions) will continue in effect in accordance with their terms, except as may otherwise be provided to the contrary in the applicable award agreements);
(ii) Executive shall have no further rights to any other compensation or benefits hereunder on or after the
termination of employment, or any other rights hereunder.
5. Certain Additional Payments by the Company. (a) Anything in this Agreement to the contrary notwithstanding and except as set forth below, in the event it shall be
determined that any payment or distribution by the Company to or for the benefit of Executive (whether paid or payable or distributed or distributable pursuant to the terms of this Agreement or otherwise, but determined without regard to any additional payments required under this Section 5) (a “Payment”) would be subject to the excise tax imposed by Section 4999 of the Code or any interest or penalties are incurred by Executive with respect to such excise tax (such excise tax, together with any such interest and penalties, are hereinafter collectively referred to as the “Excise Tax”), then Executive shall be entitled to receive an additional payment (a “Gross-Up Payment”) in an amount such that after payment by Executive of all taxes (including any interest or penalties imposed with respect to such taxes), including, without limitation, any income taxes (and any interest and penalties imposed with respect thereto) and Excise Tax imposed upon the Gross-Up Payment, and taking into account any withholding obligation on the part of the Company, Executive retains an amount of the Gross-Up Payment equal to the Excise Tax imposed upon the Payments.
(b) Subject to the provisions of Section 5(c), all determinations required to be made under this Section 5, including whether and when a Gross-Up Payment is required and the amount of such Gross-Up Payment and the assumptions to be used in arriving at such determination, shall be made by the Company’s regular independent accounting firm (the “Accounting Firm”) which shall provide detailed supporting calculations both to the Company and Executive within 15 business days of the receipt of notice from Executive that there has been a Payment, or such earlier time as is requested by the Company. All fees and expenses of the Accounting Firm shall be borne solely by the Company. Any Gross-Up Payment, as determined pursuant to this Section 5, shall be paid by the Company to Executive, net of any of the Company’s federal or state withholding obligations with respect to such Payment, within five days of the receipt of the Accounting Firm’s determination. Any determination by the Accounting Firm shall be binding upon the Company and Executive. As a result of the uncertainty in the application of Section 4999 of the Code at the time of the initial determination by the Accounting Firm hereunder, it is possible that Gross-Up Payments which will not have been made by the Company should have been made (each, an “Underpayment”), consistent with the calculations required to be made hereunder. In the event that the Company exhausts its remedies pursuant to Section 5(c) and Executive thereafter is required to make a payment of any Excise Tax, the Accounting Firm shall determine the amount of the Underpayment that has occurred and any such Underpayment shall be promptly paid by the Company to or for the benefit of Executive.
(c) Executive shall notify the Company in writing of any claim by the Internal Revenue Service that, if successful, would require the payment by the Company of a Gross-Up Payment (or an additional Gross-Up Payment). Such notification shall be given as soon as practicable but no later than 10 business days after Executive is informed in writing of such claim and shall apprise the Company of the nature of such claim and the date on which such claim is requested to be paid. Executive shall not pay such claim prior to the expiration of the 30-day period following the date on which it gives such notice to the Company (or such shorter period ending on the date that any payment of taxes with respect to such claim is due). If the Company notifies Executive in writing prior to the expiration of such period that it desires to contest such claim, Executive shall:
7
(i) give the Company any information reasonably requested by the Company relating to such claim,
(ii) take such action in connection with contesting such claim as the Company shall reasonably request in writing
from time to time, including, without limitation, accepting legal representation with respect to such claim by an attorney reasonably selected by the Company,
(iii) cooperate with the Company in good faith in order to effectively contest such claim, and
(iv) permit the Company to participate in any proceedings relating to such claim; provided, however, that the
Company shall bear and pay directly all costs and expenses (including additional interest and penalties) incurred in connection with such contest and shall
(d) If, after the receipt by Executive of an amount advanced by the Company pursuant to Section 5(c), Executive becomes entitled to receive any refund with respect to such claim, Executive shall (subject to the Company’s complying with the requirements of Section 5(c)) promptly pay (in no more than five business days) to the Company the amount of such refund (together with any interest paid or credited thereon after taxes applicable thereto). If, after the receipt by Executive of an amount advanced by the Company pursuant to Section 5(c), a determination is made that Executive shall not be entitled to any refund with respect to such claim and the Company does not notify Executive in writing of its intent to contest such denial of refund prior to the expiration of 30 days after such determination, then such advance shall be forgiven and shall not be required to be repaid and the amount of such advance shall offset, to the extent thereof, the amount of Gross-Up Payment required to be paid.
6. Non-Competition, Non-Solicitation, and Confidentiality; Certain Other Covenants. 6.1 Disclosure of Confidential Information. Executive acknowledges that the Company will provide Executive with
confidential and proprietary information regarding the business in which the Company or any of its current or future subsidiaries or affiliates (collectively, other than the Company, the “Company Affiliates”) are involved, and the Company and the Company Affiliates will provide Executive with trade secrets, as defined in Section 688.002(4) of the Florida Statutes, of the Company and the Company Affiliates (hereinafter all such confidential information and trade secrets referred to as the “Confidential Information”). For purposes of this Agreement, “Confidential Information” includes, but is not limited to:
(a) Information related to the business of the Company and the Company Affiliates, including but not limited to marketing strategies and plans, sales procedures, operating policies and procedures, pricing and pricing strategies, business and strategic plans, financial statements and projections, accounting and tax positions and procedures, and other business and financial information of the Company and the Company Affiliates;
8
indemnify and hold Executive harmless, on an after-tax basis, for any Excise Tax or income tax (including interest and penalties with respect thereto) imposed as a result of such representation and payment of costs and expenses. Without limitation of the foregoing provisions of this Section 5(c), the Company shall control all proceedings taken in connection with such contest (to the extent applicable to the Excise Tax and the Gross-Up Payment) and, at its sole option, may pursue or forgo any and all administrative appeals, proceedings, hearings and conferences with the taxing authority in respect of such claim and may, at its sole option, either direct Executive to pay the tax claimed and sue for a refund or contest the claim in any permissible manner, and Executive agrees to prosecute such contest to a determination before any administrative tribunal, in a court of initial jurisdiction and in one or more appellate courts, as the Company shall determine; provided, however, that if the Company directs Executive to pay such claim and sue for a refund, the Company shall advance the amount of such payment to Executive, on an interest-free basis and shall indemnify and hold Executive harmless, on an after-tax basis, from any Excise Tax or income tax (including interest or penalties with respect thereto) imposed with respect to such advance or with respect to any imputed income with respect to such advance; and further provided that any extension of the statute of limitations relating to payment of taxes for the taxable year of Executive with respect to which such contested amount is claimed to be due is limited solely to such contested amount. Furthermore, the Company’s control of the contest shall be limited to issues with respect to which a Gross-Up Payment would be payable hereunder and Executive shall be entitled to settle or contest, as the case may be, any other issue raised by the Internal Revenue Service or any other taxing authority.
(b) Information regarding the customers of the Company and the Company Affiliates which Executive acquired as a result of his employment with the Company, including but not limited to, customer contracts, customer lists, work performed for customers, customer contacts, customer requirements and needs, data used by the Company and the Company Affiliates to formulate customer proposals, customer financial information and other information regarding the customer’s business;
(c) Information regarding the vendors of the Company and the Company Affiliates which Executive acquired as a result of his employment with the Company, including but not limited to, product and service information and other information regarding the business activities of such vendors;
(d) Training materials developed by and utilized by the Company and the Company Affiliates;
(e) Any other information which Executive acquired as a result of his employment with the Company and which Executive has a reasonable basis to believe the Company or the Company Affiliates, as the case may be, would not want disclosed to a business competitor or to the general public; and
(f) Information which:
provided, however, that Confidential Information shall not include information which (x) at the time of receipt or thereafter becomes publicly known through no wrongful act of Executive, (y) is obtainable in the public domain, or (z) if Executive gives prior notice to the Company of any
9
(i) is proprietary to, about or created by the Company or the Company Affiliates;
(ii) gives the Company or any of the Company Affiliates some competitive advantage, the opportunity of obtaining
such advantage or the disclosure of which could be detrimental to the interests of the Company or the Company Affiliates;
(iii) is not typically disclosed to non-executives by the Company or otherwise is treated as confidential by the
Company or the Company Affiliates; or
(iv) is designated as Confidential Information by the Company or from all the relevant circumstances should
reasonably be assumed by Executive to be confidential to the Company or any Company Affiliates;
disclosure of information described in the following provisions of this clause (z), can be and is demonstrated by Executive as not having been developed by use of or reference to other Confidential Information and as not having been acquired or developed by Executive in connection with Executive’s employment or affiliation with the Company.
6.2 Covenant Not to Compete. While employed by the Company and, in the event of a termination of Executive’s employment (other than in the event of a Change of Control and subsequent termination by the Company without Cause or by Executive for Good Reason or a termination due to non-renewal of the Term by the Company at the first time on or after the Change of Control that the Term is up for renewal), for a period of one year thereafter, in consideration of the obligations of the Company hereunder, including without limitation its disclosure of Confidential Information to Executive, Executive shall not, directly or indirectly, for compensation or otherwise, engage in or have any interest in any sole proprietorship, partnership, corporation, company, association, business or any other person or entity (whether as an employee, officer, corporation, business or any creditor, consultant or otherwise) that, directly or indirectly, competes with the Company’s “Business” (as defined below) in any and all states in which the Company or any Company Affiliate conducts such business while Executive is employed by the Company or any Company Affiliate; provided, however, Executive may continue to hold securities of the Company or any Company Affiliate or continue to hold or acquire, solely as an investment, shares of capital stock or other equity securities of any company if (x) he currently holds an interest in such stock or other securities, and before the date hereof has disclosed to the Board in detail (I) the applicable company (or companies) and (II) the specific stock or other equity securities of the entity he owns, or (y) the stock or other securities are traded on any national securities exchange or are regularly quoted in the over-the-counter market, so long as Executive does not control, acquire a controlling interest in, or become a member of a group which exercises direct or indirect control of more than 5% of any class of capital stock of such corporation. For purposes of this Agreement, the Company’s “Business” is defined so as to consist of the development, acquisition, ownership, management, and sale of a diversified portfolio of high-quality, freestanding net-lease properties leased to retail, restaurant, convenience-store and similar businesses, and such other businesses conducted by the Company after the date hereof, and from time to time during the Term, that shall become material and substantial with respect to the Company’s then-overall business.
6.3 Non-Solicitation of Clients. While employed by the Company and, in the event of a termination of Executive’s employment (other than in the event of a Change of Control and subsequent termination by the Company without Cause or by Executive for Good Reason or a termination due to non-renewal of the Term by the Company at the first time on or after the Change of Control that the Term is up for renewal), for a period of one year thereafter, in consideration of the obligations of the Company hereunder, including without limitation its disclosure of Confidential Information to Executive, Executive shall not, directly or indirectly, for himself or as principal, agent, independent contractor, consultant, director, officer, member, or employee of any other person, firm, corporation, partnership, company, association, business or other entity, solicit, attempt to contract with, or enter into a contractual or business relationship of any kind pertaining to any aspect of the Company’s Business, or any other business conducted by the Company or any Company Affiliate at the time of termination of employment or at any time in the prior 12-month period, with any person or entity with which the Company or any Company Affiliate has any contractual or business relationship, or engaged in negotiations toward such a contract, in the previous 12 months, if such solicitation, attempt to contract with, or entering into a contractual or business relationship would have a material adverse effect on the Company’s operations, financial condition, prospects or relationship with such person or entity.
10
6.4 Non-Solicitation of Employees. While employed by the Company and, in the event of a termination of Executive’s employment (other than in the event of a Change of Control and subsequent termination by the Company without Cause or by Executive for Good Reason or a termination due to non-renewal of the Term by the Company at the first time on or after the Change of Control that the Term is up for renewal), for a period of one year thereafter, in consideration of the obligations of the Company hereunder, including without limitation its disclosure of Confidential Information to Executive, Executive shall not directly or indirectly, for himself or as principal, agent, independent contractor, consultant, director, officer, member, or employee of any other person, firm, corporation, partnership, company, association or other entity, either (i) hire, attempt to employ, contact with respect to hiring, solicit with respect to hiring or enter into any contractual arrangement with any employee or former employee of the Company or any Company Affiliate, or (ii) induce or otherwise advise or encourage any employee of the Company or any Company Affiliate to leave his or her employment; unless, in each such case, such employee or former employee has not been employed by the Company or a Company Affiliate for a period in excess of six months at the time of such solicitation, attempt to employ, contact, employment or inducement.
6.5 Confidentiality. While employed by the Company and after Executive’s employment terminates, in consideration of the obligations of the Company hereunder, including without limitation its disclosure of Confidential Information to Executive, Executive shall keep secret and retain in strictest confidence, shall not disclose to any third-party, and shall not use for his benefit or the benefit of others, except in connection with the business affairs of the Company, any Company Affiliate, or any of their officers or directors (collectively, the “Benefited Persons”), all confidential and proprietary information and trade secrets relating to the business of the Company or any of the other Benefited Persons (but not if expressly excluded from being Confidential Information under the proviso of Section 6.1(f)), including, without limitation, the Confidential Information, unless such disclosure is required by a valid subpoena or other legal mandate or otherwise by rule of law or other valid order of a court or government body or agency. In the event disclosure so is required, Executive shall provide the Company with written notice of same at least five business days prior to the date on which Executive is required to make the disclosure. Notwithstanding the foregoing, the express terms of this Section 6.5 shall not apply in the event of a Change of Control and subsequent termination by the Company without Cause or by Executive for Good Reason or a termination due to non-renewal of the Term by the Company at the first time on or after the Change of Control that the Term is up for renewal.
6.6 Tangible Items. All files, records, documents, manuals, books, forms, reports, memoranda, studies, data, calculations, recordings, or correspondence, whether visually perceptible, machine-readable or otherwise, in whatever form they may exist, and all copies, abstracts and summaries of the foregoing, and all physical items related to the business of the Company, whether of a public nature or not, and whether prepared by Executive or not, are and shall remain the exclusive property of the Company , and shall not be removed from its premises, except as required in the course of Executive’s employment by the Company, without the prior written consent of the Company. Such items, including any copies or other reproductions thereof, shall be promptly returned by Executive to the Company at any time upon the written request of the Company. Notwithstanding the foregoing, the express terms of this Section 6.6 shall not apply in the event of a Change of Control and subsequent termination by the Company without Cause or by Executive for Good Reason or a termination due to non-renewal of the Term by the Company at the first time on or after the Change of Control that the Term is up for renewal.
11
6.7 Remedies. (a) The Company and Executive acknowledge and agree that a breach by Executive of any of the covenants contained in
this Section 6 will cause immediate and irreparable harm and damage to the Company and any other Benefited Person, and that monetary damages will be inadequate to compensate the Company, and any other Benefited Person, as the case may be, for such breach. Accordingly, Executive acknowledges that the Company and any other Benefited Person affected shall, in addition to any other remedies available to it at law or in equity, be entitled to an injunction from any court of competent jurisdiction enjoining and restraining any violation of said covenants by Executive or any of his affiliates, associates, partners or agents, either directly or indirectly, without the necessity of proving the inadequacy of legal remedies or irreparable harm.
(b) Except with regard to Section 6.7(a), all disputes between the parties or any claims concerning the performance, breach, construction or interpretation of this Agreement, or in any manner arising out of this Agreement, shall be submitted to binding arbitration in accordance with the Commercial Arbitration Rules, as amended from time to time, of the American Arbitration Association (the “AAA”), which arbitration shall be carried out in the manner set forth below:
6.8 Change of Control. For the purposes of this Agreement, “Change of Control” shall be a change of control under the applicable definition contained in Section 2.4 of the Company’s 2000 Performance Incentive Plan, or successor thereto of comparable import; provided, however, that
12
(i) Within 15 days after written notice by one party to the other party of its demand for arbitration, which demand shall set forth the name and address of its designated arbitrator, the other party shall appoint its designated arbitrator and so notify the demanding party. Within 15 days thereafter, the two arbitrators so appointed shall appoint the third arbitrator. If the two appointed arbitrators cannot agree on the third arbitrator, then the AAA shall appoint an independent arbitrator as the third arbitrator. The dispute shall be heard by the arbitrators within 90 days after appointment of the third arbitrator. The decision of any two or all three of the arbitrators shall be binding upon the parties without any right of appeal. The decision of the arbitrators shall be final and binding upon the Company, its successors and assigns, and upon Executive, his heirs, personal representatives, and legal representatives.
(ii) The arbitration proceedings shall take place in Orlando, Florida, and the judgment and determination of such
proceedings shall be binding on all parties. Judgment upon any award rendered by the arbitrators may be entered into any court having competent jurisdiction without any right of appeal.
(iii) Each party shall pay its or his own expenses of arbitration, and the expenses of the arbitrators and the arbitration proceeding shall be shared equally. However, if in the opinion of a majority of the arbitrators, any claim or defense was unreasonable, the arbitrators may assess, as part of their award, all or any part of the arbitration expenses of the other party (including reasonable attorneys’ fees) and of the arbitrators and the arbitration proceeding.
in no event shall a Change of Control for purposes of this Agreement be deemed to have arisen merely by virtue of a “person” or “group” (which terms shall have the meaning they have when used in Section 13(d) of the Securities Exchange Act of 1934, as amended) having become a direct or indirect owner of Company securities (such that a Change of Control would, without regard to this proviso, otherwise have been deemed to have occurred), if Executive is or is a member of such person or group.
7. Severability. As the provisions of this Agreement are independent of and severable from each other, the Company and Executive agree that if, in any action before any court or agency legally empowered to enforce this Agreement, any term, restriction, covenant, or promise hereof is found to be unreasonable or otherwise unenforceable, then such decision shall not effect the validity of the other provisions of this Agreement, and such invalid term, restriction, covenant, or promise shall also be deemed modified to the extent necessary to make it enforceable.
8. Notice. For purposes of this Agreement, notices, demands and all other communications provided for in the Agreement shall be in writing and shall be deemed to have been duly given when received if delivered in person, the next business day if delivered by overnight commercial courier (e.g., Federal Express), or the third business day if mailed by United States certified mail, return receipt requested, postage prepaid, to the following addresses:
(a) If to the Company, to: National Retail Properties, Inc. 450 South Orange Avenue, Suite 900 Orlando, Florida 32801 Attn: Chairman of the Compensation Committee of the Board of Directors
with a copy to: National Retail Properties, Inc. 450 South Orange Avenue, Suite 900 Orlando, Florida 32801 Attention: General Counsel
and Pillsbury Winthrop Shaw Pittman LLP 2300 N Street, N.W. Washington, DC 20037 Attn: Jeffrey B. Grill, Esq.
(b) If to Executive, to: Paul E. Bayer at the address set forth on the signature page hereof
Either party may change its address for notices in accordance with this Section 8 by providing written notice of such change to the other party.
13
9. Governing Law. This Agreement shall be governed by and construed in accordance with the laws of the State of Florida.
10. Benefits; Binding Effect; Assignment. This Agreement shall be binding upon and inure to the benefit of the parties and their respective heirs, personal representatives, legal representatives, successors and permitted assigns. Executive shall not assign this Agreement. However, the Company is expressly authorized to assign this Agreement to a Company Affiliate upon written notice to Executive, provided that (i) the assignee assumes all of the obligations of the Company under this Agreement, (ii) Executive’s role when viewed from the perspective of Company Affiliates in the aggregate is comparable to such role immediately before the assignment, and (iii) the Company, for so long as an affiliate of the assignee, remains secondarily liable for the financial obligations hereunder.
11. Attorney’s Fees. The Company agrees to reimburse Executive for his reasonable legal fees incurred in reviewing this Agreement. In the event of any legal proceeding relating to this Agreement or any term or provision thereof, the losing party shall be responsible to pay or reimburse the prevailing party for all reasonable attorneys’ fees incurred by the prevailing party in connection with such proceeding, except that, in the event of an arbitration, the provisions of Section 6.7(b)(iii) shall apply.
12. Entire Agreement Amendment. This Agreement, including its incorporated Attachment “A,” constitutes the entire agreement between the parties, and all prior understandings, agreements or undertakings between the parties concerning Executive’s employment or the other subject matters of this Agreement (including without limitation the Existing Employment Agreement) are superseded in their entirety by this Agreement.
13. Waivers and Amendments. This Agreement may be amended, superseded, canceled, renewed or extended, and the terms hereof may be waived, only by a written instrument signed by the parties or, in the case of a waiver, by the party waiving compliance. No delay on the part of any party in exercising any right, power or privilege hereunder shall operate as a waiver thereof, nor shall any waiver on the part of any party of any such right, power or privilege nor any single or partial exercise of any such right, power or privilege, preclude any other or further exercise thereof or the exercise of any other such right, power or privilege.
14. No Duty to Mitigate. Executive shall not be required to mitigate damages or the amount of any payment provided for under this Agreement by seeking other employment or otherwise, nor will any payments hereunder be subject to offset in the event Executive does mitigate (except as otherwise provided in clause (i)(G) of the second sentence of Section 4.3(b) or clause (i)(E) of Section 4.4).
15. Counterparts. This Agreement may be executed in counterparts, each of which will be deemed an original, but which together shall be one and the same instrument.
16. Tax Advice. Executive confirms and represents to the Company that he has had the opportunity to obtain the advice of legal counsel, financial and tax advisers, and such other professionals as he deems necessary for entering into this Agreement, and he has not relied upon the advice of the Company or the Company’s officers, directors, or employees.
17. Interpretation. As both parties having had the opportunity to consult with legal counsel, no provision of this Agreement shall be construed against or interpreted to the disadvantage of any party by reason of such party having, or being deemed to have, drafted, devised, or imposed such provision.
14

IN WITNESS WHEREOF, the parties hereto have signed their names as of the day and year first above written.
15
NATIONAL RETAIL PROPERTIES, INC.
By: /s/ Craig Macnab Name: Craig MacnabTitle: Chief Executive Officer
/s/ Paul E. BayerPaul E. Bayer

ATTACHMENT “A”
Additional Fringe Benefits
16
• $500/month car allowance • Long-term disability coverage providing benefits equal to two-thirds of Annual Salary
• Life insurance benefits with a face amount equal to Annual Salary (provided that, if at any time the Company cannot obtain such insurance at rates which are reasonable for the provision by the Company of such a benefit, the Company may then self-insure such benefits)
EXHIBIT 10.9
EMPLOYMENT AGREEMENT
THIS EMPLOYMENT AGREEMENT (the “Agreement”) dated as of January 2, 2007, by and between National Retail Properties, Inc., with its principal place of business at 450 South Orange Avenue, Suite 900, Orlando, Florida 32801 (the “Company”), and Christopher P. Tessitore, residing at the address set forth on the signature page hereof (“Executive”).
WHEREAS, the Company desires to continue to employ Executive, and Executive desires to continue to be employed by the Company; and
WHEREAS, the Company and Executive desire to enter into an Employment Agreement, which sets forth the terms and conditions of Executive’s continuing employment by the Company.
Accordingly, the parties hereto agree as follows: 1. Term. The Company hereby employs Executive, and Executive hereby accepts such employment, for a term (as the same may
be extended, the “Term”) commencing as of the date hereof and continuing for a two-year period, unless terminated earlier in accordance with the provisions of Section 4. On the second anniversary of the date hereof, the Term shall automatically be extended for successive two-year periods in accordance with the terms of this Agreement (subject to termination as aforesaid) unless either party notifies the other party of non-renewal in writing, in accordance with Section 8, 180 days prior to the expiration of the initial two-year period or any subsequent renewal period.
2. Duties. During the Term, Executive shall be employed by the Company as Executive Vice President and General Counsel of the Company, and, as such, Executive shall faithfully perform for the Company the duties of said office and shall perform such other duties of an executive, managerial or administrative nature as shall be specified and designated from time to time by the Board of Directors of the Company (the “Board”) or the Chief Executive Officer of the Company, which duties shall not be materially inconsistent with the duties performed by executives holding similar offices with real estate investment trusts. Executive shall devote substantially all of his business time and effort to the performance of his duties hereunder, except that Executive may devote reasonable time and attention to civic, charitable, business or social activities so long as such activities do not interfere with Executive’s employment duties. Executive shall comply with the policies, standards, and regulations established from time to time by the Company.
3. Compensation.
3.1 Salary. For purposes of this Agreement, a “Contract Year” shall mean each calendar year during the Term. During the first Contract Year of the Term, the Company shall pay Executive a base salary at the rate of $170,000 per annum, in accordance with the customary payroll practices of the Company applicable to senior executives, but not less frequently than monthly. The Compensation Committee of the Board shall review Executive’s base salary each Contract Year during the Term and may increase such amount as it may deem advisable (such salary, as the same may be increased, the “Annual Salary”).
3.2 Bonus and Incentive Compensation. Executive will be entitled to participate in the Company’s Annual Bonus Program (the “Bonus Plan”) as follows:
(a) Annual Bonus Compensation. Executive shall be eligible to receive a bonus each Contract Year (“Annual Bonus”) as the Compensation Committee of the Board of Directors shall determine. Executive’s Annual Bonus shall be determined in accordance with the Company’s executive compensation policies as in effect from time to time during the Term and shall be based, in part, on his achieving his individual performance goals for the year and, in part, on the Company’s achieving its performance goals for the year.
(b) Equity Incentive Awards. Executive shall be eligible to participate each Contract Year in the Company’s equity incentive plans pursuant to the Company’s 2000 Performance Incentive Plan or such other plans or programs as the Compensation Committee shall determine.
3.3 Benefits - In General. Except with respect to benefits of a type otherwise provided for under Section 3.4, Executive shall be permitted during the Term to participate in any group life, hospitalization or disability insurance plans, health programs, retirement plans, fringe benefit programs and similar benefits that may be available to other senior executives of the Company generally, on the same terms as such other executives, in each case to the extent that Executive is eligible under the terms of such plans or programs.
3.4 Specific Benefits. Without limiting the generality of Section 3.3, the Company shall make available to Executive the fringe benefits set forth on Attachment “A” to this Agreement. Executive shall be entitled to 20 days of paid time off (“PTO”) per Contract Year. Unless otherwise required by law, no more than 10 days of unused PTO may be carried forward (on a “first-in, first-out” basis) to the immediately following year (but not thereafter).
3.5 Expenses. The Company shall pay or reimburse Executive for all ordinary and reasonable out-of-pocket expenses incurred by Executive during the Term in the performance of Executive’s services under this Agreement; provided that such expenses are incurred and accounted for by Executive in accordance with the policies and procedures established from time to time by the Company.
4. Termination of Employment.
4.1 Termination upon Death or Disability. If Executive dies during the Term, the obligations of the Company to or with respect to Executive shall terminate in their entirety except as otherwise provided under this Section 4.1. If Executive becomes eligible for disability benefits under the Company’s long-term disability plans and arrangements (or, if none, if Executive by virtue of ill health or other disability is unable to perform substantially and continuously the duties assigned to him for at least 120 consecutive or non-consecutive days out of any consecutive 12-month period), the Company shall have the right, to the extent permitted by law, to terminate the employment of Executive upon notice in writing to Executive; provided that the Company will have no right to terminate Executive’s employment if, in the reasonable opinion of a qualified physician acceptable to the Company, it is substantially certain that Executive will be able to resume Executive’s duties on a regular full-time basis within 30 days of the date Executive receives notice of such termination. Upon death or other termination of employment by virtue of disability in accordance with this Section 4.1, Executive (or Executive’s estate or beneficiaries in the case of the death of Executive) shall have no right to receive any compensation or benefit hereunder on and after the effective date of the termination of employment other than (i) Annual Salary and other benefits earned and accrued under this Agreement prior to the date of termination (and reimbursement under this Agreement for expenses incurred prior to the date of termination); (ii) a cash payment equal to the prorated portion of the Annual Bonus at the “target” level for the Contract Year or partial Contract Year in which
2
Executive’s employment hereunder terminates; (iii) elimination of any exclusively time-based vesting conditions on any restricted stock, stock option or other equity awards in the Company he had been granted which he then continues to hold, to the extent then unvested (it being expressly understood and agreed that any performance-based vesting conditions (whether or not in tandem with such time-based vesting conditions) will continue in effect in accordance with their terms, except as may otherwise be provided to the contrary in the applicable award agreements); (iv) in the event of Executive’s death, (A) a cash payment equal to two months of Executive’s Annual Salary payable no later than 10 days after such termination, and (B) continuation to Executive’s spouse and dependents of fully paid health insurance benefits under the Company’s health plans and programs applicable to senior executives of the Company generally (if and as in effect from time to time) during the one year following the date of termination; and (v) Executive (or, in the case of his death, his estate and beneficiaries) shall have no further rights to any other compensation or benefits hereunder on or after the termination of employment, or any other rights hereunder.
4.2 Termination by the Company for Cause; Termination by Executive without Good Reason. (a) For purposes of this Agreement, “Cause” shall mean Executive’s:
provided, that the Company shall not be permitted to terminate Executive for Cause except on written notice given to Executive at any time following the occurrence of any of the events described in clause (i), (ii), (iii) or (iv) above. Notwithstanding the foregoing, Executive shall not be deemed to have been terminated for Cause under clause (ii) or (iv) above unless the Company provided written notice to Executive setting forth in reasonable detail the reasons for the Company’s intention to terminate for Cause, Executive has been provided the opportunity, together with counsel, not later than 14 days following such notice to be heard before the Board and Executive failed within 30 days (or, if later, five business days after such hearing) to cure the event or deficiency set forth in the written notice.
(b) The Company may terminate Executive’s employment hereunder for Cause, and Executive may terminate his employment at any time upon 60 days prior written notice to the Company. If the Company terminates Executive for Cause, or Executive terminates his employment and the termination by Executive is not covered by Section 4.3, (i) Executive shall receive Annual
3
(i) conviction of (or pleading nolo contendere to), or an indictment or information is filed against Executive and is not discharged or otherwise resolved within 12 months thereafter, and said indictment or information charged Executive with a felony, any crime of moral turpitude, or any crime which is likely to result in material injury to the Company;
(ii) the continued failure by Executive substantially to perform his duties or to carry out the lawful directives of the
Board of Directors;
(iii) material breach of a fiduciary duty relating to Executive’s employment with the Company, or otherwise
engaging in gross misconduct or willful or gross neglect (in connection with the performance of his duties) which is materially injurious to the Company; or
(iv) material breach of any of Section 6 or any other provisions of this Agreement
Salary and other benefits (but, in all events, and without increasing Executive’s rights under any other provision hereof, excluding any Annual Bonus not yet paid) earned and accrued under this Agreement prior to the termination of employment (and reimbursement under this Agreement for expenses incurred prior to the termination of employment), and (ii) Executive shall have no further rights to any other compensation or benefits hereunder on or after the termination of employment, or any other rights hereunder.
4.3 Termination by the Company without Cause; Termination by Executive for Good Reason. (a) For purposes of this Agreement, “Good Reason” shall mean, unless otherwise consented to by Executive:
Notwithstanding the foregoing, Good Reason under clause (i), (ii), (iii) or (iv) above shall not be deemed to exist unless notice of termination on account thereof (specifying a termination date no later than 15 days from the date of such notice) is given by Executive to the Company no later than 30 days after the time at which Executive first becomes or should have become aware of the event or condition purportedly giving rise to Good Reason; and, in such event, the Company shall have 30 days from the date notice of such a termination is given to cure such event or condition and, if the Company does so, such event or condition shall not constitute Good Reason hereunder.
(b) The Company may terminate Executive’s employment at any time for any reason or no reason upon 30 days’ prior written notice to Executive and Executive may terminate Executive’s employment with the Company for Good Reason. If the Company terminates Executive’s employment and the termination is not covered by Sections 4.1, 4.2 or 4.4 or Executive terminates his employment for Good Reason:
4
(i) a material reduction in Executive’s position, authority, duties or responsibilities;
(ii) a reduction in Annual Salary of Executive;
(iii) the relocation of Executive’s office to more than 50 miles from the Company’s principal place of business in
Orlando, Florida;
(iv) the Company’s material breach of this Agreement; or
(v) the Company’s failure to obtain an agreement from any successor to the business of the Company by which the
successor assumes and agrees to perform this Agreement.
(i) Executive shall (subject, in the case of the following clauses (C), (D), (E) and (H), to Executive’s delivery of a
general release reasonably acceptable to the Company which shall have become irrevocable) be entitled to:
(A) any accrued but unpaid Annual Salary and PTO due to Executive as of the termination of employment;
(B) reimbursement under this Agreement for expenses incurred but unpaid prior to the termination of
employment;
5
(C) a cash payment equal to 200% of Executive’s Annual Salary, payable in equal installments over a 12–month period in accordance with the Company’s usual and customary payroll practices, commencing on the first payday following Executive’s termination; provided, however, that, in the event of such a termination upon or after a Change of Control, such payment shall be paid to Executive in a single sum no later than 10 days following delivery of the release referenced above and the release having become irrevocable; and provided, further, that no payments shall be made less than six months after termination to the extent required to comply with Section 409A of the Code (in which case any payments deferred under this provision shall be paid upon the six-month anniversary of termination);
(D) a cash payment equal to 200% of Executive’s average Annual Bonus for the three Contract Years immediately preceding the date of termination, payable in equal installments over a 12-month period in accordance with the Company’s usual and customary payroll practices, commencing on the first payday following Executive’s termination; provided, however, that, in the event of such a termination upon or after a Change of Control, such payment shall be paid to Executive in a single sum no later than 10 days following delivery of the release referenced above and the release’s having become irrevocable; and provided, further, that no payments shall be made less than six months after termination to the extent required to comply with Section 409A of the Code (in which case any payments deferred under this provision shall be paid upon the six-month anniversary of termination);
(E) any payment due under Section 5 hereof;
(F) vesting of any restricted stock, stock options or other equity awards in the Company Executive had been
granted which Executive then continues to hold, to the extent then unvested;
(G) for a period of one year after termination, such health benefits under the Company’s health plans and programs applicable to senior executives of the Company generally (if and as in effect from time to time) as Executive would have received under this Agreement (and at such costs to Executive as would have applied in the absence of such termination); provided, however, that the Company shall in no event be required to provide any benefits otherwise required by this clause (G) after such time as Executive becomes entitled to receive benefits of the same type from another employer or recipient of Executive’s services (such entitlement being determined without regard to any individual waivers or other similar arrangements); and
provided that the amounts referred to in clauses (A), (B), (E) and (H) shall be paid to Executive in a single sum no later than 10 days following delivery of the release referenced above, except to the extent that a six-month delay is necessary to avoid tax under Section 409A of the Code; and
4.4 Natural Termination. In the event that Executive’s employment by the Company pursuant to this Agreement terminates at the scheduled expiration of the Term because of a non-renewal of the Term as a result of a decision by the Company not to renew as contemplated by and in accordance with the last sentence of Section 1 (and not theretofore under Section 4.1, 4.2 or 4.3),
6
(H) in the event of such a termination upon or after a Change of Control, a prorated Annual Bonus at the
“target” level for the Contract Year or partial Contract Year in which Executive’s employment hereunder terminates;
(ii) Executive shall have no further rights to any other compensation or benefits hereunder on or after the
termination of employment, or any other rights hereunder.
(i) Executive shall (subject, in the case of the following clauses (C), (D) and (F), to Executive’s delivery of a
general release reasonably acceptable to the Company which shall have become irrevocable) be entitled to:
(A) any accrued but unpaid Annual Salary and PTO due to Executive as of the termination of employment;
(B) reimbursement under this Agreement for expenses incurred but unpaid prior to the termination of
employment;
(C) a cash payment equal to 200% of Executive’s Annual Salary in the case of expiration of the initial Term, or 100% of Executive’s Annual Salary in the case of expiration of a renewal of the Term, payable in equal installments over a 12–month period in accordance with the Company’s usual and customary payroll practices, commencing on the first payday following termination of this Agreement; provided, however, that no payments shall be made less than six months after termination to the extent required to comply with Section 409A of the Code (in which case any payments deferred under this provision shall be paid upon the six-month anniversary of termination);
(D) any payment due under Section 5 hereof;
(E) for a period of one year after termination, such health benefits under the Company’s health plans and
programs
provided that the amounts referred to in clauses (A), (B), (D) and (F) shall be paid to Executive in a single sum no later than 10 days following delivery of the release referenced above, except to the extent that a six-month delay is necessary to avoid tax under Section 409A of the Code; and
5. Certain Additional Payments by the Company. (a) Anything in this Agreement to the contrary notwithstanding and except as set forth below, in the event it shall be
determined that any payment or distribution by the Company to or for the benefit of Executive (whether paid or payable or distributed or distributable pursuant to the terms of this Agreement or otherwise, but determined without regard to any additional payments required under this Section 5) (a “Payment”) would be subject to the excise tax imposed by Section 4999 of the Code or any interest or penalties are incurred by Executive with respect to such excise tax (such excise tax, together with any such interest and penalties, are hereinafter collectively referred to as the “Excise Tax”), then Executive shall be entitled to receive an additional payment (a “Gross-Up Payment”) in an amount such that after payment by Executive of all taxes (including any interest or penalties imposed with respect to such taxes), including, without limitation, any income taxes (and any interest and penalties imposed with respect thereto) and Excise Tax imposed upon the Gross-Up Payment, and taking into account any withholding obligation on the part of the Company, Executive retains an amount of the Gross-Up Payment equal to the Excise Tax imposed upon the Payments.
7
applicable to senior executives of the Company generally (if and as in effect from time to time) as Executive would have received under this Agreement (and at such costs to Executive as would have applied in the absence of such termination upon expiration); provided, however, that the Company shall in no event be required to provide any benefits otherwise required by this clause (E) after such time as Executive becomes entitled to receive benefits of the same type from another employer or recipient of Executive’s services (such entitlement being determined without regard to any individual waivers or other similar arrangements);
(F) a prorated Annual Bonus at the “target” level for the Contract Year or partial Contract Year in which
Executive’s employment hereunder terminates; and
(G) only in the case of expiration of the initial Term, elimination of any exclusively time-based vesting conditions on any restricted stock, stock option or other equity awards in the Company Executive had been granted which Executive then continues to hold, to the extent then unvested (it being expressly understood and agreed that any performance-based vesting conditions (whether or not in tandem with such time-based vesting conditions) will continue in effect in accordance with their terms, except as may otherwise be provided to the contrary in the applicable award agreements);
(ii) Executive shall have no further rights to any other compensation or benefits hereunder on or after the
termination of employment, or any other rights hereunder.
(b) Subject to the provisions of Section 5(c), all determinations required to be made under this Section 5, including whether and when a Gross-Up Payment is required and the amount of such Gross-Up Payment and the assumptions to be used in arriving at such determination, shall be made by the Company’s regular independent accounting firm (the “Accounting Firm”) which shall provide detailed supporting calculations both to the Company and Executive within 15 business days of the receipt of notice from Executive that there has been a Payment, or such earlier time as is requested by the Company. All fees and expenses of the Accounting Firm shall be borne solely by the Company. Any Gross-Up Payment, as determined pursuant to this Section 5, shall be paid by the Company to Executive, net of any of the Company’s federal or state withholding obligations with respect to such Payment, within five days of the receipt of the Accounting Firm’s determination. Any determination by the Accounting Firm shall be binding upon the Company and Executive. As a result of the uncertainty in the application of Section 4999 of the Code at the time of the initial determination by the Accounting Firm hereunder, it is possible that Gross-Up Payments which will not have been made by the Company should have been made (each, an “Underpayment”), consistent with the calculations required to be made hereunder. In the event that the Company exhausts its remedies pursuant to Section 5(c) and Executive thereafter is required to make a payment of any Excise Tax, the Accounting Firm shall determine the amount of the Underpayment that has occurred and any such Underpayment shall be promptly paid by the Company to or for the benefit of Executive.
(c) Executive shall notify the Company in writing of any claim by the Internal Revenue Service that, if successful, would require the payment by the Company of a Gross-Up Payment (or an additional Gross-Up Payment). Such notification shall be given as soon as practicable but no later than 10 business days after Executive is informed in writing of such claim and shall apprise the Company of the nature of such claim and the date on which such claim is requested to be paid. Executive shall not pay such claim prior to the expiration of the 30-day period following the date on which it gives such notice to the Company (or such shorter period ending on the date that any payment of taxes with respect to such claim is due). If the Company notifies Executive in writing prior to the expiration of such period that it desires to contest such claim, Executive shall:
8
(i) give the Company any information reasonably requested by the Company relating to such claim,
(ii) take such action in connection with contesting such claim as the Company shall reasonably request in writing
from time to time, including, without limitation, accepting legal representation with respect to such claim by an attorney reasonably selected by the Company,
(iii) cooperate with the Company in good faith in order to effectively contest such claim, and
(iv) permit the Company to participate in any proceedings relating to such claim; provided, however, that the Company shall bear and pay directly all costs and expenses (including additional interest and penalties) incurred in connection with such contest and shall indemnify and hold Executive harmless, on an after-tax basis, for any Excise Tax or income tax (including interest and penalties with
(d) If, after the receipt by Executive of an amount advanced by the Company pursuant to Section 5(c), Executive becomes entitled to receive any refund with respect to such claim, Executive shall (subject to the Company’s complying with the requirements of Section 5(c)) promptly pay (in no more than five business days) to the Company the amount of such refund (together with any interest paid or credited thereon after taxes applicable thereto). If, after the receipt by Executive of an amount advanced by the Company pursuant to Section 5(c), a determination is made that Executive shall not be entitled to any refund with respect to such claim and the Company does not notify Executive in writing of its intent to contest such denial of refund prior to the expiration of 30 days after such determination, then such advance shall be forgiven and shall not be required to be repaid and the amount of such advance shall offset, to the extent thereof, the amount of Gross-Up Payment required to be paid.
6. Non-Competition, Non-Solicitation, and Confidentiality; Certain Other Covenants. 6.1 Disclosure of Confidential Information. Executive acknowledges that the Company will provide Executive with
confidential and proprietary information regarding the business in which the Company or any of its current or future subsidiaries or affiliates (collectively, other than the Company, the “Company Affiliates”) are involved, and the Company and the Company Affiliates will provide Executive with trade secrets, as defined in Section 688.002(4) of the Florida Statutes, of the Company and the Company Affiliates (hereinafter all such confidential information and trade secrets referred to as the “Confidential Information”). For purposes of this Agreement, “Confidential Information” includes, but is not limited to:
(a) Information related to the business of the Company and the Company Affiliates, including but not limited to marketing strategies and plans, sales procedures, operating policies and procedures, pricing and pricing strategies, business and strategic plans, financial statements and projections, accounting and tax positions and procedures, and other business and financial information of the Company and the Company Affiliates;
9
respect thereto) imposed as a result of such representation and payment of costs and expenses. Without limitation of the foregoing provisions of this Section 5(c), the Company shall control all proceedings taken in connection with such contest (to the extent applicable to the Excise Tax and the Gross-Up Payment) and, at its sole option, may pursue or forgo any and all administrative appeals, proceedings, hearings and conferences with the taxing authority in respect of such claim and may, at its sole option, either direct Executive to pay the tax claimed and sue for a refund or contest the claim in any permissible manner, and Executive agrees to prosecute such contest to a determination before any administrative tribunal, in a court of initial jurisdiction and in one or more appellate courts, as the Company shall determine; provided, however, that if the Company directs Executive to pay such claim and sue for a refund, the Company shall advance the amount of such payment to Executive, on an interest-free basis and shall indemnify and hold Executive harmless, on an after-tax basis, from any Excise Tax or income tax (including interest or penalties with respect thereto) imposed with respect to such advance or with respect to any imputed income with respect to such advance; and further provided that any extension of the statute of limitations relating to payment of taxes for the taxable year of Executive with respect to which such contested amount is claimed to be due is limited solely to such contested amount. Furthermore, the Company’s control of the contest shall be limited to issues with respect to which a Gross-Up Payment would be payable hereunder and Executive shall be entitled to settle or contest, as the case may be, any other issue raised by the Internal Revenue Service or any other taxing authority.
(b) Information regarding the customers of the Company and the Company Affiliates which Executive acquired as a result of his employment with the Company, including but not limited to, customer contracts, customer lists, work performed for customers, customer contacts, customer requirements and needs, data used by the Company and the Company Affiliates to formulate customer proposals, customer financial information and other information regarding the customer’s business;
(c) Information regarding the vendors of the Company and the Company Affiliates which Executive acquired as a result of his employment with the Company, including but not limited to, product and service information and other information regarding the business activities of such vendors;
(d) Training materials developed by and utilized by the Company and the Company Affiliates;
(e) Any other information which Executive acquired as a result of his employment with the Company and which Executive has a reasonable basis to believe the Company or the Company Affiliates, as the case may be, would not want disclosed to a business competitor or to the general public; and
(f) Information which:
provided, however, that Confidential Information shall not include information which (x) at the time of receipt or thereafter becomes publicly known through no wrongful act of Executive, (y) is obtainable in the public domain, or (z) if Executive gives prior notice to the Company of any disclosure of information described in the following provisions of this clause (z), can be and is demonstrated by Executive as not having been developed by use of or reference to other Confidential Information and as not having been acquired or developed by Executive in connection with Executive’s employment or affiliation with the Company.
10
(i) is proprietary to, about or created by the Company or the Company Affiliates;
(ii) gives the Company or any of the Company Affiliates some competitive advantage, the opportunity of obtaining
such advantage or the disclosure of which could be detrimental to the interests of the Company or the Company Affiliates;
(iii) is not typically disclosed to non-executives by the Company or otherwise is treated as confidential by the
Company or the Company Affiliates; or
(iv) is designated as Confidential Information by the Company or from all the relevant circumstances should
reasonably be assumed by Executive to be confidential to the Company or any Company Affiliates;
6.2 Covenant Not to Compete. While employed by the Company and, in the event of a termination of Executive’s employment (other than in the event of a Change of Control and subsequent termination by the Company without Cause or by Executive for Good Reason or a termination due to non-renewal of the Term by the Company at the first time on or after the Change of Control that the Term is up for renewal), for a period of one year thereafter, in consideration of the obligations of the Company hereunder, including without limitation its disclosure of Confidential Information to Executive, Executive shall not, directly or indirectly, for compensation or otherwise, engage in or have any interest in any sole proprietorship, partnership, corporation, company, association, business or any other person or entity (whether as an employee, officer, corporation, business or any creditor, consultant or otherwise) that, directly or indirectly, competes with the Company’s “Business” (as defined below) in any and all states in which the Company or any Company Affiliate conducts such business while Executive is employed by the Company or any Company Affiliate; provided, however, Executive may continue to hold securities of the Company or any Company Affiliate or continue to hold or acquire, solely as an investment, shares of capital stock or other equity securities of any company if (x) he currently holds an interest in such stock or other securities, and before the date hereof has disclosed to the Board in detail (I) the applicable company (or companies) and (II) the specific stock or other equity securities of the entity he owns, or (y) the stock or other securities are traded on any national securities exchange or are regularly quoted in the over-the-counter market, so long as Executive does not control, acquire a controlling interest in, or become a member of a group which exercises direct or indirect control of more than 5% of any class of capital stock of such corporation. For purposes of this Agreement, the Company’s “Business” is defined so as to consist of the development, acquisition, ownership, management, and sale of a diversified portfolio of high-quality, freestanding net-lease properties leased to retail, restaurant, convenience-store and similar businesses, and such other businesses conducted by the Company after the date hereof, and from time to time during the Term, that shall become material and substantial with respect to the Company’s then-overall business.
6.3 Non-Solicitation of Clients. While employed by the Company and, in the event of a termination of Executive’s employment (other than in the event of a Change of Control and subsequent termination by the Company without Cause or by Executive for Good Reason or a termination due to non-renewal of the Term by the Company at the first time on or after the Change of Control that the Term is up for renewal), for a period of one year thereafter, in consideration of the obligations of the Company hereunder, including without limitation its disclosure of Confidential Information to Executive, Executive shall not, directly or indirectly, for himself or as principal, agent, independent contractor, consultant, director, officer, member, or employee of any other person, firm, corporation, partnership, company, association, business or other entity, solicit, attempt to contract with, or enter into a contractual or business relationship of any kind pertaining to any aspect of the Company’s Business, or any other business conducted by the Company or any Company Affiliate at the time of termination of employment or at any time in the prior 12-month period, with any person or entity with which the Company or any Company Affiliate has any contractual or business relationship, or engaged in negotiations toward such a contract, in the previous 12 months, if such solicitation, attempt to contract with, or entering into a contractual or business relationship would have a material adverse effect on the Company’s operations, financial condition, prospects or relationship with such person or entity.
6.4 Non-Solicitation of Employees. While employed by the Company and, in the event of a termination of Executive’s employment (other than in the event of a Change of Control and subsequent termination by the Company without Cause or by Executive for Good Reason or a
11
termination due to non-renewal of the Term by the Company at the first time on or after the Change of Control that the Term is up for renewal), for a period of one year thereafter, in consideration of the obligations of the Company hereunder, including without limitation its disclosure of Confidential Information to Executive, Executive shall not directly or indirectly, for himself or as principal, agent, independent contractor, consultant, director, officer, member, or employee of any other person, firm, corporation, partnership, company, association or other entity, either (i) hire, attempt to employ, contact with respect to hiring, solicit with respect to hiring or enter into any contractual arrangement with any employee or former employee of the Company or any Company Affiliate, or (ii) induce or otherwise advise or encourage any employee of the Company or any Company Affiliate to leave his or her employment; unless, in each such case, such employee or former employee has not been employed by the Company or a Company Affiliate for a period in excess of six months at the time of such solicitation, attempt to employ, contact, employment or inducement.
6.5 Confidentiality. While employed by the Company and after Executive’s employment terminates, in consideration of the obligations of the Company hereunder, including without limitation its disclosure of Confidential Information to Executive, Executive shall keep secret and retain in strictest confidence, shall not disclose to any third-party, and shall not use for his benefit or the benefit of others, except in connection with the business affairs of the Company, any Company Affiliate, or any of their officers or directors (collectively, the “Benefited Persons”), all confidential and proprietary information and trade secrets relating to the business of the Company or any of the other Benefited Persons (but not if expressly excluded from being Confidential Information under the proviso of Section 6.1(f)), including, without limitation, the Confidential Information, unless such disclosure is required by a valid subpoena or other legal mandate or otherwise by rule of law or other valid order of a court or government body or agency. In the event disclosure so is required, Executive shall provide the Company with written notice of same at least five business days prior to the date on which Executive is required to make the disclosure. Notwithstanding the foregoing, the express terms of this Section 6.5 shall not apply in the event of a Change of Control and subsequent termination by the Company without Cause or by Executive for Good Reason or a termination due to non-renewal of the Term by the Company at the first time on or after the Change of Control that the Term is up for renewal.
6.6 Tangible Items. All files, records, documents, manuals, books, forms, reports, memoranda, studies, data, calculations, recordings, or correspondence, whether visually perceptible, machine-readable or otherwise, in whatever form they may exist, and all copies, abstracts and summaries of the foregoing, and all physical items related to the business of the Company, whether of a public nature or not, and whether prepared by Executive or not, are and shall remain the exclusive property of the Company , and shall not be removed from its premises, except as required in the course of Executive’s employment by the Company, without the prior written consent of the Company. Such items, including any copies or other reproductions thereof, shall be promptly returned by Executive to the Company at any time upon the written request of the Company. Notwithstanding the foregoing, the express terms of this Section 6.6 shall not apply in the event of a Change of Control and subsequent termination by the Company without Cause or by Executive for Good Reason or a termination due to non-renewal of the Term by the Company at the first time on or after the Change of Control that the Term is up for renewal.
6.7 Remedies. (a) The Company and Executive acknowledge and agree that a breach by Executive of any of the covenants contained in
this Section 6 will cause immediate and irreparable harm and damage to the Company and any other Benefited Person, and that monetary damages will be inadequate to compensate the Company, and any other Benefited Person, as the case may be, for such
12
breach. Accordingly, Executive acknowledges that the Company and any other Benefited Person affected shall, in addition to any other remedies available to it at law or in equity, be entitled to an injunction from any court of competent jurisdiction enjoining and restraining any violation of said covenants by Executive or any of his affiliates, associates, partners or agents, either directly or indirectly, without the necessity of proving the inadequacy of legal remedies or irreparable harm.
(b) Except with regard to Section 6.7(a), all disputes between the parties or any claims concerning the performance, breach, construction or interpretation of this Agreement, or in any manner arising out of this Agreement, shall be submitted to binding arbitration in accordance with the Commercial Arbitration Rules, as amended from time to time, of the American Arbitration Association (the “AAA”), which arbitration shall be carried out in the manner set forth below:
6.8 Change of Control. For the purposes of this Agreement, “Change of Control” shall be a change of control under the applicable definition contained in Section 2.4 of the Company’s 2000 Performance Incentive Plan, or successor thereto of comparable import; provided, however, that in no event shall a Change of Control for purposes of this Agreement be deemed to have arisen merely by virtue of a “person” or “group” (which terms shall have the meaning they have when used in Section 13(d) of the Securities Exchange Act of 1934, as amended) having become a direct or indirect owner of Company securities (such that a Change of Control would, without regard to this proviso, otherwise have been deemed to have occurred), if Executive is or is a member of such person or group.
13
(i) Within 15 days after written notice by one party to the other party of its demand for arbitration, which demand shall set forth the name and address of its designated arbitrator, the other party shall appoint its designated arbitrator and so notify the demanding party. Within 15 days thereafter, the two arbitrators so appointed shall appoint the third arbitrator. If the two appointed arbitrators cannot agree on the third arbitrator, then the AAA shall appoint an independent arbitrator as the third arbitrator. The dispute shall be heard by the arbitrators within 90 days after appointment of the third arbitrator. The decision of any two or all three of the arbitrators shall be binding upon the parties without any right of appeal. The decision of the arbitrators shall be final and binding upon the Company, its successors and assigns, and upon Executive, his heirs, personal representatives, and legal representatives.
(ii) The arbitration proceedings shall take place in Orlando, Florida, and the judgment and determination of such
proceedings shall be binding on all parties. Judgment upon any award rendered by the arbitrators may be entered into any court having competent jurisdiction without any right of appeal.
(iii) Each party shall pay its or his own expenses of arbitration, and the expenses of the arbitrators and the arbitration proceeding shall be shared equally. However, if in the opinion of a majority of the arbitrators, any claim or defense was unreasonable, the arbitrators may assess, as part of their award, all or any part of the arbitration expenses of the other party (including reasonable attorneys’ fees) and of the arbitrators and the arbitration proceeding.
7. Severability. As the provisions of this Agreement are independent of and severable from each other, the Company and Executive agree that if, in any action before any court or agency legally empowered to enforce this Agreement, any term, restriction, covenant, or promise hereof is found to be unreasonable or otherwise unenforceable, then such decision shall not effect the validity of the other provisions of this Agreement, and such invalid term, restriction, covenant, or promise shall also be deemed modified to the extent necessary to make it enforceable.
8. Notice. For purposes of this Agreement, notices, demands and all other communications provided for in the Agreement shall be in writing and shall be deemed to have been duly given when received if delivered in person, the next business day if delivered by overnight commercial courier (e.g., Federal Express), or the third business day if mailed by United States certified mail, return receipt requested, postage prepaid, to the following addresses:
(a) If to the Company, to: National Retail Properties, Inc. 450 South Orange Avenue, 9th Floor Orlando, Florida 32801 Attn: Chairman of the Compensation Committee of the Board of Directors
with a copy to: National Retail Properties, Inc. 450 South Orange Avenue, 9th Floor Orlando, Florida 32801 Attention: President
and Pillsbury Winthrop Shaw Pittman LLP 2300 N Street, N.W. Washington, DC 20037 Attn: Jeffrey B. Grill, Esq.
(b) If to Executive, to: Christopher P. Tessitore at the address set forth on the signature page hereof
Either party may change its address for notices in accordance with this Section 8 by providing written notice of such change to the other party.
9. Governing Law. This Agreement shall be governed by and construed in accordance with the laws of the State of Florida.
10. Benefits; Binding Effect; Assignment. This Agreement shall be binding upon and inure to the benefit of the parties and their respective heirs, personal representatives, legal representatives, successors and permitted assigns. Executive shall not assign this Agreement. However, the Company is expressly authorized to assign this Agreement to a Company Affiliate upon written notice to
14
Executive, provided that (i) the assignee assumes all of the obligations of the Company under this Agreement, (ii) Executive’s role when viewed from the perspective of Company Affiliates in the aggregate is comparable to such role immediately before the assignment, and (iii) the Company, for so long as an affiliate of the assignee, remains secondarily liable for the financial obligations hereunder.
11. Attorney’s Fees. The Company agrees to reimburse Executive for his reasonable legal fees incurred in reviewing this Agreement. In the event of any legal proceeding relating to this Agreement or any term or provision thereof, the losing party shall be responsible to pay or reimburse the prevailing party for all reasonable attorneys’ fees incurred by the prevailing party in connection with such proceeding, except that, in the event of an arbitration, the provisions of Section 6.7(b)(iii) shall apply.
12. Entire Agreement Amendment. This Agreement, including its incorporated Attachment “A,” constitutes the entire agreement between the parties, and all prior understandings, agreements or undertakings between the parties concerning Executive’s employment or the other subject matters of this Agreement (including without limitation the Existing Employment Agreement) are superseded in their entirety by this Agreement.
13. Waivers and Amendments. This Agreement may be amended, superseded, canceled, renewed or extended, and the terms hereof may be waived, only by a written instrument signed by the parties or, in the case of a waiver, by the party waiving compliance. No delay on the part of any party in exercising any right, power or privilege hereunder shall operate as a waiver thereof, nor shall any waiver on the part of any party of any such right, power or privilege nor any single or partial exercise of any such right, power or privilege, preclude any other or further exercise thereof or the exercise of any other such right, power or privilege.
14. No Duty to Mitigate. Executive shall not be required to mitigate damages or the amount of any payment provided for under this Agreement by seeking other employment or otherwise, nor will any payments hereunder be subject to offset in the event Executive does mitigate (except as otherwise provided in clause (i)(G) of the second sentence of Section 4.3(b) or clause (i)(E) of Section 4.4).
15. Counterparts. This Agreement may be executed in counterparts, each of which will be deemed an original, but which together shall be one and the same instrument.
16. Tax Advice. Executive confirms and represents to the Company that he has had the opportunity to obtain the advice of legal counsel, financial and tax advisers, and such other professionals as he deems necessary for entering into this Agreement, and he has not relied upon the advice of the Company or the Company’s officers, directors, or employees.
17. Interpretation. As both parties having had the opportunity to consult with legal counsel, no provision of this Agreement shall be construed against or interpreted to the disadvantage of any party by reason of such party having, or being deemed to have, drafted, devised, or imposed such provision.
15

IN WITNESS WHEREOF, the parties hereto have signed their names as of the day and year first above written.
16
NATIONAL RETAIL PROPERTIES, INC.
By: /s/ Craig Macnab Name: Craig MacnabTitle: Chief Executive Officer
/s/ Christopher P. Tessitore Christopher P. Tessitore

ATTACHMENT “A”
Additional Fringe Benefits
17
• $500/month car allowance • Long-term disability coverage providing benefits equal to two-thirds of Annual Salary
• Life insurance benefits with a face amount equal to Annual Salary (provided that, if at any time the Company cannot obtain such insurance at rates which are reasonable for the provision by the Company of such a benefit, the Company may then self-insure such benefits)
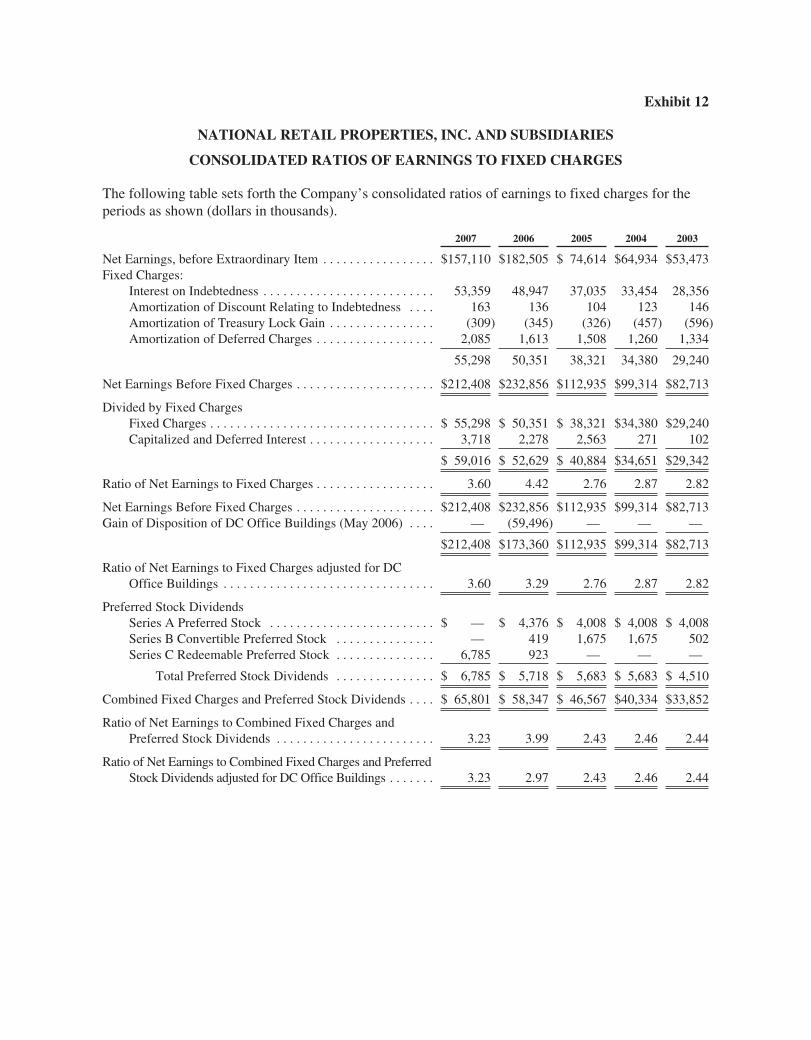
Exhibit 12
NATIONAL RETAIL PROPERTIES, INC. AND SUBSIDIARIES
CONSOLIDATED RATIOS OF EARNINGS TO FIXED CHARGES
The following table sets forth the Company’s consolidated ratios of earnings to fixed charges for theperiods as shown (dollars in thousands).
2007 2006 2005 2004 2003
Net Earnings, before Extraordinary Item . . . . . . . . . . . . . . . . . $157,110 $182,505 $ 74,614 $64,934 $53,473Fixed Charges:
Interest on Indebtedness . . . . . . . . . . . . . . . . . . . . . . . . . . 53,359 48,947 37,035 33,454 28,356Amortization of Discount Relating to Indebtedness . . . . 163 136 104 123 146Amortization of Treasury Lock Gain . . . . . . . . . . . . . . . . (309) (345) (326) (457) (596)Amortization of Deferred Charges . . . . . . . . . . . . . . . . . . 2,085 1,613 1,508 1,260 1,334
55,298 50,351 38,321 34,380 29,240
Net Earnings Before Fixed Charges . . . . . . . . . . . . . . . . . . . . . $212,408 $232,856 $112,935 $99,314 $82,713
Divided by Fixed ChargesFixed Charges . . . . . . . . . . . . . . . . . . . . . . . . . . . . . . . . . . $ 55,298 $ 50,351 $ 38,321 $34,380 $29,240Capitalized and Deferred Interest . . . . . . . . . . . . . . . . . . . 3,718 2,278 2,563 271 102
$ 59,016 $ 52,629 $ 40,884 $34,651 $29,342
Ratio of Net Earnings to Fixed Charges . . . . . . . . . . . . . . . . . . 3.60 4.42 2.76 2.87 2.82
Net Earnings Before Fixed Charges . . . . . . . . . . . . . . . . . . . . . $212,408 $232,856 $112,935 $99,314 $82,713Gain of Disposition of DC Office Buildings (May 2006) . . . . — (59,496) — — —
$212,408 $173,360 $112,935 $99,314 $82,713
Ratio of Net Earnings to Fixed Charges adjusted for DCOffice Buildings . . . . . . . . . . . . . . . . . . . . . . . . . . . . . . . . 3.60 3.29 2.76 2.87 2.82
Preferred Stock DividendsSeries A Preferred Stock . . . . . . . . . . . . . . . . . . . . . . . . . $ — $ 4,376 $ 4,008 $ 4,008 $ 4,008Series B Convertible Preferred Stock . . . . . . . . . . . . . . . — 419 1,675 1,675 502Series C Redeemable Preferred Stock . . . . . . . . . . . . . . . 6,785 923 — — —
Total Preferred Stock Dividends . . . . . . . . . . . . . . . $ 6,785 $ 5,718 $ 5,683 $ 5,683 $ 4,510
Combined Fixed Charges and Preferred Stock Dividends . . . . $ 65,801 $ 58,347 $ 46,567 $40,334 $33,852
Ratio of Net Earnings to Combined Fixed Charges andPreferred Stock Dividends . . . . . . . . . . . . . . . . . . . . . . . . 3.23 3.99 2.43 2.46 2.44
Ratio of Net Earnings to Combined Fixed Charges and PreferredStock Dividends adjusted for DC Office Buildings . . . . . . . 3.23 2.97 2.43 2.46 2.44
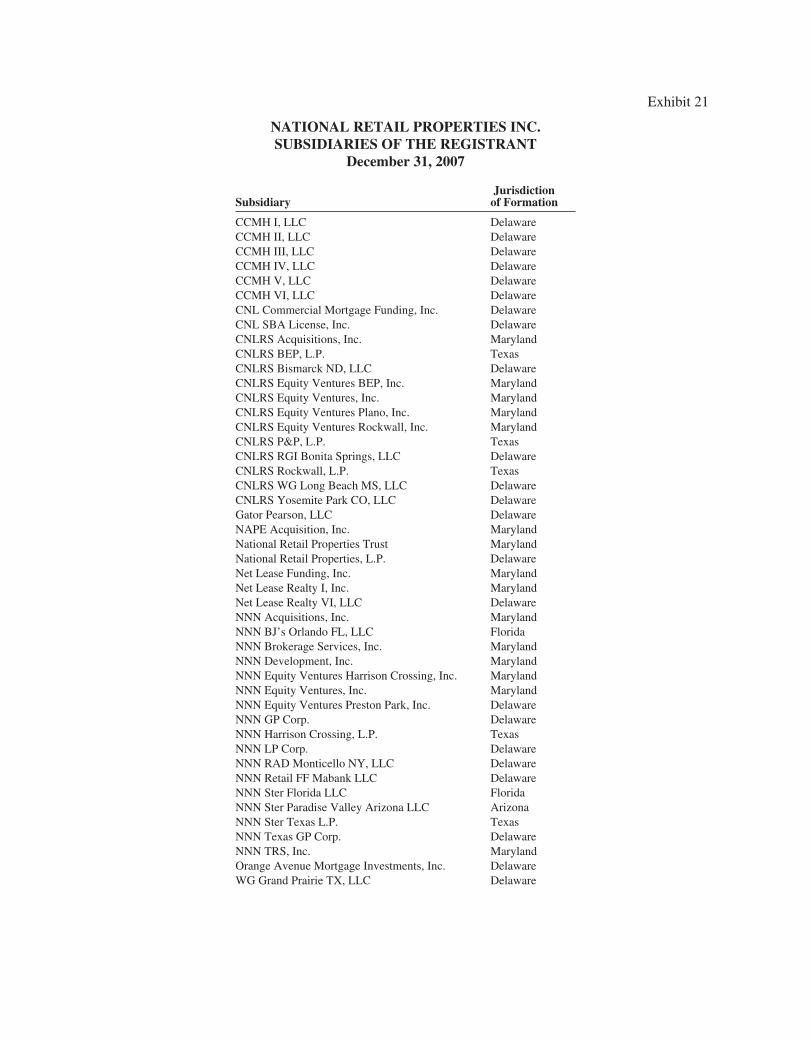
Exhibit 21
NATIONAL RETAIL PROPERTIES INC.SUBSIDIARIES OF THE REGISTRANT
December 31, 2007
SubsidiaryJurisdiction
of Formation
CCMH I, LLC DelawareCCMH II, LLC DelawareCCMH III, LLC DelawareCCMH IV, LLC DelawareCCMH V, LLC DelawareCCMH VI, LLC DelawareCNL Commercial Mortgage Funding, Inc. DelawareCNL SBA License, Inc. DelawareCNLRS Acquisitions, Inc. MarylandCNLRS BEP, L.P. TexasCNLRS Bismarck ND, LLC DelawareCNLRS Equity Ventures BEP, Inc. MarylandCNLRS Equity Ventures, Inc. MarylandCNLRS Equity Ventures Plano, Inc. MarylandCNLRS Equity Ventures Rockwall, Inc. MarylandCNLRS P&P, L.P. TexasCNLRS RGI Bonita Springs, LLC DelawareCNLRS Rockwall, L.P. TexasCNLRS WG Long Beach MS, LLC DelawareCNLRS Yosemite Park CO, LLC DelawareGator Pearson, LLC DelawareNAPE Acquisition, Inc. MarylandNational Retail Properties Trust MarylandNational Retail Properties, L.P. DelawareNet Lease Funding, Inc. MarylandNet Lease Realty I, Inc. MarylandNet Lease Realty VI, LLC DelawareNNN Acquisitions, Inc. MarylandNNN BJ’s Orlando FL, LLC FloridaNNN Brokerage Services, Inc. MarylandNNN Development, Inc. MarylandNNN Equity Ventures Harrison Crossing, Inc. MarylandNNN Equity Ventures, Inc. MarylandNNN Equity Ventures Preston Park, Inc. DelawareNNN GP Corp. DelawareNNN Harrison Crossing, L.P. TexasNNN LP Corp. DelawareNNN RAD Monticello NY, LLC DelawareNNN Retail FF Mabank LLC DelawareNNN Ster Florida LLC FloridaNNN Ster Paradise Valley Arizona LLC ArizonaNNN Ster Texas L.P. TexasNNN Texas GP Corp. DelawareNNN TRS, Inc. MarylandOrange Avenue Mortgage Investments, Inc. DelawareWG Grand Prairie TX, LLC Delaware
EXHIBIT 23.1
Consent of Independent Registered Public Accounting Firm
We consent to the incorporation by reference in the Registration Statements (Form S-3No. 333-132103, 333-132095, and No. 333-126071 and Form S-8 No. 333-64794, No. 333-15625 andNo. 333-144100) of National Retail Properties, Inc. and subsidiaries of our reports dated February 22,2008, with respect to the consolidated financial statements and schedules of National Retail Properties,Inc. and subsidiaries, and the effectiveness of internal control over financial reporting of NationalRetail Properties, Inc., included in this Annual Report (Form 10-K) for the year ended December 31,2007.
February 22, 2008Miami, FloridaCertified Public Accountants
EXHIBIT 23.2
Consent of Independent Registered Public Accounting Firm
The Board of DirectorsNational Retail Properties, Inc.:
We consent to the incorporation by reference in the registration statement (no.333–144100) on Form S–8, registrationstatement (no.333–15625) on Form S–8, registration statement (no.333–64794) on Form S–8, registration statement(no.333–126071) on Form S–3, registration statement (no.333–132103) on Form S–3, and registration statement (no.333-132095) on Form S-3 of National Retail Properties, Inc. of our report dated February 17, 2006 except as to notes 2,19, and 26 which are as of February 22, 2008, with respect to National Retail Properties, Inc. and subsidiaries,consolidated statements of earnings, stockholders’ equity, and cash flows for year ended December 31, 2005, which reportappears in the December 31, 2007 annual report on Form 10–K of National Retail Properties, Inc.
Orlando, FloridaFebruary 22, 2008Certified Public Accountants
Exhibit 31.1
CERTIFICATION PURSUANT TO SECTION 302OF THE SARBANES-OXLEY ACT OF 2002
I, Craig Macnab, certify that:
1. I have reviewed this report on Form 10-K of National Retail Properties, Inc.;
2. Based on my knowledge, this report does not contain any untrue statement of a material fact oromit to state a material fact necessary to make the statements made, in light of the circumstancesunder which such statements were made, not misleading with respect to the period covered by thisreport;
3. Based on my knowledge, the financial statements, and other financial information included in thisreport, fairly present in all material respects the financial condition, results of operations and cashflows of the registrant as of, and for, the periods presented in this report;
4. The registrant’s other certifying officer and I are responsible for establishing and maintainingdisclosure controls and procedures (as defined in Exchange Act Rules 13a-15(e) and 15d-15(e))and internal control over financial reporting (as defined in Exchange Act Rules 13a-15(f) and 15d-15(f)) for the registrant and have:
a) Designed such disclosure controls and procedures, or caused such disclosure controls andprocedures to be designed under our supervision, to ensure that material information relatingto the registrant, including its consolidated subsidiaries, is made known to us by otherswithin those entities, particularly during the period in which this report is being prepared;
b) Designed such internal control over financial reporting, or caused such internal control overfinancial reporting to be designed under our supervision, to provide reasonable assuranceregarding the reliability of financial reporting and the preparation of financial statements forexternal purposes in accordance with generally accepted accounting principles;
c) Evaluated the effectiveness of the registrant’s disclosure controls and procedures andpresented in this report our conclusions about the effectiveness of the disclosure controls andprocedures, as of the end of the period covered by this report based on such evaluation; and
d) Disclosed in this report any change in the registrant’s internal control over financial reportingthat occurred during the registrant’s most recent fiscal quarter (the registrant’s fourth fiscalquarter in the case of the annual report) that has materially affected, or is reasonably likely tomaterially affect, the registrant’s internal control over financial reporting; and
5. The registrant’s other certifying officer and I have disclosed, based on our most recent evaluationof internal control over financial reporting, to the registrant’s auditors and the audit committee ofregistrant’s board of directors (or persons performing the equivalent functions):
a) All significant deficiencies and material weaknesses in the design or operation of internalcontrol over financial reporting which are reasonably likely to adversely affect theregistrant’s ability to record, process, summarize and report financial information; and
b) Any fraud, whether or not material, that involves management or other employees who havea significant role in the registrant’s internal control over financial reporting.
February 22, 2008 /s/ Craig MacnabDate Name: Craig Macnab
Title: Chairman of the Board and ChiefExecutive Officer
Exhibit 31.2
CERTIFICATION PURSUANT TO SECTION 302OF THE SARBANES-OXLEY ACT OF 2002
I, Kevin B. Habicht, certify that:
1. I have reviewed this report on Form 10-K of National Retail Properties, Inc.;
2. Based on my knowledge, this report does not contain any untrue statement of a material fact oromit to state a material fact necessary to make the statements made, in light of the circumstancesunder which such statements were made, not misleading with respect to the period covered by thisreport;
3. Based on my knowledge, the financial statements, and other financial information included in thisreport, fairly present in all material respects the financial condition, results of operations and cashflows of the registrant as of, and for, the periods presented in this report;
4. The registrant’s other certifying officer and I are responsible for establishing and maintainingdisclosure controls and procedures (as defined in Exchange Act Rules 13a-15(e) and 15d-15(e))and internal control over financial reporting (as defined in Exchange Act Rules 13a-15(f) and 15d-15(f)) for the registrant and have:
a) Designed such disclosure controls and procedures, or caused such disclosure controls andprocedures to be designed under our supervision, to ensure that material information relatingto the registrant, including its consolidated subsidiaries, is made known to us by otherswithin those entities, particularly during the period in which this report is being prepared;
b) Designed such internal control over financial reporting, or caused such internal control overfinancial reporting to be designed under our supervision, to provide reasonable assuranceregarding the reliability of financial reporting and the preparation of financial statements forexternal purposes in accordance with generally accepted accounting principles;
c) Evaluated the effectiveness of the registrant’s disclosure controls and procedures andpresented in this report our conclusions about the effectiveness of the disclosure controls andprocedures, as of the end of the period covered by this report based on such evaluation; and
d) Disclosed in this report any change in the registrant’s internal control over financial reportingthat occurred during the registrant’s most recent fiscal quarter (the registrant’s fourth fiscalquarter in the case of an annual report) that has materially affected, or is reasonably likely tomaterially affect, the registrant’s internal control over financial reporting; and
5. The registrant’s other certifying officer and I have disclosed, based on our most recent evaluationof internal control over financial reporting, to the registrant’s auditors and the audit committee ofregistrant’s board of directors (or persons performing the equivalent functions):
a) All significant deficiencies and material weaknesses in the design or operation of internalcontrol over financial reporting which are reasonably likely to adversely affect theregistrant’s ability to record, process, summarize and report financial information; and
b) Any fraud, whether or not material, that involves management or other employees who havea significant role in the registrant’s internal control over financial reporting.
February 22, 2008 /s/ Kevin B. HabichtDate Name: Kevin B. Habicht
Title: Chief Financial Officer
Exhibit 32.1
CERTIFICATION PURSUANT TO SECTION 906OF THE SARBANES-OXLEY ACT OF 2002
Pursuant to 18 U.S.C. Section 1350, as adopted pursuant to Section 906 of the Sarbanes-Oxley Act of2002, the undersigned, Craig Macnab, Chairman of the Board and Chief Executive Officer, certifiesthat (1) this Annual Report of National Retail Properties, Inc. (the “Company”) on Form 10-K for theperiod ended December 31, 2007, as filed with the Securities and Exchange Commission on the datehereof (this “Report”), fully complies with the requirements of Section 13(a) or 15(d) of the SecuritiesExchange Act of 1934, as amended, and (2) the information contained in this Report fairly presents, inall material respects, the financial condition of the Company as of December 31, 2007 and 2006 and itsresults of operations for the years ended December 31, 2007, 2006 and 2005.
February 22, 2008 /s/ Craig Macnab
Date Name: Craig MacnabTitle: Chairman of the Board and
Chief Executive Officer
A signed original of this written statement required by Section 906 has been provided to the Companyand will be retained by the Company and furnished to the Securities and Exchange Commission or itsstaff upon request.

Exhibit 32.2
CERTIFICATION PURSUANT TO SECTION 906OF THE SARBANES-OXLEY ACT OF 2002
Pursuant to 18 U.S.C. Section 1350, as adopted pursuant to Section 906 of the Sarbanes-Oxley Act of2002, the undersigned, Kevin B. Habicht, Chief Financial Officer, certifies that (1) this Annual Reportof National Retail Properties, Inc. (the “Company”) on Form 10-K for the period ended December 31,2007, as filed with the Securities and Exchange Commission on the date hereof (this “Report”), fullycomplies with the requirements of Section 13(a) or 15(d) of the Securities Exchange Act of 1934, asamended, and (2) the information contained in this Report fairly presents, in all material respects, thefinancial condition of the Company as of December 31, 2007 and 2006 and its results of operations forthe years ended December 31, 2007, 2006 and 2005.
February 22, 2008 /s/ Kevin B. Habicht
Date Name: Kevin B. HabichtTitle: Chief Financial Officer
A signed original of this written statement required by Section 906 has been provided to the Companyand will be retained by the Company and furnished to the Securities and Exchange Commission or itsstaff upon request.
Form Last Updated by the NYSE on April 28, 2006
NYSE Regulation
Domestic CompanySection 303A
Annual CEO Certification
As the Chief Executive Officer of National Retail Properties, Inc. (NNN), and as required bySection 303A.12(a) of the New York Stock Exchange Listed Company Manual, I hereby certify that asof the date hereof I am not aware of any violation by the Company of NYSE’s corporate governancelisting standards, other than has been notified to the Exchange pursuant to Section 303A.12(b) anddisclosed on Exhibit H to the Company’s Domestic Company Section 303A Annual WrittenAffirmation.
This certification is:
È Without qualification
or
‘ With qualification
By: /s/ Craig Macnab
Print Name: Craig Macnab
Title: Chief Executive Officer
Date: May 12, 2007
Date Submitted: May 18, 2007

SHAREHOLDER INFORMATION
For General Information:
American Stock Transfer & Trust Company
Operations Center
6201 15th Avenue
Brooklyn, NY 11219
www.amstock.com
Shareholder Toll-free Line: 1-866-627-2644
Worldwide: 718-921-8346
Fax: 718-236-2641
For Dividend Reinvestment:
American Stock Transfer & Trust Company
P.O. Box 922
Wall Street Station
New York, NY 10269-0560
Independent Registered
Public Accounting Firm:
Ernst & Young LLP
Orlando, FL
Counsel:
Pillsbury Winthrop Shaw Pittman LLP
Washington, D.C.
Corporate Office:
National Retail Properties, Inc.
450 S. Orange Avenue, Suite 900
Orlando, FL 32801
(800) NNN-REIT
(407) 265-7348
www.nnnreit.com
FORM 10-K(As amended)
A copy of the Company’s Form 10-K,
as amended and filed with the Securities
and Exchange Commission (SEC) for
fiscal 2007, which includes as Exhibits the
Chief Executive Officer and Chief Financial
Officer certifications required to be filed
with the SEC pursuant to Section 302 of the
Sarbanes-Oxley Act, has been filed with the
SEC and is included in this annual report
and may also be obtained by stockholders
without charge upon written request to the
Company’s Secretary at the above address,
or on our website. During fiscal 2007,
the Company filed with the New York Stock
Exchange (NYSE) the Certification of its
Chief Executive Officer confirming that the
Chief Executive Officer was not aware of any
violations by the Company of the NYSE’s
corporate governance listing standards.

450 S. Orange Avenue, Suite 900Orlando, FL 32801(800) NNN-REITwww.nnnreit.com
NA
TIO
NA
L R
ET
AIL
PR
OP
ER
TIE
S, IN
C.
2007 Annual R
eport