St t B d t U d tState Budget Update: November 2009 · (in Billions) Fiscal Year Amount (in...
32
St t Bd tUdt State Budget Update: November 2009 P td t th Presented at the Fiscal Leaders Seminar Corina Eckl Fiscal Program Director
Transcript of St t B d t U d tState Budget Update: November 2009 · (in Billions) Fiscal Year Amount (in...

St t B d t U d tState Budget Update: November 2009
P t d t thPresented at the
Fiscal Leaders Seminar
Corina Eckl Fiscal Program Director
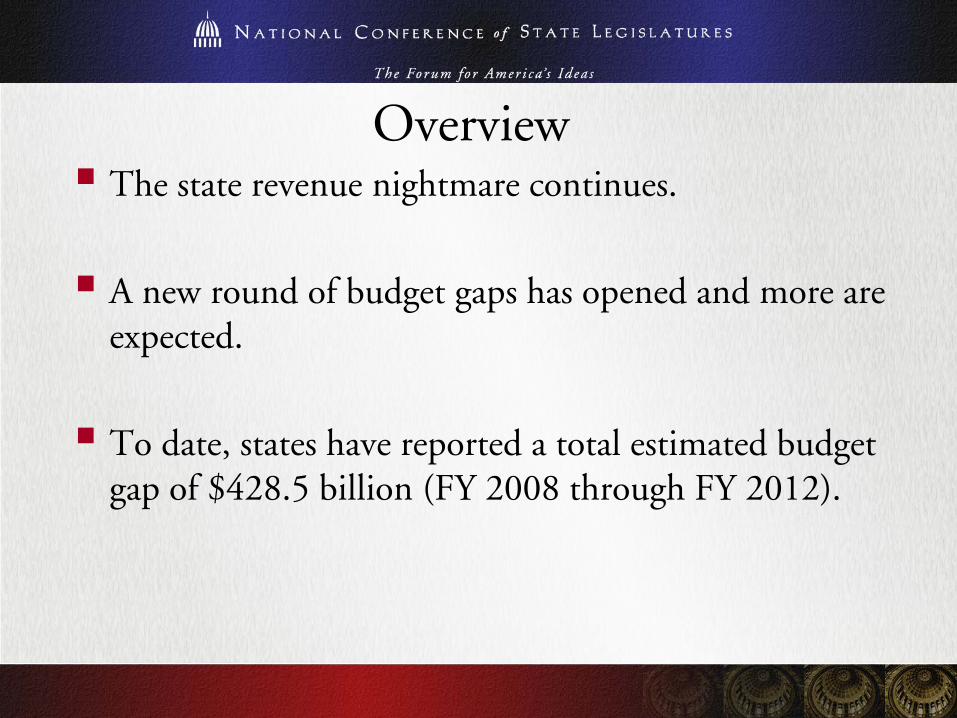
OverviewThe state revenue nightmare continues.g
A new round of budget gaps has opened and more are g g p pexpected.
To date, states have reported a total estimated budget gap of $428.5 billion (FY 2008 through FY 2012).

U S Business Cycle Downturns 1929 2009U.S. Business Cycle Downturns 1929-2009: Duration in Months
Source: National Bureau of Economic Research
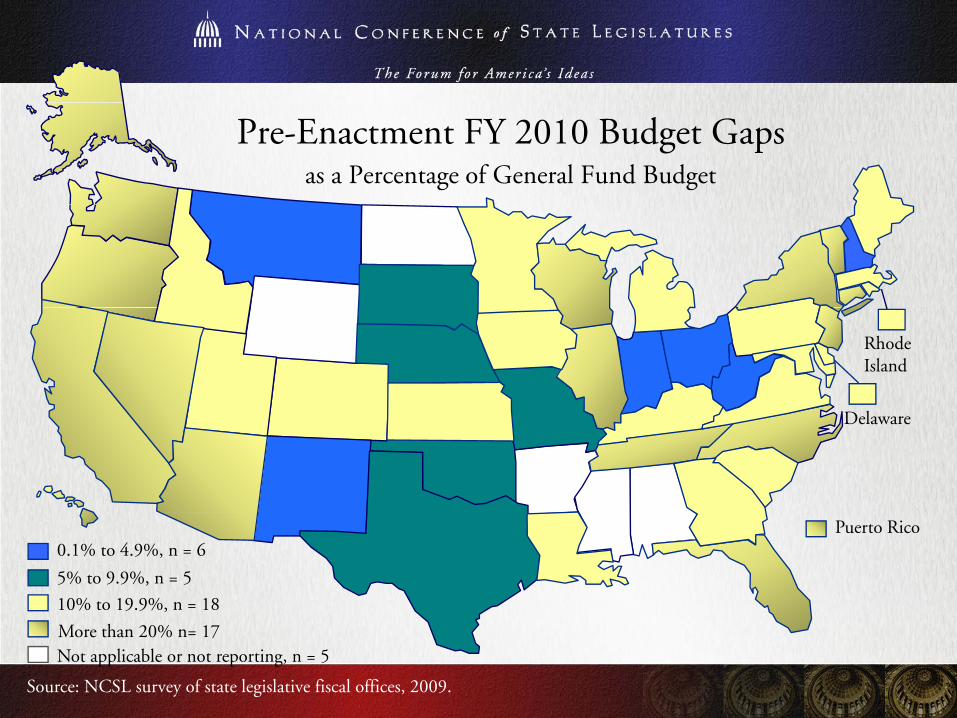
Pre-Enactment FY 2010 Budget Gapsas a Percentage of General Fund Budget
Rhode Island
Delaware
10% to 19.9%, n = 18
5% to 9.9%, n = 5
0.1% to 4.9%, n = 6Puerto Rico
Source: NCSL survey of state legislative fiscal offices, 2009.
More than 20% n= 17Not applicable or not reporting, n = 5

FY 2010 B d GFY 2010 Budget Gapsas a Percentage of General Fund Budget
(Since the Fiscal Year Began)
Rhode Island
Delaware
10% to 19.9%, n = 5
5% to 9.9%, n = 15
0.1% to 4.9%, n = 16Puerto Rico
Source: NCSL survey of state legislative fiscal offices, November 2009.
More than 20% n= 0Not applicable or not reporting, n = 15
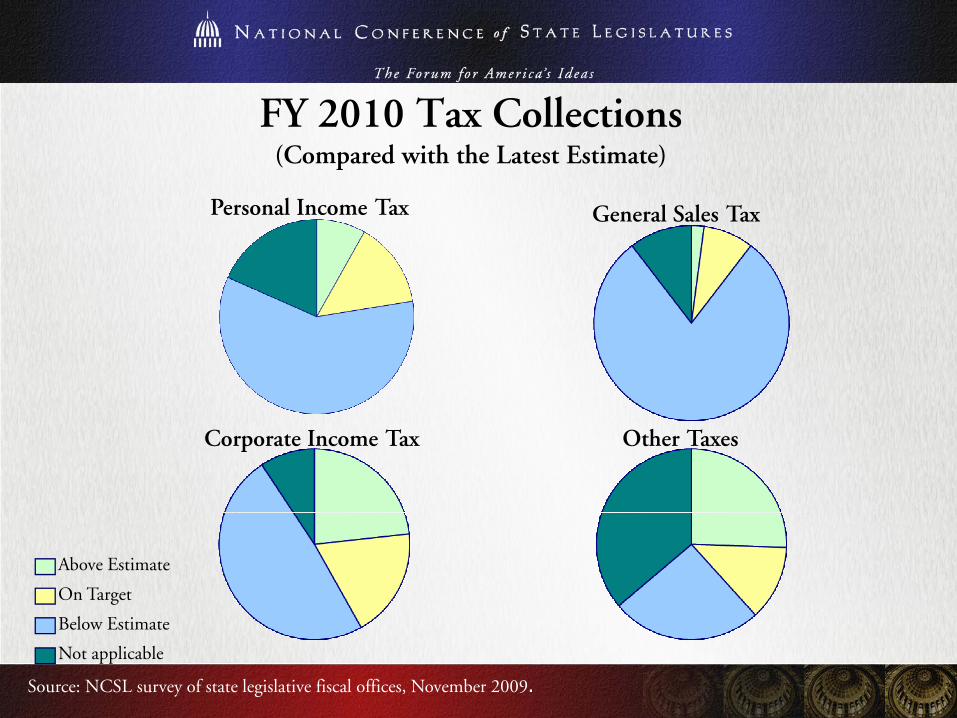
FY 2010 T C ll iFY 2010 Tax Collections (Compared with the Latest Estimate)
Personal Income Ta l l TPersonal Income Tax General Sales Tax
Corporate Income Tax Other Taxes
Above Estimate
On Target
Source: NCSL survey of state legislative fiscal offices, November 2009.
Below Estimate
Not applicable

FY 2010 P l I T C ll iFY 2010 Personal Income Tax Collections (Compared with the Latest Estimate)
Above Target, 4g ,(3 , 0 )
On Target 7
No personal income tax, 9
On Target, 7(3 , 0 )
Below Target, 29(13 , 0 )
Source: NCSL survey of state legislative fiscal offices, November 2009.

FY 2010 G l S l T C ll iFY 2010 General Sales Tax Collections(Compared with the Latest Estimate)
Above Target 1 (01 0 )Above Target, 1 (01 , 0 )
On Target, 4(4 , 0 )
No general sales tax, 5
Below Target, 38(15 , 0 )( , )
Source: NCSL survey of state legislative fiscal offices, November 2009.

FY 2010 C I T C ll iFY 2010 Corporate Income Tax Collections(Compared with the Latest Estimate)
N
Above Target, 10(2 , 3 )
No corporate income tax, 4
Below Target, 21
On Target, 8(1 , 1 )
g ,(11 , 0 )
( , )
Source: NCSL survey of state legislative fiscal offices, November 2009.
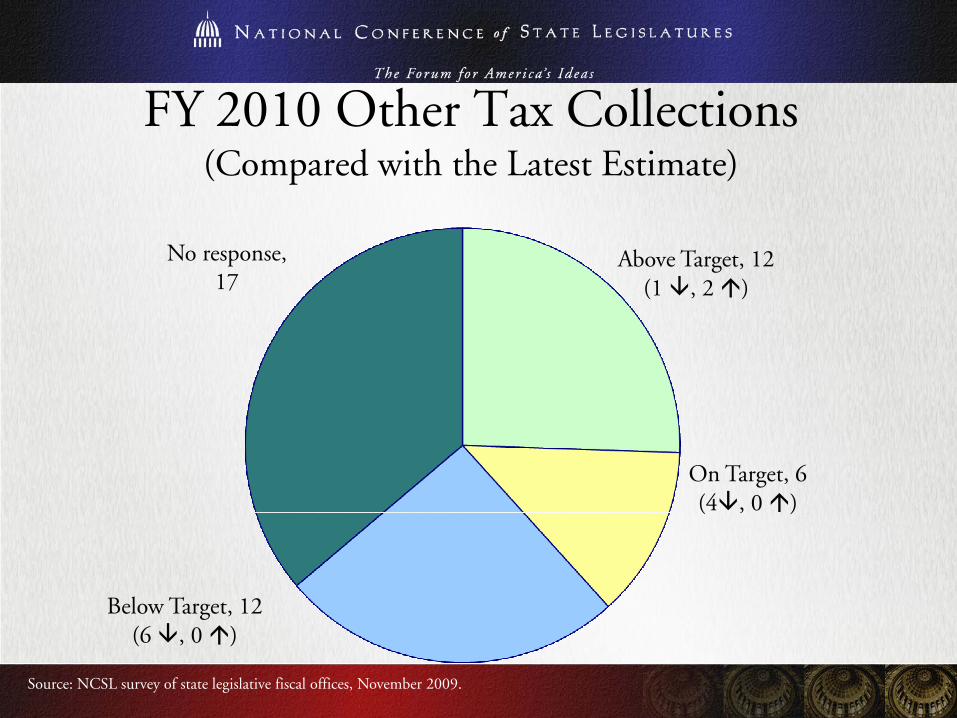
FY 2010 Oth T C ll tiFY 2010 Other Tax Collections (Compared with the Latest Estimate)
Above Target, 12(1 , 2 )
No response, 17
On Target, 6(4 , 0 )( , )
Below Target, 12g ,(6 , 0 )
Source: NCSL survey of state legislative fiscal offices, November 2009.

S R O l kState Revenue Outlook for the Remainder of FY 2010
Rhode Island
lDelaware
Stable n = 6
Concerned n = 30
Pessimistic n = 13Puerto Rico
Source: NCSL survey of state legislative fiscal offices, November 2009.
Optimistic n = 1No response n = 1
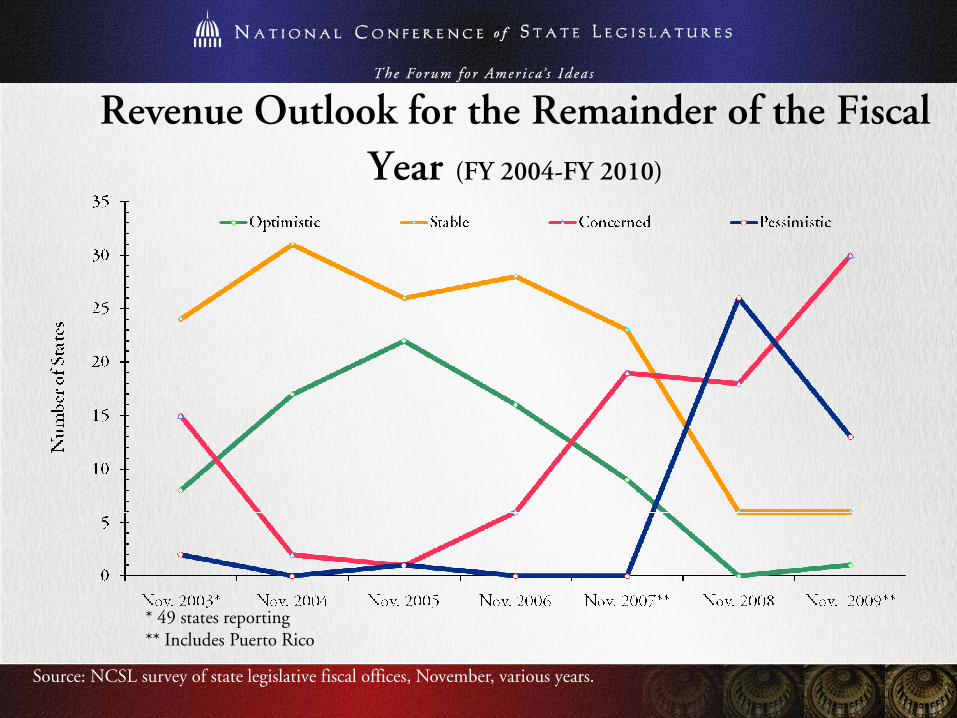
R O l k f h R i d f h Fi lRevenue Outlook for the Remainder of the Fiscal Year (FY 2004-FY 2010)
* 49 t t r p rtin* 49 states reporting ** Includes Puerto Rico
Source: NCSL survey of state legislative fiscal offices, November, various years.

FY 2010 R C d tFY 2010 Revenues Compared to FY 2009 Collections
Lower: 39 states and Puerto Rico.
Flat: 1 state (New Jersey).
Higher: 9 states.

A L Vi f S RA Longer View of State Revenue Performance
15
17
16
18
FY 2009 general fund revenues were similar to collections in:
1010
12
14
of S
tate
s
1 12
4
12
4
6
8
Num
ber
1 1 1
0
2
FY 1997 FY 2003 FY 2004 FY 2005 FY 2006 FY 2007 FY 2008 FY 2009
Source: NCSL survey of state legislative fiscal offices, November 2009

P k i N i l G l F dPeak in Nominal General Fund Revenue Collections
FY 2000: 1 state (Michigan)
FY 2006: 1 state (New York)
FY 2007: 6 states
FY 2008: 41 states
FY 2009: 2 states (North Dakota and South Dakota)

Projected Return to Peak CollectionsFY 2010: 1 state (Oregon)
FY 2011: 5 states
FY 2012: 7 states
FY 2013: 7 states
FY 2014: 5 states
FY 2015: 4 states
N/A: 1 state (North Dakota)
Not on the current forecast horizon: 21 states.

FY 2011 Budget Gapsas a Percentage of General Fund Budget
Rhode Island
Delaware
Puerto Rico
More than 20.0%, n = 5
10% to 19.9%, n = 10
0.1% to 9.9%, n = 16
Source: NCSL survey of state legislative fiscal offices, November 2009
Budget gap projected, amount unknown, n= 5Not applicable or not reporting, n = 15
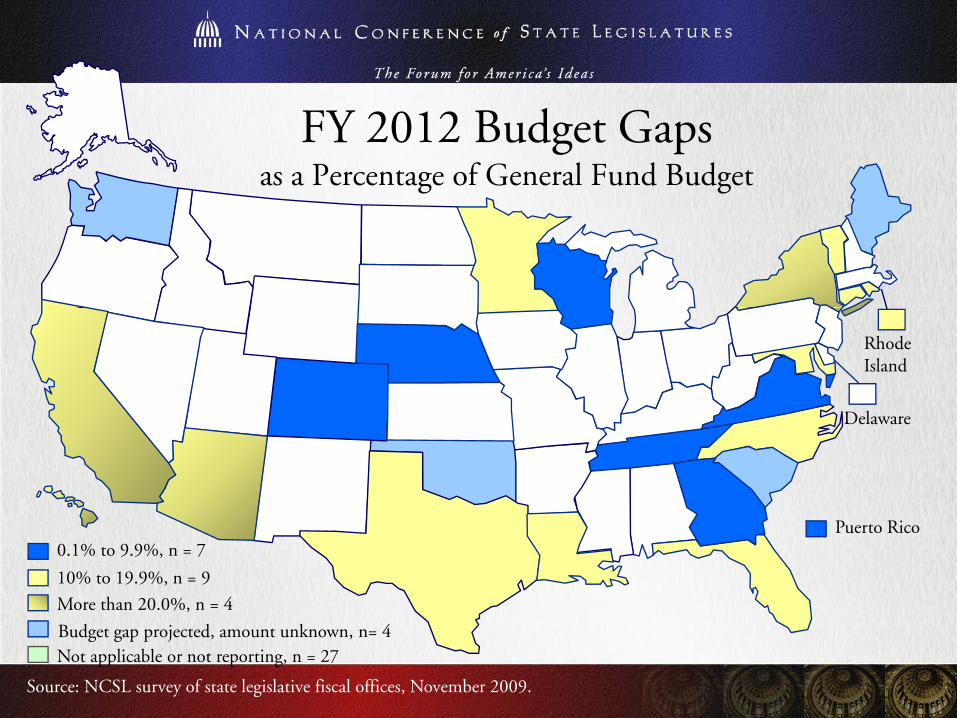
FY 2012 Budget Gapsas a Percentage of General Fund Budget
Rhode Island
Delaware
Puerto Rico
More than 20.0%, n = 4
10% to 19.9%, n = 9
0.1% to 9.9%, n = 7
Source: NCSL survey of state legislative fiscal offices, November 2009.
Budget gap projected, amount unknown, n= 4Not applicable or not reporting, n = 27

State Budget Gaps FY 2002-FY 2012 (projected)
Amount Before Budget Adoption
Amount After Fiscal Year Began
Projected Amount
No estimate
43 states 45 states 42 states 33 states 26 states 1 state 20 states* 44 states* 49 states* 31 states** 20 states***
* Includes Puerto Rico ** 35 states and Puerto Rico forecast FY 2011 gaps The amount shown for FY 2011 indicates the 30 states that provided gap estimates 35 states and Puerto Rico forecast FY 2011 gaps. The amount shown for FY 2011 indicates the 30 states that provided gap estimates. *** 24 states forecast FY 2012 gaps. The amount shown for the FY 2012 indicates the 20 states that provided gap estimates.Source: NCSL survey of legislative fiscal offices, various years

Budget Gap NumbersBudget Gap NumbersPast and Current Recession
P R i C R iPast Recession Current Recession
Fiscal Year Amount(in Billions)
Fiscal Year Amount(in Billions)
$ $2002 $37.2 2008 $12.8
2003 $79.0 2009 $117.3
2004 $83.7 2010 $174.1*
2005 $37.0 2011 $55.5**
2006 $26.9 2012 $68.8**
Total $263.8 Total $428.5*Total $263.8 Total $428.5
Past Recession: March 2001 to November 2001 (8 months)Current Recession: Began December 2007 to Q3 of 2009? (20-21 months)Gray bar denotes end/projected end of recession*Preliminary figure** d f** Projected figure
Source: NCSL survey of state legislative fiscal offices, various years.

Quarter in Which States Entered The Recession
8
7
8
9
4 4
5
44
5
6
7
er o
f Sta
tes
2
3
2 2
12
3
4
Num
be
0 0
1
0
1
Q1 Q2 Q3 Q4 Q1 Q2 Q3 Q4 Q1 Q2 Q3 Q4N/R = 13 statesN/A = 1 stateMI enter the recession Q2 2000 and PR entered inQ1 2006 2007 2008 2009
Source: NCSL survey of state legislative fiscal offices, November 2009.

Projected Exit From the RecessionProjected Exit From the Recession (By Quarter)
7
6
7
8
5 5 5
4
3
4
5
mbe
r of
Sta
tes
0
1 1
2
0 0 01
2
3
Num
0 0 0 00
Q1 Q2 Q3 Q4 Q1 Q2 Q3 Q4 Q1 Q2 Q3 Q4
2009 2010 2011
N/R = 17statesN/A = 1 stateAR projects FY 2011,TN d WY j FY 2012TN and WY project FY 2012
Source: NCSL survey of state legislative fiscal offices, November 2009.

Conclusion
The state fiscal situation range from "grim" and "dire" d d dto "guarded" and "cautious."
The states are facing a "cliff" once ARRA funding ends.
State budget recovery remains several years away.

www.ncsl.orgFor more informationFor more information

2009 Net State Tax Changes by Type of Tax
Type of Tax Dollars (in millions) Percent of Total
Personal Income $11,340.7 41.6%
Corporate Income $1,696.8 6.2%
Sales & Use $7,003.2 25.7%
Health Care Providers $1,995.5 7.3%
Cigarette & Tobacco $1,750.5 6.4%
Motor Fuel $1,866.8 6.8%
Alcoholic Beverage $215.3 0.8%Alcoholic Beverage $ 5 3 %
Miscellaneous $1,409.0 5.2%
Net Change $27,277.8 100%
Source: National Conference of State Legislatures, 2009. Figures represent 47 reporting states. States not included are: MI, PA, and RI.

Net State Tax Changes by Year of Enactment
Source: NCSL survey of legislative fiscal offices, various years. 2009 figures represent 47 reporting states. States not included are: MI, PA, and RI.

Use of Spending Cuts as Percentage of Actions To Close FY 2010 Budget Gaps (preliminary)
17.0%
36 7%
43.0%32.0%
23.7%22.7%
36.7%VT- 25.0%100.0%
48.0%
49.4%47.0%
Rhode Island
44.7%
43.0%
20.8%
19 5%58.0%
40 0%48.0% 47 4%
74.3%
Delaware
3.9% 40.0%19.1%
19.5%
26.6% 45.1%
45 5%
40.0%48.0% 47.4%
36.4%60.0%
4.1%
CT - 28.8%
Used spending cuts, n = 40
45.5%
15.8%
46.0%MD - 28.0%
NJ- 38.7%RI 48 7%
DE - 37.8%
MA - 43.0%
Source: NCSL survey of state legislative fiscal offices, 2009.
Puerto Rico- 61.8%No Response, n = 4Not Applicable, n = 7
RI- 48.7%WV- 60.0%
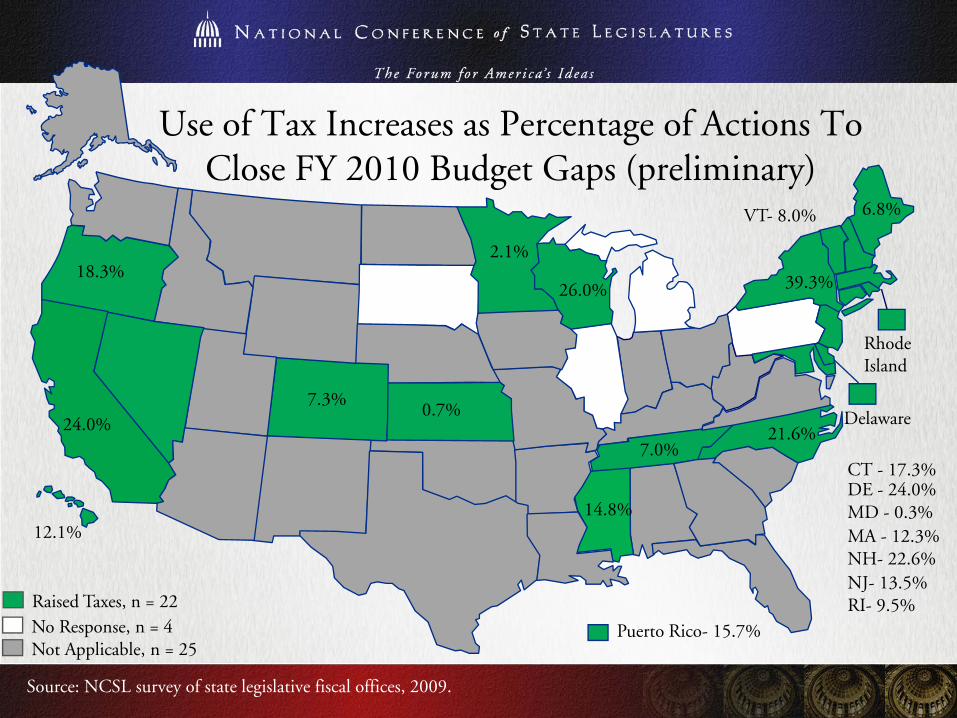
Use of Tax Increases as Percentage of Actions To Close FY 2010 Budget Gaps (preliminary)
6 8%VT- 8.0% 6.8%
2.1%
39.3%18.3%
26.0%
Rhode Island
7.3%0 7% Delaware
3
MD 0 3%
CT - 17.3%DE - 24.0%
24.0%0.7%
14 8%
21.6%7.0%
Raised Taxes, n = 22
MD - 0.3%
NJ- 13.5%RI- 9.5%
NH- 22.6%
12.1%14.8%
MA - 12.3%
Source: NCSL survey of state legislative fiscal offices, 2009.
Puerto Rico- 15.7%No Response, n = 4Not Applicable, n = 25

Tapped Rainy Day Funds and Other FundsTapped Rainy Day Funds and Other Funds as Percentage of Actions To Close FY 2010 Budget Gaps
(preliminary)
35.0%
3.0%3.8%5.6%
5.0%
Rhode Island
28.8%
15.7%12.0% 3.1%
1.0%
Delaware3
8.4%
15.0%7.6%4.2%
5.5%
5.1%3.0%
MD 11 4%CT - 27.6%
Tapped Rainy Day Fund & Other Funds, n = 5Tapped Other Funds, n = 12Tapped Rainy Day Fund, n = 6
8.4%
5.0%5.0%
MD - 11.4%
NJ- 1.5%MA- 6.5%
Source: NCSL survey of state legislative fiscal offices, 2009.
Puerto RicoNo Response, n = 6Not Applicable, n = 22

33 0%
3.0%
39 2%
Use of ARRA Funds as Percentage of Actions To Close FY 2010 Budget Gaps (preliminary)
54.0%
33.0%
29.0%
30.2%27.1%
39.2%VT- 62.0%
24.3%
53.0%
Rhode Island
88.0%
28.6%26.0%
54.0%
60 0%
57.3%
30.0%32 9% Delaware
60.0%
45.5% 43.0%64.3%
68.4%
61.4% 43.4%
21 0%
13.0%32.9%
30.7%25.0%
41.6%
MD 47 0%
CT - 21.7%DE - 29.0%
Used ARRA funds, n = 41
96.7%21.0%
44.7%
40.0%MD - 47.0%
NJ- 27.3%RI- 40.3%
NH- 41.1%MA - 34.0%
Source: NCSL survey of state legislative fiscal offices, 2009.
Puerto Rico- 17.9%No Response, n = 4Not Applicable, n = 6
WV- 40.0%

Impact of ARRA Funds on State Budgets
P P i I N b f SPercentage Point Increasein Spending Attributable to
ARRA Funds
Number of States
FY 2009 FY 2010
0 1 2 9 15 90.1 - 2.9 15 9
3.0 - 5.9 15 9
6.0 - 8.9 3 14
> 9.0 1 6
States Moving from Negative to Positive Spending Change
9 12
N/A or N/R: FY 2009 = 17 states; FY 2010 = 13 states
Source: NCSL survey of state legislative fiscal offices, 2009.

F d l O tl f M j P i i f ARRA Aff tiFederal Outlays for Major Provisions of ARRA Affecting State and Local Governments
($ in billions)
Source: Congressional Budget Office