St. Stephen Powerhouse Fish Lift, Cooper River … 31I , AD-A265 31Technical Report March...
74
AD-A26 5 31I , AD-A265 31Technical Report HL-93-1 March 1993 uti Army Corps M 1 of Engineers Waterways Experiment Station St. Stephen Powerhouse Fish Lift, Cooper River Rediiersion Project, South Carolina Hydraulic Model Investigation by Thomas E. Murphy, Jr., John E. Hite, Jr. Hydraulics Laboratory DTIC S ELECTE MAY14 1993 DI EjL Approved For Public Release; Distribution Is Unlimited 93-10445 Prepared for U.S. Army Engineer District, Charleston
Transcript of St. Stephen Powerhouse Fish Lift, Cooper River … 31I , AD-A265 31Technical Report March...

AD-A26 5 31I ,AD-A265 31Technical Report HL-93-1March 1993
uti Army Corps M 1
of EngineersWaterways ExperimentStation
St. Stephen Powerhouse Fish Lift,Cooper River Rediiersion Project,South Carolina
Hydraulic Model Investigation
by Thomas E. Murphy, Jr., John E. Hite, Jr.Hydraulics Laboratory
DTICS ELECTE
MAY14 1993 DIEjL
Approved For Public Release; Distribution Is Unlimited
93-10445
Prepared for U.S. Army Engineer District, Charleston

The contents of this report are not to be used for advertising,publication, or promotional purposes. Citation of trade namesdoes not con titute an official endorsement or approval of the useof such commercial products.
4MSPRINTE ON RECYCLED P'APER

Technical Report HL-93-I1March 1993
St. Stephen Powerhouse Fish Lift,Cooper River Rediversion Project,South Carolina
Hydraulic Model Investigation
by Thomas E. Murphy, Jr., John E. Hite, Jr.
Hydraulics Laboratory
U.S. Army Corps of Engineers Accesion For
Waterways Experiment Station NTIS CRA&I3909 Halls Ferry Road DTIC TABVicksburg, MS 39180-6199 U,.annoutced
Jutification. ..........
By .......... .................. ............ ..
D~isti ibution I
- Availability Codes
I Avail an~d IorDist Special
Final report
Approved for public release; distribution is unlimited
Prepared for U.S. Army Engineer District, CharlestonCharleston, South Carolina 29402-0919

Ui
US Army Corpsof EngineersWaterways Experiment NStation
LABORATORY
GEET
FRC NPOW~AT)ON CqOflA
PUBLIC AFFAIRS OFFICELABORATORY -U. S. ARMY ENGINEER
WATERWAYS EXPERIMENT STATION
3909 HALLS FERRY ROADVICKSBURG, MISSISSIPPI 391806199
PHONE; (601)634.2502STRUCTURIS
AREA OF AESEAT". - 7 ,
Waterways Experiment Station Cataloging-in-Publication Data
Murohy, Thomas E.St. Stephen Powerhouse fish lift, Cooper River Rediversion Project, South Caro-
lina : hydraulic model investigation / by 1 homas E. Murphy, Jr., John E. Hite, Jr.prepared for U.S. Army Engineer District, Charleston.
72 p. : ill. ; 28 cm. - (Technical report ; HL-93-1)Includes bibliographical references.1. Fishways - ,South C.rol ;- Copcr Ri;'cr. 2. 1',d "!actrhc power plants
-South Carolina- Berkeley County - Environmental aspects. 3. Hydraulicmodels. 4. Diversion structures (Hydraulic engineering) I. Hite, John E. I1.United States. Army. Corps of Engineers. Charleston District. IIl. U.S. Army Engi-neer Waterways Experiment Station. IV. Title. V. Series: Technical report (U.S.Army Engineer Waterways Experiment Station) ; HL-93-1.TA7 W34 no.HL-93-1

PREFACE
The model investigation reported herein was authorized by Headquarters,
US Army (,orps of Engineers, on 26 March 1991 at the request of the US Army
Engineer District, Charleston (SAC). The studies were conducted at the US
Army Engineer Waterways Experiment Station (WES) during the period September
1991 to March 1992. All studies were conducted under the direction of
Messrs. Frank A. Herrmann, Jr., Director of the Hydraulics Laboratory, WES;
Richard A. Sager, Assistant Director of the Hydraulics Laboratory; and
Glenn A. Pickering, Chief of the Hydraulic Structures Division, Hydraulics
Laboratory. Tests were conducted by Mr. Thomas E. Murphy, Jr., Dr. John E.
Hite, Jr., Mr. Robert A. Davidson, and Ms. Olie Blansett, all of the Locks and
Conduits Branch, Hydraulic Structures Division, under the supervision of
Mr. J. F. George, Chief of the Locks and Conduits Branch. This report was
prepared by Mr. Murphy and Dr. Hite and edited by Mrs. Marsha C. Gay,
Information Technology Laboratory, WES.
During the course of the investigation, Messrs. James Joslin, Charles
Harbin, Millard Dowd, Richard Jackson, Francis Limbaker, and William McCollum
of SAC; Messrs. Douglas Cooke and Samuel Chappelear of the South Carolina
Wildlife and Marine Resources Department; and Mr. Ben Rizzo of the US Fish and
Wildlife Service visited WES to observe model operation and correlate results
with design studies.
At the time of publication of this report, Director of WES was
Dr. Robert W. Whalin. Commander was COL Leonard G. Hassell, EN.
I
CONTENTS
Page
PR EFA CE ................................................................ i
CONVERSION FACTORS, NON-SI TO SI (METRIC)UNITS OF MEASUREMENT ..................................................... 3
PART I: INTRODUCTION .................................................... 5
Background ........................................................Purpose and Scope of the Model Study ................................ 5
PART II: THE MODEL .................. ................................ 7
Description .......................................................... 7Model Appurtenances .................................................. 7Scale Relations ...................................................... 7
PART III: TESTS AND RESULTS ............................................... 12
Original Design ...................................................... 12Modifications to the Fish Lift Entrances ............................ 15
PART IV: CONCLUSIONS AND RECOMMENDATIONS ................................ 20
PHOTOS 1-15
PLATES 1-39
2

CONVERSION FACTORS, NON-SI TO Si (METRIC)
UNITS OF MEASUREMENT
Non-SI units of measurement used in this report can be converted to S1
(metric) units as follows:
Multiply By To Obtain
cubic feet 0.45359244 kilograms
feet 0.3048 metres
miles (US statute) 1.609344 kilometres

E N N NOR T H CAAR0OL1N A
SUMTER
Ar4AN r
COOPER RIVER REDIVERSION CANAL PROJECT
IER Igur 1.SO Vicnit anSlc Tion Hma
CANA DAMPOWEHOU4

ST. STEPHEN POWERHOUSE FISH LIFT
COOPER RIVER REDIVERSION PROJECT, SOUTH CAROLINA
Hydraulic Model Investigation
PART I: INTRODUCTION
Background
1. The St. Stephen Power Plant is located in Berkeley County, South
Carolina, approximately 1.9 miles* north of the town of St. Stephen (Fig-
ure 1). It is located in the rediversion canal connecting Lake Moultrie and
the Santee River. The powerhouse consists of three main units, each rated
28 Mw. The overall length of the powerhouse is 276 ft and the transverse
width is approximately 150 ft at the base.
2. The fish lift facilities, located on the north side of the power-
house, were intended to provide a means of transferring various species of
game and other desirable fish from the power plant tailrace canal to the
intake canal and Lake Moultrie. After several years of fish lift operation at
St. Stephen Powerhouse, it was determined that the present facilities were
inadequate for transferring the numbers and species of anadromous fish using
the St. Stephen tailrace as a migration route to Lake Mouitrie. The present
fish lift does not provide attraction flow in the tailrace area, where the
desired numbers of fish are likely to be drawn into the fish lift.
Purpose and Scope of the Model Study
3. The purpose of the study was to investigate various alternatives to
improve the fish attraction capabilities of the existing fish lift system.
Specific model tests were conducted to
a. Determine if increasing the attraction flow through the presentfish lift would provide the type flows necessary for properfish attraction.
b. Investigate means of relocating the fish lift entrances to
Non-SI units of measurement used in this report can be converted to SI
(metric) units as shown on page 3.
5

areas that would be more likely to attract migrating fish intothe fish lift system.
c. Determine if structural additions in the tailrace wouldadversely affect present hydraulic conditions in the tailracearea.
6

PART II: THE MODEL
Description
4. The model was constructed to an undistorted scale of 1:25 and repro-
duced about 1,700 ft of the tailrace topography, the downstream face of the
powerhouse, intake piers, spiral cases, draft tubes, and the existing fish
lift entrances. The tailrace walls, tailrace slab, downstream face of the
powerhouse, and portions of the fish lift were constructed of plastic-coated
ply-wood. The spiral cases, draft tubes, and fish lift entrance piers were
constructed of smooth Plexiglas. The downstream topography was constructed of
sand and cement mortar molded to sheet metal templates. Plate 1 is a layout
of the model. Figure 2 shows the mod-l. Figure 3 is a side view of an
intake, spiral case, and draft tube for a powerhouse unit.
Model F 2purtenances
5. Water used in operation of the model was supplied by a circulating
system. Discharges in the model were measured with venturi meters and propel-
ler type flowmeters installed in the inflow lines. Water-surface elevations
were measured with point gages. Average velocities were measured with a Nixon
streamflow series 400 propeller type flowmeter, mounted to permit measurement
of flow from any horizontal direction and at any depth. The tailwater eleva-
tion was maintained with an adjustable tailgate. Various flow conditions were
recorded photographically.
Scale Relations
6. The accepted equations of hydraulic similitude, based on the
Froudian criteria, were used to express mathematical relations between the
dimensions and hydraulic quantities of the model and prototype. General rela-
tions for the transference of model data to prototype equivalents are
presented in the following tabulation:
7

Scale RelationshipCharacteristic Dimension* Model:Prototype
Length Lr 1:25
Area A - L2 1:625r r
Velocity V - L1 1 2 1:5r r
Discharge Q - L5 / 2 1:3,125r r
Volume V - L3 1:15,625r r
Weight W - L3 1:15,625r r
Time T - LI/ 2 1:5r r
* Dimensions are in terms of length.
8

a. Looking upstream
El 4"
EL ... '0 .
b. Looking downstream
Figure 2. 1:25-scale model of St. StephenPowerhouse tailrace (Continued)

c. Looking upstream toward powerhouse and fish lift entrances
LI•r ENTANCE
•PTREAM FI•k
VF'TENTRME
d. Side view looking toward north wing wall and fish lift entrances
Figure 2. (Concluded)
10

,-4
I-4
44a
.0
I,)
ho

PART III: TESTS AND RESULTS
Original Design
Fish attraction flow of 240 cfs
7. Initial tests were conducted with the original design to determine
flow patterns in the tailrace with various combinations of powerhouse units
operating and a total fish attraction flow of 240 cfs through both fish
entrances. Photo I shows surface flow patterns in the tailrace with units 1,
2, and 3 operating with a total discharge of 24,500 cfs (8,166 cfs/unit), and
a tailwater elevation of 23.1.* The fish attraction flow of 240 cfs was con-
sidered a normal operating condition for these tests. For the initial tests,
a weir was not used in the fish entrances. The entrance was open from the
fish slab elevation of 4.0 to the water surface. A circulating, low-velocity
flow was present on the surface near the fish entrances. Surface flow
increased along the left (looking downstream) training wall as the training
wall intercepted the expanding flow from the boil at unit 3 and directed it
downstream. Slack-water areas formed behind and immediately downstream of
both training walls.
8. Velocity measurements recorded near the surface in the vicinity of
the fish lift entrances and along the fish slab are shown in Plates 2 and 3.
Return flow from the draft tube discharge caused upstream velocities in the
vicinity of both fish entrances and dominated flow patterns in this area. It
should be noted that all velocity measurements in this investigation are
average velocities. Velocities 50 and 125 ft downstream from the fish
entrances were in a downstream direction and higher than velocities at the
fish entrances. Flow conditions in these areas were the result of the draft
tube discharge at unit 3.
9. Tests were conducted with units I and 2 operating equally with a
total discharge of 16,400 cfs, a tailwater elevation of 20.8, and fish attrac-
tion discharge of 240 cfs. These flow conditions are shown in Photo 2. With
these conditions, flow exited the draft tubes and continued down the right
half of the channel. Some of the flow from the draft tube boil at unit 2
* All elevations (el) cited herein are in feet referred to the National
Geodetic Vertical Datum (NGVD).
12

spread toward the left training wall (north wing wall) forming an eddy at the
fish lift entrances and in the tailrace area downstream from unit 3. Smaller
eddies were observed downstream in the shear zone formed from the draft tube
discharge and upstream flow along the north (left) training wall. Approxi-
mately 1,000 ft downstream from the powerhouse, a slow upstream eddy was
present along the left bank toward the powerhouse.
10. Velocity measurements obtained near the surface with the flow con-
ditions shown in Photo 2 are shown in Plates 4 and 5. Velocities measured at
the fish entrances were generally in a downstream direction, but were low.
The velocities measured over the fish slab at distances of 50 and 125 ft down-
stream from the fish lift were all in an upstream direction and were less than
2.2 ft/sec.
11. Tests were then conducted with only unit I operating at a discharge
of 8,200 cfs, a tailwater elevation of 16.6, and a fish attraction discharge
of 240 cfs. With these conditions, flow exited the draft tubes and continued
down the right side of the channel for approximately 1,000 ft, at which point
an upstream eddy returned some of the flow along the left bank toward the
powerhouse and along the left training wall all the way to the fish entrances.
Photo 3 shows surface flow patterns for these conditions.
12. Velocities measured near the downstream fish entrance were gen-
erally in a downstream direction and higher than those observed with two and
three units operating, as shown in Plates 6 and 7. However, the upstream flow
from the large eddy caused the flow exiting the downstream fish entrance to
circulate in a tight eddy between the fish lift entrance and the left training
wall, and no velocities in a downstream direction were measured at distances
of 50 and 125 ft downstream from the fish entrances. Velocities measured near
the center of the upstream fish entrance were in a downstream direction.
Fish attraction flow of 500 cfs
13. To evaluate the effects of increased fish attraction flows, tests
were conducted with all three units operating with the appropriate tailwater
elevation and with 500 cfs discharging from the downstream fish entrance only.
A 500-cfs discharge through the present system would need to be supplied from
additional water sources other than the fish lift to prevent excessive turbu-
lence, which would be harmful to fish in the system. The upstream fish
entrance was closed for these tests. Surface flow patterns with all three
units operating are shown in Photo 4. Because of the configuration of the
13

fish lift, the flow discharging from unit 3 separated at the downstream end of
the fish lift, resulting in the formation of an eddy near the downstream fish
entrance. The flow pattern resulting from unit 3 operating also forced the
flow from the fish entrance against the left training wall.
14. Velocities measured with all three units operating and a fish
attraction discharge of 500 cfs for the downstream entrance only are shown in
Plates 8 and 9. The velocities measured near the center of the downstream
fish entrance were greater than 3.8 ft/sec, which was considerably higher than
those measured with a discharge of 240 cfs. Velocities 50 and 125 ft down-
stream from the fish lift entrance were comparable to those measured with a
discharge of 240 cfs from the fish lift, indicating that the draft tube dis-
charges dominate the flow patterns in these areas even with 500 cfs discharg-
ing from the fish lift entrance.
15. Surface flow patterns with units I and 2 operating and a fish
attraction discharge of 500 cfs (Photo 5) indicate eddy patterns similar to
those observed with a fish attraction discharge of 240 cfs (Photo 2). Veloci-
ties measured with units I and 2 operating and a discharge of 500 cfs are
shown in Plates 10 and 11. Velocities greater than 4.5 ft/sec were measured
near the center of the downstream fish entrance, but no velocities in the
downstream direction were measured over the fish slab at distances of 50 and
125 ft downstream from the fish lift entrance. The surface flow patterns and
velocity measurements indicate that an attraction flow of 500 cfs does not
result in downstream flow along the left training wall with units I and 2
operating.
16. Surface flow patterns with unit I operating with a fish attraction
discharge of 500 cfs are shown in Photo 6. Large eddies formed in the tail-
race area downstream from units 2 and 3, and flow was observed in the down-
stream direction along the left training wall. Velocities measured along the
fish slab are shown in Plates 12 and 13. Velocities measured near the center
of the downstream fish entrance were as high as 8.4 ft/sec, and velocities
were in the downstream direction 50 and 125 ft downstream from the fish
entrance near the training wall. This type of flow pattern along the left
training wall should be favorable for fish attraction; however, the velocities
at the entrance may be too high for the fish to enter the lift.
17. Photos 7 and 8 show a close-up of flow conditions near the fish
lift entrance with unit 1 operating at 8,200 cfs, a tailwater elevation of
14
16.6, and a fish attraction flow of 500 cfs. In Photo 7, only the downstream
fish entrance is open, whereas in Photo 8 both entrances are open. Photo 7
shows the eddy downstream of the fish entrance to be less concentrated and
further away from the training wall.
Modifications to the Fish Lift Entrances
18. The maximum flow that can presently be discharged through the
original design fish lift entrances without excessive turbulence during the
chamber filling operation is less than 240 cfs. The flow patterns and
velocity measurements obtained during the initial tests indicated that a much
greater discharge was needed to alter the circulation pattern in the tailrace
and produce downstream flows along the left training wall with either unit I
or units 1 and 2 operating. A discharge of 500 cfs from the fish lift pro-
duced flow in the downstream direction with only unit 1 operating. Testing
efforts were therefore directed toward developing modifications that moved the
entrances to the fish lift downstream to an area closer to the end of the left
training wall. These wall extensions did not cause a measurable rise in the
tailrace water-surface elevation or significantly increase velocities in the
tailrace area.
19. All tests of modifications to the fish lift entrances were con-
ducted with all three units operating equally at a powerhouse discharge of
21,300 cfs (7,100 cfs/unit) and a tailwater elevation of 26.0. Flow condi-
tions similar to these are normally experienced at St. Stephen Powerhouse
during the period of greatest fish migration. Therefore, the US Army Engineer
District, Charleston, and the US Army Engineer Waterways Experiment Station
(WES) agreed to use a discharge of 7,100 cfs/unit for the remainder of the
testing program. Total fish attraction flow was 500 cfs, and flow through the
fish entrances was controlled by a weir set at an elevation to produce an
average velocity of 5 ft/sec exiting the entrance. It was decided in a meet-
ing with personnel from the Charleston District, South Carolina Wildlife and
Marine Resources Department (SCWMRD), and US Fish and Wildlife Service (USFWS)
that an average velocity of 5 ft/sec exiting the fish entrance would be
required for attraction flow. For these tests, as in previous tests, with the
original design, the 500-cfs flow was supplied by a single pipe located far
enough upstream from the fish entrances to allow for smooth flow in the
15
modified fish channel and entrance, Flow patterns were determined only at the
new entrances and the areas downstream from these entrances.
TyRe I fish entrance modification
20. The type I entrance modification moved the downstream fish entrance
approximately 130 ft downstream from its original location, as shown in
Plate 14. This modification provided an 8-ft-wide entrance with attraction
flow discharging along the north wing wall in a downstream direction. The top
of the entrance weir was at el 13.5. Velocity measurements with the type I
entrance modification are shown in Plates 15 and 16. These velocities indi-
cated that flow in a downstream direction existed along the training wall
throughout the depth of flow and increased in magnitude near the surface. The
initial concept to attract fish was to provide an avenue of flow with a veloc-
ity higher than that of the tailrace flow from the powerhouse discharge. The
type I entrance modification did not provide these higher velocities.
TVDes 2. 3. and 4 fish entrance modifications
21. Types 2, 3, and 4 entrance modification concepts, shown in
Plates 17-19, were developed in a meeting between the Charleston District and
WES personnel. Since the type 2 and 3 modifications were similar to the
type I entrance modification, they were not tested because of the performance
of the type 1 entrance modification. Since the type 4 entrance modification
would require considerable excavation, it was decided to test methods that did
not require additional excavation.
jyRe 5 fish entrance modification
22. The type 5 entrance modification consisted of an 8-ft-wide fish
entrance located approximately 215 ft downstream from the original entrances,
as shown in Plate 20. The top of the entrance weir was at el 13.5. This
modification provided downstream attraction flow in the vicinity of the eddy
area near the end of the north wing wall. Velocity measurements, shown in
Plates 21 and 22, indicated that surface velocities downstream from the fish
entrance were higher than the velocity of the tailrace flow.
TyRe 6 fish entrance modification
23. The type 6 entrance modification (Plate 23) was tested to determine
the effect of directing attraction flow more toward the center of the tailrace
channel, but otherwise was identical to the type 5 entrance modification.
Velocity magnitudes (Plates 24 and 25) were similar to those measured with the
type 5 entrance modification in place, but flow patterns differed slightly'
16

because of the angle of the flow directed from the fish entrance. The
entrance weir elevation was at 13.5. Velocities along the left bank were
lower with the type 6 entrance modification.
Type 7 fish entrance modification
24. The type 7 entrance modification, shown in Plate 26, consisted of
two fish entrances. The upstream entrance was 6 ft wide and located at the
downstream end of the present north wing wall. The top of the entrance weir
was at el 19.3. Approximately 40 percent of the fish attraction flow
(200 cfs) discharged from this entrance. Attraction flow was released toward
the left bank of the tailrace channel. The downstream fish entrance was 8 ft
wide and located 25 ft from the end of the north wing wall. The top of the
entrance weir was at el 18.5. Approximately 60 percent (300 cfs) of fish
attraction flow discharged from this entrance. This modification provided
attraction flow directly to the eddy area behind the north wing wall through
the 6-ft-wide entrance. Velocities with the type 7 entrance modification are
shown in Plates 27 and 28. The surface velocities on the left bank could be
excessive for the existing bank protection.
Tv~es 8. 9. and 10 fish entrance modifications
25. Further testing consisted of installing various types of wall
extensions to cut off eddy areas behind and downstream of both tailrace wing
walls. These walls were used as additions to the types 8, 9, and 10 entrance
modifications. These modifications were designed to provide downstream flow
along a wall to at least one fish entrance. It was decided in the previously
mentioned meeting with the Charleston District, SCWMRD, and USFWS that down-
stream flow along a wall leading to a fish entrance was an important design
feature even when velocities along the wall were lower than the velocity of
the tailrace flow from the powerhouse units.
26. The type 8 entrance modification (Plate 29) was a refined version
of the type 1 entrance modification. The downstream fish entrance was
extended approximately 88 ft downstream to a point just beyond the area in the
tailrace where the flow from the boil caused by the unit 3 discharge travels
in a downstream direction along the north training wall. This modification
provided flow along the training wall and could also be beneficial to fish
traveling up the right side of the channel and across the tailrace. The top
of the entrance weir was at el 13.5. Velocities measured with the type 8
entrance modification are shown in Plates 30 and 31. Photo 9 shows the
17

surface flow conditions with the type 8 entrance modification in place. Flow
patterns and velocities measured at various depths inside the north wing wall
were in a downstream direction.
27. There was concern that fish might remain in the low-velocity circu-
lating flow behind the north wing wall. A wall was installed from the end of
the north wing wall to the left bank, shown in Plate 32. Surface velocities
with the type 8 entrance modification in place and the wall blocking off the
eddy area behind the north wing wall are also shown in Plate 32. This type
wall caused only slight changes in the flow patterns, and velocity magnitudes
were the same as without the wall. The eddy area was still present downstream
from the wing wall.
28. The north wing wall was extended 300 ft downstream to the left berm
with the top of the wall extension at el 26. Photo 10 shows surface flow
patterns with the type 8 entrance modification and the wall extension in
place. This extension to the north wing wall prevented the eddies from
developing behind and downstream of the original wing wall, as can be seen by
comparing Photos 9 and 10. Flow along the wall extension was in a downstream
direction.
29. The type 9 entrance modification (Plate 33) provided two fish
entrances. The upstream entrance was 8 ft wide and located approximately
88 ft downstream from the present fish entrances. Approximately 380 cfs or
76 percent of the fish attraction flow passed through this entrance. The top
of the entrance weir was at el 16. The downstream entrance was 6 ft wide and
located approximately 130 ft downstream of the present entrances at the bend
of the north wing wall. Attraction flow through this entrance was approxi-
mately 120 cfs or 24 percent of the total attraction flow, and the top of the
fish entrance weir was set at el 21. Plates 34 and 35 show velocity measure-
ments with the type 9 entrance modification, and Photo 11 shows surface flow
conditions with this modification in place. This modification provided down-
stream flow along training walls leading to both fish entrances.
30. To investigate the effect of preventing the low-velocity eddy from
developing behind both the north wing wall and the south training wall, the
wall modifications shown in Plate 36 were tested. The north wing wall exten-
sion was the same as tested with the type 8 entrance modification. The south
training wall was extended 337.5 ft downstream and a wing wall 195 ft long was
angled to the top of the right bank berm at el 26. The extension to the south
18

training wall eliminated a large eddy and slack-water area that formed behind
the original training wall and down the right bank of the tailrace canal. The
extension to the north wing wall eliminated the eddy along the left bank
previously observed with the type 8 entrance modification in place. Flow
conditions with the type 9 entrance modification and the wall modifications to
both the north wing wall and south training wall are shown in Photo 12. The
tailwater elevation was lowered to 24.25 to prevent overtopping of the south
wing wall. No eddies were observed with this flow condition.
31. The extension on the south wing wall was removed to observe flow
conditions in the tailrace area with the type 9 entrance modification and the
north wing wall extension in place. As seen in Photo 13, the wing wall exten-
sion eliminated the eddy from forming along the left bank. However, eddies
did develop behind the south training wall and along the right bank.
32. In the type 10 entrance modification (Plate 37), the 6-ft-wide fish
entrarce in the type 9 entrance modification was moved to the end of the north
wing wall in an attempt to provide attraction flows in the vicinity of the
downstream end of the wing wall. This entrance was approximately 215 ft down-
stream from the present fish entrances. The weir elevation was the same as
with the type 9 entrance modification and the flow distribution through the
entrances was approximately the same. The type 10 entrance modification com-
bined the features from the type 8 and type 5 entrance modifications. The 6-
ft-wide downstream entrance supplied fish attraction flow in the vicinity of
the'eddy area behind and downstream from the north wing wall. The 8-ft-wide
upstream entrance may be helpful in intercepting migrating fish that move
upstream along the south side of the channel and cross over to the north side
of the tailrace canal. Velocity measurements with type 10 entrance modifica-
tion in place are shown in Plates 38 and 39.
33, Photo 14 shows flow conditions for the type 10 entrance modifica-
tion with and without wing wall additions. The north wing wall additions did
prevent the eddy from forming behind the wing wall; however, an eddy still
formed downstream along the left bank. Photo 15 shows surface flow conditions
with the type 10 entrance modification in place and the 300-ft extension to
the north wing wall. As in previous tests with the type 9 entrance modifica-
tion (Photo 13), flow was trained in a downstream direction along the wall,
eliminating eddies along this portion of the left bank of the tailrace canal.
19

PART IV: CONCLUSIONS AND RECOMMENDATIONS
34. The flow patterns and velocity measurements recorded during initial
tests indicated a discharge of at least 500 cfs through the original design
fish entrances was needed to produce desired flow conditions for fish attrac-
tion. A 500-cfs discharge through the present fish lift system would create
excessive turbulence during the chawber filling operation resulting in harm to
the fish within the system.
35. Tests were conducted with wall extensions along the fish slab to
move fish lift entrances to areas where flow would discharge through the
entrances and continue in a downstream direction. These tests were conducted
with the three turbine units operating at equal discharges. The recommended
discharges through the fish entrances for these modifications was 500 cfs.
Flow at the fish entrances was controlled by a weir set at an elevation to
produce an average velocity of 5 ft/sec. These modifications to the fish lift
entrances varied the locations of the entrances (a distance of 88 ft to
240 ft) downstream of the original design entrances. Some modifications pro-
vided one entrance (types 1, 3, 5, 6, and 8), while others were designed with
two entrances (types 2, 4, 7, 9, and 10).
36. Wall extensions to the existing wing walls were placed in the model
to eliminate dead areas and eddies along the left and right banks downstream
of and behind existing walls. These walls trained the flow from the power-
house and fish entrances in a downstream direction. A wall from the end of
the north wing wall to a point approximately perpendicular to the left bank
was tested to eliminate the eddy area behind the north wing wall. This type
wall extension only relocated the eddy to an area just downstream of the new
wall.
37. The wall additions to the fish slab did not adversely affect
hydraulic conditions in the tailrace area. There was no significantly mea-
surable increase in water-surface elevations downstream of the draft tube out-
lets. Velocity magnitudes and distribution were also approximately the same
over the tailrace slab and downstream riprap protection.
38. The recommended design for improving fish attraction capabilities
is the type 9 entrance modification. This modification provided for two fish
entrances. The upstream entrance was located approximately 88 ft downstream
of the present fish entrances. This placed the upstream entrance as close to
20

the powerhouse as possible, yet at a point far enough downstream where the
boil from unit 3 discharge would not adversely affect flow conditions at the
entrance. This entrance could also be beneficial in intercepting fish that
move across from the south side of the tailrace. The downstream entrance of
the type 9 entrance modification was located approximately 130 ft downstream
of the present entrances at the bend of the north wing wall. This provided an
entrance in an area of lower velocity than the upstream entrance and would
benefit species of fish that prefer slower, less turbulent flow. Downstream
flow along walls leading to both entrances was provided in the type 9 entranie
modification.
21

Photo 1. Surface flow patterns, original design, discharge24,500 cfs, tailwater el 23.1, fish attraction flow 240 cfs,
units 1, 2, and 3 operating
Photo 2. Sorfrc2e flow patterns, original design, discharge16,400 cfs, tailwater el 20.8, fish attraction flow 240 cfs,
units I Pnd 2 operating

Photo 3. Surface flow patterns, original design, discharge8,200 cfs, tailwater el 16.6, fish attraction flow 240 cfs,
unit 1 operating
Photo 4. Surface flow patterns, original design, discharge24,500 cfs, tailwater el 23.1, fish attraction flow 500 cfs(downstream fish entrance only), units 1, 2, and 3 operating

Photo 5. Surface flow patterns, original design, discharge16,400 cfs, tailwater el 20.8, fish attraction flow 500 cfs
(downstream fish entrance only), units I and 2 operating
Photo 6. Surface flow patterns, original design, discharge8,200 cfs, tailwater el 16.6, fish attraction flow 500 cfs
(downstream fish entrance only), unit I operating
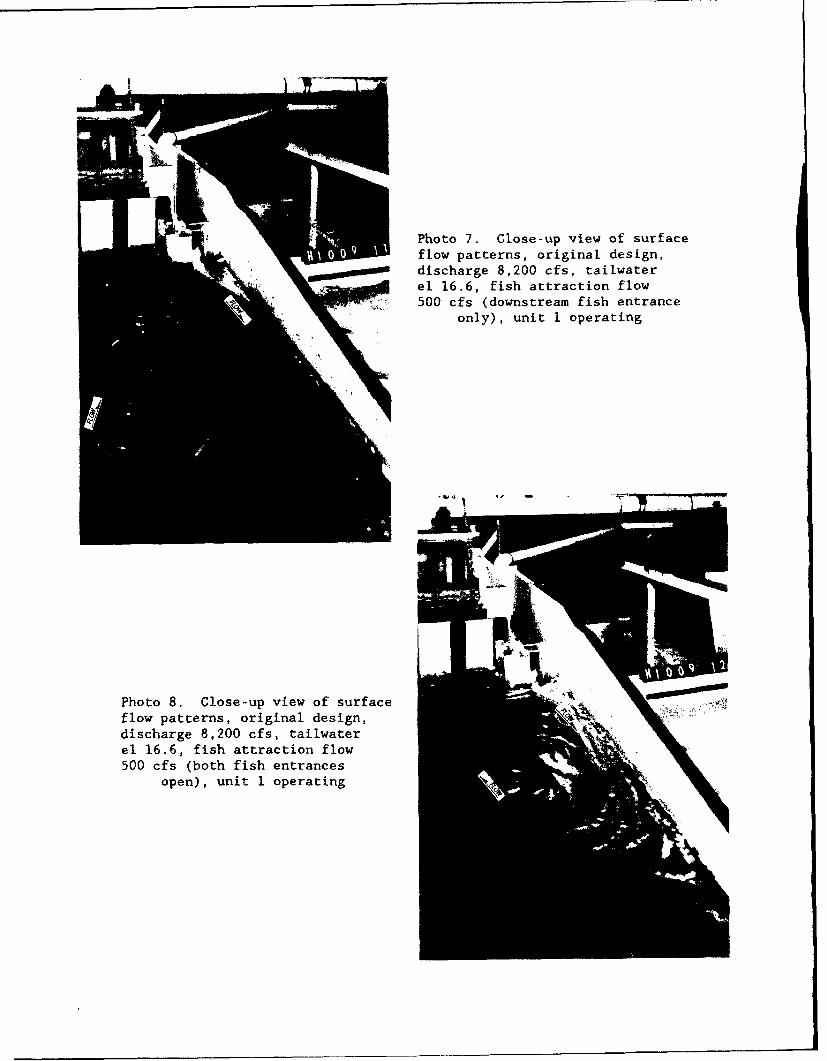
Photo 7. Close-up view of surfaceflow patterns, original design,discharge 8,200 cfs, tailwaterel 16.6, fish attraction flow
. . 500 cfs (downstream fish entranceonly), unit 1 operating
Photo 8. Close-up view of surfaceflow patterns, original design,discharge 8,200 cfs, tailwaterel 16.6, fish attraction flow500 cfs (both fish entrances
open), unit 1 operating

Photo 9. Surface flow patterns, type 8 entrance modification,discharge 7,100 cfs per unit, tailwater el 26.0, fish attrac-
tion flow 500 cfs, units 1, 2, and 3 operating
Photo 10. Surface flow patterns, type 8 entrance modification, northwing wall extended 300 ft, discharge 7,100 cfs per unit, tailwater
el 26.0, fish attraction flow 500 cfs, units 1, 2, and 3 operating

Photo 11. Surface flow patterns, type 9 entrance modification,discharge 7,100 cfs per unit, tailwater el 26.0, fish attrac-
tion flow 500 cfs, units 1, 2, and 3 operatingM 'MAN
Photo 12. Surface flow patterns, type 9 entrance modification, northand south wing walls extended, discharge 7,100 cfs per unit, tailwater
el 24.25, fish attraction flow 500 cfs, units 1, 2, and 3 operating

Photo 13. Surface flow patterns, type 9 entrance modification, northwing wall extended 300 ft, discharge 7,100 cfs per unit, tailwater
el 26.0, fish attraction flow 500 cfs, units 1, 2, and 3 operating

a. With wing wall addition
b. Without wing wall addition
Photo 14. Surface flow patterns, type 10 entrance modification, withand without north wing wall extension, discharge 7,100 cfs per unit,tailwater el 26.0, fish attraction flow 500 cfs, units 1, 2, and
3 operating

Photo 15. Surface flow patterns, type 10 entrance modification, northwing wall extended 300 ft, discharge 7,100 cfs per unit, tailwater
el 26.0, fish attraction flow 500 cfs, units 1, 2, and 3 operating

LLZ
w
-zwL50
-jw
w
z
) toll
SEd
PLAED

cc
_3 U-00 .
z <~C~ <LU -g
wz3-0 J
w ~Z<(Ju- w
0' CA 0
CID <I
C.) V)
00
Nw
cl a:
I-
wNl >
I0U)
at ZU
-J ~0-
z
PLATE 2

0WU) -j
Qc z N ~
-J -J r C
-J * _j uj <
LL- F- I
a: o r L
00
0Ed w cL
> m
-Zi
zr- 0
(0 0U)U
LU 0I0LU)
U-
w
U)U)
0ric -z
PLTw

z
w-1 0- L
a: 0 0U LL
i~~j -J Wr~ wr
- 0a LU<LL >-0
0_
43D Co >'
o 66!5
00z
U) W
w euj
LU.
wC\! w
0w
PLATEt

0
w
zU C- Y co-JU
oe C/)to woL 01 -J
~(D 0 W<0 LP
~cýJ <. 00 - :
CC-)
ZI
0.
I.LU-
V,)
w
0U)Lu
LU
0
PLATE5

0WC.z ) -4
CC r z 0- j rz< :IL:
Z :-< M.)0) ar 8 )3LL j <U _5
-t 0-4j
0 C~0
N z0
N ZO W
N 0t (I)
0..zLL
-r 0
LU.
(0
PLATEw

U)T- LL
i L
<Q0 u.ul
w -j ci' ZL
WL (nZW(z < LLOL
ýj <U -j
w 0<i~
0 cr M: 0
>M >
04 C~0
z0
C4 M)
U)Lu
0~0~ccM
00
PLAT

tWWU
00 -
C/) z Nl un <-
a: ej 0 L4 - ~-J wUC
U)) a:
_j-Z U
Z.) 0nL F I
(V) -
a- 8~ < - v
00
00j
U)
ou
-I w
0 7
z00
fuLu
LU
z
PLATE

a:t z )n
CLt
- D - 3: co,
z j 0U)-J w
cnw 0
00
0w r
I-
zw
(1)
w
i~z w
0
z
PLATE9

C,
zz c
00 -JN~J L
043
W-J -Zwz < (/ o
zz
<0w
CLU
o u0
0 I-0-I w
LU
ILL
zLU
LU
I- 0
LiU
0z
PLATE 10

z
w0
IW 9 3, '>uo t0 1 w
- 0 0<_jn
00 1
0 0 C0
co 0
41 w
o IL
-J wC.) .I U-
z
(00
PLAT

uj0
0 C)
Irw -i a< U)
0) C'6 z
,L - t- U)
00< J
W >
0 I
z0
-JLUU)
,Il U )w
cc w
"-J(/) w
>-0zn
PLATE 1

z
0 o wUl) z U)wý
j~ -J
w (j uU
zz
0 L
wLLnza
coz
Xw
NU
0w
0(0 cz
PLTE1

z0
C-,
0
z4:
zLU
1w
a_
A0
PLATE 14

00CLU- Cozj_
LLcqOZ cwi[oCt u
< U)Z
W < 0 Z W
Wwcco w j)~>o-cD m
0<VdwU2 ýWZ
0- iJCVU
-A.
LU)
z0U)
wL0
Ix 9ww
U)wt:0
X 0
I-j0z
PLATE 15

ci,LL
z
zC) W)
>10 Z-jNj Z j CM7~,
0~~ LL 0. cr jo
Q ZEri L
C.))
u) Z
--w J
< LL O
z0L)
cc,
o-
X LU
w
tLJ 0
PLATE 16

z0
U-
50
wz
zwC14LUJ
a-
PLATE 17

z0
0
0
wzcczwCV)w
C LZ-
-J-
U.,A
PLATE 18

z0I-
0
wz
I-z
w
!5~
C14 wwco
ti,
PLATE 19

z0
C-)
5L0
wC0z
zwCL
Ui
z~u
PLATE 2

zko 0o
0C) ' z crWL
0i (-) £i Ow
ui 5 (>~0 (6 W
< C
w
to > >z :ý
C-)LL L,
W W:E
I-.-
z0
LU
w
X 0
w
UA 0z
PLATE 21

U-z
C¶z < w-
C- QZcr LL
cw-c-4 ~w o 2w 0 u
) <
zz-4O WU
> o-r
Ui Le z cl Fn
0 L
Cc
wLL
zz
U,
00
LPLATE 22

z0
LL
0
z
I-<
zCo
00
w
!5Z
SS
PLATE 23

C0z
o wU
U,'
o o -
( 0 W Lu~
LU (wUi C-) rcr-<
z I
-J & W EL
0 j
U) 3
i-
ILL
w
15 LLz
w
0
z
PLATE 24

't C.)
U.
z -~HL
o j N0w
j<0 iU, ZJ -
DDw z in~
W Qw 08CZLU("47 > ý- -:r0..
ci id W z Clk0 -I ý
HaNL
L) <w
wa-0-wwL-Kz
w
0
U- >
CE z
PLATE 25

z0
0
w0)z
Ul z
cn
a.U-1
ýEu'
PLATE 26

z9UVwý
< ir1-5~
UnI- c o (
- - w
j~ 0..i ol j uj10<0u
W -W- WC
LUOW
0 U
00
icw-a-4 :Ina
w
0.ul
ILcc z
z
NLU)
>
U) 0tu LZ
cr u z
PLATE 27

"'~ C CI)J 2~w
0 L C)c
o Zir
(M U- N 0 0 Z
UJ 0W uj
OYc(LL
c) F
v-: C,) c
(L/) z /
0 U
00
za
w
z
w
CA)
0I
PLATE 2

z0
0
0
zcr-zwcow
CLI-
PLT 29.

Z1-1SXWl:C,)
U- C
z
a:~
> .t-0 .O Lz C0 u
Cl! ~ ~ ~ 0!L ý(
(LJ (D Oz L Lr I
11 ý
0-I
IvNJ
COo
C~C4
0~
W-cc
zw
'P2 0
z
PLATE 30

(n
I0
U..
()0 ' LCH
< z L-
ZL C)6o
wW.0 w-p < c0< i Z
~~W D r - (01--0) J)< .
cl Z LT
(\J IP ID .
-~mf1IJJ)
.rn Cc)0
000
(0
W w
wz
zw
0
W.:z
PLATE 31

zo
W- 0 (Di-~
<~w 0 -J -
0U)a0ioU)C
0 =<cw r c
C,) j Z
CS LL Mzj<0L)c)LzUc.uj 0(>w-ý Lu
Z ) ,)w ý
N -J ~l w
a.a
LAT? 32

z0
Lii
0
z
zw0)
ww
zi --
A Q_~
Uj T zl
PLATE 33

0 L ,
k1) 0 a:I
0 1
WOL L _fl~j
(n agr F-.
< t-
-J 9L X U)
J' <0 )cnU*l 2ic C-
>. 0 -0 <L~
ww
U CC r<oWU
~30 0-
LLJ~ Q
4 ~:LLJ zQ.
PLATE 3

(I)
z '-
tin W Ccr <wc
-w
d C. w (-) Z 0
z-zu
Uý4 0 0 ~ J)L
04 N-ý-U)C
<0_z ) oa00
CL
0~CC.
PL w
o zLLzw
(0
ktu za.1
PLATE 35

z0(1)zI w
-J w
00
z
w
'a:z
co 0 4
t t
PLAT 36 -

z0
0
w
zw CJ)K7 )Cz
wa.
LUJQ~
2t'
CUl
3i
7c
EE
PLTE3

z) -u
z wz
< rw cr
< a- - ý< uwL ui i .10 vý Z Z-) zu)
0 c0 J <
4. Z a: <W U.0
Q : /)U
0- z 6 C-
U') .:~ co j
-:E 0-
0 LL
(r cC') -. (n
WWH
Co o"
ccw
w ý-
~~C)rw w
w
0.z z
PLATE 3

Z 0,
z
O0 ' CcW
w Cu : c
'fl (~)0 QZ ,LL ). w0~ 0 <
u~oai-
**w
Co 4 -W-J )
/i C C n Le,1 Ul j L3
*r oua.W F
~OLL WWmc', Hnr
ONlqccý
* C6i C10c yý
0 L
0N ow
C') lV
NW
q Clw
z
PLTE3
Form ApprovedREPORT DOCUMENTATION PAGE oMB No 0704-0188Publc reporting burden for this collection of information is estimated to average 1 hour oer reipOnse. including the time for (evievirng instrucltons ,earchnq ersting data tourýet.
gatheing and ma�lntamlnin the data needed, and completing and reviewing the collection of Information Send comments regarding this burden estimate or any other asoect of thiscollection of informatin, including tuggestion; for reduing this Ourden to WasheNgton Head•uartert Ser•uies. O,recorate for information Ooeration, and Reodls. r2 S letetonDavis Highway. Suite 1204. Arlington, VA 22202-4302, and to the Office of Management and Budget. Paperwori Reduction Project (0704.0 89). Washington, DC 20503
1. AGENCY USE ONLY (Leave blank) 2. REPORT DATE 3. REPORT TYPE AND DATES COVEREDMarch 1993 Final Report
4. TITLE AND SUBTITLE S. FUNDING NUMBERS
St. Stephen Powerhouse Fish Lift, Cooper River RediversionProject, South Carolina; Hydraulic Model Investigation6. AUTHOR(S)
Thomas E. Murphy, Jr.John E. Hite, Jr.
7. PERFORMING ORGANIZATION NAME(S) AND ADORESS(ES) 8. PERFORMING ORGANIZATIONREPORT NUMBER
USAE Waterways Experiment Station, Hydraulics Technical ReportLaboratory, 3909 Halls Ferry Road, Vicksburg, MS HL-93-139180-6199
9. SPONSORING/MONITORING AGENCY NAME(S) AND ADDRESS(ES) 10. SPONSORING/MONITORINGAGENCY REPORT NUMBER
USAE Districi, Char!eston, PO Box 919,Charleston, SC 29402-0919
11. SUPPLEMENTARY NOTES
Available from National Technical Information Service, 5285 Port Royal Road, Springfield, VA 22161.
12a. DISTRIBUTION/ AVAILABILITY STATEMENT 12b. DISTRIBUTION CODE
Approved for public release; distribution is unlimited.
13. ABSTRACT (Maximum 200 words)The St. Stephen Power Plant is located in Berkeley County, South Carolina, approximately 1.9 miles north
of the town of St. Stephen. It is located in the rediversion canal connecting Lake Moultrie and the Santee River.Included in the project is a reinforced concrete fish lift structure located on the north side of the powerhouse. Thepresent fish lift structure does not provide sufficient attraction flow in the tailrace area, where the desired numbersof fish are likely to be drawn into the fish lift system.
Tests were conducted on a 1:25-scale model of the powerhouse, fish lift entrances, and downstream tail-race canal. The purpose of the study was to investigate various alternatives to improve the fish attraction capabili-ties of the existing fish lift system. Walls were extended downstream from the original design fish lift to providenew entrance locations in areas more suitably located for fish attraction. The type 9 entrance modification is therecommended design. This modification provided for two fish entrances. The upstream entrance was locatedapproximately 88 ft downstream of the present fish entrances, and the downstream entrance was located approxi-mately 130 ft downstream of the present fish entrances at the bend of the north wing wall. Both entrances pro-vided downstream flow along a wall leading to the entrance.
14. SUBJECT TERMS 15. NUMBER OF PAGESDraft tubes Powerhouse 72Fish lift Tailrace canal 16. PRICE CODEHydraulic models17. SECURITY CLASSIFICATION 18. SECURITY CLASSIFICATION 19. SECURITY CLASSIFICATION 20. LIMITATION OF ABSTRACT
OF REPORT OF THIS PAGE OF ABSTRACT
UNCLASSIFIED UNCLASSIFIED I IINSN 7540-01-280-5500 Standard Form 298 (Rev 2 89)
P90 102dt AYýd 91