st QUARTER 2018 - 4-traders.com KGaA_1… · OLED materials for displays and lighting applications...
58
1 st QUARTER 2018 Quarterly Statement
Transcript of st QUARTER 2018 - 4-traders.com KGaA_1… · OLED materials for displays and lighting applications...
1st QUARTER 2018
Quarterly Statement
2 Quarterly Statement as of March 31, 2018 Table of Contents
Table of Contents
03 Merck – In brief
04 Our Shares
05 Fundamental Information about the Group05 Merck09 Research and Development
12 Course of Business and Economic Position12 Merck19 Healthcare25 Life Science29 Performance Materials33 Corporate and Other
34 Outlook
37 Supplemental Financial Information38 Consolidated Income Statement39 Consolidated Statement of Comprehensive Income40 Consolidated Balance Sheet41 Consolidated Cash Flow Statement42 Consolidated Statement of Changes in Net Equity44 Information by Business Sector47 Effectsofnewfinancialreportingstandards55 Significanteventsduringthereportingperiod56 Subsequent events
58 Financial Calendar
This document is a quarterly statement pursuant to section 53 of the Exchange Rules for the Frankfurt Stock Exchange.
ThisquarterlystatementcontainscertainfinancialindicatorssuchasEBITDApre,businessfreecashflow(BFCF),netfinan-cialdebtandearningspersharepre,whicharenotdefinedbyInternationalFinancialReportingStandards(IFRS).Thesefinancialindicatorsshouldnotbetakenintoaccountinorderto assess the performance of Merck in isolation or used as an alternativetothefinancialindicatorspresentedintheconsoli-datedfinancialstatementsanddeterminedinaccordancewithIFRS.
Thefigurespresentedinthisquarterlystatementhavebeenrounded. This may lead to individual values not adding up to the totals presented.
The Annual Report for 2017 has been optimized for mobile devices and is available on the Web at ar.merckgroup.com/2017/
3Quarterly Statement as of March 31, 2018 Merck – In brief
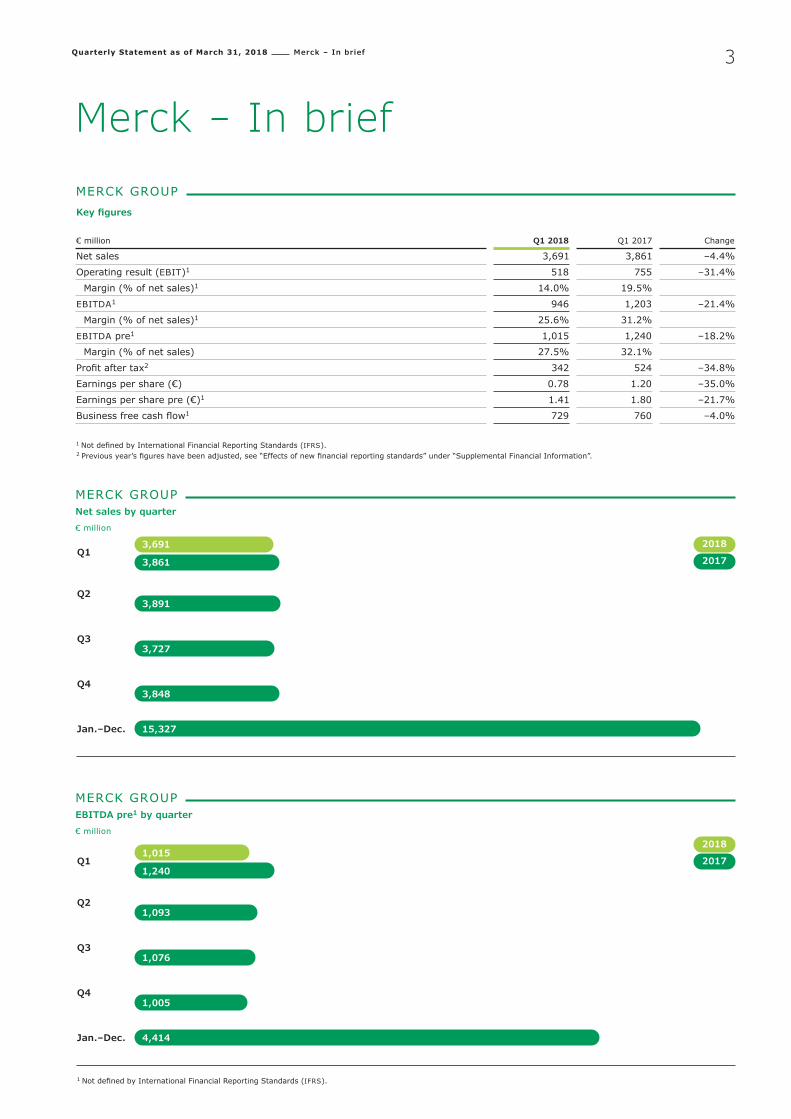
Merck – In briefMERCK GROUP Key figures
€ million Q1 2018 Q1 2017 Change
Net sales 3,691 3,861 –4.4%
Operatingresult(EBIT)1 518 755 –31.4%
Margin(%ofnetsales)1 14.0% 19.5%
EBITDA1 946 1,203 –21.4%
Margin(%ofnetsales)1 25.6% 31.2%
EBITDA pre1 1,015 1,240 –18.2%
Margin(%ofnetsales) 27.5% 32.1%
Profitaftertax2 342 524 –34.8%
Earningspershare(€) 0.78 1.20 –35.0%
Earningspersharepre(€)1 1.41 1.80 –21.7%
Businessfreecashflow1 729 760 –4.0%
1 NotdefinedbyInternationalFinancialReportingStandards(IFRS).2 Previousyear’sfigureshavebeenadjusted,see“Effectsofnewfinancialreportingstandards”under“SupplementalFinancialInformation”.
Q1
Q1
Q2
Q2
Q3
Q3
Q4
Q4
Jan.–Dec.
Jan.–Dec.
3,691 2018
2018
2017
20171,015
12,845
12,845
12,845
12,845
12,845
12,845
MERCK GROUP Net sales by quarter
€ million
MERCK GROUP EBITDA pre1 by quarter
€ million
3,861
1,240
3,891
1,093
3,727
1,076
3,848
1,005
15,327
4,414
1 NotdefinedbyInternationalFinancialReportingStandards(IFRS).
4 Quarterly Statement as of 2018 Our Shares
Our Shares
At a glance
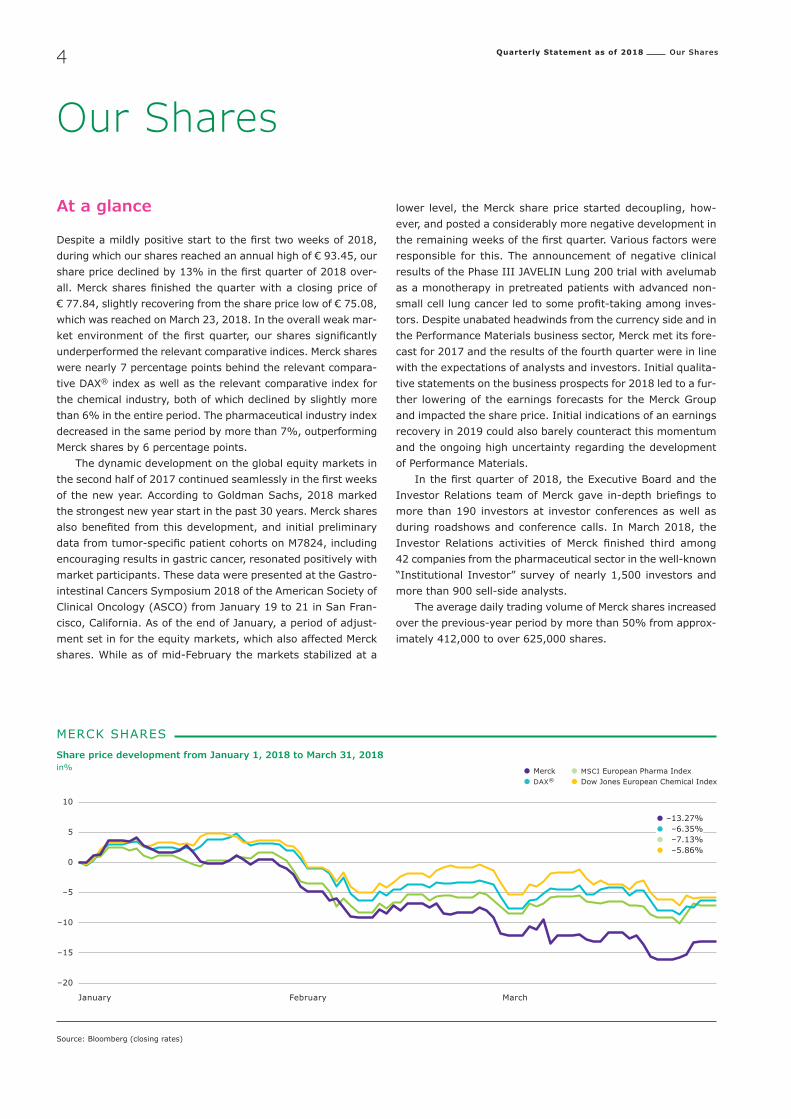
Despiteamildlypositivestarttothefirsttwoweeksof2018,during which our shares reached an annual high of € 93.45, our sharepricedeclinedby13%inthefirstquarterof2018over-all.Mercksharesfinishedthequarterwithaclosingpriceof€ 77.84, slightly recovering from the share price low of € 75.08, which was reached on March 23, 2018. In the overall weak mar-ketenvironmentofthefirstquarter,oursharessignificantlyunderperformed the relevant comparative indices. Merck shares were nearly 7 percentage points behind the relevant compara-tive DAX® index as well as the relevant comparative index for the chemical industry, both of which declined by slightly more than 6% in the entire period. The pharmaceutical industry index decreased in the same period by more than 7%, outperforming Merck shares by 6 percentage points.
The dynamic development on the global equity markets in thesecondhalfof2017continuedseamlesslyinthefirstweeksof the new year. According to Goldman Sachs, 2018 marked the strongest new year start in the past 30 years. Merck shares alsobenefitedfromthisdevelopment,andinitialpreliminarydatafromtumor-specificpatientcohortsonM7824,includingencouraging results in gastric cancer, resonated positively with market participants. These data were presented at the Gastro-intestinal Cancers Symposium 2018 of the American Society of ClinicalOncology(ASCO)fromJanuary19to21inSanFran-cisco,California.AsoftheendofJanuary,aperiodofadjust-ment set in for the equity markets, which also affected Merck shares. While as of mid-February the markets stabilized at a
lower level, the Merck share price started decoupling, how-ever, and posted a considerably more negative development in theremainingweeksofthefirstquarter.Variousfactorswereresponsible for this. The announcement of negative clinical resultsofthePhaseIIIJAVELINLung200trialwithavelumabas a monotherapy in pretreated patients with advanced non-smallcelllungcancerledtosomeprofit-takingamonginves-tors. Despite unabated headwinds from the currency side and in the Performance Materials business sector, Merck met its fore-cast for 2017 and the results of the fourth quarter were in line with the expectations of analysts and investors. Initial qualita-tive statements on the business prospects for 2018 led to a fur-ther lowering of the earnings forecasts for the Merck Group and impacted the share price. Initial indications of an earnings recovery in 2019 could also barely counteract this momentum and the ongoing high uncertainty regarding the development of Performance Materials.
Inthefirstquarterof2018,theExecutiveBoardandtheInvestorRelationsteamofMerckgavein-depthbriefingstomore than 190 investors at investor conferences as well as during roadshows and conference calls. In March 2018, the Investor Relations activities ofMerck finished third among42 companies from the pharmaceutical sector in the well-known “InstitutionalInvestor”surveyofnearly1,500investorsandmore than 900 sell-side analysts.
The average daily trading volume of Merck shares increased over the previous-year period by more than 50% from approx-imately 412,000 to over 625,000 shares.
10
5
0
–5
–10
–15
–20
Source:Bloomberg(closingrates)
MERCK SHARES Share price development from January 1, 2018 to March 31, 2018in% • Merck
• DAX®• MSCI European Pharma Index
•DowJonesEuropeanChemicalIndex
• –13.27%• –6.35%• –7.13%• –5.86%
January February March

Quarterly Statement as of March 31, 2018 Fundamental Information about the Group Merck 5
Fundamental Information about the Group
Merck
We are a global science and technology company headquar-tered in Darmstadt, Germany. Founded in 1668, our history of 350 years makes us the world’s oldest pharmaceutical and chemical company. In line with our strategic direction, Merck comprises three business sectors: Healthcare, Life Science, and Performance Materials.
In our Healthcare business sector, patients are in the fore-ground. We discover, develop and manufacture prescription medicines used to treat cancer, multiple sclerosis, and infer-tility, among other things. Our products help millions of peo-ple around the world.
In Life Science, we provide scientists and researchers with laboratory tools and equipment, materials, advanced technolo-gies, and services. Our aim is to make research discovery and biomanufacturing easier, faster and more effective.
Performance Materials develops specialty chemicals and solutions for demanding applications – from liquid crystals and OLED materials for displays and lighting applications to effect pigments for coatings for coatings and cosmetics up to high-tech materials for the manufacture of integrated circuits.
We hold the global rights to the Merck name and brand. The only exceptions are Canada and the United States. In these countries, we operate as EMD Serono in the Biopharma busi-ness, as MilliporeSigma in the Life Science business and as EMD Performance Materials in the materials business.
Apartfromourthreebusinesssectors,ourfinancialreport-ingpresents thefiveregionsEurope,NorthAmerica,Asia-Pacific(APAC),LatinAmericaaswellasMiddleEastandAfrica(MEA).
We had 53,358 employees worldwide on March 31, 2018, which compares with 51,480 on March 31, 2017.
A detailed description of Merck and its business sectors can be found in the Annual Report for 2017 starting on page 57. This section of the present quarterly statement summarizes the highlights of the first quarter of 2018 at Merck.
MERCK GROUP Net sales by business sector – Q1 2018€ million/in % of net sales
40% Life Science
1,487
15% Performance Materials
564 45% Healthcare
1,640
MERCK GROUP EBITDA pre1 by business sector2 – Q1 2018€ million / in %
42% Life Science
455
18% Performance Materials
196 40% Healthcare
430
1 NotdefinedbyInternationalFinancialReportingStandards(IFRS).2 Not presented: Decline in Group EBITDA pre by € –66 million due to Corporate and Other.
Quarterly Statement as of March 31, 2018 Fundamental Information about the Group Merck6
Healthcare
The Healthcare business sector comprises the Biopharma, Consumer Health and Allergopharma businesses. The share of Group sales attributable to the Healthcare business sector was45%inthefirstquarterof2018andtheshareofEBITDApre(excludingCorporateandOther)was40%.
BIOPHARMA
Oncology and Immuno-OncologyOn March 1, the United Kingdom’s National Institute for Health and Care Excellence issued a Final Appraisal Determination that recommends avelumab for treating adults with metastatic MerkelCellCarcinoma(mMCC).Avelumabisrecommendedfor routine National Health Service use in England, Wales and Northern Ireland for treating mMCC in adults, only if they have had one or more lines of chemotherapy for metastatic disease. Avelumab is recommended for use in England within the Can-cer Drugs Fund for treating mMCC in adults only if they have not had chemotherapy for metastatic disease and the condi-tions in the managed access scheme are followed.
OnFebruary15,weannouncedthattheJAVELINLung200trial comparing avelumab to chemotherapy in patients with advanced lung cancer whose disease has progressed after previoustreatmentdidnotmeetitspre-specifiedendpointofimproving overall survival. While the overall clinical activity was inlinewithourexpectationsforbothefficacyandsafety,ahighproportion of patients in the chemotherapy arm received sub-sequent immunotherapy outside of the study, which may have confoundedthetrial'soutcome.Weremainconfident intherole avelumab will play in the future treatment of lung cancer.
General Medicine and EndocrinologyOnJanuary22,theBrazilianhealthauthorityANVISAapprovedGlifage® IR and Glifage®XR(BrazilianbrandnameforGluco-phage®)forthepreventionoftype2diabetesinoverweightpatientswithprediabetes,becomingthefirstmedicinelocallyapproved for this indication. Brazil is ranked by the Interna-tionalDiabetesFederationashavingthefifthlargestpopulationof prediabetic people in the world. In 2017, it was estimated that 14.6 million people were living in Brazil with this disease, and that number is expected to rise to 20.7 million by 2045. WiththeapprovalinBrazil,ourflagshipbrandGlucophage® is now available to prediabetic patients in 19 countries, including the United Kingdom and, recently, Iran.
CollaborationsInJanuary,weenteredintoapartnershipwithBlueMesaHealthInc., New York, NY to pilot its Centers for Disease Control and Prevention(CDC)-recognizeddiabetespreventionprogramsinterritories outside the United States. Founded in 2015, Blue Mesa Health has designed and commercialized two chronic disease prevention programs based on the CDC’s landmark National Diabetes Prevention Program. Transform is a year-long lifestyle change program that integrates remote health coaching, peer support and smartphone technology with personal scales and activity trackers. Transformemos is a Spanish-language program available in the U.S. market for Spanish speakers.
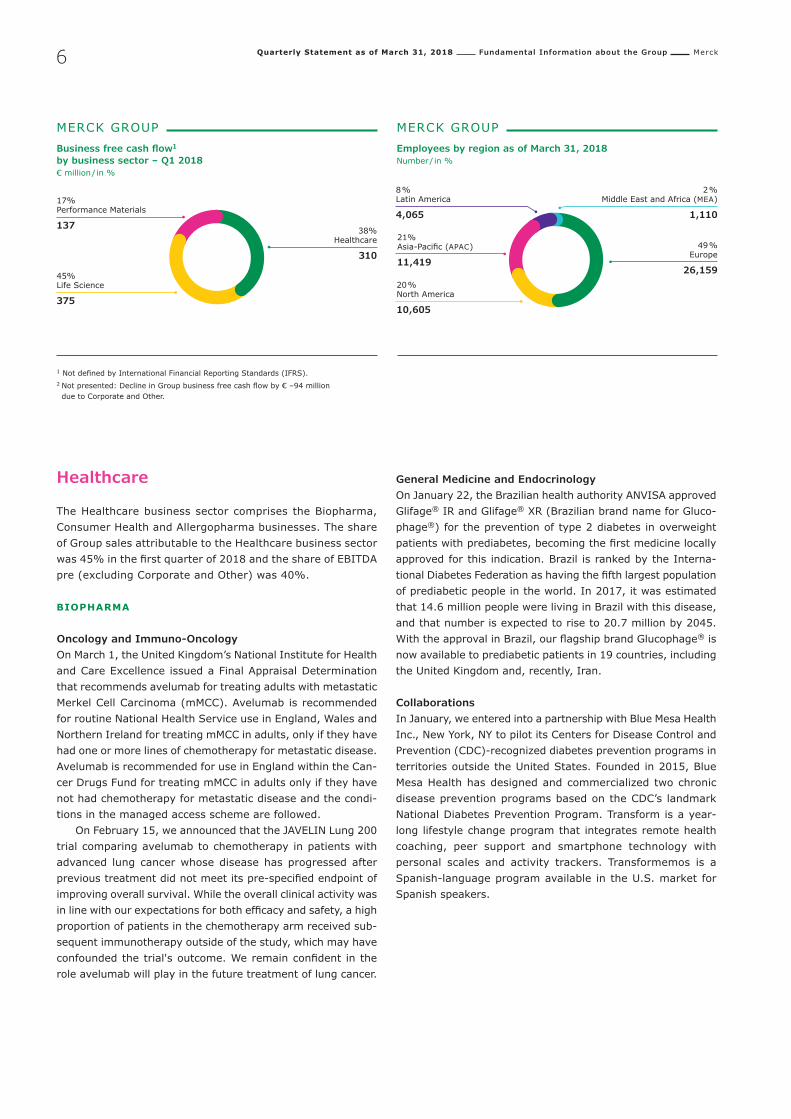
MERCK GROUP Business free cash flow1
by business sector – Q1 2018€ million / in %
45% Life Science
375
17% Performance Materials
137 38% Healthcare
310
MERCK GROUP Employees by region as of March 31, 2018Number / in %
2 % MiddleEastandAfrica(MEA)
1,110
21% Asia-Pacific(APAC)
11,419
20 % North America
10,605
8 % Latin America
4,065
49 % Europe
26,159
1 NotdefinedbyInternationalFinancialReportingStandards(IFRS).2 Notpresented:DeclineinGroupbusinessfreecashflowby€–94million due to Corporate and Other.

Quarterly Statement as of March 31, 2018 Fundamental Information about the Group Merck 7
On March 22, we announced that in the United States, Merck is partnering with March of Dimes to launch the March of Dimes Center for Social Science Research to inform evidence-based policymaking promoting the health of all mothers and babies. Merck and March of Dimes will conduct six research reports over the course of three years to better understand the relation-ship among economic and employer policies, women’s health and productivity, and childbirth. Additionally, with Merck’s help, March of Dimes will expand its Healthy Babies Healthy Busi-ness® workplace wellness program, which supports health ben-efitsandpoliciesforstrongmothersandbabies.
Also in March, a collaboration was announced with Medi safe, a U.S.-based start-up providing a leading digital medication management and adherence solution, to help patients with cardio metabolic disorders better manage their medication intake, and to improve adherence to treatment. Through this collaboration, patients will have access to a customized version of Medisafe´s mobile platform that could combine reminders, motivation and support systems, targeted content, coupons andinterventions.Brazil,RussiaandMexicoarethefirstthreecountries where patients receiving primary care medicines from our company will have access to a customized version of Medi-safe.
CONSUMER HEALTHAs announced on April 19, we reached an agreement to sell our globalConsumerHealthbusinesstoProcter&Gamble(P&G)for approximately € 3.4 billion in cash. The transaction, which is expected to close by the end of the fourth quarter of 2018, is subjecttoregulatoryapprovalsandsatisfactionofcertainothercustomary closing conditions. Merck intends to use the net pro-ceeds from the divestiture primarily to accelerate deleverag-ing.Atthesametime,itwillallowMercktoincreaseflexibil-ity to strengthen all three business sectors. The divestment of the Consumer Health business is an important step in Merck’s strategy of focusing on innovation-driven businesses.
Life Science
Inthefirstquarterof2018,theshareofGroupsalesattrib-utable to the Life Science business sector was 40% and the shareofEBITDApre(excludingCorporateandOther)was42%.
We invested an additional US$ 50 million to build a robust manufacturing and distribution platform in Asia over a span of two years. We also made an additional investment to acceler-ate Mobius® single-use manufacturing in Wuxi, China, as well as signed a Memorandum of Understanding with Schneider Electric that aims to automate biopharmaceutical processes for China’s biopharmaceutical industry. Our focused investments in Asia ensure that our customers have access to the products needed to develop new therapies and biosimilars that accelerate access to health for people everywhere. These investments follow the November 2016 announcement of a US$ 100 million investment in Nantong, China.
Our activity in Asia continued with the signing of an agree-mentwithIncheonFreeEconomicZone(IFEZ)tobuildaninte-grated cell culture facility in Songdo, Incheon. This expansion will help meet the rapid growth in the biopharmaceutical indus-try in South Korea, giving us the ability to tailor our products and services to better address the needs of customers in this important region. In addition, a € 16.6 million investment was made in India for a new life science manufacturing and distribu-tion center in the Patalganga industrial area, near Mumbai, with an expected completion date in 2019.
In February, we received two more patents for CRISPR tech-nology fromtheKoreanIntellectualPropertyOfficeandtheIsraelPatentOffice.Thesedecisionsmarkedthefifthandsixthpatent allowances, respectively for our CRISPR technology used in a genomic-integration method for eukaryotic cells. Our cor-porate responsibility efforts were strengthened by nine new sig-naturepartnershipswithleadingnonprofitorganizationsacrossthe world. These long-term, multi-dimensional partnerships are designedtosparkscientificcuriosityandpassion–pavingtheway for innovative breakthroughs with demonstrated impact and measurable outcomes.
Quarterly Statement as of March 31, 2018 Fundamental Information about the Group Merck8
Performance Materials
Our Performance Materials business sector comprises the spe-cialty chemicals business of Merck and supplies solutions for displays, computer chips and surfaces of every kind. Since April 1, 2018, Performance Materials has been organized into the three business units Display Solutions, Semiconductor Solu-tions and Surface Solutions. Comparing Performance Materials with a smartphone, Display Solutions stands for the user inter-face, Semiconductor Solutions for the intelligence, and Surface Solutions for the aesthetics.
The integrated innovation unit Early Research & Business Development is developing a technology vision for Perfor-mance Materials and is supporting the business units to iden-tifyprojectswithgrowthpotentialandtocapturenewmarkets.
Inthefirstquarterof2018,PerformanceMaterialsgener-ated15%ofGroupsalesand18%ofEBITDApre(excludingCorporateandOther).TheEBITDApremarginamountedto34.7% of sales.
We have combined our business with liquid crystals and OLED materials in the Display Solutions business unit. In the firstquarterof2018,wedefendedourpositionastheglobalmarket and technology leader in the display business despite increasingcompetitioninthissegment.Modernenergy-efficienttechnologies suchasUB-FFS (Ultra-Brightness Fringe FieldSwitching)haveestablishedthemselvesfurther inthemar-ket. The development of new application possibilities for liquid crystals(LCs)remainsanimportantfocusofourLC2021stra-tegic initiative. Besides our traditional display business, we are also active in future-oriented technologies such as liquid crys-tal windows, OLED lighting solutions, smart antennas, adaptive lighting,andflexibledisplays.Forliquidcrystalwindowmod-ules, we successfully started pilot production this year at the siteinVeldhovenintheNetherlands.
Semiconductor Solutions, the second-largest business unit of Performance Materials, is an important partner to lead-ingglobalelectronicsmanufacturers.Inthefirstquarterof2018, it achieved further strong growth and gained market shares – amid an overall positive development of the semi-conductor market. Semiconductor Solutions supplies prod-ucts and solutions for integrated circuits, for the manufac-tureofmicroelectronicsystems,forantireflectioncoatings,and for the miniaturization of transistor structures. Deposi-tion materials and conductive pastes for semiconductor pack-aging round off the portfolio. Our materials and solutions play a key role in the innovation process of our customers, in order to make computer chips smaller, faster, more powerful, and moreenergy-efficient.
In the Surface Solutions business unit, our materials and solutions help our customers to make innovative surfaces of every kind more beautiful, more durable, and also smarter. Our pearlescent pigments make it possible to produce striking auto-motive coatings, fascinating cosmetics, extraordinary packag-ing, innovative product design, and even unique food creations. With our functional materials, we serve a diversity of innova-tive applications, from dirt-repellent, easy-care surfaces, laser marking of plastic parts and cables, to optoelectronics.

Quarterly Statement as of March 31, 2018 Fundamental Information about the Group Research and Development 9
Research and Development
We conduct research and development (R&D) worldwide in order to develop new products and services designed to improve the quality of life of patients and to satisfy the needs of our customers. Further optimizing the relevance and effi-ciency of our research and development activities – either on our own or in cooperation with third parties – is one of our top priorities.
We research innovations to serve long-term health and tech-nology trends in both established and growth markets.
We spent € 514 million on research and development in the firstquarterof2018.
We focus on both in-house research and external collabo-rations. Our R&D activities are set up in line with the structure of our company with three business sectors.
A detailed description of our R&D activities can be found in the Annual Report 2017 starting on page 83. This section of the present quarterly statement summarizes the research and development highlights of the first quarter of 2018 at Merck.
Healthcare
BIOPHARMA
Oncology and Immuno-OncologyOnMarch27, theJapaneseMinistryofHealth,LabourandWelfaregranted “SAKIGAKE” fast-trackdesignation for theinvestigational molecule tepotinib for patients with advanced non-small cell lung cancer harboring MET exon 14 skipping mutations. SAKIGAKE designation promotes research and development inJapan,aimingatearlypracticalapplicationfor innovative pharmaceutical products, medical devices and regenerative medicines, and can reduce a drug’s review period from12monthstoatargetofsixmonths.Thisisthefirstreg-ulatory designation granted to tepotinib.
InJanuary,Australia’sTherapeuticGoodsAdministrationapproved Bavencio® (avelumab) for the treatmentofmet-astaticMerkelcellcarcinoma(MCC) inadultsandpediatricpatients 12 years and older. In addition, Israel’s Ministry of
Health approved Bavencio® for the treatment of adult patients with metastatic MCC, and for the treatment of patients with locallyadvancedormetastaticurothelialcarcinoma(UC).Theseapprovals for Bavencio® follow marketing authorizations for MCCintheEuropeanUnion,Japan,SwitzerlandandCanada,and for both MCC and UC in the United States.
Two key articles on Bavencio® clinical trials were published inmedicaljournals,reportingpreliminarydatainfirst-linerenalcellcarcinoma(RCC)andfirst-linemetastaticMCC.TheLancetOncologyjournalpublishedpreliminarydatafromthePhaseIJAVELINRenal100clinicaltrial,assessingBavencio® in com-binationwithaxitinib,atyrosinekinaseinhibitor,asafirst-linetherapy for patients with RCC. Initial results show the safety profileseemedtobemanageable,andthepreliminarydataonanti-tumoractivityareencouraging.APhaseIIItrial(JAVELINRenal101)iscurrentlyongoing,comparingthiscombinationwithsingle-agentsunitinib,amultikinaseinhibitor.TheJournaloftheAmericanMedicalAssociationOncology(JAMAOncology)publishedapreplannedinterimanalysisoftheJAVELINMerkel200 trial, assessing Bavencio®asafirst-linetreatmentinmet-astatic MCC. The results, which were previously presented at the ESMO 2017 Congress of the European Society for Medical Oncology, are encouraging.
On the occasion of the American Society of Clinical Oncol-ogy 2018 Gastrointestinal Cancers Symposium in January(SanFrancisco,California)datawerepresentedontheroleofestablished medicine Erbitux®(cetuximab)incolorectalcan-cer by tumor location, including cost-effectiveness data. With respect to M7824, an investigational early phase anti-PD-L1 andanti-TGF-βbifunctionalmolecule,datapresentedincludedthefirsttumor-specificresults,withencouragingresultsingas-tric cancer. In heavily pretreated Asian patients with recurrent or refractory unresectable advanced gastric and gastroesoph-ageal adenocarcinoma, preliminary data showed clinical activ-ityandasafetyprofileinlinewiththatanticipatedinsuchaheavily pretreated patient population.
Two articles on M7824 were published in Science Transla-tional Medicine and in Clinical Cancer Research. These articles provide preliminary evidence of the therapeutic potential of this molecule. Anti-tumor activity was reported both in preclinical models and in heavily pretreated patient populations, with a manageablesafetyprofile.

Quarterly Statement as of March 31, 2018 Fundamental Information about the Group Research and Development 10
ThePhaseIstudyofM9831(VX-984),aDNA-PKinhibitorpartoftheDNAdamageresponse(DDR)portfolio,hasbeencom-pleted.
On May 2, we announced a development agreement with SFJPharmaceuticalsGroupforabituzumab,apan-ανintegrininhibitingmonoclonalantibodywithactivityagainstαvβ1,3,5,6 and 8 integrin heterodimers. Merck has completed Phase II development of abituzumab in combination with Erbitux® and chemotherapy as second-line treatment of patients with KRAS wildtypemetastaticcolorectalcancer(mCRC).Asubgroupofpatientswithoverexpressionofintegrinαvβ6wasidentifiedaspotentiallybenefittingfromthistreatment.Withtheevolvingunderstanding of the relationship between mCRC tumor loca-tionandtreatmentoutcomesinrecentyears,SFJwillpursuethe combination of abituzumab, Erbitux® and chemotherapy in afirst-linesettinginhighανβ6-expressingpatientswhohaveRAS wild type, left sided mCRC. In a collaboration model that isemerginginthebiopharmaindustry,SFJwillfinanceandalsobe responsible for Phase II/III clinical development of abitu-zumab.TheagreementreflectsMerck’sstrategytoidentifycol-laborations that can progress the company’s highly promising clinical stage assets through novel innovation models.
Neurology and ImmunologyOn March 7, we announced positive results from our Phase IIbstudyofevobrutinib(Bruton’sTyrosineKinaseInhibitor)inrelapsingmultiplesclerosis(MS).Thestudymetitsprimaryendpoint, demonstrating that evobrutinib resulted in a clinically meaningful reduction of gadolinium-enhancing T1 lesions on magneticresonanceimaging(MRI)scansmeasuredatweeks12, 16, 20 and 24 in comparison to patients receiving placebo. Evobrutinib, discovered by Merck, is also in Phase IIb studies inrheumatoidarthritis(RA)andsystemiclupuserythemato-sus(SLE).
In the first quarter of 2018, approval for Mavenclad® (cladribinetablets)wasgrantedinIsrael,Argentina,andinthe United Arab Emirates for the treatment of adult patients withhighlyactiverelapsingMSasdefinedbyclinicalorimag-ing features. These approvals for Mavenclad® follow market-ing authorizations in the European Union, Canada and Austra-lia in 2017. A regulatory submission with the U.S. Food and Drug Administration is planned for the second quarter of 2018.
On the occasion of the Americas Committee for Treatment andResearchinMultipleSclerosisForum2018inFebruary(SanDiego,California),sixpostersevaluatingMavenclad® in MS were presented. Data presented included further evaluation of the safety of Mavenclad® and the impact on the immune sys-tem via post hoc analyses of the CLARITY, CLARITY Extension, and ORACLE-MS trials, as well as the prospective PREMIERE registrystudy.Datareportedincludedfindingsregardingtheselectivity of Mavenclad® and its effects on the adaptive and innate immune systems.
TheresultsfromthekeyMRIfindingsoftheCLARITYExtensionstudy of Mavenclad®,werepublishedinJanuaryinthejournalofTherapeuticAdvancesinNeurologicalDisorders.Thefind-ings suggest that two-year treatment with Mavenclad® has a durable effect on MRI.
Merck supports the “MS in the 21st Century” SteeringGroup to increase collaboration, education and communica-tion between healthcare professionals and people with MS. The groupachievedapublicationmilestoneinJanuary2018bypublishingascientificmanuscriptintheMultipleSclerosisandRelatedDisordersjournal.
On the occasion of the annual meeting of the European LupusSocietyinMarch(Düsseldorf,Germany),datawerepre-sented on atacicept, a recombinant fusion protein thought to target the cytokines APRIL and BLyS. Two oral presentations of analyses of the Phase II ADDRESS II clinical trial assessing atacicept in patients with SLE reported attainment of low-dis-easeactivityandreductionofflaresinpatientswithhighSLEdisease activity.
The Phase II study of abituzumab in patients with intersti-tiallungdiseaseinsclerodermawasterminatedduetodiffi-culties in enrolling patients, which precluded the completion of the study within a reasonable time frame. As noted above, an agreementwithSFJwasannouncedonMay2todevelopabitu-zumab in patients with mCRC.
Life Science
Inthefirstquarterof2018,wecontinuedtofocusonmeetingcustomer needs by launching nearly 4,000 products, including more than 3,000 chemicals, across the Research Solutions, Process Solutions, and Applied Solutions business units.
InJanuary,we introducedanalyticaland immunologicalassays focused on characterizing the attributes of monoclo-nal antibodies, including biosimilars. This adds additional ser-vice offerings in product characterization, which together with our BioSafety testing assays, offer customers a complete ser-vice portfolio.
In February, we introduced Viresolve® Barrier capsule filterstoprotectagainstbioreactorcontamination,designedto remove viruses, mycoplasma and bacteria from cell culture media.ThesefiltersareakeycomponentofourViralSafetyAssurance program to mitigate the risk of viral contamination in upstream bioprocesses and minimize the potential impact on drug supply and patient safety.
Quarterly Statement as of March 31, 2018 Fundamental Information about the Group Research and Development 11
Performance Materials
With our Performance Materials business sector, we are the market and technology leader in most of our businesses. As a science and technology company, our innovative products and solutions differentiate us from the competition in many cases. Therefore,asuccessfulresearch&development(R&D)isakeycomponent of the strategy of Performance Materials. In 2018, we combined the part of our R&D activities that are not closely product-related in the business units in the central innovation unit Early Research & Business Development. This is developing a technology vision for Performance Materials and is support-ingthebusinessunitstoidentifyprojectswithgrowthpoten-tial and to capture new markets.
Display Solutions In Display Solutions, our liquid crystal technology UB-FFS (Ultra-BrightnessFringeFieldSwitching)continuestogrowsuccessfullythankstonewproductqualificationsandincreas-ingdemandinthemobileliquidcrystal(LC)displaysector–notably for mobile phone and tablet applications. High-resolu-tion 4K and 8K television developments continue to challenge thelightefficiencyofLCdisplays,andthereforeweareactivelyworking to extend the ultra-bright LC technology with our UB-Plus liquid crystal materials. The aim is to deliver 10% to 15%improvedefficiencyto large-sizeTVandpublicdisplayapplications.MeanwhileinthelargeTVapplicationarea,poly-mer-stabilizedverticalalignment(PS-VA)liquidcrystaltech-nology continues to be dominant, with our latest new materials bringingadditionalperformancebenefitsaswellasimprovedprocessingefficiencyforPS-VATVmanufacturing.Inaddition,we have successfully proven manufacturing capability for the newself-alignedverticalalignment(SA-VA)liquidcrystaltech-nology. We are now looking ahead by developing applications fornichehigh-enddisplayproductsthroughtohigh-volumeTVapplications.SA-VAdeliversthehighcontrastandhighviewingperformanceofPS-VA,butwithenhanceddisplaydesignandimproved panel manufacturing by reducing waste and energy consumption.
Semiconductor Solutions Depositionmaterialsforgas-phaseapplications(e.g.atomiclayerdeposition,ALD)representatechnologyfieldthatoffershigh growth rates for our Semiconductor Solutions business unit. By strengthening our research activities in cooperation with original equipment manufacturers and chip makers, we arecontinuouslyenhancingourposition.Ourresearchproj-ects are aimed at discovering new materials for metallization processes with low resistance and various dielectric properties for faster and better processors, servers and data storage den-sity. In order to support our customers better, we have already expanded our research capacities in Taiwan and are planning a similar step for our U.S. customers. Completion is scheduled for the end of 2019.
Surface Solutions In pigments for industrial applications, we are currently focusing on the development of achromatic pigments. As part of the Smart Effects initiative, we are focusing our develop-mentofcosmeticpigmentsonmatteeffects(Allureseries)andlustereffects(Lightsseries).Inaddition,activeingredientsof natural origin are a focal topic for new cosmetic solutions. In functional materials, such as our Iriotec® pigments, we suc-cessfully entered the market for new application areas, e.g. insulation of high-voltage cable connections and laser marking of medical devices. We further developed the product class of polysilazanes and are building international application support.

Quarterly Statement as of March 31, 2018 Course of Business and Economic Position Merck1212
Course of Business and Economic PositionMerck
Overview – Q1 2018
• Group net sales decline to € 3.7 billion owing to negative foreign exchange effects (–7.9%)
• Group sales increase organically by 3.5%, mainly due to very strong growth in Life Science
• Group EBITDA pre decreases by –18.2% to € 1,015 million, with negative foreign exchange effects accounting for around –10% of the decline
• Group EBITDA pre margin reaches level of 27.5% despite negative foreign exchange effects and further growth investments
• Net financial debt reduced further to € 10.0 billion (December 31, 2017: € 10.1 billion)
MERCK GROUP Key figures
€ million Q1 2018 Q1 2017 Change
Net sales 3,691 3,861 –4.4%
Operating result (EBIT)1 518 755 –31.4%
Margin (% of net sales)1 14.0% 19.5%
EBITDA1 946 1,203 –21.4%
Margin (% of net sales)1 25.6% 31.2%
EBITDA pre1 1,015 1,240 –18.2%
Margin (% of net sales) 27.5% 32.1%
Profit after tax2 342 524 –34.8%
Earnings per share (€) 0.78 1.20 –35.0%
Earnings per share pre (€)1 1.41 1.80 –21.7%
Business free cash flow1 729 760 –4.0%
1 Not defined by International Financial Reporting Standards (IFRS).2 Previous year’s figures have been adjusted, see “Effects of new financial reporting standards” under “Supplemental Financial Information”.
DEVELOPMENT OF NET SALES AND RESULTS OF OPERATIONSIn the first quarter of 2018, net sales of the Merck Group declined by –4.4% or € –170 million to € 3,691 million (Q1 2017: € 3,861 million). Sales increased organically by 3.5% or € 135 million. The two business sectors Life Science (8.8%) and Healthcare (1.8%) contributed positively to this growth, while sales of the Performance Materials business sec-tor declined organically (–4.0%). The negative exchange rate effects of –7.9% or € –305 million stemmed mainly from the considerably weaker U.S. dollar compared with the year-earlier quarter. However, exchange rate developments in the Latin America and Asia-Pacific regions, for example the Brazilian real, the Argentinian peso, the South Korean won, the Taiwanese dollar and the Japanese yen, negatively impacted sales perfor-mance.
Accounting for an unchanged 45% share of Group sales, Healthcare was once again the Group’s largest business sector in terms of sales. In comparison with the year-earlier quarter, Healthcare sales decreased by –5.5% to € 1,640 million (Q1 2017: € 1,735 million). This resulted from pronounced negative foreign exchange effects of –7.2% or € –126 million for the business sector. Organically, Healthcare sales grew by 1.8% in the first quarter of 2018.
With organic sales growth of 8.8%, the Life Science busi-ness sector achieved a total increase of 0.4% in sales to € 1,487 million (Q1 2017: € 1,481 million). Very strong nega-tive foreign exchange effects lowered sales by –8.4% or € –124 million. The share of Group sales attributable to Life Science rose by two percentage points to 40% in the first quar-ter of 2018 (Q1 2017: 38%).
Quarterly Statement as of March 31, 2018 Course of Business and Economic Position Merck 1313
Net sales of the Performance Materials business sector declined by –12.5% to € 564 million (Q1 2017: € 645 million). In par-ticular, negative foreign exchange effects of –8.5% or € –55 million as well as moderately weaker organic sales of –4.0% were responsible for this development. The business sector’s percentage contribution to Group sales decreased by two per-centage points to 15% (Q1 2017: 17%).
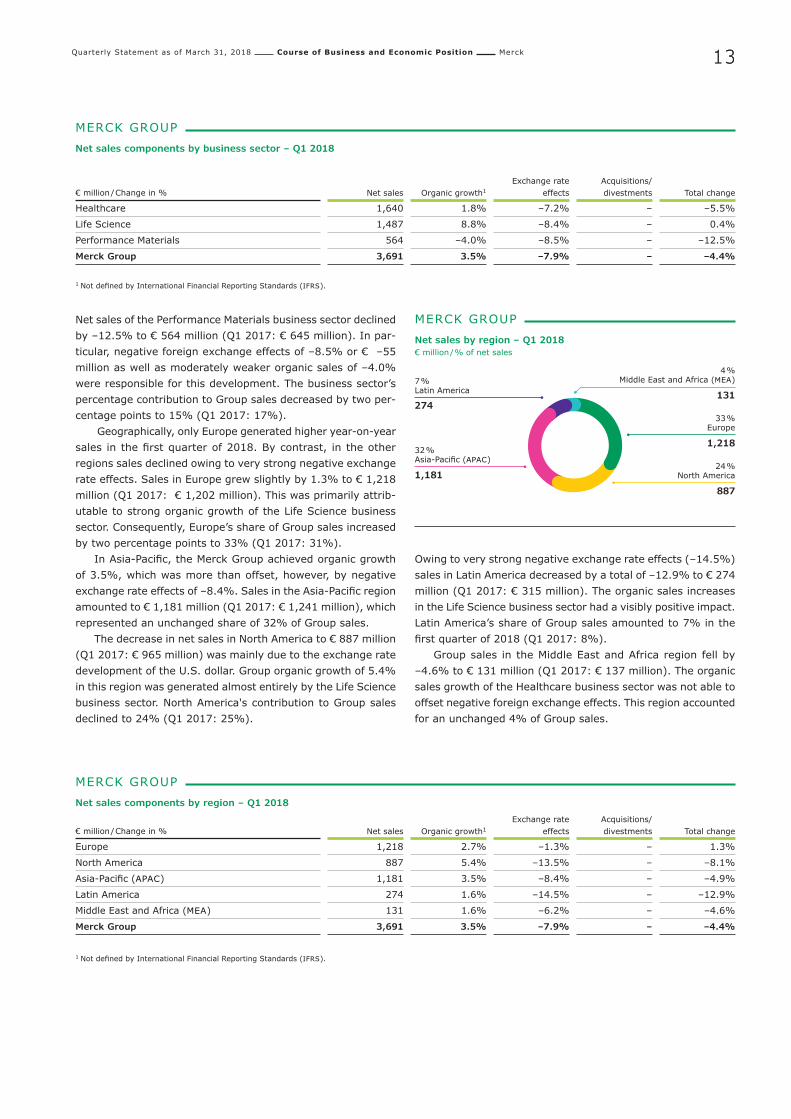
Geographically, only Europe generated higher year-on-year sales in the first quarter of 2018. By contrast, in the other regions sales declined owing to very strong negative exchange rate effects. Sales in Europe grew slightly by 1.3% to € 1,218 million (Q1 2017: € 1,202 million). This was primarily attrib-utable to strong organic growth of the Life Science business sector. Consequently, Europe’s share of Group sales increased by two percentage points to 33% (Q1 2017: 31%).
In Asia-Pacific, the Merck Group achieved organic growth of 3.5%, which was more than offset, however, by negative exchange rate effects of –8.4%. Sales in the Asia-Pacific region amounted to € 1,181 million (Q1 2017: € 1,241 million), which represented an unchanged share of 32% of Group sales.
The decrease in net sales in North America to € 887 million (Q1 2017: € 965 million) was mainly due to the exchange rate development of the U.S. dollar. Group organic growth of 5.4% in this region was generated almost entirely by the Life Science business sector. North America's contribution to Group sales declined to 24% (Q1 2017: 25%).
Owing to very strong negative exchange rate effects (–14.5%) sales in Latin America decreased by a total of –12.9% to € 274 million (Q1 2017: € 315 million). The organic sales increases in the Life Science business sector had a visibly positive impact. Latin America’s share of Group sales amounted to 7% in the first quarter of 2018 (Q1 2017: 8%).
Group sales in the Middle East and Africa region fell by –4.6% to € 131 million (Q1 2017: € 137 million). The organic sales growth of the Healthcare business sector was not able to offset negative foreign exchange effects. This region accounted for an unchanged 4% of Group sales.
MERCK GROUP Net sales components by region – Q1 2018
€ million / Change in % Net sales Organic growth1Exchange rate
effectsAcquisitions/ divestments Total change
Europe 1,218 2.7% –1.3% – 1.3%
North America 887 5.4% –13.5% – –8.1%
Asia-Pacific (APAC) 1,181 3.5% –8.4% – –4.9%
Latin America 274 1.6% –14.5% – –12.9%
Middle East and Africa (MEA) 131 1.6% –6.2% – –4.6%
Merck Group 3,691 3.5% –7.9% – –4.4%
1 Not defined by International Financial Reporting Standards (IFRS).
MERCK GROUP Net sales components by business sector – Q1 2018
€ million / Change in % Net sales Organic growth1Exchange rate
effectsAcquisitions/ divestments Total change
Healthcare 1,640 1.8% –7.2% – –5.5%
Life Science 1,487 8.8% –8.4% – 0.4%
Performance Materials 564 –4.0% –8.5% – –12.5%
Merck Group 3,691 3.5% –7.9% – –4.4%
1 Not defined by International Financial Reporting Standards (IFRS).
MERCK GROUP Net sales by region – Q1 2018€ million / % of net sales
33 % Europe
1,21832 % Asia-Pacific (APAC)
1,18124 %
North America
887
7 % Latin America
274
4 % Middle East and Africa (MEA)
131

Quarterly Statement as of March 31, 2018 Course of Business and Economic Position Merck1414
The consolidated income statement of the Merck Group is as follows:
MERCK GROUP Consolidated Income Statement
€ million Q1 2018 Q1 2017 Change
Net sales 3,691 3,861 –4.4%
Cost of sales –1,320 –1,296 1.9%
Gross profit 2,371 2,565 –7.6%
Marketing and selling expenses –1,106 –1,168 –5.3%
Administration expenses –228 –242 –5.9%
Research and development costs –514 –495 4.0%
Other operating expenses and income –4 95 >100.0%
Operating result (EBIT)1 518 755 –31.4%
Financial result2 –62 –69 –9.8%
Profit before income tax2 456 686 –33.6%
Income tax2 –114 –161 –29.6%
Profit after tax2 342 524 –34.8%
Non-controlling interests –1 –2 –43.7%
Net income2 341 523 –34.8%
1 Not defined by International Financial Reporting Standards (IFRS).2 Previous year’s figures have been adjusted, see “Effects of new financial reporting standards” under “Supplemental Financial Information”.
Gross profit of the Merck Group declined by –7.6% to € 2,371 million in the first quarter of 2018 (Q1 2017: € 2,565 million). Besides an unfavorable product mix, in particular foreign exchange effects negatively impacted the development of gross profit in all business sectors. The resulting gross margin of the Group, i.e. gross profit as a percentage of sales, decreased by slightly more than two percentage points to 64.2% (Q1 2017: 66.4%).
The increase in research and development costs by 4.0% to € 514 million (Q1 2017: € 495 million) was particularly attributable to development activities in the Healthcare busi-ness sector, leading to a Group research spending ratio (research and development costs as a percentage of sales) of 13.9% (Q1 2017: 12.8%). Accounting for a 76% (Q1 2017: 76%) share of total research and development costs of the business sectors, Healthcare remained the most research- intensive business sector of Merck.
Other operating expenses and income (net) showed an expense balance of € –4 million in the first quarter of 2018; in the year-earlier quarter this item showed an income balance
of € 95 million. This strong change was mainly due to develop-ments in the Healthcare business sector (see explanations in the section entitled “Healthcare”). In particular, in Healthcare the year-earlier quarter had included income of € 116 million from compensation for future license payments.
Overall, the income and expenses disclosed in the Group income statement led to a double-digit percentage decline in the operating result (EBIT) to € 518 million (Q1 2017: € 755 million).
The improvement in the negative financial result by 9.8% to € –62 million (Q1 2017: € –69 million) was primarily attrib-utable to the favorable development of the interest result.
Income tax expenses of € 114 million (Q1 2017: € 161 million) led to an effective tax rate of 24.9% (Q1 2017: 23.5%).
Net income, i.e. profit after tax attributable to Merck share-holders, declined to € 341 million (Q1 2017: € 523 million), resulting in earnings per share of € 0.78 in the first quarter of 2018 (Q1 2017: € 1.20).

Quarterly Statement as of March 31, 2018 Course of Business and Economic Position Merck 1515
MERCK GROUP Reconciliation of EBIT to EBITDA pre
€ million Q1 2018 Q1 2017 Change
Operating result (EBIT)1 518 755 –31.4%
Depreciation/amortization/impairment losses/reversals of impairment losses 428 448 –4.5%
(of which: adjustments) (2) (4) (–51.0%)
EBITDA 946 1,203 –21.4%
Restructuring costs 7 4 > 100.0%
Integration costs/IT costs 21 26 –20.7%
Gains/losses on the divestment of businesses 2 2 17.2%
Acquisition-related adjustments 1 3 –83.6%
Other adjustments 39 3 > 100.0%
EBITDA pre1 1,015 1,240 –18.2%
1 Not defined by International Financial Reporting Standards (IFRS).
After eliminating depreciation, amortization and adjustments, EBITDA pre, the key financial indicator used to steer operating business, decreased by –18.2% to € 1,015 million (Q1 2017: € 1,240 million), leading to an EBITDA pre margin relative to sales of 27.5% (Q1 2017: 32.1%). Unfavorable exchange rate effects impacted the development of EBITDA pre by around –10%. Earnings per share pre (earnings per share after net of tax effect of adjustments and amortization of purchased intan-gible assets) fell by –21.7% to € 1.41 (Q1 2017: € 1.80).
Quarterly Statement as of March 31, 2018 Course of Business and Economic Position Merck1616
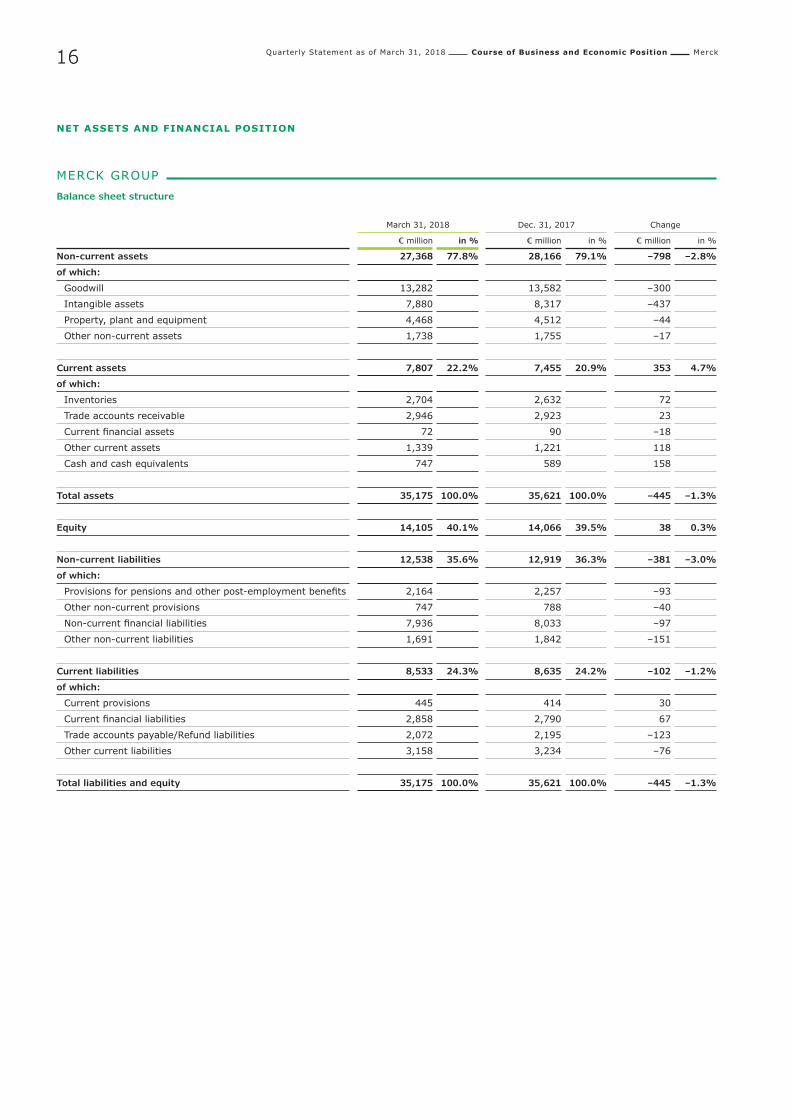
NET ASSETS AND FINANCIAL POSITION
MERCK GROUP Balance sheet structure
March 31, 2018
Dec. 31, 2017
Change
€ million in % € million in % € million in %
Non-current assets 27,368 77.8% 28,166 79.1% –798 –2.8%
of which:
Goodwill 13,282 13,582 –300
Intangible assets 7,880 8,317 –437
Property, plant and equipment 4,468 4,512 –44
Other non-current assets 1,738 1,755 –17
Current assets 7,807 22.2% 7,455 20.9% 353 4.7%
of which:
Inventories 2,704 2,632 72
Trade accounts receivable 2,946 2,923 23
Current financial assets 72 90 –18
Other current assets 1,339 1,221 118
Cash and cash equivalents 747 589 158
Total assets 35,175 100.0% 35,621 100.0% –445 –1.3%
Equity 14,105 40.1% 14,066 39.5% 38 0.3%
Non-current liabilities 12,538 35.6% 12,919 36.3% –381 –3.0%
of which:
Provisions for pensions and other post-employment benefits 2,164 2,257 –93
Other non-current provisions 747 788 –40
Non-current financial liabilities 7,936 8,033 –97
Other non-current liabilities 1,691 1,842 –151
Current liabilities 8,533 24.3% 8,635 24.2% –102 –1.2%
of which:
Current provisions 445 414 30
Current financial liabilities 2,858 2,790 67
Trade accounts payable/Refund liabilities 2,072 2,195 –123
Other current liabilities 3,158 3,234 –76
Total liabilities and equity 35,175 100.0% 35,621 100.0% –445 –1.3%

Quarterly Statement as of March 31, 2018 Course of Business and Economic Position Merck 1717
The total assets of the Merck Group amounted to € 35,175 million as of March 31, 2018. This represents a decline of 1.3% compared with December 31, 2017 (€ 35,621 million). The decline in other intangible assets was primarily due to amorti-zation and exchange rate effects. Since the beginning of 2018, working capital has risen by 5.6% to € 3,578 million (Decem-
ber 31, 2017: € 3,387 million) owing to a slight increase in inventories and receivables amid a simultaneous decline in trade accounts payable as well as refund liabilities.
The composition and the development of net financial debt were as follows:
MERCK GROUP Net financial debt1
March 31, 2018
Dec. 31, 2017
Change
€ million € million € million in %
Bonds and commercial paper 8,026 8,213 –187 –2.3%
Loans to banks 1,946 1,653 292 17.7%
Liabilities to related parties 659 767 –108 –14.1%
Loans from third parties and other financial liabilities 74 73 1 1.4%
Liabilities from derivatives (financial transactions) 85 113 –28 –24.5%
Finance lease liabilities 3 4 –1 –14.2%
Total financial liabilities 10,793 10,823 –30 – 0.3%
less
Cash and cash equivalents 747 589 158 26.9%
Current financial assets 72 90 –18 –20.1%
Net financial debt1 9,974 10,144 –170 –1.7%
1 Not defined by International Financial Reporting Standards (IFRS).
MERCK GROUP Reconciliation of net financial debt1
€ million 2018
January 1 10,144
Currency translation –79
Dividend payments to shareholders and to E. Merck2 64
Acquisitions2 –
Payment from the disposal of assets held for sale2 –
Free cash flow1 –149
Other –7
March 31 9,974
1 Not defined by International Financial Reporting Standards (IFRS).2 According to the consolidated cash flow statement.
As of March 31, 2018, the Merck Group reported equity of € 14,105 million (December 31, 2017: € 14,066 million). While profit after tax increased Group equity by € 342 million, the development of currency translation differences from the trans-lation of assets held in foreign currencies into euro, the report-ing currency, negatively impacted Group equity. The equity ratio improved to 40.1% (December 31, 2017: 39.5%).
Quarterly Statement as of March 31, 2018 Course of Business and Economic Position Merck1818
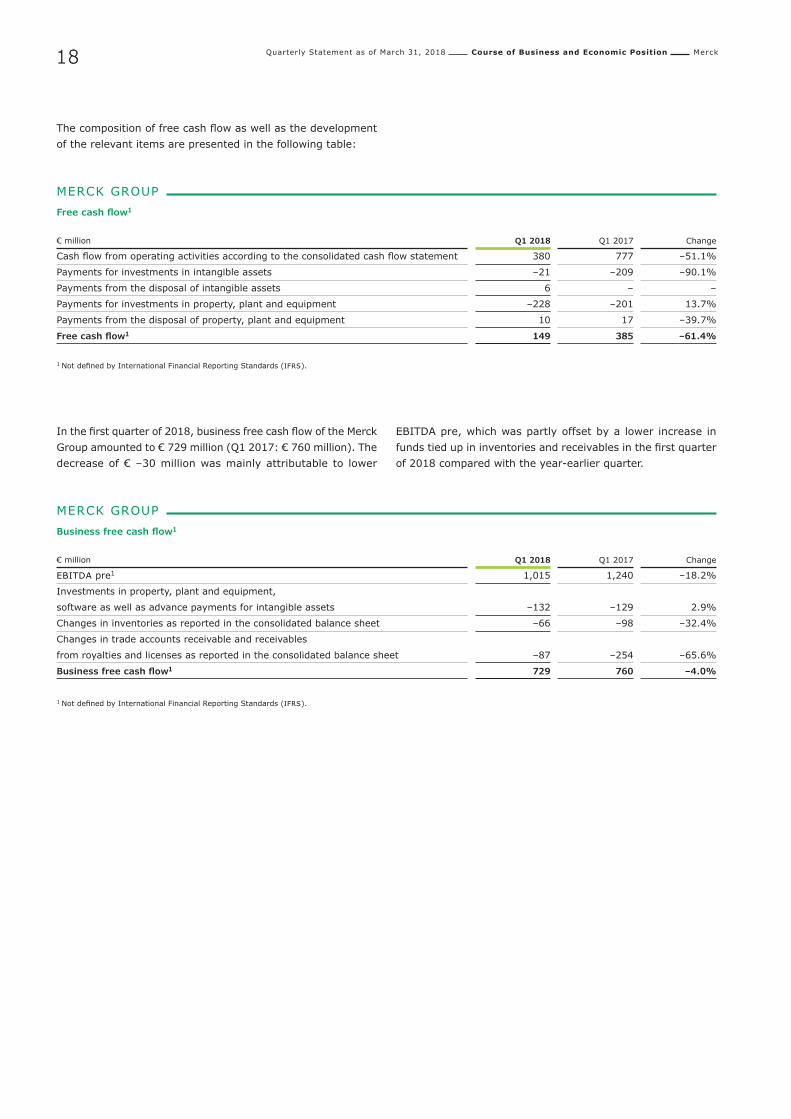
The composition of free cash flow as well as the development of the relevant items are presented in the following table:
MERCK GROUP Free cash flow1
€ million Q1 2018 Q1 2017 Change
Cash flow from operating activities according to the consolidated cash flow statement 380 777 –51.1%
Payments for investments in intangible assets –21 –209 –90.1%
Payments from the disposal of intangible assets 6 – –
Payments for investments in property, plant and equipment –228 –201 13.7%
Payments from the disposal of property, plant and equipment 10 17 –39.7%
Free cash flow1 149 385 –61.4%
1 Not defined by International Financial Reporting Standards (IFRS).
In the first quarter of 2018, business free cash flow of the Merck Group amounted to € 729 million (Q1 2017: € 760 million). The decrease of € –30 million was mainly attributable to lower
EBITDA pre, which was partly offset by a lower increase in funds tied up in inventories and receivables in the first quarter of 2018 compared with the year-earlier quarter.
MERCK GROUP Business free cash flow1
€ million Q1 2018 Q1 2017 Change
EBITDA pre1 1,015 1,240 –18.2%
Investments in property, plant and equipment,
software as well as advance payments for intangible assets –132 –129 2.9%
Changes in inventories as reported in the consolidated balance sheet –66 –98 –32.4%
Changes in trade accounts receivable and receivables
from royalties and licenses as reported in the consolidated balance sheet –87 –254 –65.6%
Business free cash flow1 729 760 –4.0%
1 Not defined by International Financial Reporting Standards (IFRS).
Quarterly Statement as of March 31, 2018 Course of Business and Economic Position Healthcare 1919
Healthcare
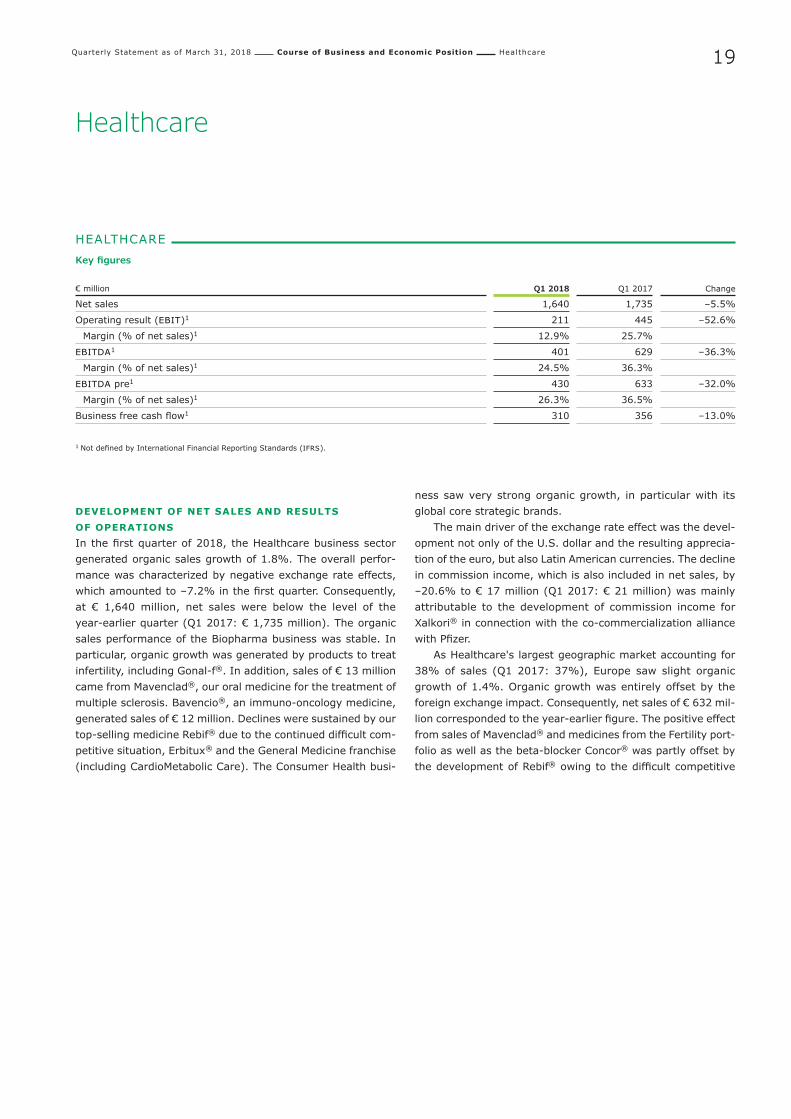
HEALTHCARE Key figures
€ million Q1 2018 Q1 2017 Change
Net sales 1,640 1,735 –5.5%
Operating result (EBIT)1 211 445 –52.6%
Margin (% of net sales)1 12.9% 25.7%
EBITDA1 401 629 –36.3%
Margin (% of net sales)1 24.5% 36.3%
EBITDA pre1 430 633 –32.0%
Margin (% of net sales)1 26.3% 36.5%
Business free cash flow1 310 356 –13.0%
1 Not defined by International Financial Reporting Standards (IFRS).
DEVELOPMENT OF NET SALES AND RESULTS OF OPERATIONSIn the first quarter of 2018, the Healthcare business sector generated organic sales growth of 1.8%. The overall perfor-mance was characterized by negative exchange rate effects, which amounted to –7.2% in the first quarter. Consequently, at € 1,640 million, net sales were below the level of the year-earlier quarter (Q1 2017: € 1,735 million). The organic sales performance of the Biopharma business was stable. In particular, organic growth was generated by products to treat infertility, including Gonal-f®. In addition, sales of € 13 million came from Mavenclad®, our oral medicine for the treatment of multiple sclerosis. Bavencio®, an immuno-oncology medicine, generated sales of € 12 million. Declines were sustained by our top-selling medicine Rebif® due to the continued difficult com-petitive situation, Erbitux® and the General Medicine franchise (including CardioMetabolic Care). The Consumer Health busi-
ness saw very strong organic growth, in particular with its global core strategic brands.
The main driver of the exchange rate effect was the devel-opment not only of the U.S. dollar and the resulting apprecia-tion of the euro, but also Latin American currencies. The decline in commission income, which is also included in net sales, by –20.6% to € 17 million (Q1 2017: € 21 million) was mainly attributable to the development of commission income for Xalkori® in connection with the co-commercialization alliance with Pfizer.
As Healthcare's largest geographic market accounting for 38% of sales (Q1 2017: 37%), Europe saw slight organic growth of 1.4%. Organic growth was entirely offset by the foreign exchange impact. Consequently, net sales of € 632 mil-lion corresponded to the year-earlier figure. The positive effect from sales of Mavenclad® and medicines from the Fertility port-folio as well as the beta-blocker Concor® was partly offset by the development of Rebif® owing to the difficult competitive

Quarterly Statement as of March 31, 2018 Course of Business and Economic Position Healthcare2020
environment as well as the organic decline in sales of Erbitux®. With net sales of € 371 million (Q1 2017: € 387 million), the Asia-Pacific region accounted for 23% of Healthcare sales (Q1 2017: 22%). Organic growth of 3.2% was primarily attrib-utable to the double-digit organic sales growth in Consumer Health, both with local brands (Evion®) and the global core strategic brands Nasivin® and Neurobion®. In the Biopharma business, organic sales growth was delivered by products to treat infertility, particularly Gonal-f®, and by medicines from our General Medicine franchise (including CardioMetabolic Care). Commission income for Xalkori® from the co-commer-cialization agreement with Pfizer also increased. This develop-ment was offset by the organic decline in sales of Erbitux®. Exchange rate effects of –7.3% canceled out the positive devel-opment entirely.
The North America region, which was massively affected by the exchange rate development of the U.S. dollar against the euro, generated net sales of € 327 million (Q1 2017: € 371 million). This reflected a negative exchange rate effect of –12.7%. and stable organic sales growth of 0.8%. Sales of Rebif®, the top-selling medicine, declined organically, despite a price increase. Double-digit organic growth of Gonal-f® as well as initial sales of Bavencio® could only partly mitigate this development. Commission income for Xalkori® also declined owing to the development of the competitive situation. The region's contribution to net sales was 20% (Q1 2017: 21%).
The Latin America region showed stable organic sales growth of 0.4% thanks to the strong development of net sales in Consumer Health with organic growth of 9.1%, especially
with the core strategic brands, first and foremost Dolo- Neurobion®. This offset the organic decline in the Biopharma business. Organic sales growth of Erbitux® as well of products to treat infertility, including Gonal-f®, could not fully offset the decline in Rebif® sales. Taking negative foreign exchange effects of –14.3% into account, net sales amounted to € 203 million (Q1: 2017: € 235 million). The region’s contribution to Healthcare sales declined overall to 12% (Q1 2017: 14%).
The Middle East and Africa region recorded organic growth of 5.5%. Including an exchange rate effect of –7.3%, net sales amounted to € 107 million and were at the level of the year-ear-lier quarter (Q1 2017: € 109 million). The increase was mainly attributable to the performance of Rebif®, Erbitux® and the Consumer Health business, partly offset by the negative devel-opment of Concor®, Glucophage® and Gonal-f®.
HEALTHCARE Net sales components by region – Q1 2018
€ million / Change in % Net sales Organic growth1Exchange rate
effectsAcquisitions/ divestments Total change
Europe 632 1.4% –1.4% – –
North America 327 0.8% –12.7% – –12.0%
Asia-Pacific (APAC) 371 3.2% –7.3% – –4.1%
Latin America 203 0.4% –14.3% – –13.9%
Middle East and Africa (MEA) 107 5.5% –7.3% – –1.8%
Healthcare 1,640 1.8% –7.2% – –5.5%
1 Not defined by International Financial Reporting Standards (IFRS).
HEALTHCARE Net sales by region – Q1 2018€ million / % of the business sector's net sales
38 % Europa
63223 % Asia-Pacific (APAC)
37120 %
North America
327
12 % Latin America
203
7 % Middle East and Africa (MEA)
107

Quarterly Statement as of March 31, 2018 Course of Business and Economic Position Healthcare 2121
%
– 6.7
–2.9
5.7
–2.9
9.7
HEALTHCARE Product sales and organic growth1
€ million / Organic growth in %
Rebif®
Erbitux®
348
Gonal-f®
Euthyrox®
Neurobion®2
415
200
218
166
171
0.2Concor®99
105
–4.3Glucophage®149
166
81
88
Q1 2017
Q1 2018
–6.4Saizen®56
65
76
78
Net sales and the organic growth rates of the key products developed as follows:
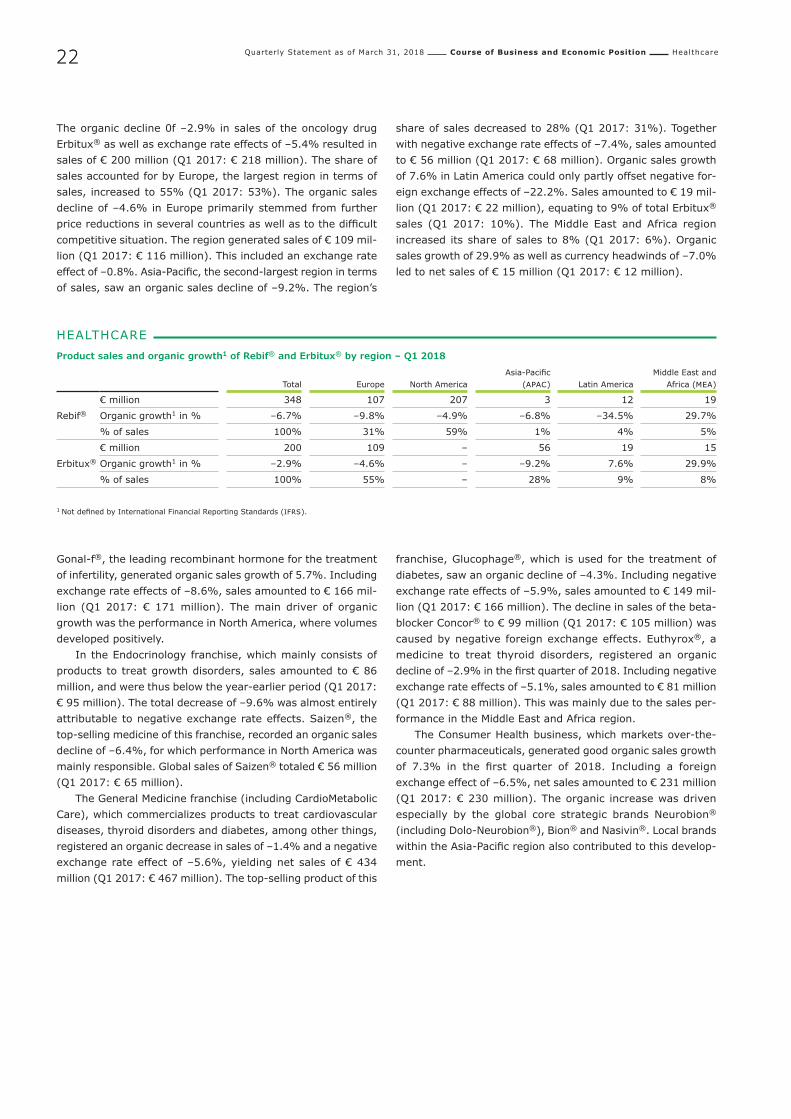
In the first quarter of 2018, sales of Rebif®, which is used to treat relapsing forms of multiple sclerosis, declined organically by –6.7% particularly as a result of the challenging competitive environment in North America and Europe. Taking into account currency headwinds of –9.4%, sales amounted to € 348 million (Q1 2017: € 415 million). North America, the most important sales market, accounted for 59% of total Rebif® sales (Q1 2017: 60%). Here, sales declined organically by –4.9%. Including exchange rate effects of –12.4%, sales amounted to € 207 million, and were thus below the year-earlier quarter (Q1 2017: € 250 million). Due to the continued difficult competitive situ-ation, a price increase could not offset declining sales volumes.
In Europe, the second-largest market which accounted for 31% of sales (Q1 2017: 29%), sales decreased organically by –9.8% due to continued competitive pressure. Including foreign exchange effects of –2.0%, sales in the region amounted to € 107 million (Q1 2017: € 122 million). The share attributable to the remaining regions, namely Middle East and Africa, Latin America as well as Asia-Pacific decreased to 10% (Q1 2017: 11%). Organic sales growth of 29.7% in the Middle East and Africa region could not offset the organic decline in the remain-ing regions as well as the overall negative exchange rate effect. Sales in these regions amounted to € 34 million (Q1 2017: € 44 million).
1 Not defined by International Financial Reporting Standards (IFRS).2 Including Neurobion® as well as Dolo-Neurobion®, Dexabion®, Diabion® and Gavindo®; previous year’s figure has been adjusted.
Quarterly Statement as of March 31, 2018 Course of Business and Economic Position Healthcare2222
The organic decline 0f –2.9% in sales of the oncology drug Erbitux® as well as exchange rate effects of –5.4% resulted in sales of € 200 million (Q1 2017: € 218 million). The share of sales accounted for by Europe, the largest region in terms of sales, increased to 55% (Q1 2017: 53%). The organic sales decline of –4.6% in Europe primarily stemmed from further price reductions in several countries as well as to the difficult competitive situation. The region generated sales of € 109 mil-lion (Q1 2017: € 116 million). This included an exchange rate effect of –0.8%. Asia-Pacific, the second-largest region in terms of sales, saw an organic sales decline of –9.2%. The region’s
share of sales decreased to 28% (Q1 2017: 31%). Together with negative exchange rate effects of –7.4%, sales amounted to € 56 million (Q1 2017: € 68 million). Organic sales growth of 7.6% in Latin America could only partly offset negative for-eign exchange effects of –22.2%. Sales amounted to € 19 mil-lion (Q1 2017: € 22 million), equating to 9% of total Erbitux® sales (Q1 2017: 10%). The Middle East and Africa region increased its share of sales to 8% (Q1 2017: 6%). Organic sales growth of 29.9% as well as currency headwinds of –7.0% led to net sales of € 15 million (Q1 2017: € 12 million).
HEALTHCARE Product sales and organic growth1 of Rebif® and Erbitux® by region – Q1 2018
Total Europe North AmericaAsia-Pacific
(APAC) Latin AmericaMiddle East and
Africa (MEA)
Rebif®€ million 348 107 207 3 12 19
Organic growth1 in % –6.7% –9.8% –4.9% –6.8% –34.5% 29.7%
% of sales 100% 31% 59% 1% 4% 5%
Erbitux®
€ million 200 109 – 56 19 15
Organic growth1 in % –2.9% –4.6% – –9.2% 7.6% 29.9%
% of sales 100% 55% – 28% 9% 8%
1 Not defined by International Financial Reporting Standards (IFRS).
Gonal-f®, the leading recombinant hormone for the treatment of infertility, generated organic sales growth of 5.7%. Including exchange rate effects of –8.6%, sales amounted to € 166 mil-lion (Q1 2017: € 171 million). The main driver of organic growth was the performance in North America, where volumes developed positively.
In the Endocrinology franchise, which mainly consists of products to treat growth disorders, sales amounted to € 86 million, and were thus below the year-earlier period (Q1 2017: € 95 million). The total decrease of –9.6% was almost entirely attributable to negative exchange rate effects. Saizen®, the top-selling medicine of this franchise, recorded an organic sales decline of –6.4%, for which performance in North America was mainly responsible. Global sales of Saizen® totaled € 56 million (Q1 2017: € 65 million).
The General Medicine franchise (including CardioMetabolic Care), which commercializes products to treat cardiovascular diseases, thyroid disorders and diabetes, among other things, registered an organic decrease in sales of –1.4% and a negative exchange rate effect of –5.6%, yielding net sales of € 434 million (Q1 2017: € 467 million). The top-selling product of this
franchise, Glucophage®, which is used for the treatment of diabetes, saw an organic decline of –4.3%. Including negative exchange rate effects of –5.9%, sales amounted to € 149 mil-lion (Q1 2017: € 166 million). The decline in sales of the beta-blocker Concor® to € 99 million (Q1 2017: € 105 million) was caused by negative foreign exchange effects. Euthyrox®, a medicine to treat thyroid disorders, registered an organic decline of –2.9% in the first quarter of 2018. Including negative exchange rate effects of –5.1%, sales amounted to € 81 million (Q1 2017: € 88 million). This was mainly due to the sales per-formance in the Middle East and Africa region.
The Consumer Health business, which markets over-the-counter pharmaceuticals, generated good organic sales growth of 7.3% in the first quarter of 2018. Including a foreign exchange effect of –6.5%, net sales amounted to € 231 million (Q1 2017: € 230 million). The organic increase was driven especially by the global core strategic brands Neurobion® (including Dolo-Neurobion®), Bion® and Nasivin®. Local brands within the Asia-Pacific region also contributed to this develop-ment.

Quarterly Statement as of March 31, 2018 Course of Business and Economic Position Healthcare 2323
The results of operations developed as follows:
HEALTHCARE Results of operations
€ million
Q1 2018 Q1 2017 Change
Net sales 1,640 1,735 –5.5%
Cost of sales –394 –371 6.0%
Gross profit 1,246 1,364 –8.6%
Marketing and selling expenses –636 –656 –3.2%
Administration costs –81 –77 5.9%
Research and development costs –385 –376 2.6%
Other operating expenses and income 67 191 –64.7%
Operating result (EBIT)1 211 445 –52.6%
Depreciation/amortization/impairment losses/reversals of impairment losses 190 184 3.2%
(of which: adjustments) (2) (1) (> 100.0%)
EBITDA1 401 629 –36.3%
Restructuring costs 1 – –
Integration costs/IT costs 3 4 –28.1%
Gains/losses on the divestment of businesses – – –
Acquisition-related adjustments – – –
Other adjustments 25 – –
EBITDA pre1 430 633 –32.0%
1 Not defined by International Financial Reporting Standards (IFRS).
Gross profit of the Healthcare business sector decreased by –8.6% to € 1,246 million in the first quarter of 2018 (Q1 2017: € 1,364 million). The foreign exchange effect, which led to the decline in net sales, did not impact the development of produc-tion costs to the same extent. Irrespective of the foreign exchange effect, earnings were at the previous year’s level. This resulted in a gross margin of 76.0% (Q1 2017: 78.6%).
Marketing and selling expenses reflected market launches, especially that of Mavenclad®. The decline was due to a favor-able exchange rate effect. Research and development costs reflected continued investments in the development pipeline and amounted to € 385 million (Q1 2017: € 376 million). The research spending ratio increased to 23.5% (Q1 2017: 21.7%). In the first quarter of 2018, other operating expenses and
income included a milestone payment of € 50 million to be made by BioMarin Pharmaceutical Inc., USA, in connection with the divestment of Peg-Pal in 2016. The year-earlier quarter was positively influenced by income from a contractually agreed one-time payment of € 116 million for future license payments as well as a milestone payment recognized as income for the regulatory approval of Bavencio® in Merkel cell carcinoma in the United States. In addition, the first quarter of 2018 included advisory fees that were incurred in conjunction with the divest-ment process for the Consumer Health business and then elim-inated during the calculation of EBITDA pre.
Consequently, EBITDA pre amounted to € 430 million (Q1 2017: € 633 million), corresponding to an EBITDA pre margin of 26.3% (Q1 2017: 36.5%).

Quarterly Statement as of March 31, 2018 Course of Business and Economic Position Healthcare2424
DEVELOPMENT OF BUSINESS FREE CASH FLOWIn the first quarter of 2018, business free cash flow was € 310 million (Q1 2017: € 356 million). The decline was primarily
attributable to lower EBITDA pre. This development was miti-gated to some extent by optimized working capital manage-ment, especially with respect to receivables.
HEALTHCARE Business free cash flow1
€ million Q1 2018 Q1 2017 Change
EBITDA pre1 430 633 –32.0%
Investments in property, plant and equipment, software as well as advance payments for intangible assets –44 –45 –2.3%
Changes in inventories –12 –24 –48.9%
Changes in trade accounts receivable as well as receivables from royalties and licenses –64 –207 –69.1%
Business free cash flow1 310 356 –13.0%
1 Not defined by International Financial Reporting Standards (IFRS).
Quarterly Statement as of March 31, 2018 Course of Business and Economic Position Life Science 2525
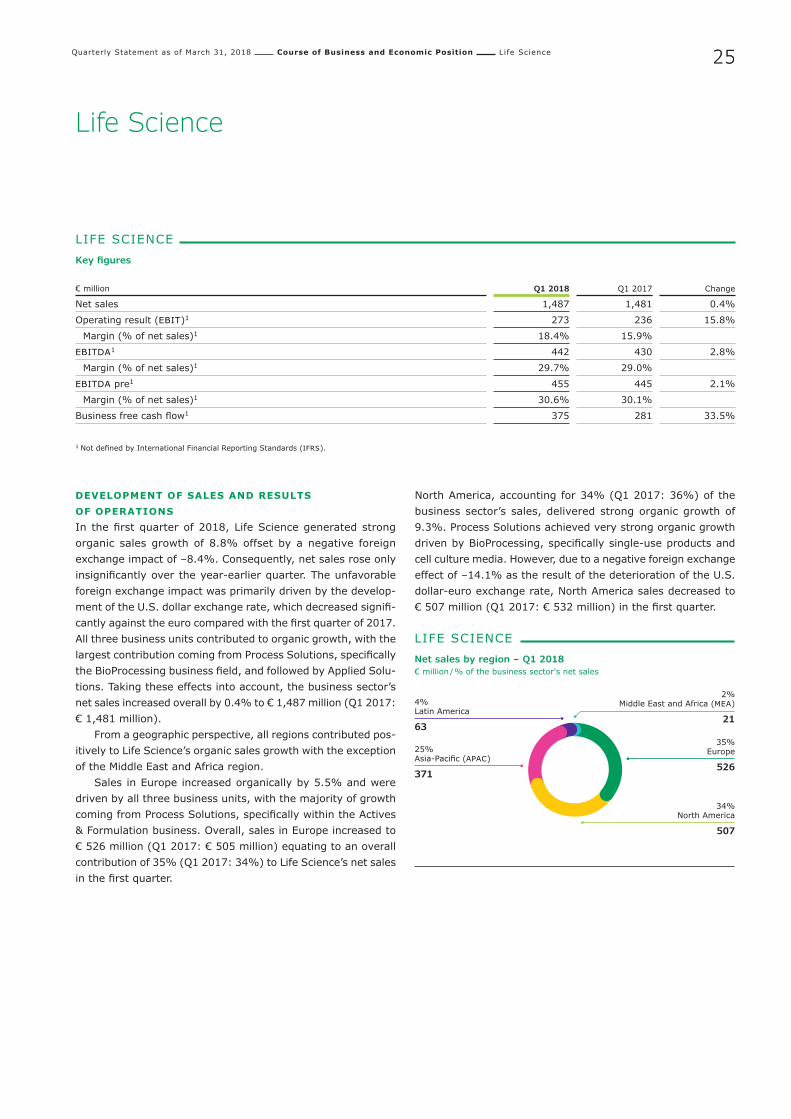
LIFE SCIENCE Net sales by region – Q1 2018€ million / % of the business sector's net sales
35% Europe
526
25% Asia-Pacific (APAC)
371
34% North America
507
4% Latin America
63
2% Middle East and Africa (MEA)
21
Life Science
LIFE SCIENCE Key figures
€ million Q1 2018 Q1 2017 Change
Net sales 1,487 1,481 0.4%
Operating result (EBIT)1 273 236 15.8%
Margin (% of net sales)1 18.4% 15.9%
EBITDA1 442 430 2.8%
Margin (% of net sales)1 29.7% 29.0%
EBITDA pre1 455 445 2.1%
Margin (% of net sales)1 30.6% 30.1%
Business free cash flow1 375 281 33.5%
1 Not defined by International Financial Reporting Standards (IFRS).
DEVELOPMENT OF SALES AND RESULTS OF OPERATIONSIn the first quarter of 2018, Life Science generated strong organic sales growth of 8.8% offset by a negative foreign exchange impact of –8.4%. Consequently, net sales rose only insignificantly over the year-earlier quarter. The unfavorable foreign exchange impact was primarily driven by the develop-ment of the U.S. dollar exchange rate, which decreased signifi-cantly against the euro compared with the first quarter of 2017. All three business units contributed to organic growth, with the largest contribution coming from Process Solutions, specifically the BioProcessing business field, and followed by Applied Solu-tions. Taking these effects into account, the business sector’s net sales increased overall by 0.4% to € 1,487 million (Q1 2017: € 1,481 million).
From a geographic perspective, all regions contributed pos-itively to Life Science’s organic sales growth with the exception of the Middle East and Africa region.
Sales in Europe increased organically by 5.5% and were driven by all three business units, with the majority of growth coming from Process Solutions, specifically within the Actives & Formulation business. Overall, sales in Europe increased to € 526 million (Q1 2017: € 505 million) equating to an overall contribution of 35% (Q1 2017: 34%) to Life Science’s net sales in the first quarter.
North America, accounting for 34% (Q1 2017: 36%) of the business sector’s sales, delivered strong organic growth of 9.3%. Process Solutions achieved very strong organic growth driven by BioProcessing, specifically single-use products and cell culture media. However, due to a negative foreign exchange effect of –14.1% as the result of the deterioration of the U.S. dollar-euro exchange rate, North America sales decreased to € 507 million (Q1 2017: € 532 million) in the first quarter.

Quarterly Statement as of March 31, 2018 Course of Business and Economic Position Life Science2626
Asia-Pacific achieved very strong organic sales growth of 14.7% with positive developments in all business units. Process Solu-tions also led the growth in this region with very good perfor-mance in BioProcessing specifically in China, India and Singa-pore. Overall, Asia-Pacific sales increased to € 371 million (Q1 2017: € 350 million) which represented 25% (Q1 2017: 23%) of Life Science’s net sales in the first quarter.
Sales in Latin America grew organically by 7.5% mainly driven by Process Solutions, specifically within Actives & For-
mulation. Organic growth, which was offset by a negative cur-rency impact of –15.9%, led to net sales for the region of € 63 million (Q1 2017: € 69 million).
Sales in the Middle East and Africa region saw an organic decrease of –14.8%, which was primarily driven by Process and Research Solutions. Net sales for the region were € 21 million (Q1 2017: € 25 million).
LIFE SCIENCE Net sales components by region – Q1 2018
€ million / Change in % Net sales Organic growth1Exchange rate
effectsAcquisitions/ divestments Total change
Europe 526 5.5% –1.4% – 4.1%
North America 507 9.3% –14.1% – –4.8%
Asia-Pacific (APAC) 371 14.7% –8.8% – 5.9%
Latin America 63 7.5% –15.9% – –8.4%
Middle East and Africa (MEA) 21 –14.8% –2.0% – –16.8%
Life Science 1,487 8.8% –8.4% – 0.4%
1 Not defined by International Financial Reporting Standards (IFRS).
All Life Science business units contributed to the positive organic sales performance in the first quarter of 2018.
The Process Solutions business unit, which markets prod-ucts and services for the entire pharmaceutical production value chain, generated organic sales growth of 14.1%, which was the highest rate within the Life Science business sector. Despite an unfavorable foreign exchange effect of –8.8%, sales totaled € 583 million in the first quarter of 2018 (Q1 20171: € 554 million). Process Solutions thus accounted for 39% (Q1 2017: 37%) of Life Science net sales. The increase was primarily driven by BioProcessing, specifically with higher demand for single-use products and cell culture media. As in the preceding quarter, there were no further signs of weaken-ing demand among global accounts and demand from local accounts continued to show dynamic growth.
The Research Solutions business unit, which provides prod-ucts and services to support life science research for pharma-ceutical, biotechnology, and academic research laboratories,
recorded a moderate increase in organic sales of 4.3%. How-ever, as a result of negative foreign exchange effects of –8.1%, sales declined to € 509 million (Q1 20171: € 529 million). Organic growth was primarily driven by an increase in the Lab and Specialty Chemicals business. The share of sales accounted for by Research Solutions in the first quarter of 2018 was 34% (Q1 2017: 36%).
Applied Solutions, which accounted for a 27% (Q1 2017: 27%) share of Life Science first-quarter sales, delivered strong organic sales growth of 7.3% with its broad range of products for researchers as well as scientific and industrial laboratories. Organic growth occurred across the majority of the Applied Solutions portfolio. Due to negative exchange rate effects of –8.2%, sales declined slightly to € 395 million (Q1 20171: € 399 million).
1 Previous year’s figures have been adjusted due to an internal realignment.
Quarterly Statement as of March 31, 2018 Course of Business and Economic Position Life Science 2727
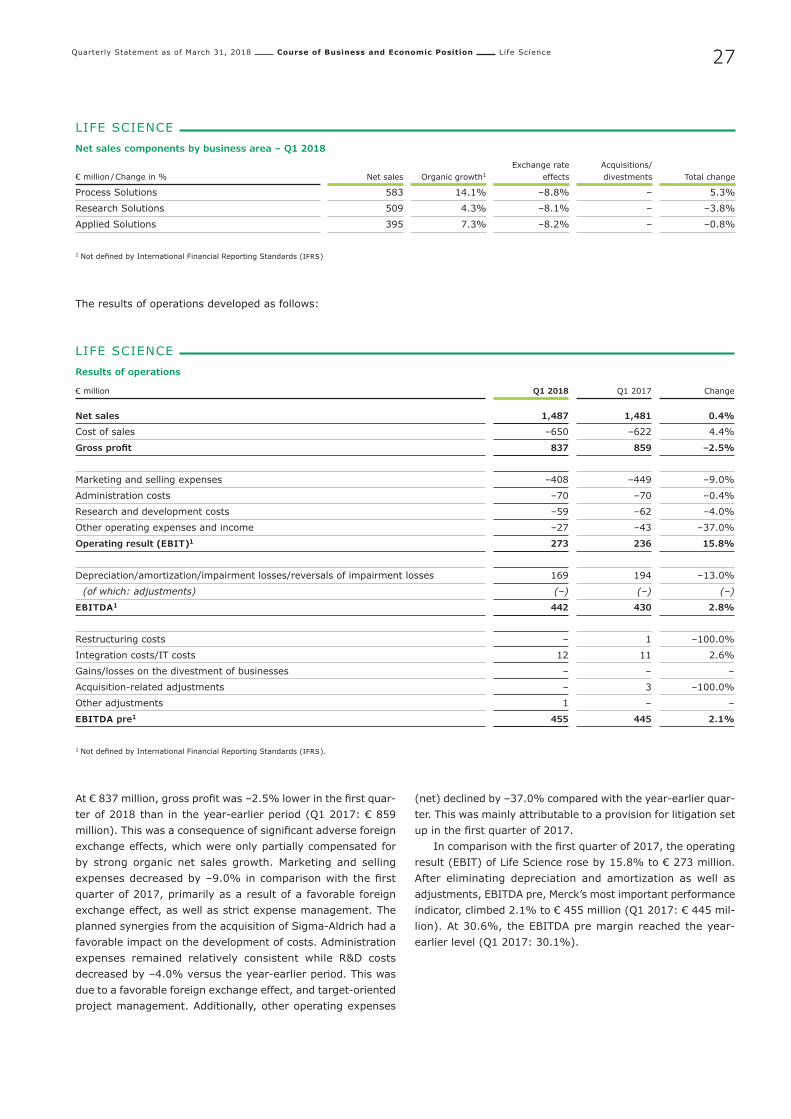
LIFE SCIENCE Net sales components by business area – Q1 2018
€ million / Change in % Net sales Organic growth1Exchange rate
effectsAcquisitions/ divestments Total change
Process Solutions 583 14.1% –8.8% – 5.3%
Research Solutions 509 4.3% –8.1% – –3.8%
Applied Solutions 395 7.3% –8.2% – –0.8%
1 Not defined by International Financial Reporting Standards (IFRS)
The results of operations developed as follows:
LIFE SCIENCE Results of operations
€ million
Q1 2018 Q1 2017 Change
Net sales 1,487 1,481 0.4%
Cost of sales –650 –622 4.4%
Gross profit 837 859 –2.5%
Marketing and selling expenses –408 –449 –9.0%
Administration costs –70 –70 –0.4%
Research and development costs –59 –62 –4.0%
Other operating expenses and income –27 –43 –37.0%
Operating result (EBIT)1 273 236 15.8%
Depreciation/amortization/impairment losses/reversals of impairment losses 169 194 –13.0%
(of which: adjustments) (–) (–) (–)
EBITDA1 442 430 2.8%
Restructuring costs – 1 –100.0%
Integration costs/IT costs 12 11 2.6%
Gains/losses on the divestment of businesses – – –
Acquisition-related adjustments – 3 –100.0%
Other adjustments 1 – –
EBITDA pre1 455 445 2.1%
1 Not defined by International Financial Reporting Standards (IFRS).
At € 837 million, gross profit was –2.5% lower in the first quar-ter of 2018 than in the year-earlier period (Q1 2017: € 859 million). This was a consequence of significant adverse foreign exchange effects, which were only partially compensated for by strong organic net sales growth. Marketing and selling expenses decreased by –9.0% in comparison with the first quarter of 2017, primarily as a result of a favorable foreign exchange effect, as well as strict expense management. The planned synergies from the acquisition of Sigma-Aldrich had a favorable impact on the development of costs. Administration expenses remained relatively consistent while R&D costs decreased by –4.0% versus the year-earlier period. This was due to a favorable foreign exchange effect, and target-oriented project management. Additionally, other operating expenses
(net) declined by –37.0% compared with the year-earlier quar-ter. This was mainly attributable to a provision for litigation set up in the first quarter of 2017.
In comparison with the first quarter of 2017, the operating result (EBIT) of Life Science rose by 15.8% to € 273 million. After eliminating depreciation and amortization as well as adjustments, EBITDA pre, Merck’s most important performance indicator, climbed 2.1% to € 455 million (Q1 2017: € 445 mil-lion). At 30.6%, the EBITDA pre margin reached the year- earlier level (Q1 2017: 30.1%).
Quarterly Statement as of March 31, 2018 Course of Business and Economic Position Life Science2828
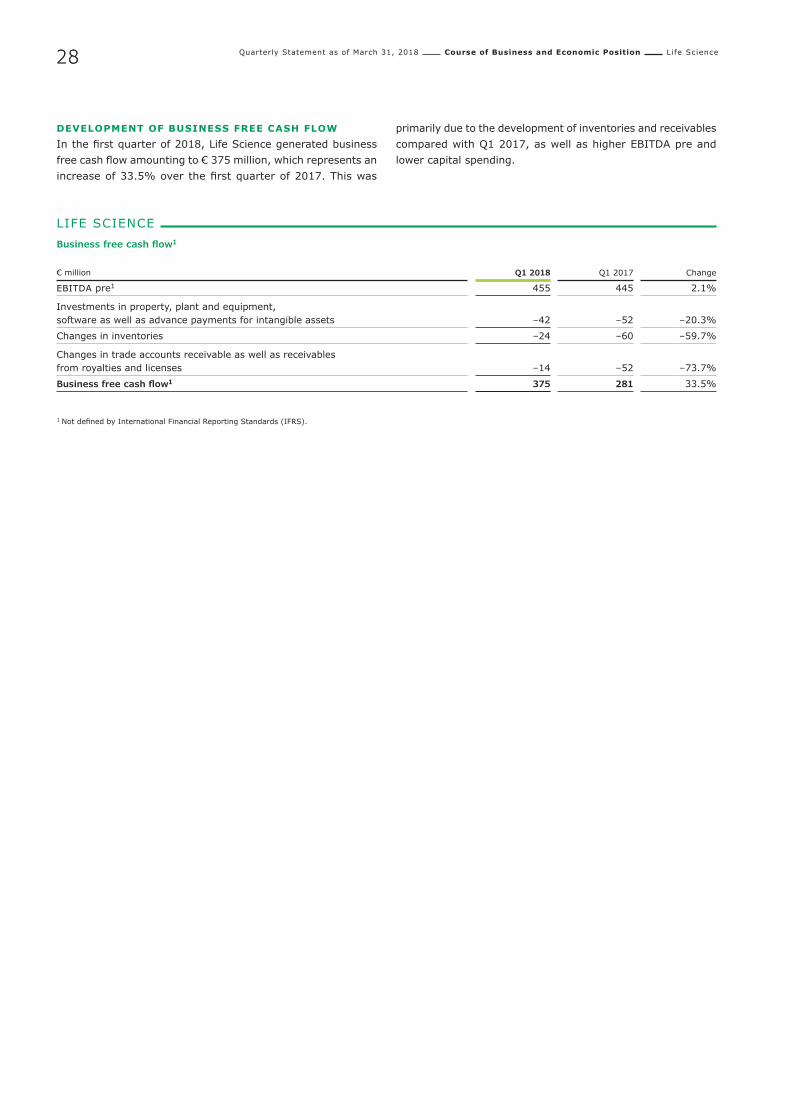
DEVELOPMENT OF BUSINESS FREE CASH FLOW In the first quarter of 2018, Life Science generated business free cash flow amounting to € 375 million, which represents an increase of 33.5% over the first quarter of 2017. This was
primarily due to the development of inventories and receivables compared with Q1 2017, as well as higher EBITDA pre and lower capital spending.
LIFE SCIENCE Business free cash flow1
€ million Q1 2018 Q1 2017 Change
EBITDA pre1 455 445 2.1%
Investments in property, plant and equipment, software as well as advance payments for intangible assets –42 –52 –20.3%
Changes in inventories –24 –60 –59.7%
Changes in trade accounts receivable as well as receivables from royalties and licenses –14 –52 –73.7%
Business free cash flow1 375 281 33.5%
1 Not defined by International Financial Reporting Standards (IFRS).

Quarterly Statement as of March 31, 2018 Course of Business and Economic Position Performance Materials 2929
Performance Materials
PERFORMANCE MATERIALS Key figures
€ million Q1 2018 Q1 2017 Change
Net sales 564 645 –12.5%
Operating result (EBIT)1 136 195 –30.4%
Margin (% of net sales)1 24.1% 30.3%
EBITDA1 192 257 –25.0%
Margin (% of net sales)1 34.1% 39.8%
EBITDA pre1 196 263 –25.7%
Margin (% of net sales)1 34.7% 40.9%
Business free cash flow1 137 233 –41.0%
1 Not defined by International Financial Reporting Standards (IFRS)
DEVELOPMENT OF NET SALES AND RESULTS OF OPERATIONSIn 2018, the Performance Materials business sector is aligning itself even more strongly to the needs of customers and markets and therefore combining its activities in three newly created business units: Display Solutions, Semiconductor Solutions and Surface Solutions. The business with OLED materials is being integrated into the Display Solutions business unit, while the remaining part of the former Advanced Technologies business unit, mainly comprising optoelectronic materials, is being allo-cated to the Surface Solutions business unit.
In the first quarter of 2018, net sales of the Performance Materials business sector declined by –12.5% to € 564 million (Q1 2017: € 645 million). This resulted mainly from negative foreign exchange effects of –8.5%. The decrease was addition-ally intensified by an organic decline in sales (–4.0%) as the business with display materials fell short of the year-earlier quarter.
The Display Solutions business unit, consisting of the Liquid Crystals business as well as OLED and complementary mate-rials, accounts for slightly more than 50% of the overall net
sales of Performance Materials. This business unit saw an organic decrease in sales, but continued to defend its market leadership position. The decline in sales in the first quarter of 2018 stemmed from the performance of established liquid crystal technologies, caused by decrease in the unusually high market shares as well as price declines customary in this indus-try. An exception here were OLED materials as well as the energy-saving UB-FFS technology, which each recorded double-digit organic growth yet were unable to compensate for the organic decline in sales of established liquid crystal tech-nologies.
The Semiconductor Solutions business unit comprises the business with materials used in integrated circuit production. The business unit delivered very strong organic growth, to which all major businesses contributed. Particularly high growth rates were achieved with dielectric materials.
The Surface Solutions business unit combines the busi-nesses with pigments and functional fillers as well as optoelec-tronic materials. In the first quarter of 2018, the Surface Solu-tions business unit recorded a slight decline in net sales, which was mainly due to the exceptionally strong year-earlier quarter.
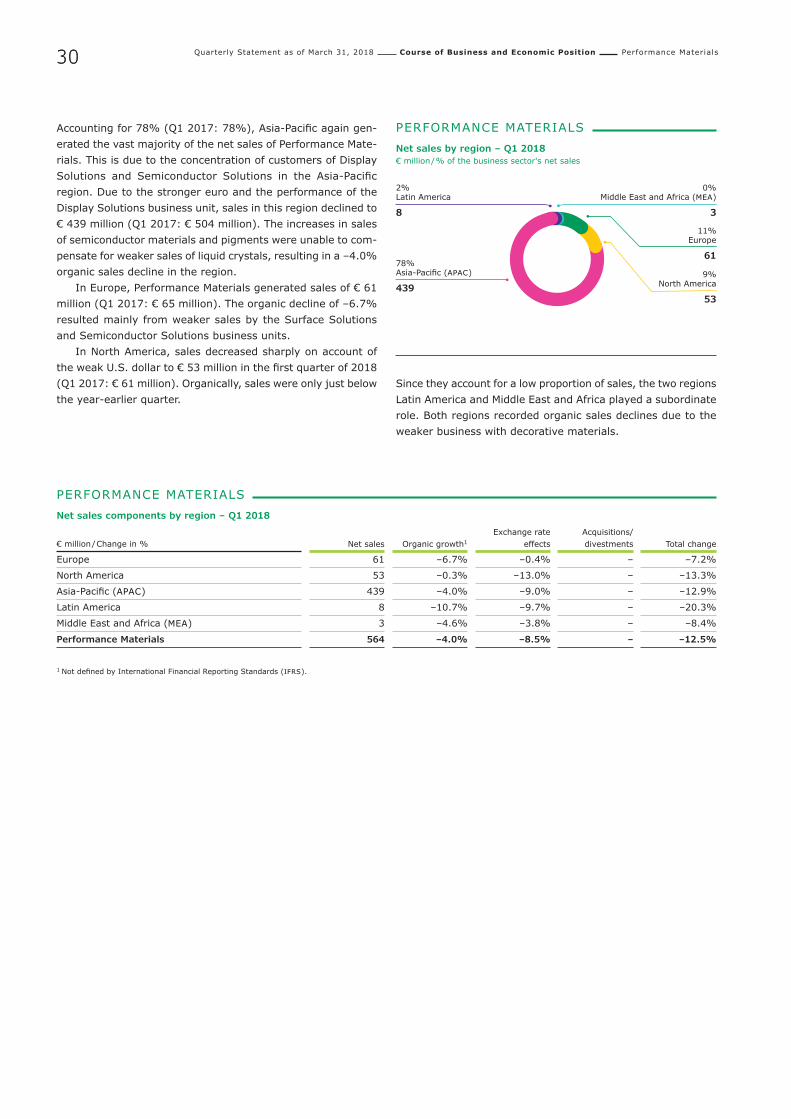
Quarterly Statement as of March 31, 2018 Course of Business and Economic Position Performance Materials3030
Accounting for 78% (Q1 2017: 78%), Asia-Pacific again gen-erated the vast majority of the net sales of Performance Mate-rials. This is due to the concentration of customers of Display Solutions and Semiconductor Solutions in the Asia-Pacific region. Due to the stronger euro and the performance of the Display Solutions business unit, sales in this region declined to € 439 million (Q1 2017: € 504 million). The increases in sales of semiconductor materials and pigments were unable to com-pensate for weaker sales of liquid crystals, resulting in a –4.0% organic sales decline in the region.
In Europe, Performance Materials generated sales of € 61 million (Q1 2017: € 65 million). The organic decline of –6.7% resulted mainly from weaker sales by the Surface Solutions and Semiconductor Solutions business units.
In North America, sales decreased sharply on account of the weak U.S. dollar to € 53 million in the first quarter of 2018 (Q1 2017: € 61 million). Organically, sales were only just below the year-earlier quarter.
Since they account for a low proportion of sales, the two regions Latin America and Middle East and Africa played a subordinate role. Both regions recorded organic sales declines due to the weaker business with decorative materials.
PERFORMANCE MATERIALS Net sales components by region – Q1 2018
€ million / Change in % Net sales Organic growth1Exchange rate
effectsAcquisitions/ divestments Total change
Europe 61 –6.7% –0.4% – –7.2%
North America 53 –0.3% –13.0% – –13.3%
Asia-Pacific (APAC) 439 –4.0% –9.0% – –12.9%
Latin America 8 –10.7% –9.7% – –20.3%
Middle East and Africa (MEA) 3 –4.6% –3.8% – –8.4%
Performance Materials 564 –4.0% –8.5% – –12.5%
1 Not defined by International Financial Reporting Standards (IFRS).
PERFORMANCE MATERIALS Net sales by region – Q1 2018€ million / % of the business sector's net sales
0% Middle East and Africa (MEA)
3
78% Asia-Pacific (APAC)
4399%
North America
53
2% Latin America
8
11% Europe
61
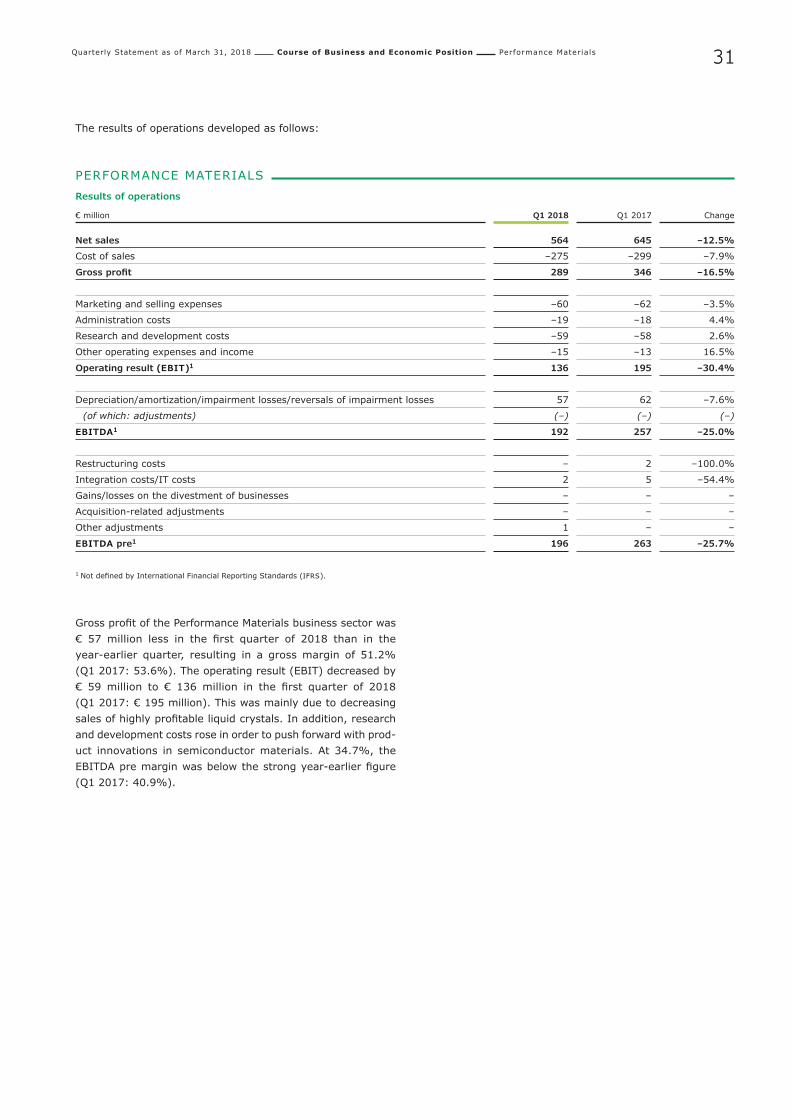
Quarterly Statement as of March 31, 2018 Course of Business and Economic Position Performance Materials 3131
The results of operations developed as follows:
PERFORMANCE MATERIALS Results of operations
€ million
Q1 2018 Q1 2017 Change
Net sales 564 645 –12.5%
Cost of sales –275 –299 –7.9%
Gross profit 289 346 –16.5%
Marketing and selling expenses –60 –62 –3.5%
Administration costs –19 –18 4.4%
Research and development costs –59 –58 2.6%
Other operating expenses and income –15 –13 16.5%
Operating result (EBIT)1 136 195 –30.4%
Depreciation/amortization/impairment losses/reversals of impairment losses 57 62 –7.6%
(of which: adjustments) (–) (–) (–)
EBITDA1 192 257 –25.0%
Restructuring costs – 2 –100.0%
Integration costs/IT costs 2 5 –54.4%
Gains/losses on the divestment of businesses – – –
Acquisition-related adjustments – – –
Other adjustments 1 – –
EBITDA pre1 196 263 –25.7%
1 Not defined by International Financial Reporting Standards (IFRS).
Gross profit of the Performance Materials business sector was € 57 million less in the first quarter of 2018 than in the year-earlier quarter, resulting in a gross margin of 51.2% (Q1 2017: 53.6%). The operating result (EBIT) decreased by € 59 million to € 136 million in the first quarter of 2018 (Q1 2017: € 195 million). This was mainly due to decreasing sales of highly profitable liquid crystals. In addition, research and development costs rose in order to push forward with prod-uct innovations in semiconductor materials. At 34.7%, the EBITDA pre margin was below the strong year-earlier figure (Q1 2017: 40.9%).
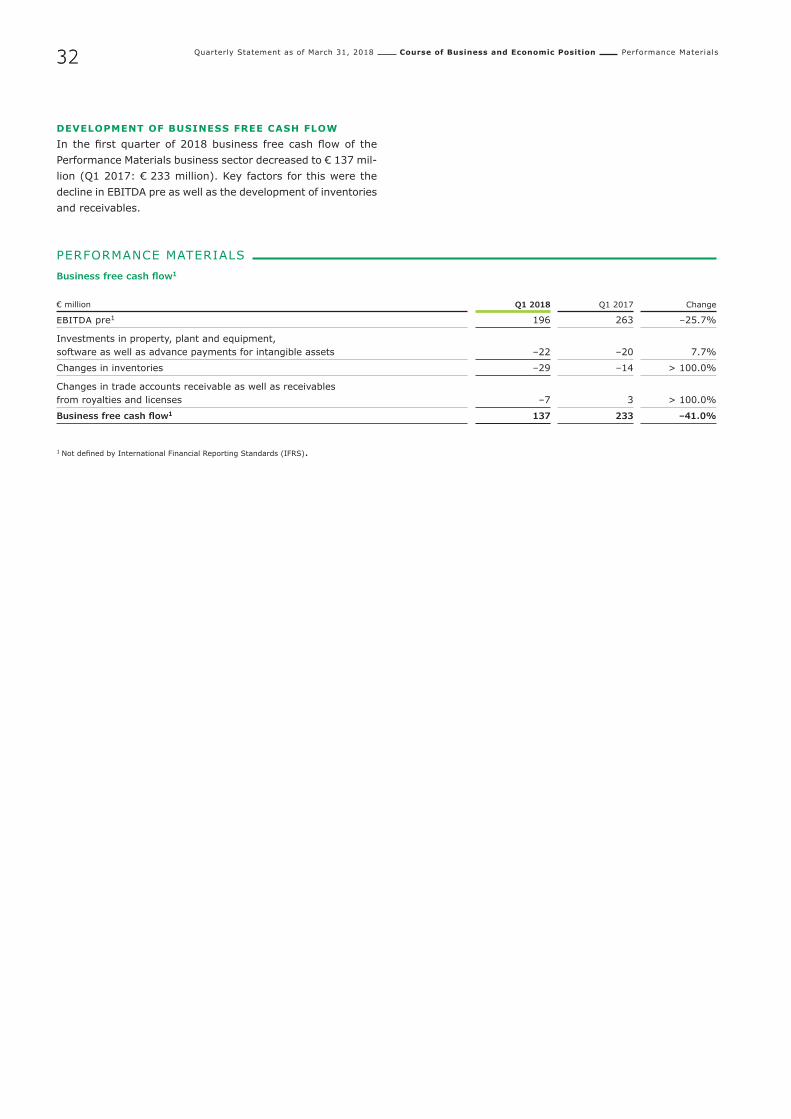
Quarterly Statement as of March 31, 2018 Course of Business and Economic Position Performance Materials3232
DEVELOPMENT OF BUSINESS FREE CASH FLOW In the first quarter of 2018 business free cash flow of the Performance Materials business sector decreased to € 137 mil-lion (Q1 2017: € 233 million). Key factors for this were the decline in EBITDA pre as well as the development of inventories and receivables.
PERFORMANCE MATERIALS Business free cash flow1
€ million Q1 2018 Q1 2017 Change
EBITDA pre1 196 263 –25.7%
Investments in property, plant and equipment, software as well as advance payments for intangible assets –22 –20 7.7%
Changes in inventories –29 –14 > 100.0%
Changes in trade accounts receivable as well as receivables from royalties and licenses –7 3 > 100.0%
Business free cash flow1 137 233 –41.0%
1 Not defined by International Financial Reporting Standards (IFRS).

Quarterly Statement as of March 31, 2018 Course of Business and Economic Position Performance Materials 3333
Corporate and Other
Corporate and Other comprises Group administration expenses for Group functions that cannot be directly allocated to the business sectors, such as Finance, Procurement, Legal, Com-munications, and Human Resources. Corporate costs addition-
ally encompass expenses for central, non-allocated IT func-tions, including expenses related to the expansion and harmonization of IT systems within the Merck Group as well as research and development costs spanning business sectors.
CORPORATE AND OTHER Key figures
€ million Q1 2018 Q1 2017 Change
Operating result (EBIT)1 –102 –122 –16.0%
EBITDA1 –89 –113 –20.6%
EBITDA pre1 –66 –101 –35.4%
Business free cash flow1 –94 –111 –15.3%
1 Not defined by International Financial Reporting Standards (IFRS).
In the first quarter of 2018, administration expenses reported under Corporate and Other amounted to € 59 million (Q1 2017: € 78 million). Research and development costs spanning busi-ness sectors, for instance expenses for the Innovation Center or for the New Business Builder unit (entering innovation fields and conducting innovation projects), were allocated to Corpo-rate and Other in the amount of € 11 million in the first quarter of 2018 (Q1 2017: € 0 million). Other operating expenses (net) decreased to € –29 million (Q1 2017: € –40 million). This was mainly due to the positive development of the foreign exchange
result. Consequently, in the first quarter of 2018 the operating result (EBIT) amounted to € –102 million (Q1 2017: € –122 million) and EBITDA was € –89 million (Q1 2017: € –113 mil-lion). After adjustments, EBITDA pre totaled € –66 million (Q1 2017: € -101 million). The improvement in EBITDA pre had a positive effect on the development of business free cash flow. Taking higher investments into account, this key figure improved to € –94 million (Q1: 2017: € –111 million).

3434 Quarterly Statement as of March 31, 2018 Outlook
Outlook
With the publication of the results of 2017, we provided a forecast of the development of net sales, EBITDA pre and business free cash flow for the Merck Group and the individual business sectors in 2018. Following the end of the first quarter, this forecast is now specified in the following report.
On April 19, 2018, Merck announced the signing of an agreement to divest its global Consumer Health business to Procter & Gamble (P&G) for around € 3.4 billion in cash. The transaction, which is expected to close by the end of the fourth quarter of 2018, is subject to regulatory approvals and satis-faction of certain other customary closing conditions. As of the report on the second quarter, the Consumer Health business will be reported as a “discontinued operation”. The previous year's figures and the figures for the first quarter will be cor-respondingly adjusted. The following forecast takes into account the resulting effects and presents the expected sales and earnings figures for the Merck Group and the Healthcare business sector both including and excluding the Consumer Health business.
Following a solid first quarter, we continue to expect for the full year 2018 a moderate organic net sales increase of 3% to 5% over the previous year. Since the beginning of the year, the euro has continued to appreciate against the U.S. dollar and various emerging market currencies. In particular, in the first quarter of 2018, the €/US$ exchange rate was slightly above the range of 1.18 to 1.22 that we had expected to date for the full year 2018. Therefore, we assume that exchange rate changes will have a moderately negative effect of –4% to –6% on our net sales growth over the previous year. In contrast to our previous estimate for the full year, we expect a €/US$ exchange rate in the range of 1.19–1.23. This devel-opment depends heavily on current political and macroeco-nomic factors. Consequently, we continue to generally expect high exchange rate volatility in 2018. The planned divestment of our Consumer Health business is likely to reduce full-year
net sales of the Merck Group by between € 0.9 billion and € 1.0 billion. Overall, we thus forecast Group net sales of € 15.0 billion to € 15.5 billion for 2018 based on an unchanged portfolio; and of € 14.0 billion to € 14.5 billion from continuing operations taking into account the divestment of the Consumer Health business. The divestment does not change our under-lying forecasts regarding organic sales growth and the foreign exchange impact.
We expect that Group EBITDA pre will be in a corridor between € 3.95 billion and € 4.15 billion in 2018. We confirm our original expectation of a slight organic decline of –1% to –3% in EBITDA pre compared with the previous year. The decrease in comparison with the previous year primarily reflects negative exchange rate effects on EBITDA pre, which we now see in a range of –5% to –7% (previously –4% to –6%) versus 2017 owing to the latest exchange rate developments. In our estimation, the divestment of our Consumer Health business will lower EBITDA pre of the Merck Group by between € 170 million and € 200 million, leading to EBITDA pre from continuing operations in a range of between € 3.75 billion and € 4.0 billion. The divestment of the Consumer Health business does not change our assumptions for organic EBITDA pre development and exchange rate effects.
For the Healthcare business sector, our forecast for a mod-erate organic increase in net sales in 2018 in comparison with the previous year remains unchanged. This estimate is not altered by the changed presentation of our Consumer Health business as a discontinued operation. As a result of this pre-sentation, net sales of the Healthcare business sector are likely to decrease by between € 0.9 billion and € 1.0 billion. Overall, our expectations have not changed from our latest forecast published in the Annual Report for 2017: We assume that the positive development of demand in growth markets will con-tribute significantly to the expected organic development of sales and will compensate for the expected decline in sales of
3535Quarterly Statement as of March 31, 2018 Outlook
Rebif® and the continued price pressure in individual regions. Moreover, we expect that Bavencio® and Mavenclad® will con-tribute significantly to sales growth with a mid double-digit euro million and high double-digit euro million amount, respec-tively. We forecast EBITDA pre of the Healthcare business sec-tor in 2018 in a range between € 1.77 billion to € 1.83 billion, assuming an unchanged portfolio. The strong decline versus the previous year (€ 1,949 million) is due first and foremost to negative exchange rate effects that are expected to adversely impact EBITDA pre by –5% to –7% in the year-on-year comparison. However, we still expect a slight organic earnings decline of –1% to –2% compared with 2017. Positive effects of around € 200 million, which we realized in 2017, will not be incurred in 2018. This includes the Bavencio® milestone payments from Pfizer and a one-time payment received as compensation for future license payments. Increasing research and development costs for further pipeline development, par-ticularly in immuno-oncology, will remain a key driver of the forecast organic development of EBITDA pre. However, this budgeted cost increase will be further specified in the course of the year depending on clinical data and prioritization deci-sions. Against the background of the market launches of Bavencio® and Mavenclad® in additional countries, we also expect an increase in our marketing and selling expenses. In addition, we assume that our product mix will develop unfa-vorably owing to the expected decline in sales of Rebif®. The divestment of our Biosimilars business in 2017 and the result-ing absence of research and development costs as well as increasing earnings contributions from our newly approved products Bavencio® and Mavenclad® will partly offset the expected decline in organic EBITDA pre. The entitlement to a milestone payment of € 50 million from BioMarin in the first quarter also had a positive effect. Taking into consideration the changed presentation of our Consumer Health business as a discontinued operation, we see EBITDA pre of the Healthcare business sector in a range of between € 1.58 billion and € 1.65 billion.
For our Life Science business sector, our forecast of solid organic sales growth slightly above the expected medium-term market growth of approximately 4% per year remains
unchanged for 2018. This also includes sales synergies from the acquisition of Sigma-Aldrich. We believe that Process Solu-tions will continue to contribute the largest share to organic sales growth. Research Solutions and Applied Solutions will also contribute positively to organic sales growth. The realiza-tion of synergies from the integration of Sigma-Aldrich has high priority for us and we will continue to vigorously pursue this aim in 2018 as well. We continue to expect a positive effect of around € 95 million on earnings in addition to the cost syn-ergies already realized, which had reached a level of € 185 million in the previous year. We confirm our estimation in the most recent forecast and expect organic earnings growth for the Life Science business sector at the previous year’s level of about 8%. However, negative exchange rate effects will pre-sumably have a moderately negative impact of –4% to –6% on earnings growth. Overall, we forecast EBITDA pre in a range of between € 1.82 billion and € 1.87 billion.
We continue to forecast a slight to moderate organic sales decline in the Performance Materials business sector in 2018 compared with 2017. Our estimation has not changed in com-parison with our latest forecast: the adjustment processes in our Liquid Crystals businesses will continue as before. The decline in our market shares primarily in China, which in recent years were unusually high, is still underway. Consequently, the price pressure customary in this industry cannot be offset by corresponding volume growth. An unchanged good organic sales development in our other business fields can only partly mitigate this trend. Due to unfavorable foreign exchange developments, we expect to see a moderately negative foreign exchange effect on net sales of Performance Materials in 2018. Despite this development, we nevertheless confirm our fore-cast for an organic decline in EBITDA pre in the mid-teens range versus the previous year, that means approximately between –14% to –16%. The foreign exchange environment, which has become somewhat more difficult since our previous forecast, is likely to weigh heavily on EBITDA pre by around –8% to –10% versus the previous year. In total, we forecast EBITDA pre for our Performance Materials business sector of between € 725 million and € 765 million in 2018.

3636 Quarterly Statement as of March 31, 2018 Outlook
We assume that EBITDA pre of Corporate and Other in 2018 will amount to between € –320 million and € –360 million. The main reasons are continued investments in innovation and dig-italization initiatives, which we believe hold promise for new
business opportunities and greater efficiency, linked with future savings potential. We are investing further in our IT infrastruc-ture. By contrast, expected currency hedging gains should have a compensating effect in 2018.
MERCK GROUP Forecast for FY 2018
€ million Net sales EBITDA pre Business free cash flow
Merck Group • Organic growth 3% to 5%• Exchange rate effect –4% to –6%• ~15,000 to 15,500
(excluding Consumer Health~14,000 to 14,500)
• Organic decline –1% to –3% vs. 2017
• Exchange rate effect–5% to –7%
• ~ 3,950 to 4,150(excluding Consumer Health~3,750 to 4,000)
• ~2,460 to 2,770(excluding Consumer Health~2,310 to 2,620)
Healthcare • Moderate organic growth• Moderately negative foreign exchange effect
• Organic decline –1% to –2%• Exchange rate effect
–5% to –7%• ~1,770 to 1,830
(excluding Consumer Health~1,580 to 1,650)
• ~1,140 to 1,240(excluding Consumer Health~1,000 to 1,080)
Life Science • Organic growth slightly above the medium-term market average of 4% p.a.
• Moderately negative foreign exchange effect
• Organic growth at aroundthe previous year’s level of 8%
• Exchange rate effect–4% to –6%
• ~1,820 to 1,870
• ~1,310 to 1,400
Performance Materials
• Slight to moderate organic decline• Moderately negative foreign exchange effect
• Organic decline–14% to –16%vs. 2017
• Exchange rate effect–8% to –10%
• ~725 to 765
• ~480 to 550
Corporate and Other – • ~–360 to –320 • ~–490 to –440
EPS pre € 5.30 to € 5.65 (excluding Consumer Health € 5.00 to € 5.40)
Full-year FX assumptions for 2018: € 1 = US$ 1.19 to 1.23 € 1 = CHF 1.15 to 1.20

Supplemental Financial Information
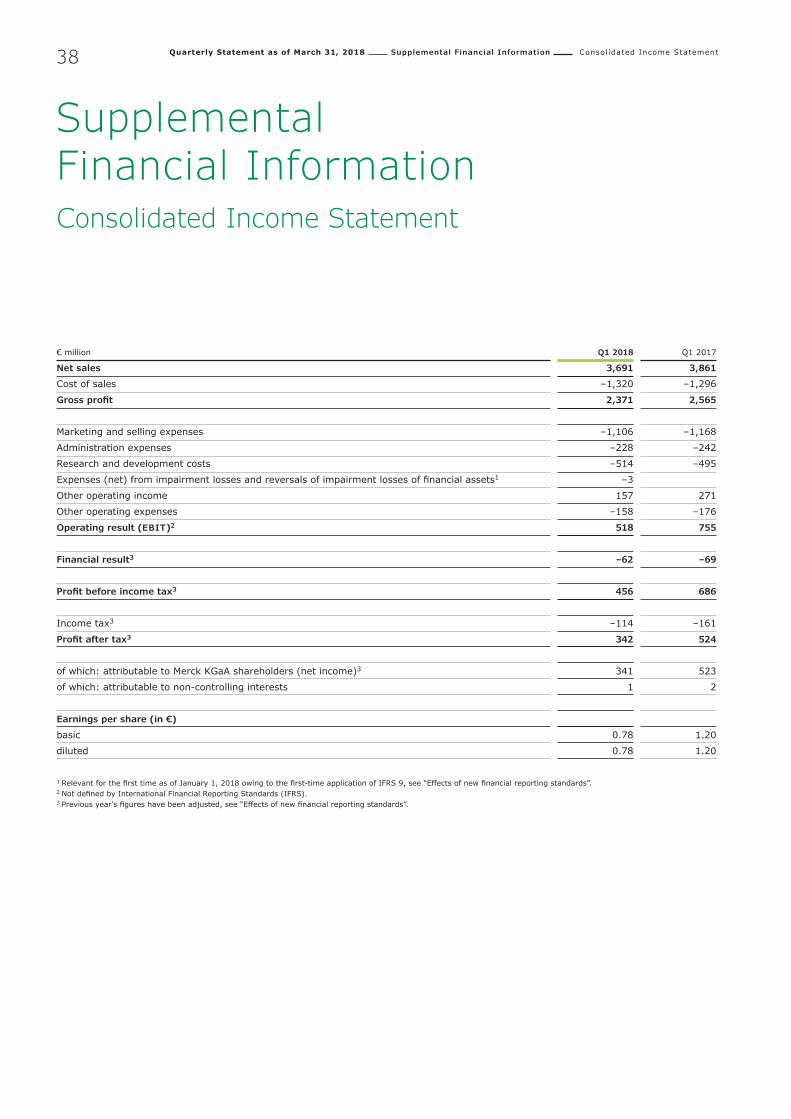
Quarterly Statement as of March 31, 2018 Supplemental Financial Information Consolidated Income Statement38
Supplemental Financial InformationConsolidated Income Statement
€ million Q1 2018 Q1 2017
Net sales 3,691 3,861
Cost of sales –1,320 –1,296
Gross profit 2,371 2,565
Marketing and selling expenses –1,106 –1,168
Administration expenses –228 –242
Research and development costs –514 –495
Expenses (net) from impairment losses and reversals of impairment losses of financial assets1 –3
Other operating income 157 271
Other operating expenses –158 –176
Operating result (EBIT)2 518 755
Financial result3 –62 –69
Profit before income tax3 456 686
Income tax3 –114 –161
Profit after tax3 342 524
of which: attributable to Merck KGaA shareholders (net income)3 341 523
of which: attributable to non-controlling interests 1 2
Earnings per share (in €)
basic 0.78 1.20
diluted 0.78 1.20
1 Relevant for the first time as of January 1, 2018 owing to the first-time application of IFRS 9, see “Effects of new financial reporting standards”.2 Not defined by International Financial Reporting Standards (IFRS).3 Previous year's figures have been adjusted, see “Effects of new financial reporting standards”.
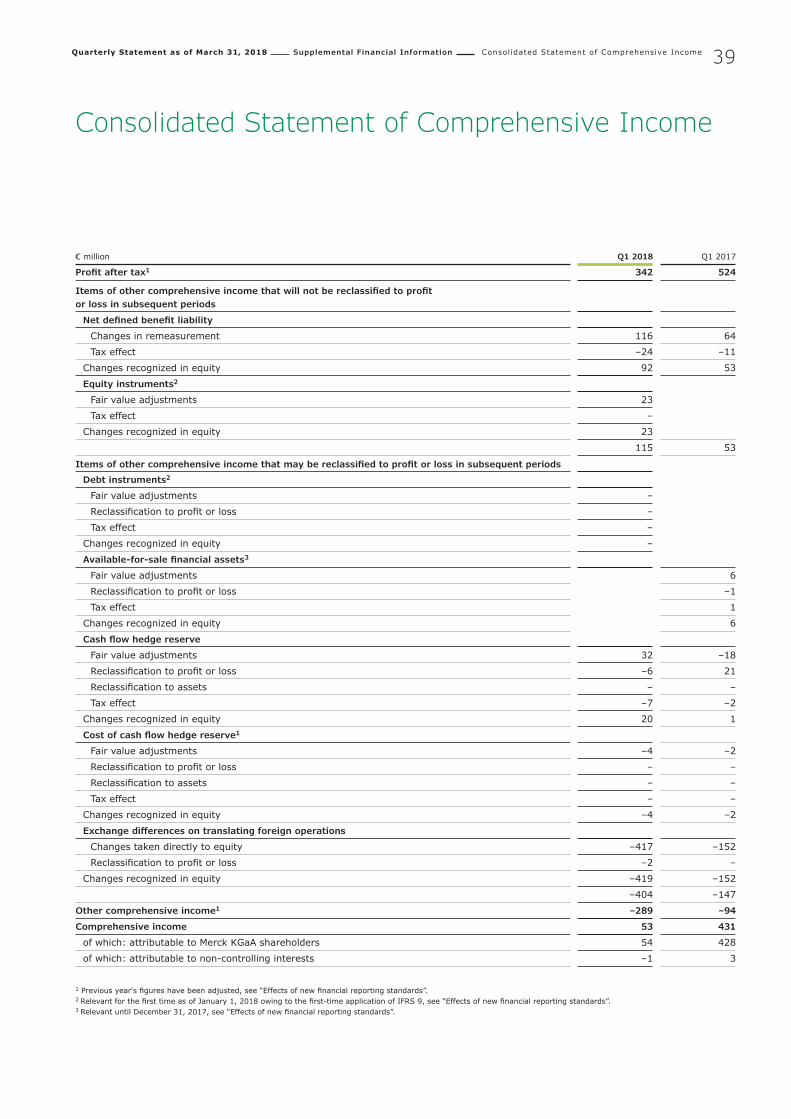
Quarterly Statement as of March 31, 2018 Supplemental Financial Information Consolidated Statement of Comprehensive Income 39
Consolidated Statement of Comprehensive Income
€ million Q1 2018 Q1 2017
Profit after tax1 342 524
Items of other comprehensive income that will not be reclassified to profit or loss in subsequent periods
Net defined benefit liability
Changes in remeasurement 116 64
Tax effect –24 –11
Changes recognized in equity 92 53
Equity instruments2
Fair value adjustments 23
Tax effect –
Changes recognized in equity 23
115 53
Items of other comprehensive income that may be reclassified to profit or loss in subsequent periods
Debt instruments2
Fair value adjustments –
Reclassification to profit or loss –
Tax effect –
Changes recognized in equity –
Available-for-sale financial assets3
Fair value adjustments 6
Reclassification to profit or loss –1
Tax effect 1
Changes recognized in equity 6
Cash flow hedge reserve
Fair value adjustments 32 –18
Reclassification to profit or loss –6 21
Reclassification to assets – –
Tax effect –7 –2
Changes recognized in equity 20 1
Cost of cash flow hedge reserve1
Fair value adjustments –4 –2
Reclassification to profit or loss – –
Reclassification to assets – –
Tax effect – –
Changes recognized in equity –4 –2
Exchange differences on translating foreign operations
Changes taken directly to equity –417 –152
Reclassification to profit or loss –2 –
Changes recognized in equity –419 –152
–404 –147
Other comprehensive income1 –289 –94
Comprehensive income 53 431
of which: attributable to Merck KGaA shareholders 54 428
of which: attributable to non-controlling interests –1 3
1 Previous year's figures have been adjusted, see “Effects of new financial reporting standards”.2 Relevant for the first time as of January 1, 2018 owing to the first-time application of IFRS 9, see “Effects of new financial reporting standards”.3 Relevant until December 31, 2017, see “Effects of new financial reporting standards”.
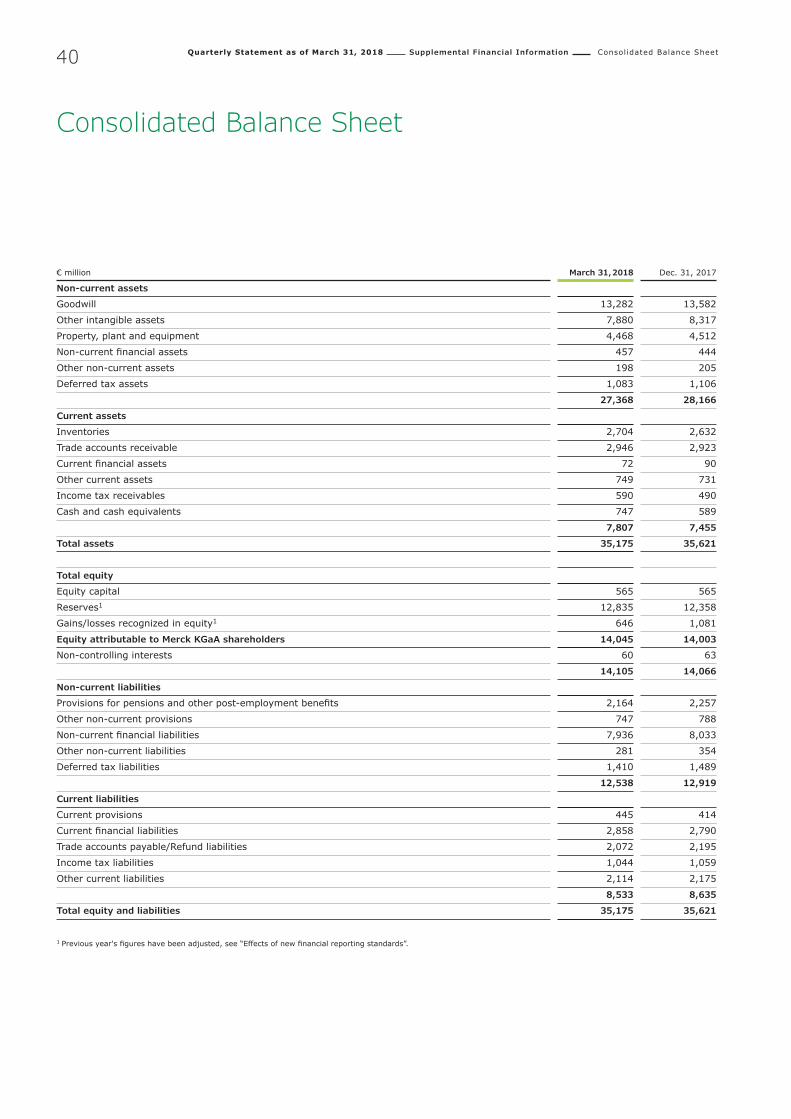
Quarterly Statement as of March 31, 2018 Supplemental Financial Information Consolidated Balance Sheet40
Consolidated Balance Sheet
€ million March 31, 2018 Dec. 31, 2017
Non-current assets
Goodwill 13,282 13,582
Other intangible assets 7,880 8,317
Property, plant and equipment 4,468 4,512
Non-current financial assets 457 444
Other non-current assets 198 205
Deferred tax assets 1,083 1,106
27,368 28,166
Current assets
Inventories 2,704 2,632
Trade accounts receivable 2,946 2,923
Current financial assets 72 90
Other current assets 749 731
Income tax receivables 590 490
Cash and cash equivalents 747 589
7,807 7,455
Total assets 35,175 35,621
Total equity
Equity capital 565 565
Reserves1 12,835 12,358
Gains/losses recognized in equity1 646 1,081
Equity attributable to Merck KGaA shareholders 14,045 14,003
Non-controlling interests 60 63
14,105 14,066
Non-current liabilities
Provisions for pensions and other post-employment benefits 2,164 2,257
Other non-current provisions 747 788
Non-current financial liabilities 7,936 8,033
Other non-current liabilities 281 354
Deferred tax liabilities 1,410 1,489
12,538 12,919
Current liabilities
Current provisions 445 414
Current financial liabilities 2,858 2,790
Trade accounts payable/Refund liabilities 2,072 2,195
Income tax liabilities 1,044 1,059
Other current liabilities 2,114 2,175
8,533 8,635
Total equity and liabilities 35,175 35,621
1 Previous year's figures have been adjusted, see “Effects of new financial reporting standards”.
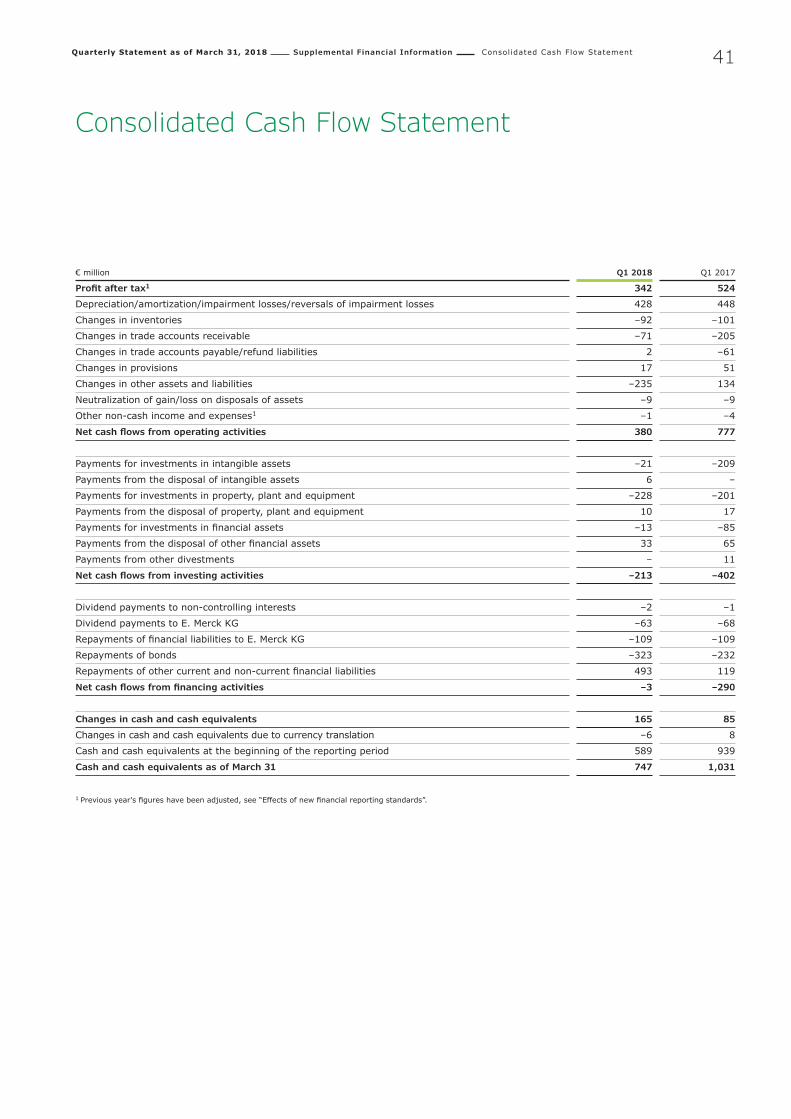
Quarterly Statement as of March 31, 2018 Supplemental Financial Information Consolidated Cash Flow Statement 41
Consolidated Cash Flow Statement
€ million Q1 2018 Q1 2017
Profit after tax1 342 524
Depreciation/amortization/impairment losses/reversals of impairment losses 428 448
Changes in inventories –92 –101
Changes in trade accounts receivable –71 –205
Changes in trade accounts payable/refund liabilities 2 –61
Changes in provisions 17 51
Changes in other assets and liabilities –235 134
Neutralization of gain/loss on disposals of assets –9 –9
Other non-cash income and expenses1 –1 –4
Net cash flows from operating activities 380 777
Payments for investments in intangible assets –21 –209
Payments from the disposal of intangible assets 6 –
Payments for investments in property, plant and equipment –228 –201
Payments from the disposal of property, plant and equipment 10 17
Payments for investments in financial assets –13 –85
Payments from the disposal of other financial assets 33 65
Payments from other divestments – 11
Net cash flows from investing activities –213 –402
Dividend payments to non-controlling interests –2 –1
Dividend payments to E. Merck KG –63 –68
Repayments of financial liabilities to E. Merck KG –109 –109
Repayments of bonds –323 –232
Repayments of other current and non-current financial liabilities 493 119
Net cash flows from financing activities –3 –290
Changes in cash and cash equivalents 165 85
Changes in cash and cash equivalents due to currency translation –6 8
Cash and cash equivalents at the beginning of the reporting period 589 939
Cash and cash equivalents as of March 31 747 1,031
1 Previous year's figures have been adjusted, see “Effects of new financial reporting standards”.

Quarterly Statement as of March 31, 2018 Supplemental Financial Information Consolidated Statement of Changes in Net Equity42
Equity capital Retained earnings Gains/losses recognized in equity
€ million
General partner’s equity
Merck KGaA
Subscribedcapital
Merck KGaA
Capital reserves
(share premium)Merck KGaA
Retained earnings/net-retained profit
Remeasurement of defined
benefit plans
Fair value reserve for equity
instruments1Available-for-sale financial assets1
Fair value reserve for debt
instruments1Cash flow
hedge reserveCost of hedging
reserve1Currency transla-
tion differenceEquity attributable
to Merck KGaANon-controlling
interests
Total equity
Balance as of January 1, 2017 (as reported) 397 168 3,814 8,049 –1,501 24 –191 3,229 13,989 61 14,050Adjustment from mandatory retrospective adoption of IFRS 91
– – – –3 – – – 3 – – – –
Balance as of January 1, 2017 (restated) 397 168 3,814 8,046 –1,501 24 –191 3 3,229 13,989 61 14,050
Profit after tax2 – – – 523 – – – – – 523 2 524
Other comprehensive income – – – – 54 6 1 –2 –153 –95 1 –94
Comprehensive income – – – 523 54 6 1 –2 –153 428 3 431
Dividend payments – – – – – – – – – – –1 –1
Transactions with no change of control – – – – – – – – – – – –
Changes in scope of consolidation/Other – – – – – – – – – – – –
Balance as of March 31, 2017 397 168 3,814 8,569 –1,447 31 –190 1 3,075 14,418 63 14,481
Balance as of January 1, 2018 397 168 3,814 9,903 –1,358 – 31 – –121 –1 1,171 14,003 63 14,066
Adjustment on initial application of IFRS 91 – – – 23 – –6 –31 –1 – – – –15 – –15
Adjustment on initial application of IFRS 151 – – – – – – – – – – – – –
Balance as of January 1, 2018 397 168 3,814 9,926 –1,358 –6 –1 –121 –1 1,171 13,988 63 14,051
Profit after tax – – – 341 – – – – – – 341 1 342
Other comprehensive income – – – – 92 23 – 20 –4 –417 –287 –2 –289
Comprehensive income – – – 341 92 23 – 20 –4 –417 54 –1 53
Dividend payments – – – – – – – – – – – –2 –2
Transactions with no change of control – – – – – – – – – – – – –
Changes in scope of consolidation/Other – – – 3 – – – – – – 3 – 3
Balance as of March 31, 2018 397 168 3,814 10,270 –1,266 17 –1 –101 –6 754 14,045 60 14,105
1 See “Effects of new financial reporting standards”.2 Previous year's figures have been adjusted, see “Effects of new financial reporting standards”.
Consolidated Statement of Changes in Net Equity
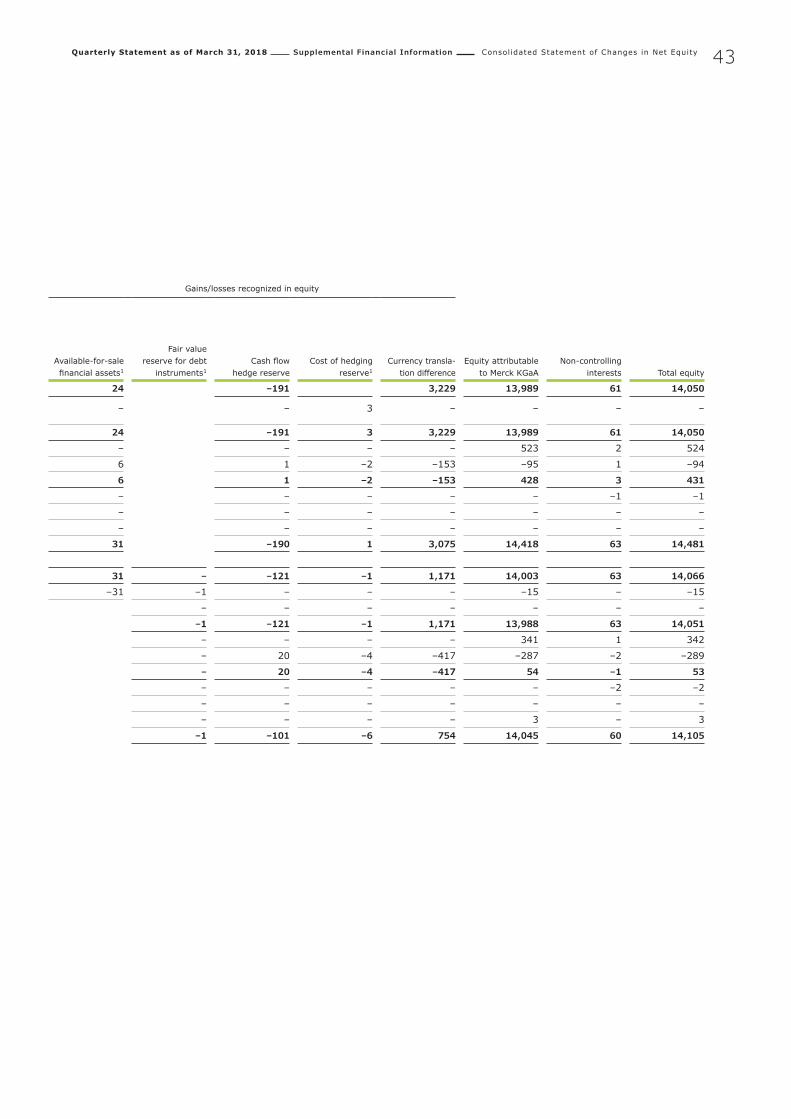
Quarterly Statement as of March 31, 2018 Supplemental Financial Information Consolidated Statement of Changes in Net Equity 43
Equity capital Retained earnings Gains/losses recognized in equity
€ million
General partner’s equity
Merck KGaA
Subscribedcapital
Merck KGaA
Capital reserves
(share premium)Merck KGaA
Retained earnings/net-retained profit
Remeasurement of defined
benefit plans
Fair value reserve for equity
instruments1Available-for-sale financial assets1
Fair value reserve for debt
instruments1Cash flow
hedge reserveCost of hedging
reserve1Currency transla-
tion differenceEquity attributable
to Merck KGaANon-controlling
interests
Total equity
Balance as of January 1, 2017 (as reported) 397 168 3,814 8,049 –1,501 24 –191 3,229 13,989 61 14,050Adjustment from mandatory retrospective adoption of IFRS 91
– – – –3 – – – 3 – – – –
Balance as of January 1, 2017 (restated) 397 168 3,814 8,046 –1,501 24 –191 3 3,229 13,989 61 14,050
Profit after tax2 – – – 523 – – – – – 523 2 524
Other comprehensive income – – – – 54 6 1 –2 –153 –95 1 –94
Comprehensive income – – – 523 54 6 1 –2 –153 428 3 431
Dividend payments – – – – – – – – – – –1 –1
Transactions with no change of control – – – – – – – – – – – –
Changes in scope of consolidation/Other – – – – – – – – – – – –
Balance as of March 31, 2017 397 168 3,814 8,569 –1,447 31 –190 1 3,075 14,418 63 14,481
Balance as of January 1, 2018 397 168 3,814 9,903 –1,358 – 31 – –121 –1 1,171 14,003 63 14,066
Adjustment on initial application of IFRS 91 – – – 23 – –6 –31 –1 – – – –15 – –15
Adjustment on initial application of IFRS 151 – – – – – – – – – – – – –
Balance as of January 1, 2018 397 168 3,814 9,926 –1,358 –6 –1 –121 –1 1,171 13,988 63 14,051
Profit after tax – – – 341 – – – – – – 341 1 342
Other comprehensive income – – – – 92 23 – 20 –4 –417 –287 –2 –289
Comprehensive income – – – 341 92 23 – 20 –4 –417 54 –1 53
Dividend payments – – – – – – – – – – – –2 –2
Transactions with no change of control – – – – – – – – – – – – –
Changes in scope of consolidation/Other – – – 3 – – – – – – 3 – 3
Balance as of March 31, 2018 397 168 3,814 10,270 –1,266 17 –1 –101 –6 754 14,045 60 14,105
1 See “Effects of new financial reporting standards”.2 Previous year's figures have been adjusted, see “Effects of new financial reporting standards”.

Quarterly Statement as of March 31, 2018 Supplemental Financial Information Information by Business Sector44
Information by Business Sector
€ million
Healthcare Life Science Performance MaterialsCorporate and Other Group
Q1 2018 Q1 2017 Q1 2018 Q1 2017 Q1 2018 Q1 2017 Q1 2018 Q1 2017 Q1 2018 Q1 2017
Net sales1 1,640 1,735 1,487 1,481 564 645 – – 3,691 3,861
Operating result (EBIT)2 211 445 273 236 136 195 –102 –122 518 755
Depreciation and amortization 188 182 169 191 57 62 13 9 426 443
Impairment losses 2 2 – 3 – – – – 2 5
Reversals of impairment losses – – – – – – – – – –
EBITDA2 401 629 442 430 192 257 –89 –113 946 1,203
Adjustments2 29 4 13 16 3 7 24 11 70 38
EBITDA pre (segment result)2 430 633 455 445 196 263 –66 –101 1,015 1,240EBITDA pre margin (in % of net sales)2 26.3% 36.5% 30.6% 30.1% 34.7% 40.9% – – 27.5% 32.1%
Assets by business sector3 8,090 8,184 19,961 20,422 4,015 3,942 3,109 3,073 35,175 35,621
Liabilities by business sector3 –2,874 –2,985 –1,188 –1,254 –583 –484 –16,426 –16,832 –21,071 –21,554Investments in property, plant and equipment4 88 76 65 72 28 28 47 24 228 201Investments in intangible assets4 14 194 3 13 2 2 1 – 21 209Net cash flows from operating activities 233 382 285 292 247 379 –385 –275 380 777
Business free cash flow2 310 356 375 281 137 233 –94 –111 729 760
1 Excluding intersegment sales.2 Not defined by International Financial Reporting Standards (IFRS)3 Figures for the reporting period ending on March 31, 2018; previous-year figures as of December 31, 2017.4 As reported in the consolidated cash flow statement.
€ million Q1 2018 Q1 2017
EBITDA pre of the operating businesses1 1,081 1,342
Corporate and Other –66 –101
EBITDA pre of the Merck Group1 1,015 1,240
Depreciation/amortization/impairment losses/reversals of impairment losses –428 –448
Adjustments1 –70 –38
Operating result (EBIT)1 518 755
Financial result2 –62 –69
Profit before income tax2 456 686
1 Not defined by International Financial Reporting Standards (IFRS).2 Previous year's figures have been adjusted. See "Effects of new financial reporting standards".
€ million Q1 2018 Q1 2017
Restructuring costs –7 –4
Integration costs/IT costs –21 –26
Gains (+) /losses (–) on the costs of divestment of businesses –2 –2
Acquisition-related adjustments –1 –3
Other adjustments –39 –3
Adjustments before impairment losses/reversals of impairment losses1 –70 –38
Impairment losses –2 –4
Reversals of impairment losses – –
Adjustments (total)1 –71 –41
1 Not defined by International Financial Reporting Standards (IFRS).
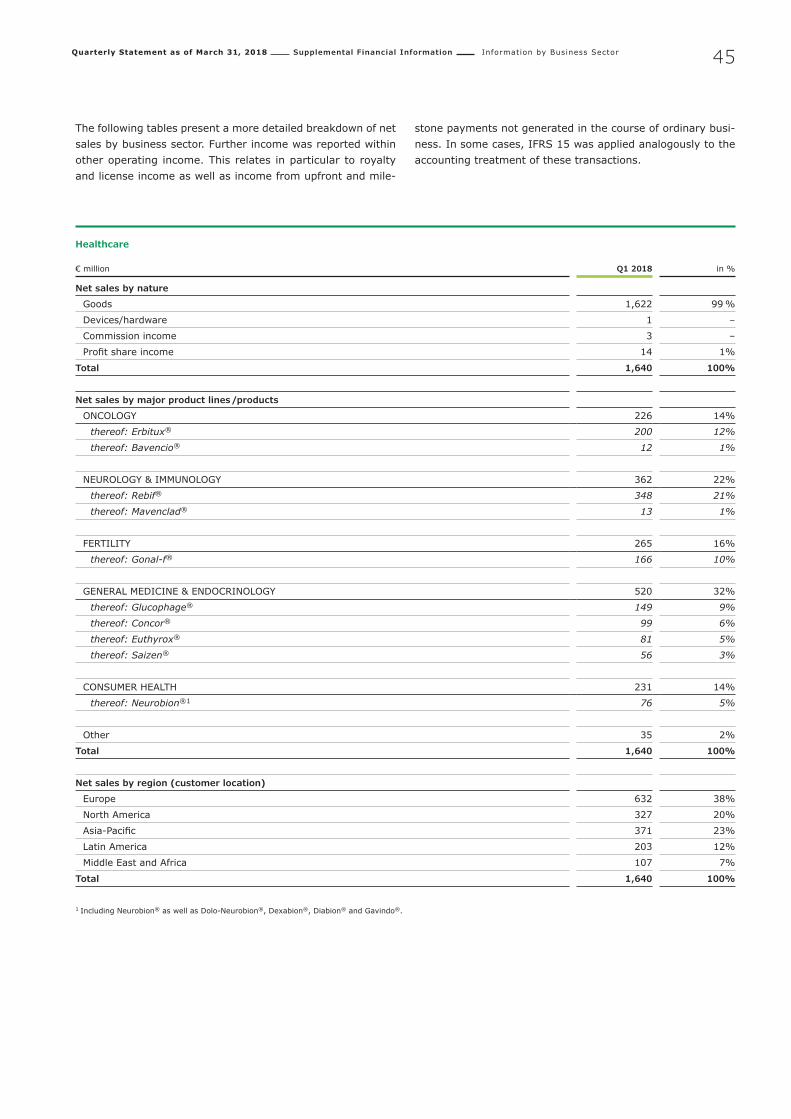
Quarterly Statement as of March 31, 2018 Supplemental Financial Information Information by Business Sector 45
The following tables present a more detailed breakdown of net sales by business sector. Further income was reported within other operating income. This relates in particular to royalty and license income as well as income from upfront and mile-
stone payments not generated in the course of ordinary busi-ness. In some cases, IFRS 15 was applied analogously to the accounting treatment of these transactions.
Healthcare
€ million Q1 2018 in %
Net sales by nature
Goods 1,622 99 %
Devices/hardware 1 –
Commission income 3 –
Profit share income 14 1%
Total 1,640 100%
Net sales by major product lines/products
ONCOLOGY 226 14%
thereof: Erbitux® 200 12%
thereof: Bavencio® 12 1%
NEUROLOGY & IMMUNOLOGY 362 22%
thereof: Rebif® 348 21%
thereof: Mavenclad® 13 1%
FERTILITY 265 16%
thereof: Gonal-f® 166 10%
GENERAL MEDICINE & ENDOCRINOLOGY 520 32%
thereof: Glucophage® 149 9%
thereof: Concor® 99 6%
thereof: Euthyrox® 81 5%
thereof: Saizen® 56 3%
CONSUMER HEALTH 231 14%
thereof: Neurobion®1 76 5%
Other 35 2%
Total 1,640 100%
Net sales by region (customer location)
Europe 632 38%
North America 327 20%
Asia-Pacific 371 23%
Latin America 203 12%
Middle East and Africa 107 7%
Total 1,640 100%
1 Including Neurobion® as well as Dolo-Neurobion®, Dexabion®, Diabion® and Gavindo®.
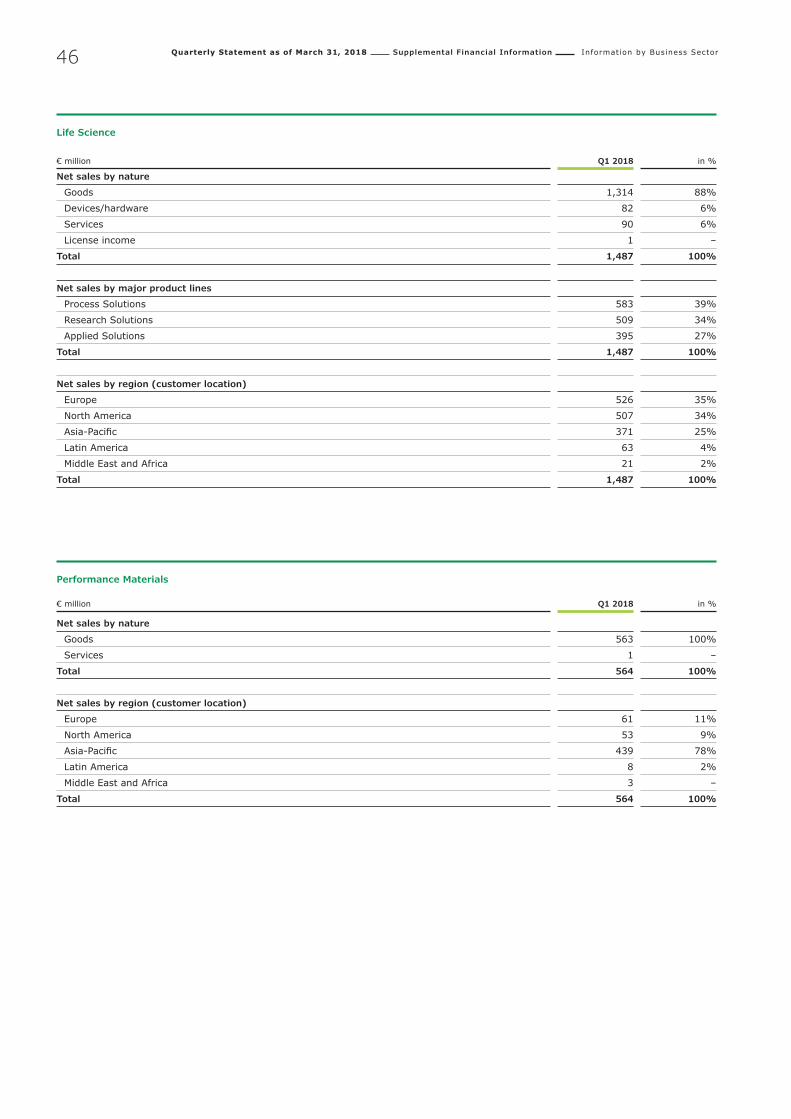
Quarterly Statement as of March 31, 2018 Supplemental Financial Information Information by Business Sector46
Life Science
€ million Q1 2018 in %
Net sales by nature
Goods 1,314 88%
Devices/hardware 82 6%
Services 90 6%
License income 1 –
Total 1,487 100%
Net sales by major product lines
Process Solutions 583 39%
Research Solutions 509 34%
Applied Solutions 395 27%
Total 1,487 100%
Net sales by region (customer location)
Europe 526 35%
North America 507 34%
Asia-Pacific 371 25%
Latin America 63 4%
Middle East and Africa 21 2%
Total 1,487 100%
Performance Materials
€ million Q1 2018 in %
Net sales by nature
Goods 563 100%
Services 1 –
Total 564 100%
Net sales by region (customer location)
Europe 61 11%
North America 53 9%
Asia-Pacific 439 78%
Latin America 8 2%
Middle East and Africa 3 –
Total 564 100%

Quarterly Statement as of March 31, 2018 Supplemental Financial Information Effects of new financial reporting standards 47
Effects of new financial reporting standards
IMPACT ON FINANCIAL REPORTING Effective January 1, 2018, Merck applied the financial report-ing standards IFRS 9 Financial Instruments and IFRS 15 Rev-enue from Contracts with Customers for the first time. The effects of the first-time application of these standards are pre-sented below.
Other amendments to standards and new interpretations that were also required to be applied for the first time as of January 1, 2018, did not have any material effects on the assets, liabilities, financial position or the financial performance of Merck. Financial reporting standards issued but not yet man-datory were not applied early.
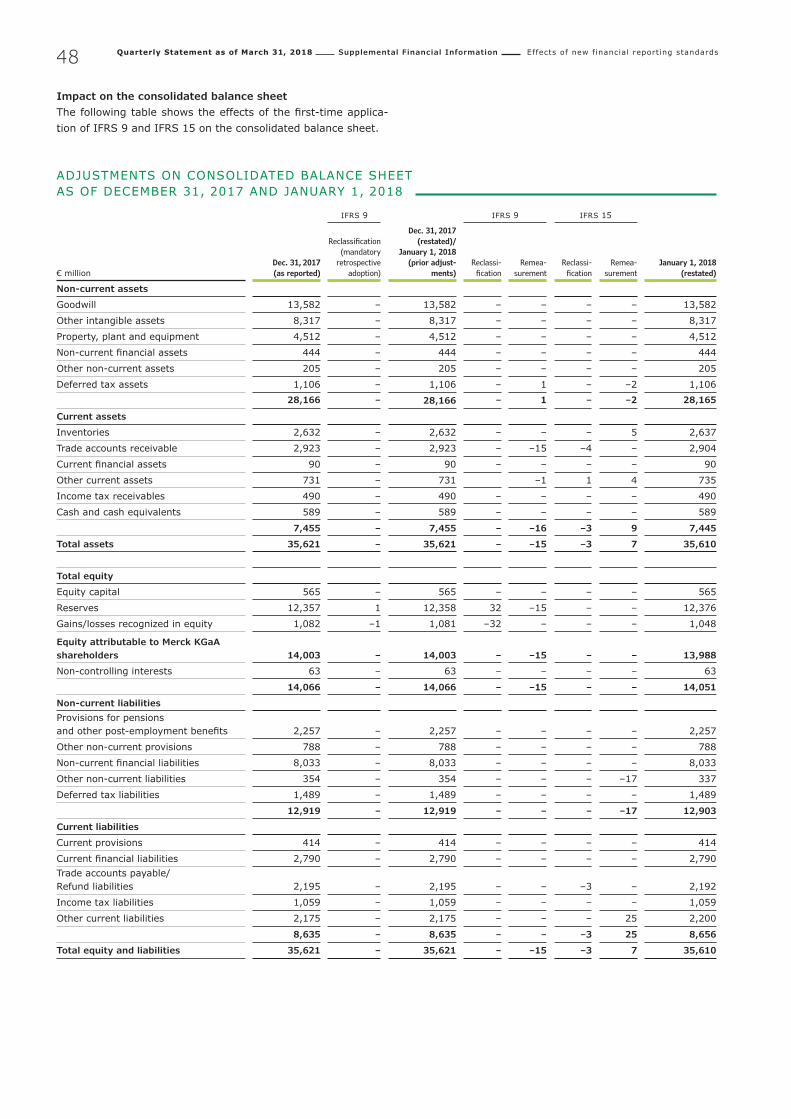
Quarterly Statement as of March 31, 2018 Supplemental Financial Information Effects of new financial reporting standards48
.
Impact on the consolidated balance sheetThe following table shows the effects of the first-time applica-tion of IFRS 9 and IFRS 15 on the consolidated balance sheet.
ADJUSTMENTS ON CONSOLIDATED BALANCE SHEET AS OF DECEMBER 31, 2017 AND JANUARY 1, 2018
IFRS 9 IFRS 9 IFRS 15
€ millionDec. 31, 2017(as reported)
Reclassi fication(mandatory
retrospective adoption)
Dec. 31, 2017 (restated)/
January 1, 2018(prior adjust-
ments) Reclassification
Remeasurement
Reclassification
Remeasurement
January 1, 2018 (restated)
Non-current assets
Goodwill 13,582 – 13,582 – – – – 13,582
Other intangible assets 8,317 – 8,317 – – – – 8,317
Property, plant and equipment 4,512 – 4,512 – – – – 4,512
Non-current financial assets 444 – 444 – – – – 444
Other non-current assets 205 – 205 – – – – 205
Deferred tax assets 1,106 – 1,106 – 1 – –2 1,10628,166 – 28,166 – 1 – –2 28,165
Current assets
Inventories 2,632 – 2,632 – – – 5 2,637
Trade accounts receivable 2,923 – 2,923 – –15 –4 – 2,904
Current financial assets 90 – 90 – – – – 90
Other current assets 731 – 731 –1 1 4 735
Income tax receivables 490 – 490 – – – – 490
Cash and cash equivalents 589 – 589 – – – – 589
7,455 – 7,455 – –16 –3 9 7,445
Total assets 35,621 – 35,621 – –15 –3 7 35,610
Total equity
Equity capital 565 – 565 – – – – 565
Reserves 12,357 1 12,358 32 –15 – – 12,376
Gains/losses recognized in equity 1,082 –1 1,081 –32 – – – 1,048
Equity attributable to Merck KGaA shareholders 14,003 – 14,003 – –15 – – 13,988
Non-controlling interests 63 – 63 – – – – 63
14,066 – 14,066 – –15 – – 14,051
Non-current liabilitiesProvisions for pensions and other post-employment benefits 2,257 – 2,257 – – – – 2,257
Other non-current provisions 788 – 788 – – – – 788
Non-current financial liabilities 8,033 – 8,033 – – – – 8,033
Other non-current liabilities 354 – 354 – – – –17 337
Deferred tax liabilities 1,489 – 1,489 – – – – 1,489
12,919 – 12,919 – – – –17 12,903
Current liabilities
Current provisions 414 – 414 – – – – 414
Current financial liabilities 2,790 – 2,790 – – – – 2,790Trade accounts payable/ Refund liabilities 2,195 – 2,195 – – –3 – 2,192
Income tax liabilities 1,059 – 1,059 – – – – 1,059
Other current liabilities 2,175 – 2,175 – – – 25 2,200
8,635 – 8,635 – – –3 25 8,656
Total equity and liabilities 35,621 – 35,621 – –15 –3 7 35,610

Quarterly Statement as of March 31, 2018 Supplemental Financial Information Effects of new financial reporting standards 49
Effects of the first-time application of IFRS 9 and IFRS 15 on reserves The following table shows the effects of the first-time applica-tion of IFRS 9 and IFRS 15 on reserves in Group equity as of December 31, 2017 and January 1, 2018, respectively.
Effects on reserves as of December 31, 2017/January 1, 2018€ million
December 31, 2017 (as reported) 12,357
IFRS 9 (after tax) 1
Cost of hedging (mandatory retrospective adoption) 1
December 31, 2017 (restated)/January 1, 2018 (before adjustments) 12,358
IFRS 9 (before tax) 16
Reclassification of financial assets 32
Expected credit loss on trade accounts receivable and other debt instruments –16
Tax effect IFRS 9 2
IFRS 15 (before tax) 2
Timing of transfer of control from the sale of goods –20
Out-licensing of intellectual property 17
Take-or-pay arrangements 4
Multi-element arrangements 1
Tax effect IFRS 15 –2
January 1, 2018 (restated) 12,376
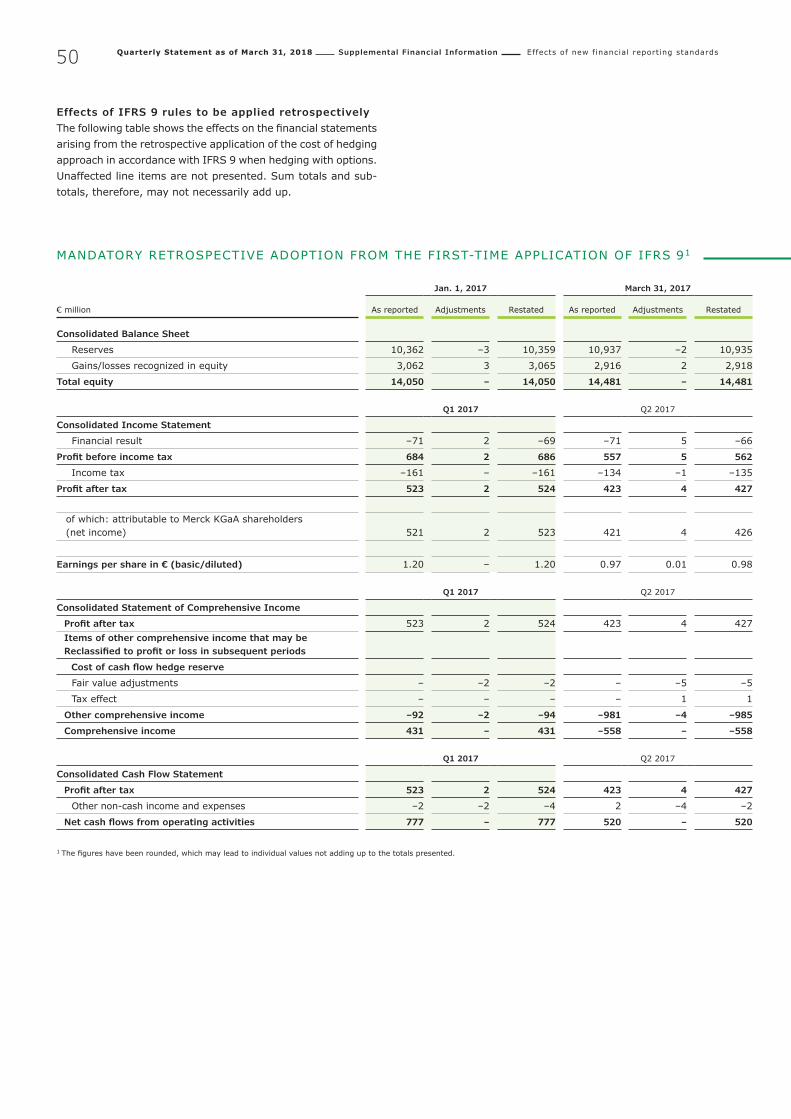
Quarterly Statement as of March 31, 2018 Supplemental Financial Information Effects of new financial reporting standards50
Effects of IFRS 9 rules to be applied retrospectively The following table shows the effects on the financial statements arising from the retrospective application of the cost of hedging approach in accordance with IFRS 9 when hedging with options. Unaffected line items are not presented. Sum totals and sub-totals, therefore, may not necessarily add up.
MANDATORY RETROSPECTIVE ADOPTION FROM THE FIRST-TIME APPLICATION OF IFRS 91
Jan. 1, 2017 March 31, 2017 June 30, 2017 Sept. 30, 2017 Dec. 31, 2017
€ million As reported Adjustments Restated As reported Adjustments Restated As reported Adjustments Restated As reported Adjustments Restated As reported Adjustments Restated
Consolidated Balance Sheet
Reserves 10,362 –3 10,359 10,937 –2 10,935 11,291 3 11,294 11,841 2 11,843 12,357 1 12,358
Gains/losses recognized in equity 3,062 3 3,065 2,916 2 2,918 1,850 –3 1,847 1,325 –2 1,323 1,082 –1 1,081
Total equity 14,050 – 14,050 14,481 – 14,481 13,765 – 13,765 13,791 – 13,791 14,066 – 14,066
Q1 2017 Q2 2017 Q3 2017 Q4 2017 Full year 2017
Consolidated Income Statement
Financial result –71 2 –69 –71 5 –66 –65 –1 –66 –93 –1 –94 –300 5 –295
Profit before income tax 684 2 686 557 5 562 836 –1 835 147 –1 146 2,224 5 2,229
Income tax –161 – –161 –134 –1 –135 –187 – –187 868 – 868 386 –1 385
Profit after tax 523 2 524 423 4 427 649 –1 648 1,015 –1 1,015 2,610 4 2,615
of which: attributable to Merck KGaA shareholders (net income) 521 2 523 421 4 426 645 –1 644 1,013 –1 1,012 2,600 4 2,605
Earnings per share in € (basic/diluted) 1.20 – 1.20 0.97 0.01 0.98 1.48 – 1.48 2.33 – 2.33 5.98 0.01 5.99
Q1 2017 Q2 2017 Q3 2017 Q4 2017 Full year 2017
Consolidated Statement of Comprehensive Income
Profit after tax 523 2 524 423 4 427 649 –1 648 1,015 –1 1,015 2,610 4 2,615 Items of other comprehensive income that may be Reclassified to profit or loss in subsequent periods
Cost of cash flow hedge reserve
Fair value adjustments – –2 –2 – –5 –5 – 1 1 – 1 1 – –5 –5
Tax effect – – – – 1 1 – – – – – – – 1 1
Other comprehensive income –92 –2 –94 –981 –4 –985 –622 1 –621 –148 1 –147 –1,843 –4 –1,847
Comprehensive income 431 – 431 –558 – –558 26 – 26 868 – 868 767 – 767
Q1 2017 Q2 2017 Q3 2017 Q4 2017 Full year 2017
Consolidated Cash Flow Statement
Profit after tax 523 2 524 423 4 427 649 –1 648 1,015 –1 1,015 2,610 4 2,615
Other non-cash income and expenses –2 –2 –4 2 –4 –2 –3 1 –2 – 1 1 –3 –4 –7
Net cash flows from operating activities 777 – 777 520 – 520 758 – 758 641 – 641 2,696 – 2,696
1 The figures have been rounded, which may lead to individual values not adding up to the totals presented.
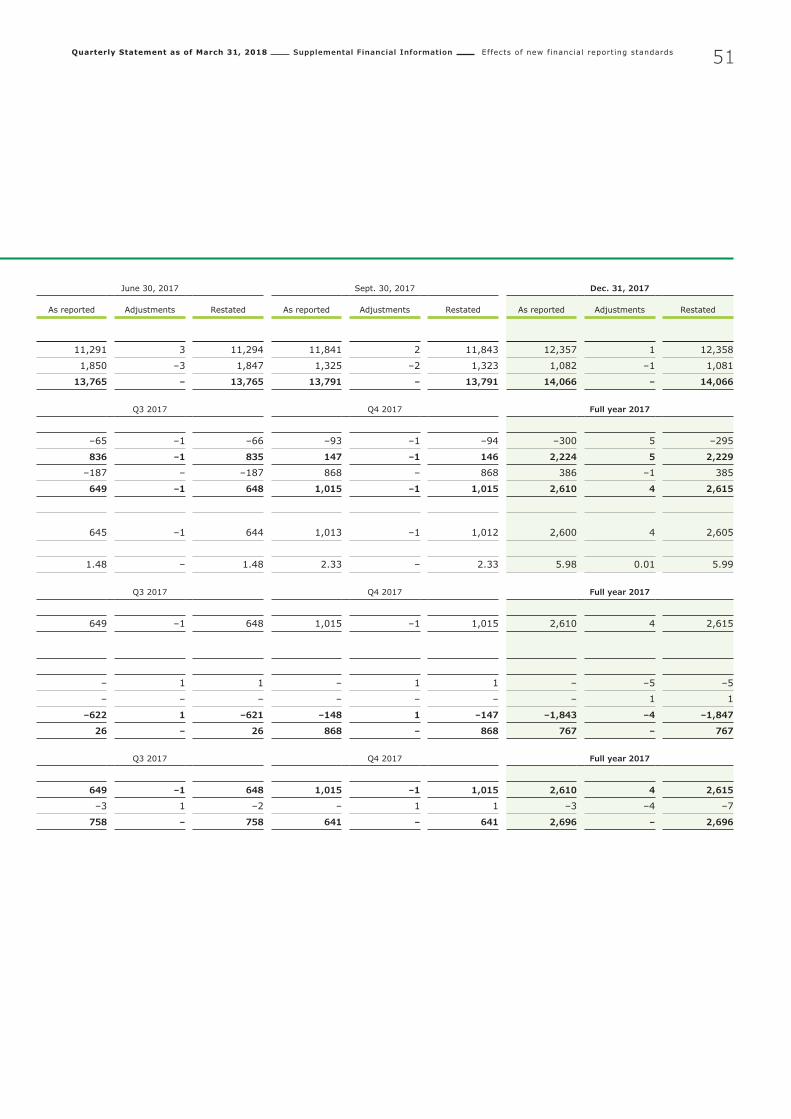
Quarterly Statement as of March 31, 2018 Supplemental Financial Information Effects of new financial reporting standards 51
MANDATORY RETROSPECTIVE ADOPTION FROM THE FIRST-TIME APPLICATION OF IFRS 91
Jan. 1, 2017 March 31, 2017 June 30, 2017 Sept. 30, 2017 Dec. 31, 2017
€ million As reported Adjustments Restated As reported Adjustments Restated As reported Adjustments Restated As reported Adjustments Restated As reported Adjustments Restated
Consolidated Balance Sheet
Reserves 10,362 –3 10,359 10,937 –2 10,935 11,291 3 11,294 11,841 2 11,843 12,357 1 12,358
Gains/losses recognized in equity 3,062 3 3,065 2,916 2 2,918 1,850 –3 1,847 1,325 –2 1,323 1,082 –1 1,081
Total equity 14,050 – 14,050 14,481 – 14,481 13,765 – 13,765 13,791 – 13,791 14,066 – 14,066
Q1 2017 Q2 2017 Q3 2017 Q4 2017 Full year 2017
Consolidated Income Statement
Financial result –71 2 –69 –71 5 –66 –65 –1 –66 –93 –1 –94 –300 5 –295
Profit before income tax 684 2 686 557 5 562 836 –1 835 147 –1 146 2,224 5 2,229
Income tax –161 – –161 –134 –1 –135 –187 – –187 868 – 868 386 –1 385
Profit after tax 523 2 524 423 4 427 649 –1 648 1,015 –1 1,015 2,610 4 2,615
of which: attributable to Merck KGaA shareholders (net income) 521 2 523 421 4 426 645 –1 644 1,013 –1 1,012 2,600 4 2,605
Earnings per share in € (basic/diluted) 1.20 – 1.20 0.97 0.01 0.98 1.48 – 1.48 2.33 – 2.33 5.98 0.01 5.99
Q1 2017 Q2 2017 Q3 2017 Q4 2017 Full year 2017
Consolidated Statement of Comprehensive Income
Profit after tax 523 2 524 423 4 427 649 –1 648 1,015 –1 1,015 2,610 4 2,615 Items of other comprehensive income that may be Reclassified to profit or loss in subsequent periods
Cost of cash flow hedge reserve
Fair value adjustments – –2 –2 – –5 –5 – 1 1 – 1 1 – –5 –5
Tax effect – – – – 1 1 – – – – – – – 1 1
Other comprehensive income –92 –2 –94 –981 –4 –985 –622 1 –621 –148 1 –147 –1,843 –4 –1,847
Comprehensive income 431 – 431 –558 – –558 26 – 26 868 – 868 767 – 767
Q1 2017 Q2 2017 Q3 2017 Q4 2017 Full year 2017
Consolidated Cash Flow Statement
Profit after tax 523 2 524 423 4 427 649 –1 648 1,015 –1 1,015 2,610 4 2,615
Other non-cash income and expenses –2 –2 –4 2 –4 –2 –3 1 –2 – 1 1 –3 –4 –7
Net cash flows from operating activities 777 – 777 520 – 520 758 – 758 641 – 641 2,696 – 2,696

Quarterly Statement as of March 31, 2018 Supplemental Financial Information Effects of new financial reporting standards52
CHANGES IN ACCOUNTING POLICIES RESULTING FROM IFRS 9IFRS 9 sets out new rules for classification and measurement of financial instruments and impairment of financial assets as well as for hedge accounting. The retrospective method was used for the adoption of IFRS 9, with the exception of the rules for hedge accounting, without adjusting the comparable year-ear-lier figures. In the case of hedging relationships where Merck uses options as hedging instruments, the first-time applica-tion of IFRS 9 proceeded retrospectively, as required, by dis-closing comparative information for prior periods. In the case of hedging relationships where Merck uses forward contracts as hedging instruments, the new IFRS 9 rules were introduced prospectively. The following section describes the major effects arising from the first-time application of IFRS 9.
Classification and measurementThe first-time application of IFRS 9 results in changes in the classification of financial assets that were previously measured in subsequent periods through other comprehensive income in the consolidated statement of comprehensive income or through profit or loss in the consolidated income statement. The classification of the existing financial assets was made on the basis of a previously conducted review of the business model for managing financial assets as well as of the contrac-tual cash flow characteristics of the financial assets. The major reclassifications for Merck are presented below: • Financial assets from contingent consideration with a carry-
ing amount of € 277 million, previously classified as avail-able-for-sale financial debt instruments under IAS 39, are now allocated to the class “Debt instruments measured at fair value through profit or loss”. As of January 1, 2018, this classification led to a transfer of gains/losses from changes in the market value of available-for-sale financial assets pre-viously recognized directly in Group equity to retained earn-ings in the amount of € –1 million.
• Financial assets with a carrying amount of € 123 million, which were previously classified as available-for-sale equity instruments under IAS 39, will be recognized in future at fair value through other comprehensive income in the consoli-dated statement of comprehensive income. Upon derecog-nition of the relevant financial assets, the changes in the fair value recognized in other comprehensive income until the date of derecognition continue to be reported in Group equity and are not reclassified to the consolidated income statement. As of January 1, 2018, the first-time applica-tion of IFRS 9 resulted in a reclassification in the amount of € 23 million from available-for-sale financial assets recorded
in gains/losses recognized in equity to the fair value reserve for equity instruments within retained earnings. Within retained earnings, an additional amount of € 29 million was reclassified from retained earnings/net retained profit to the fair value reserve for equity instruments due to impairments recognized in profit or loss in the past.
• Financial assets arising from debt instruments in the amount of € 35 million, which represented available-for-sale finan-cial debt instruments under IAS 39, are now allocated to the class “Measured at fair value through other comprehen-sive income” in accordance with IFRS 9. As of January 1, 2018, this reclassification led to a transfer within gains/losses recognized in equity from available-for-sale financial assets to the fair value reserve for debt instruments in the amount of € –1 million.
• Financial assets in the amount of € 18 million that was pre-viously classified as available-for-sale equity instruments under IAS 39 are accounted for under IFRS 9 as debt instru-ments measured at fair value. As of January 1, 2018, the reclassification of the closed investment funds led to a trans-fer of changes in the market value previously recognized through other comprehensive income to retained earnings in the amount of € 9 million.
ImpairmentsThe first-time application of IFRS 9 results in the application of a new impairment model which takes into account any life-time expected credit losses already at initial recognition of a financial asset. This accounting change leads to an earlier rec-ognition of a loss allowance for financial assets. The following financial assets are affected by the new impairment model:• Trade accounts receivable• Contract assets• Debt instruments measured at amortized cost• Debt instruments measured at fair value through other com-
prehensive income
The default rates are derived on the basis of historical experi-ence and current macroeconomic expectations by taking into account country-specific ratings for countries in which Merck operates. These country ratings are aggregated to three sepa-rate rating groups. In this context, historical default rates gen-erally represent the best approximation for future expected defaults in case a country’s rating remains unchanged. Accord-ingly, when a country’s rating changes, the historical default rates of the rating group to which the respective country has now been re-allocated must be applied, rather than the histor-ical default rates of the previous rating group.

Quarterly Statement as of March 31, 2018 Supplemental Financial Information Effects of new financial reporting standards 53
Merck uses the simplified impairment model for trade accounts receivable and contract assets pursuant to which any credit losses expected to occur over the entire lifetime of the rele-vant financial assets are taken into account. In order to mea-sure expected credit risks, the receivables and/or the con-tract assets are grouped on the basis of the existing credit risk structure and the respective maturity structure. The customer groups with comparable default risks to be taken into account are determined at Merck in accordance with the business sec-tors and location of the respective customers.
Merck expects credit risk to increase significantly when objective evidence exists that indicate financial difficulties of the debtor, the disappearance of an active market for the cus-tomer’s products, an anticipated insolvency or a breach of con-tract due to default. In addition, there is the rebuttable pre-sumption that a default exists when receivables are past due for more than 90 days. Therefore, Merck conducts an analysis for all customers whose receivables are past due for more than 90 days in order to determine whether there is objective evi-dence of impairment that indicates an increased credit risk. Based on this analysis, Merck is able to determine when a default has occurred in relation to a financial asset. A default generally exists when it is not probable that the debtor can fully meet its liabilities.
As of January 1, 2018, the first-time application of IFRS 9 led to an increase in loss allowances from expected credit risks of financial assets in the amount of € 16 million (before taking deferred taxes into account). This increase related mainly to trade accounts receivable.
Hedge accounting The objective of IFRS 9 is to reflect as accurately as possible the effects of risk management measures through hedge account-ing. Merck has applied the hedge accounting rules of IFRS 9 effective January 1, 2018 and did not opt for the option to con-tinue to apply IAS 39. The existing recognized hedging rela-tionships could be continued even after the first-time applica-tion of the IFRS 9 rules.
The adjustments relevant to Merck arising from the first-time application of the IFRS 9 rules regarding hedge accounting are presented below:• In the case of hedging relationships where Merck uses options
as hedging instrument, only the intrinsic value of options has been designated as hedging instrument. Changes in the fair value of the time value component of options that are used for hedge accounting have to be recognized in other compre-hensive income and in a separate reserve for cost of hedg-ing within Group equity. The subsequent accounting treat-ment of such amounts depends on the type of hedged item. These amendments must be fully applied retrospectively in accordance with IFRS 9 and led to the changes in financial reporting outlined above.
• In the case of hedging relationships where Merck uses for-ward contracts as hedging instruments, only the spot ele-ment is designated as hedging instrument. Changes in the fair value of the forward element in forward contracts are to be recognized in a separate reserve for cost of hedging within Group equity. The subsequent accounting of such amounts depends on the type of hedged item. These amendments are applied prospectively in accordance with IFRS 9. These amendments did not have any impact on the opening bal-ance sheet as of January 1, 2018.
CHANGES IN ACCOUNTING POLICIES FROM IFRS 15 IFRS 15 defined comprehensive principles for revenue recog-nition as well as for the provision of information about the nature, amount, timing and uncertainty of revenue from con-tracts with customers.
Since Merck generates approximately 95% of its revenues from contracts on the sale of goods that usually have a simple structure and normally do not constitute long-term contracts, the first-time application of IFRS 15 only has minor effects on the Group’s assets, liabilities, financial position and financial performance.
Within the context of the introduction of IFRS 15, Merck made use of the option to apply the modified first-time appli-cation method and thus recognized the cumulative adjustments in retained earnings as of January 1, 2018. Comparative infor-mation for prior periods is not disclosed in accordance with IFRS 15.
The adjustment effects resulting from the first-time appli-cation of IFRS 15 on Group equity are as follows as of Janu-ary 1, 2018:• Date of the transfer of control within the context of product
sales: In the case of specific supplies of goods, the transfer of control and thus the date of revenue recognition in accor-dance with IFRS 15 occur later than the transfer of risks and rewards within the meaning of IAS 18. As of January 1, 2018 inventories and contract liabilities for the supply of goods were recognized for which the related revenues were already recognized in 2017 in accordance with IAS 18. However, these revenues did not meet the criteria for rev-enue recognition under IFRS 15 as of the date of first-time application. This led to a reduction in retained earnings in the amount of € 20 million (before taxes). The new rules are not expected to have a material impact on the consoli-dated income statement for fiscal 2018.
• Out-licensing of intellectual property: Out-licensing intellectual property may, in some cases, lead to an earlier revenue recognition as compared with IAS 18 if the out-licensed intellectual property meets the criteria of a right-of-use license (recognition of revenue at a point in time), rather than an access right (recognition over a period

Quarterly Statement as of March 31, 2018 Supplemental Financial Information Effects of new financial reporting standards54
of time) and the consideration is not paid in the form of sales- or usage-based royalties. As of January 1, 2018, contract lia-bilities for licenses were derecognized which would have led to a recognition of revenue at a point in time (at the incep-tion of the license) on the basis of an assessment pursuant to IFRS 15. Accordingly, this led to an increase in retained earnings in the amount of € 17 million (before taxes) as of the date of transition. In fiscal 2018, based on the existing contract backlog, these new rules will result in a decrease in net sales and in other operating income in the low single-digit million euro range.
• Long-term supply contracts with minimum purchase quanti-ties (take-or-pay contracts): In individual cases, contracts with customers provide for minimum purchase quantities. In such cases, in accordance with IFRS 15, the expected transaction price attributable to the minimum purchase quantity has to be allocated to the individual supplies. However, under IAS 18, revenue is rec-ognized in the amount of the invoiced selling price for the individual supplies. A contract asset was recognized as of January 1, 2018. This led to a corresponding increase in retained earnings by € 4 million (before taxes). The impact of these new rules on the consolidated income statement for fiscal 2018 is negligible.
• Multiple-element arrangements: In the Life Science business sector, there are multiple-ele-ment arrangements with service elements to a minor extent. In future, the transaction price will have to be allocated in some cases in a different manner than under IAS 18. This led to an increase in retained earnings by € 1 million (before taxes) as of January 1, 2018. The impact on the consolidated income statement for fiscal 2018 is negligible.
In addition to the abovementioned adjustment effects, the first-time application of IFRS 15 will have an impact on the con-solidated income statement arising from the reclassification of expenses that were reported as operating expenses under IAS 18 and have to be recognized as sales deductions under IFRS 15. These reclassifications are likely to amount to a low single-digit million euro amount in fiscal 2018 and did not result in an adjustment of retained earnings as of January 1, 2018.
Moreover, the new rules of IFRS 15 in the following areas are of no or only of very minor relevance for Merck:• variable consideration• revenue recognition over time for long-term service contracts
and customer-specific construction contracts• consignment arrangements• collaboration agreements• costs of obtaining or fulfilling a contract• principal-agent relationships• bill-and-hold arrangements• financing components• barter transactions• repurchase agreements• separate performance obligations from transportation or
other logistics services• gross presentation of rights of return granted by recogni-
tion of an asset for expected physical returns by customers
Quarterly Statement as of March 31, 2018 Supplemental Financial Information Signif icant events during the reporting period 55
Significant events during the reporting period
EUROPEAN COMMISSION ANTITRUST REVIEW PROCEDURE FOR THE SIGMA-ALDRICH ACQUISITION In connection with the antitrust review procedure for the acqui-sition of Sigma- Aldrich on July 6, 2017, Merck received notice from the European Commission (EU Commission), in which the EU Commission informed Merck of its preliminary conclusion that Merck and Sigma-Aldrich allegedly transmitted incorrect and/or misleading information within the scope of the acquisi-tion of Sigma-Aldrich. The EU Commission received registration of the merger on April 21, 2015 and granted clearance on June 15, 2015 subject to the condition that Merck and Sigma-Aldrich divest parts of the European solvents and inorganic chemicals businesses of Sigma-Aldrich in order to resolve antitrust con-cerns. According to the preliminary viewpoint of the EU Com-mission communicated in the letter dated July 6, 2017, Merck and Sigma-Aldrich withheld in this connection important infor-mation about an innovation project allegedly relevant for cer-tain laboratory chemicals of significance to the analysis by the EU Commission. According to the EU Commission, the innova-tion project should have been included in the remedies pack-age. On February 5, 2018, a meeting of the cooperation proce-dure took place between the European Commission and Merck.
Based on the estimations by the Executive Board, a provi-sion amounting to a mid double-digit million amount for impending fines was set up in 2017. On the balance sheet date of March 31, 2018, this provision was retained in the identical amount.
ENTITLEMENT TO A MILESTONE PAYMENT FROM BIO-MARIN PHARMACEUTICAL INC., USA, FROM THE SALE OF THE RIGHTS TO PEG-PAL On October 1, 2015, Merck entered into an agreement with BioMarin Pharmaceutical Inc., USA, (BioMarin) to return the development and commercialization option for Peg-Pal,an investigational compound in clinical development for the poten-tial treatment of the rare metabolic disorder phenylketonuria (PKU). The agreement took effect in early 2016. As compen-sation for returning the Peg-Pal rights, Merck received entitle-ment to milestone payments of up to € 125 million, which are linked to the achievement of defined development objectives.
On March 28, 2018, BioMarin announced that the European Medicines Agency (EMA), had accepted the regulatory submis-sion of Peg-Pal for the treatment of PKU. This gave rise to the entitlement to a milestone payment of € 50 million, which was recorded in the reporting period under operating income and allocated to the Healthcare business sector.
Quarterly Statement as of March 31, 2018 Supplemental Financial Information Subsequent events56
Subsequent events
AGREEMENT TO DIVEST THE CONSUMER HEALTH BUSINESSOn April 19, 2018 Merck signed an agreement on the divest-ment of its global Consumer Health business to The Procter & Gamble Company, USA, (P&G). The selling price is € 3.4 billion. The transaction will be executed through the sale of sharehold-ings in multiple Merck subsidiaries as well as by way of vari-ous asset sales (asset deals). Apart from the Consumer Health business in 44 countries, the transaction also encompasses two production facilities operated by Consumer Health in Austria and India. Moreover, with respect to the transfer of the share-holding in Merck Ltd., India, businesses from other business sectors currently operated by this company (Biopharma, Life Science and Performance Materials) are initially also part of the transaction. However, Merck has legally obligated itself to reacquire these businesses from Merck Ltd. shortly thereafter.
Following the closing and subject to the information and consultation procedure with employee representatives, around 3,300 employees are to transfer to P&G. In addition to the divestment agreement, Merck and P&G will conclude a number of manufacturing, supply and service agreements.
The transaction closing is expected for the end of the fourth quarter of 2018 subject to regulatory approvals and other cus-tomary closing conditions. In France, P&G has granted Merck a put option, through the exercise of which Merck can divest the French Consumer Health business to P&G following the conclusion of the information and consultation procedure with employee representatives.
Owing to the high degree of uncertainty prior to the con-clusion of the agreement whether and to what extent the Con-sumer Health business can be divested within one year, the Executive Board is of the opinion that the requirements for disclosure as a discontinued operation pursuant to IFRS 5 had not yet been met on March 31, 2018, the balance sheet date. These requirements were only deemed fulfilled with the signing of the agreement on April 19, 2018.
57
Darmstadt, May 9, 2018
Stefan Oschmann
Udit Batra Kai Beckmann Walter Galinat
Belén Garijo Marcus Kuhnert
Quarterly Statement as of March 31, 2018

Quarterly Statement as of March 31, 2018 Supplemental Financial Information Subsequent events58
Published on May 15, 2018by Merck KGaA, Group CommunicationsFrankfurter Str. 250, 64293 Darmstadt, GermanyTelephone: + 49 6151 72– 0Fax: + 49 6151 72–5577E-Mail: [email protected]: www.merckgroup.com
TYPESETTING + LAYOUTtypowerkstatt Dickerhof & Schwarz, Darmstadt
F I N A N C I A L C A L E N D A R2018/2019
August 8/9/2018 Half-year report
March 3/7/2019 Annual Press Conference
November 11/14/2018 Report on the third quarter
April 4/26/2019 Annual General Meeting
May 5/14/2019 Report on the first quarter