St. Louis PM 2.5 SIP Modeling Update Calvin Ku, Ph.D. Missouri Department of Natural Resources Air...
23
St. Louis PM 2.5 SIP Modeling Update Calvin Ku, Ph.D. Missouri Department of Natural Resources Air Pollution Control Program Air Quality Advisory Committee Meeting May 24, 2007 East-West Gateway Board Room
-
Upload
melissa-pitts -
Category
Documents
-
view
229 -
download
0
Transcript of St. Louis PM 2.5 SIP Modeling Update Calvin Ku, Ph.D. Missouri Department of Natural Resources Air...
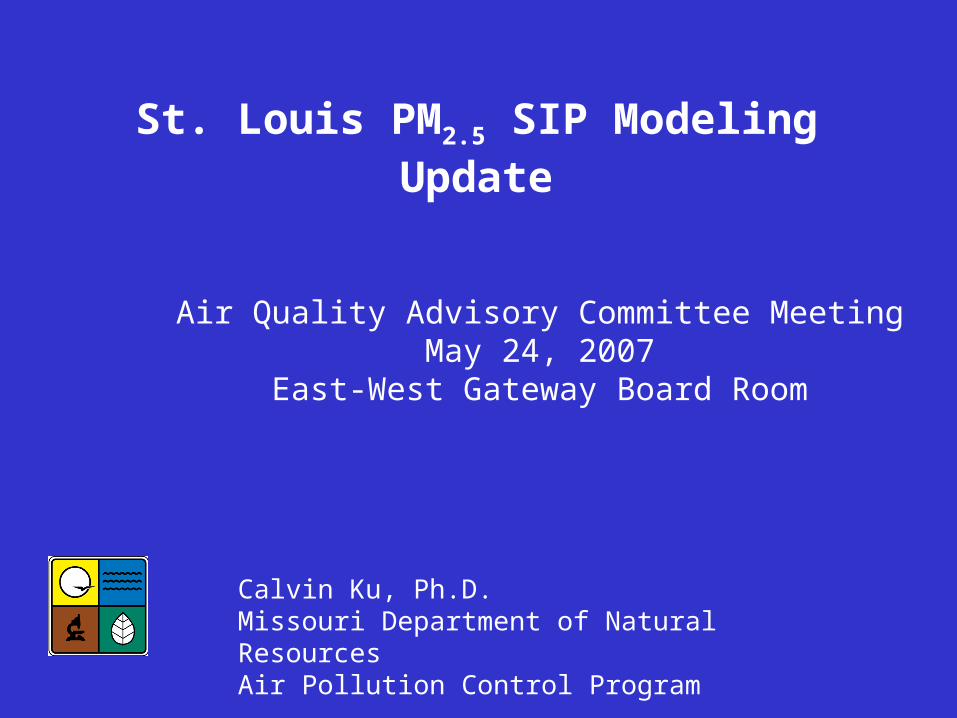
St. Louis PM2.5 SIP Modeling Update
Calvin Ku, Ph.D.Missouri Department of Natural ResourcesAir Pollution Control Program
Air Quality Advisory Committee MeetingMay 24, 2007
East-West Gateway Board Room

Topics
• Background
• 2002 Base 4 Model Performance Evaluation
• PM Source Apportionment
• 2009 Base 4 “on the Book” Control Modeling
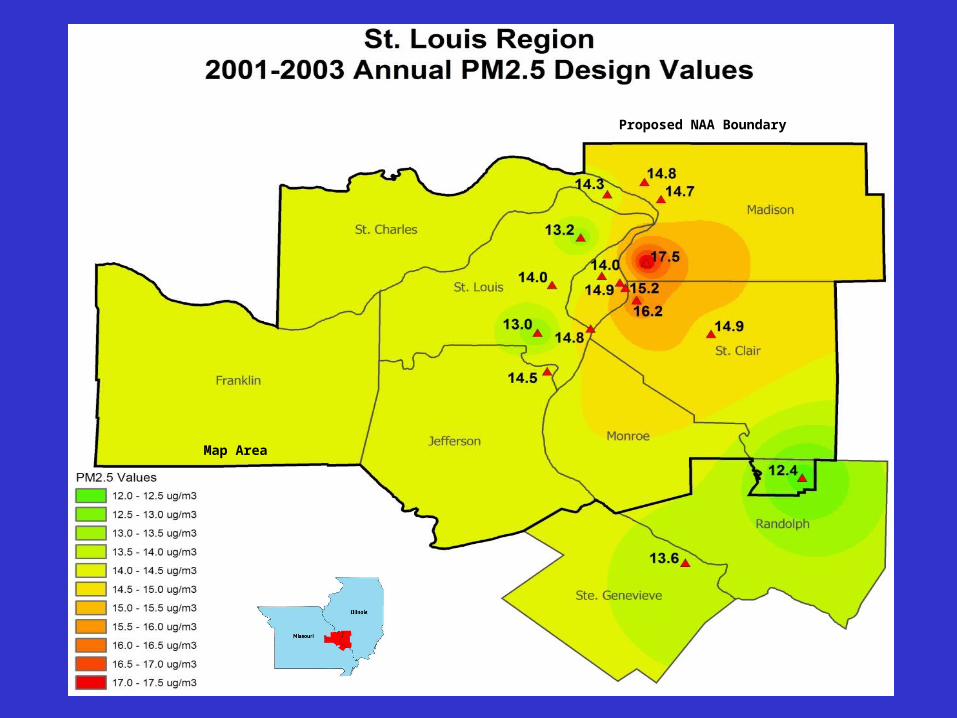
Map Area
Proposed NAA Boundary
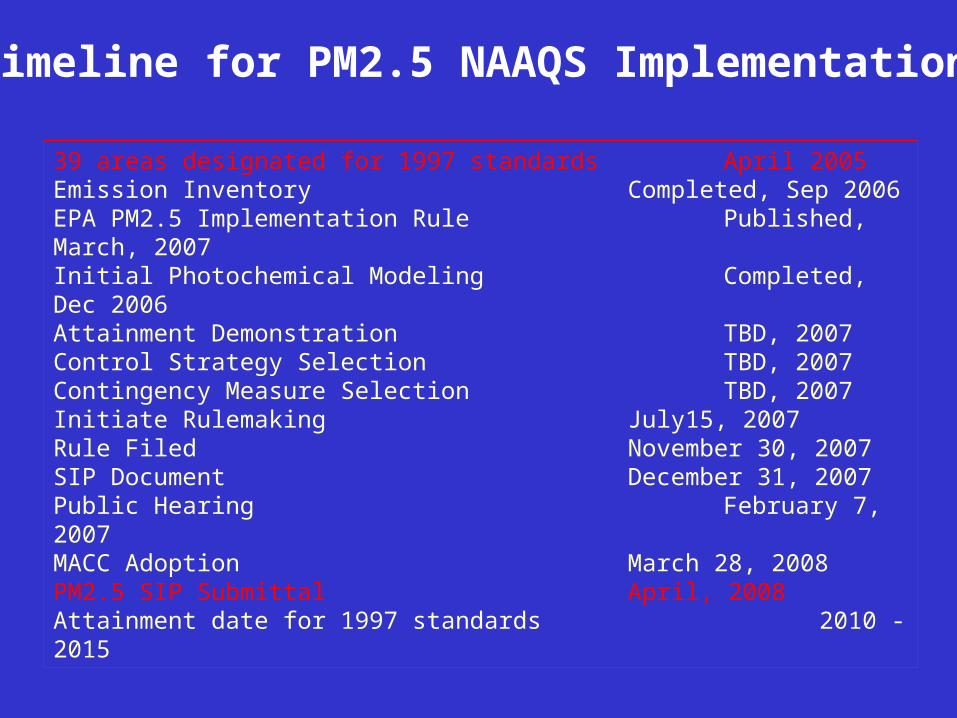
39 areas designated for 1997 standards April 2005Emission Inventory Completed, Sep 2006EPA PM2.5 Implementation Rule Published, March, 2007Initial Photochemical Modeling Completed, Dec 2006Attainment Demonstration TBD, 2007Control Strategy Selection TBD, 2007Contingency Measure Selection TBD, 2007Initiate Rulemaking July15, 2007Rule Filed November 30, 2007SIP Document December 31, 2007Public Hearing February 7, 2007MACC Adoption March 28, 2008PM2.5 SIP Submittal April, 2008 Attainment date for 1997 standards 2010 - 2015
Timeline for PM2.5 NAAQS Implementation
St Louis PM2.5 SIP Modeling
• PM2.5 modeling performed by MDNR and IEPA
– 2002 Base 4 emissions– CMAQ and CAMx air quality models– 36/12 km grid
• Model performance evaluation by ENVIRON – STL area FRM data – STL area speciation data
• four speciation network sites, 1-in-3 or 1-in-6 day frequency
• STL Supersite (East St. Louis), daily frequency
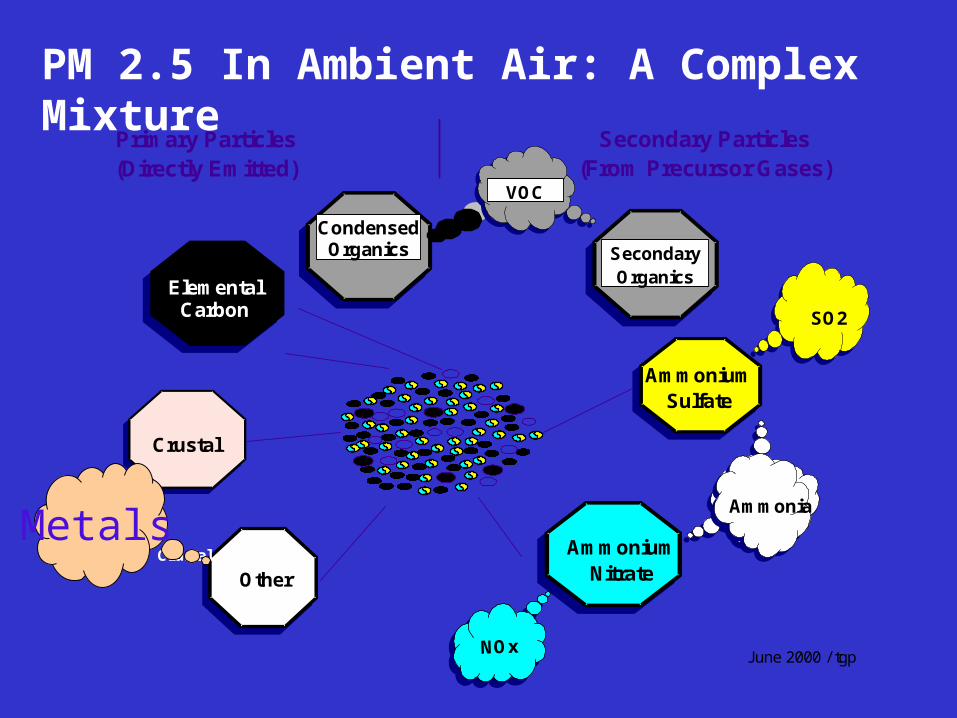
Primary Particles(Directly Emitted)
Secondary Particles(From Precursor Gases)
Elemental Carbon
OtherCrustal Ammonium
Nitrate
NOx
AmmoniumSulfate
SO2
SecondaryOrganics
VOC
Ammonia
Crustal
June 2000 / tgp
Condensed Organics
Metals
PM 2.5 In Ambient Air: A Complex Mixture
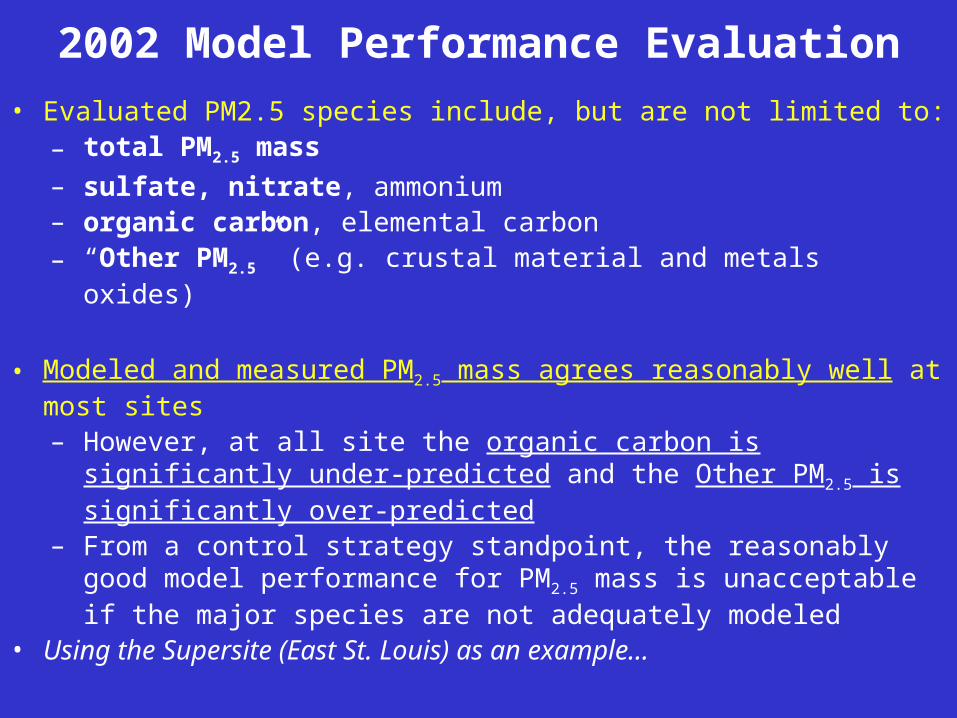
2002 Model Performance Evaluation
• Evaluated PM2.5 species include, but are not limited to:– total PM2.5 mass
– sulfate, nitrate, ammonium– organic carbon, elemental carbon– “Other PM2.5” (e.g. crustal material and metals oxides)
• Modeled and measured PM2.5 mass agrees reasonably well at most sites– However, at all site the organic carbon is significantly under-
predicted and the Other PM2.5 is significantly over-predicted
– From a control strategy standpoint, the reasonably good model performance for PM2.5 mass is unacceptable if the major species are not adequately modeled
• Using the Supersite (East St. Louis) as an example…
-500 0 500 1000 1500
-1500
-1000
-500
0
500
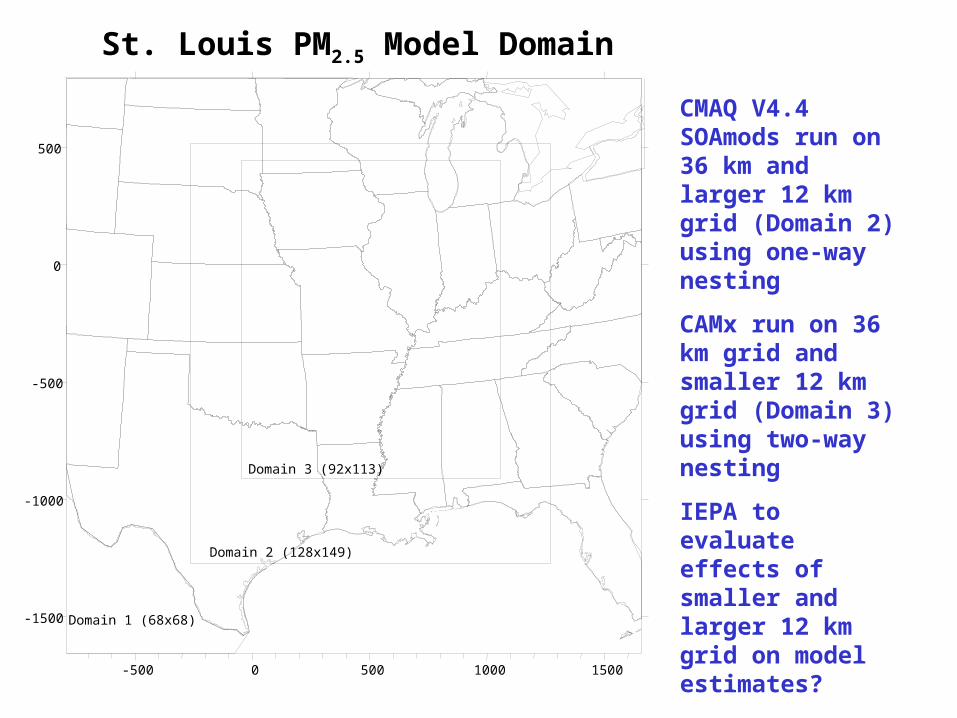
Domain 1 (68x68)
Domain 2 (128x149)
Domain 3 (92x113)
CMAQ V4.4 SOAmods run on 36 km and larger 12 km grid (Domain 2) using one-way nesting
CAMx run on 36 km grid and smaller 12 km grid (Domain 3) using two-way nesting
IEPA to evaluate effects of smaller and larger 12 km grid on model estimates?
IEPA to run CAMx V4.31 w/ SOAmods?
St. Louis PM2.5 Model Domain

SO4 NO3
OC PM2.5
Example Blair St.
STN CMAQ
and CAMx Evaluation
for 2002 Q2 and
PM Species
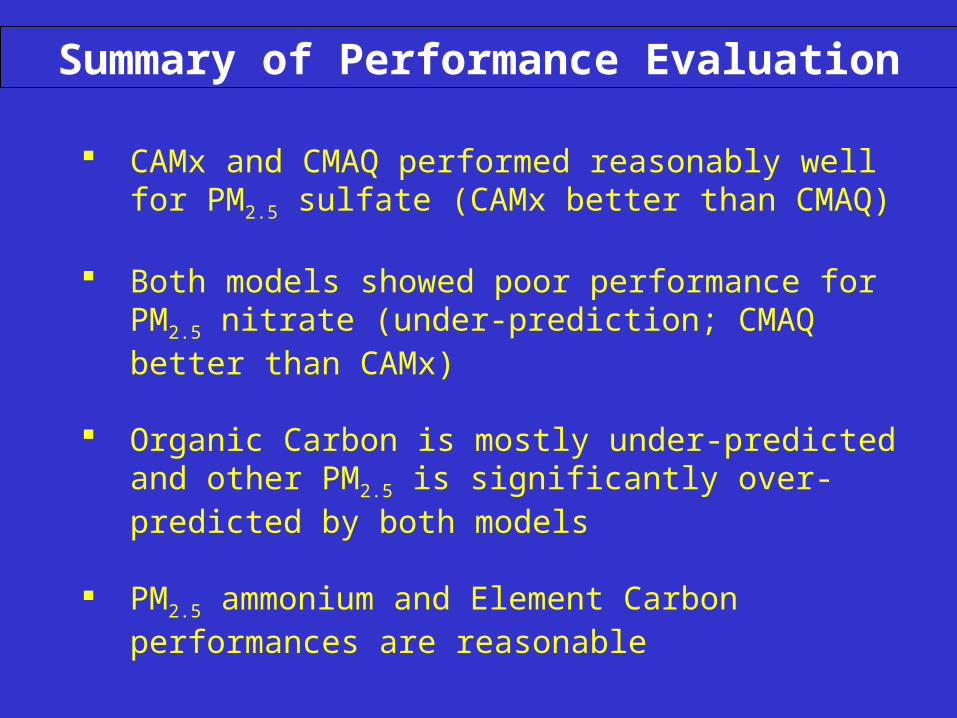
Summary of Performance Evaluation
CAMx and CMAQ performed reasonably well for PM2.5 sulfate (CAMx better than CMAQ)
Both models showed poor performance for PM2.5 nitrate (under-prediction; CMAQ better than CAMx)
Organic Carbon is mostly under-predicted and other PM2.5 is significantly over-predicted by both models
PM2.5 ammonium and Element Carbon performances are reasonable
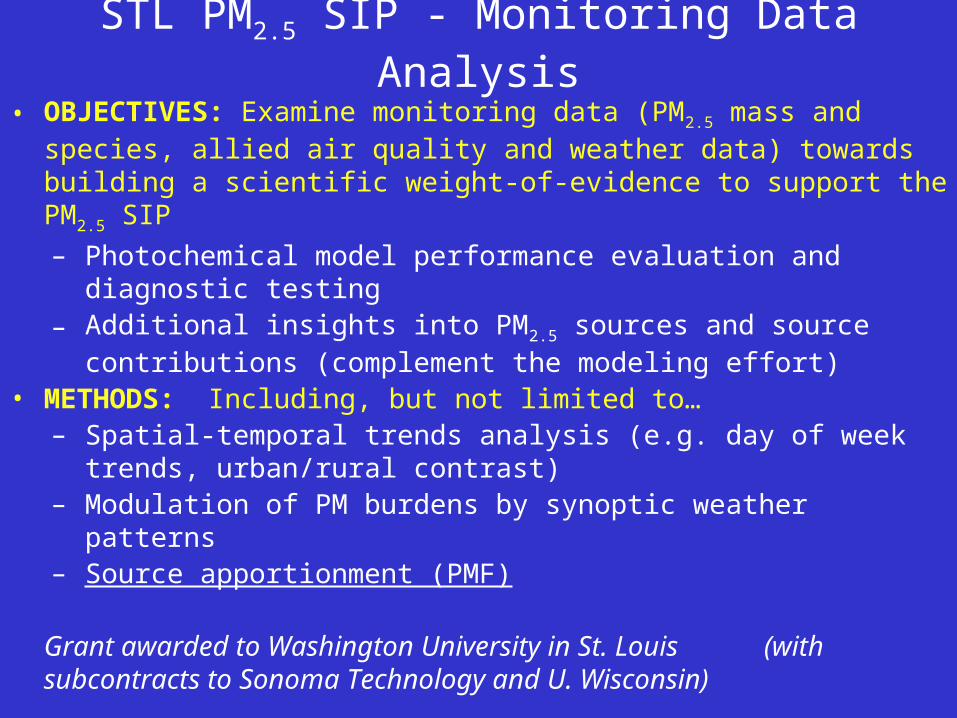
STL PM2.5 SIP - Monitoring Data Analysis
• OBJECTIVES: Examine monitoring data (PM2.5 mass and species, allied air quality and weather data) towards building a scientific weight-of-evidence to support the PM2.5 SIP
– Photochemical model performance evaluation and diagnostic testing
– Additional insights into PM2.5 sources and source contributions (complement the modeling effort)
• METHODS: Including, but not limited to…– Spatial-temporal trends analysis (e.g. day of week trends,
urban/rural contrast)– Modulation of PM burdens by synoptic weather patterns– Source apportionment (PMF)
Grant awarded to Washington University in St. Louis (with subcontracts to Sonoma Technology and U. Wisconsin)
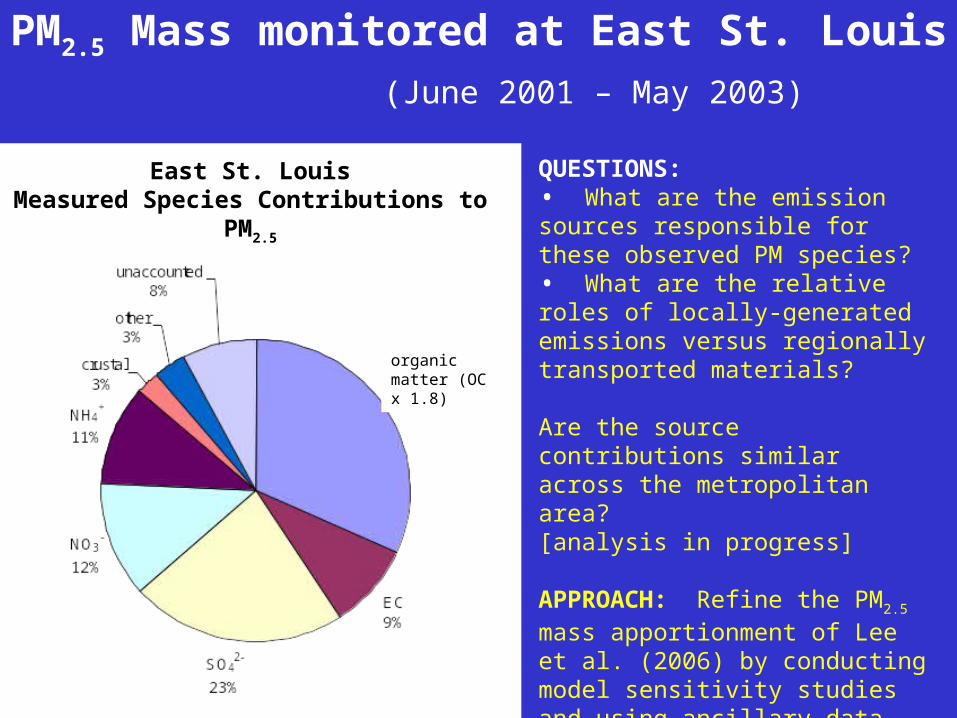
PM2.5 Mass monitored at East St. Louis (June 2001 – May 2003)
East St. LouisMeasured Species Contributions to PM2.5
QUESTIONS: • What are the emission sources responsible for these observed PM species?• What are the relative roles of locally-generated emissions versus regionally transported materials?
Are the source contributions similar across the metropolitan area? [analysis in progress]
APPROACH: Refine the PM2.5 mass apportionment of Lee et al. (2006) by conducting model sensitivity studies and using ancillary data not typically available or used
organic matter (OC x 1.8)
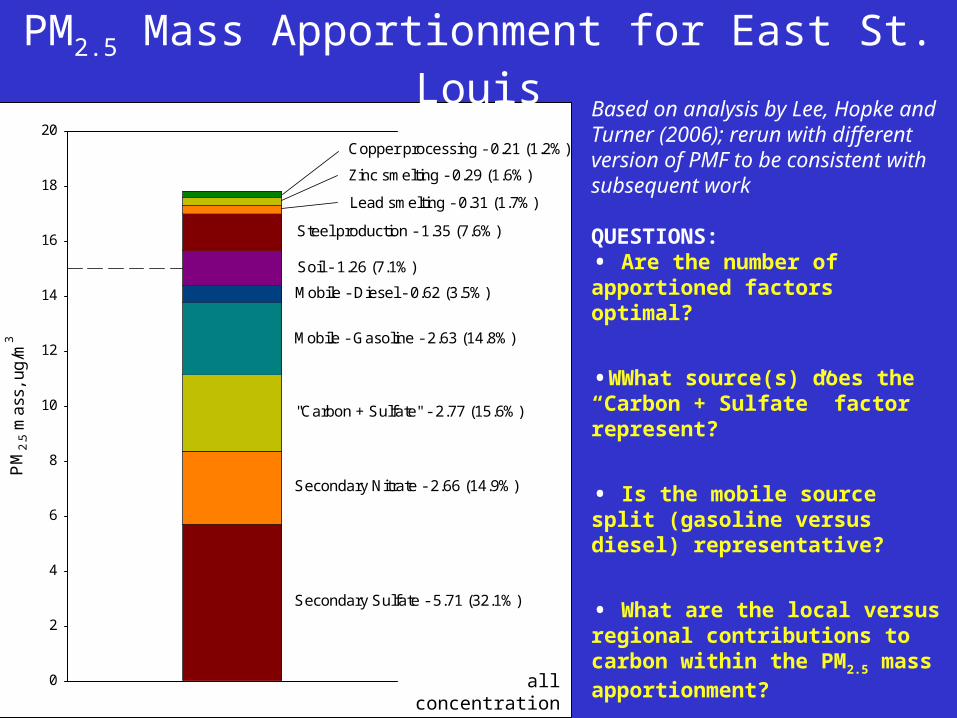
PM2.5 Mass Apportionment for East St. LouisBased on analysis by Lee, Hopke and Turner (2006); rerun with different version of PMF to be consistent with subsequent work
QUESTIONS:• Are the number of apportioned factors optimal?
•WWhat source(s) does the “Carbon + Sulfate” factor represent?
• Is the mobile source split (gasoline versus diesel) representative?
• What are the local versus regional contributions to carbon within the PM2.5 mass apportionment?
all concentration values in g/m30 1 2
PM
2.5 m
ass,
ug/
m3
0
2
4
6
8
10
12
14
16
18
20
Secondary Sulfate - 5.71 (32.1%)
Secondary Nitrate - 2.66 (14.9%)
"Carbon + Sulfate" - 2.77 (15.6%)
Mobile - Gasoline - 2.63 (14.8%)
Steel production - 1.35 (7.6%)
Soil - 1.26 (7.1%)
Mobile - Diesel - 0.62 (3.5%)
Lead smelting - 0.31 (1.7%)
Copper processing - 0.21 (1.2%)
Zinc smelting - 0.29 (1.6%)
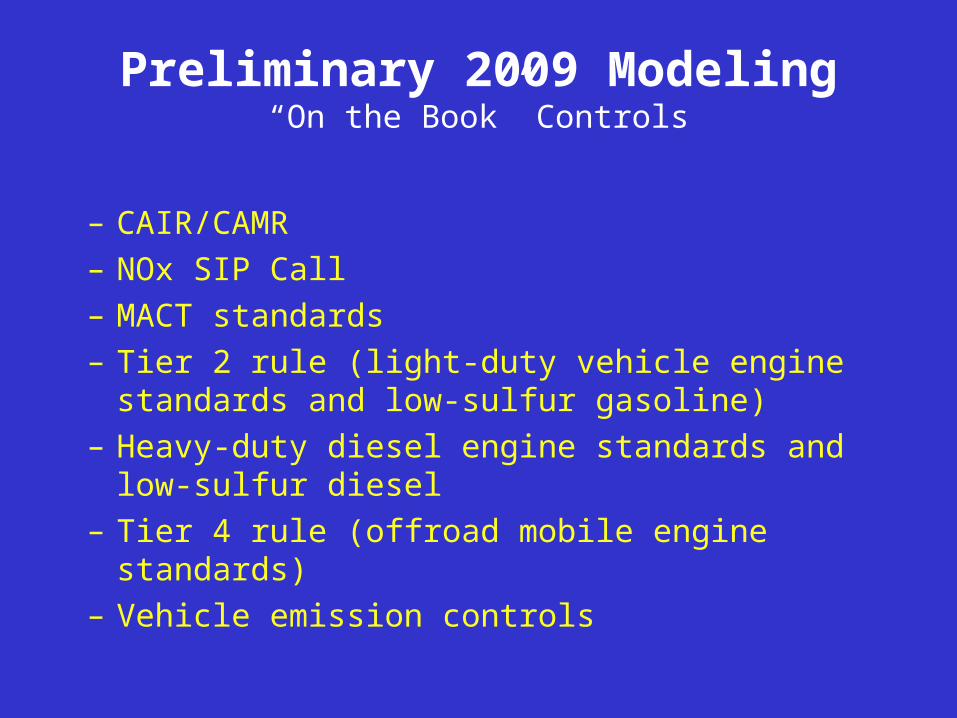
Preliminary 2009 Modeling“On the Book” Controls
– CAIR/CAMR– NOx SIP Call– MACT standards– Tier 2 rule (light-duty vehicle engine standards and low-
sulfur gasoline) – Heavy-duty diesel engine standards and low-sulfur
diesel– Tier 4 rule (offroad mobile engine standards)– Vehicle emission controls
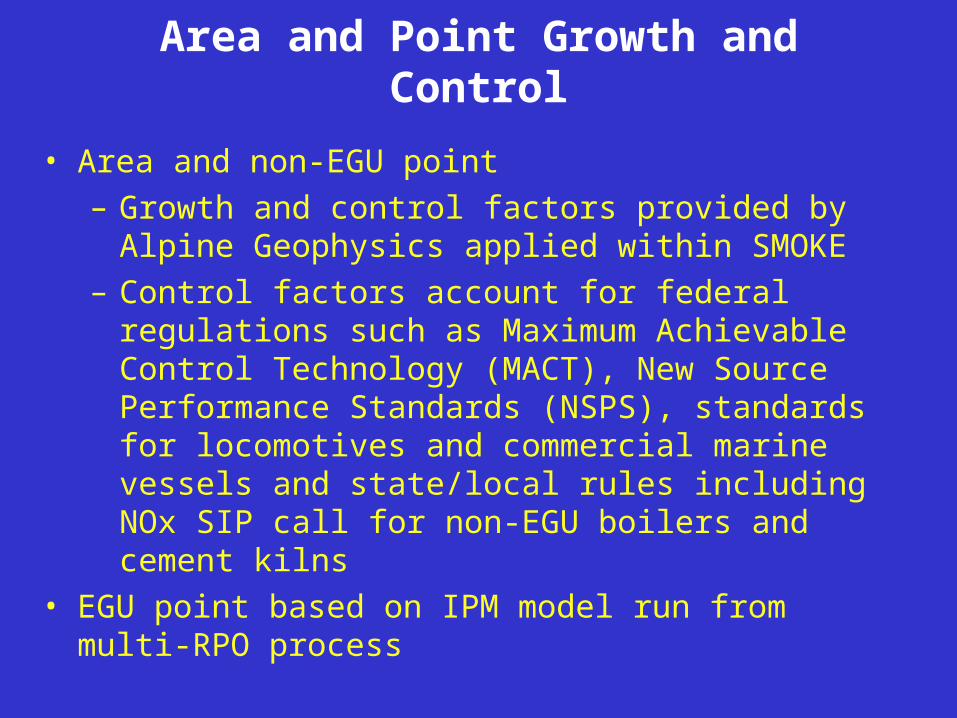
Area and Point Growth and Control
• Area and non-EGU point – Growth and control factors provided by Alpine
Geophysics applied within SMOKE– Control factors account for federal regulations such as
Maximum Achievable Control Technology (MACT), New Source Performance Standards (NSPS), standards for locomotives and commercial marine vessels and state/local rules including NOx SIP call for non-EGU boilers and cement kilns
• EGU point based on IPM model run from multi-RPO process
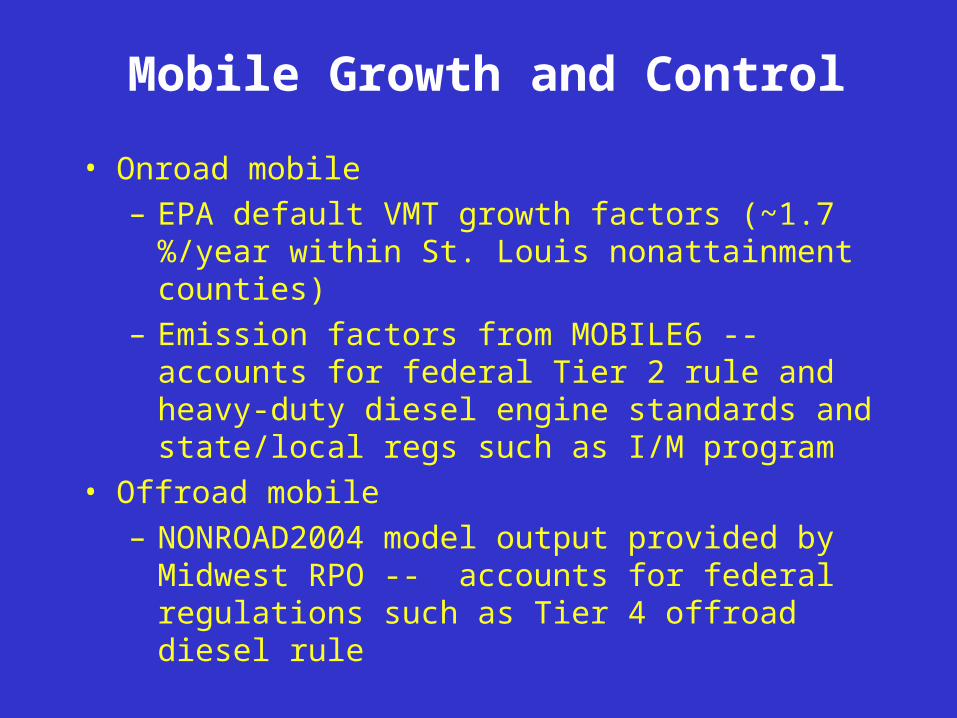
Mobile Growth and Control
• Onroad mobile– EPA default VMT growth factors (~1.7 %/year
within St. Louis nonattainment counties)– Emission factors from MOBILE6 -- accounts for
federal Tier 2 rule and heavy-duty diesel engine standards and state/local regs such as I/M program
• Offroad mobile– NONROAD2004 model output provided by
Midwest RPO -- accounts for federal regulations such as Tier 4 offroad diesel rule
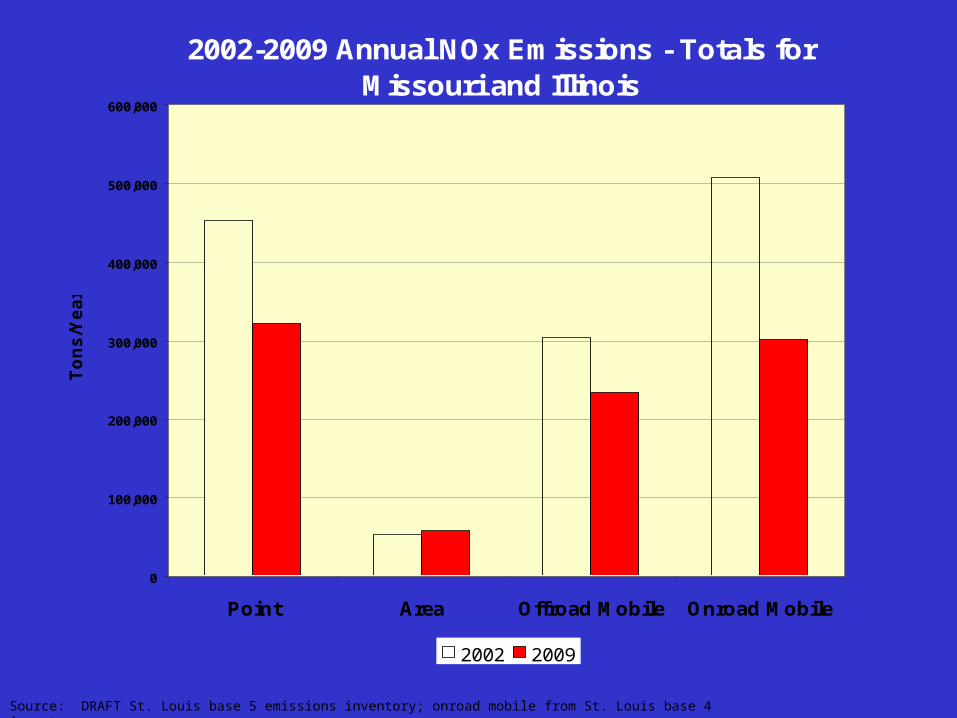
Source: DRAFT St. Louis base 5 emissions inventory; onroad mobile from St. Louis base 4 inventory.
2002-2009 Annual NOx Emissions - Totals for Missouri and Illinois
0
100,000
200,000
300,000
400,000
500,000
600,000
Point Area Offroad Mobile Onroad Mobile
To
ns
/Ye
ar
2002 2009
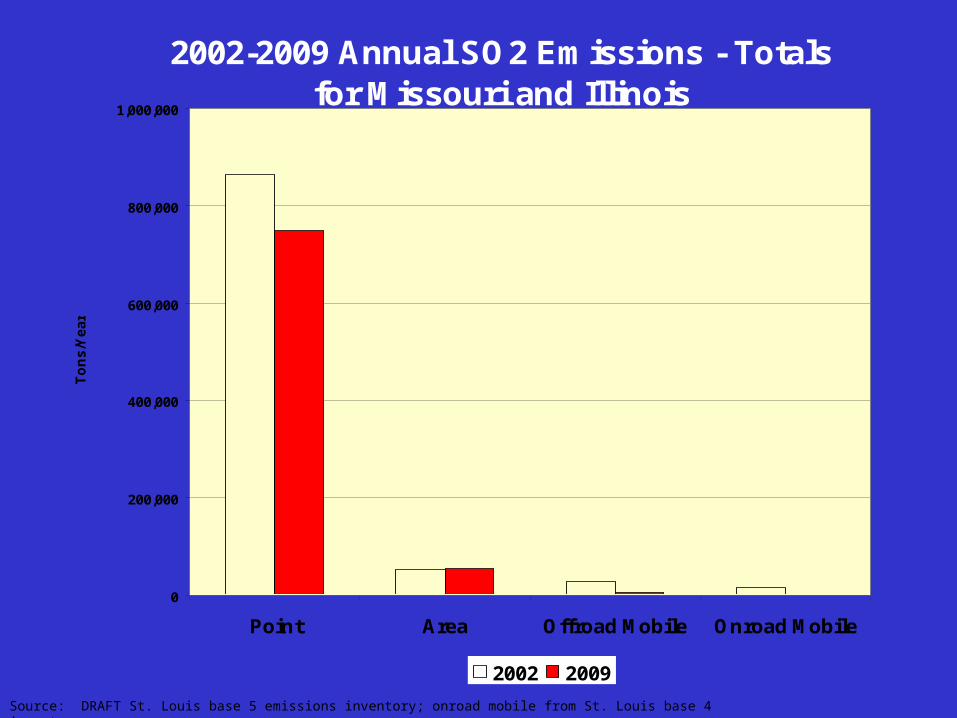
2002-2009 Annual SO2 Emissions - Totals for Missouri and Illinois
0
200,000
400,000
600,000
800,000
1,000,000
Point Area Offroad Mobile Onroad Mobile
To
ns
/Ye
ar
2002 2009
Source: DRAFT St. Louis base 5 emissions inventory; onroad mobile from St. Louis base 4 inventory.
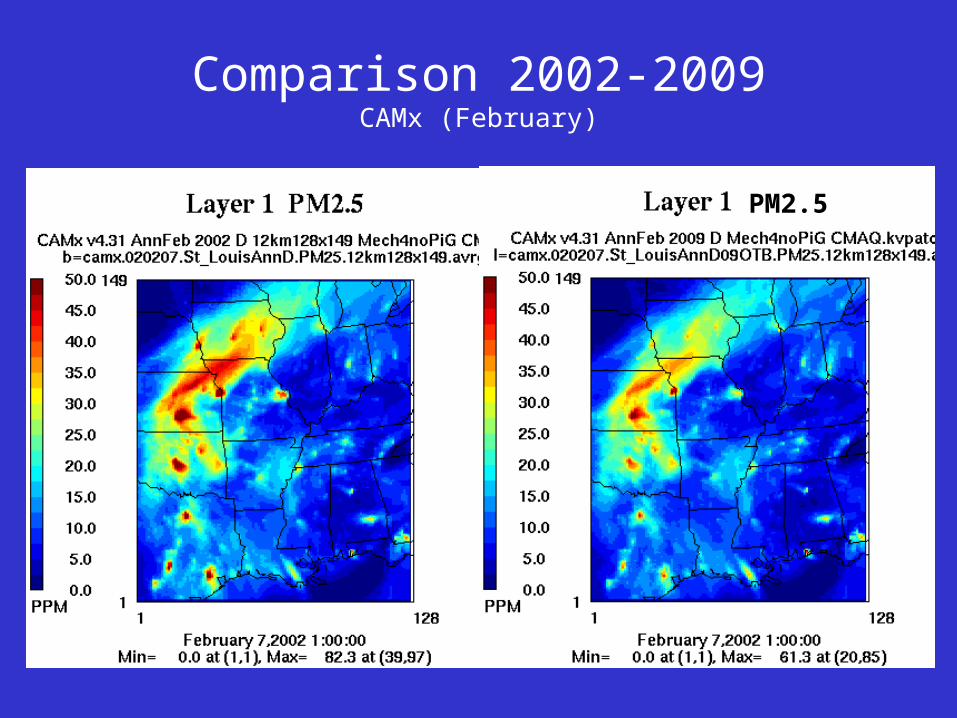
Comparison 2002-2009CAMx (February)
PM2.5
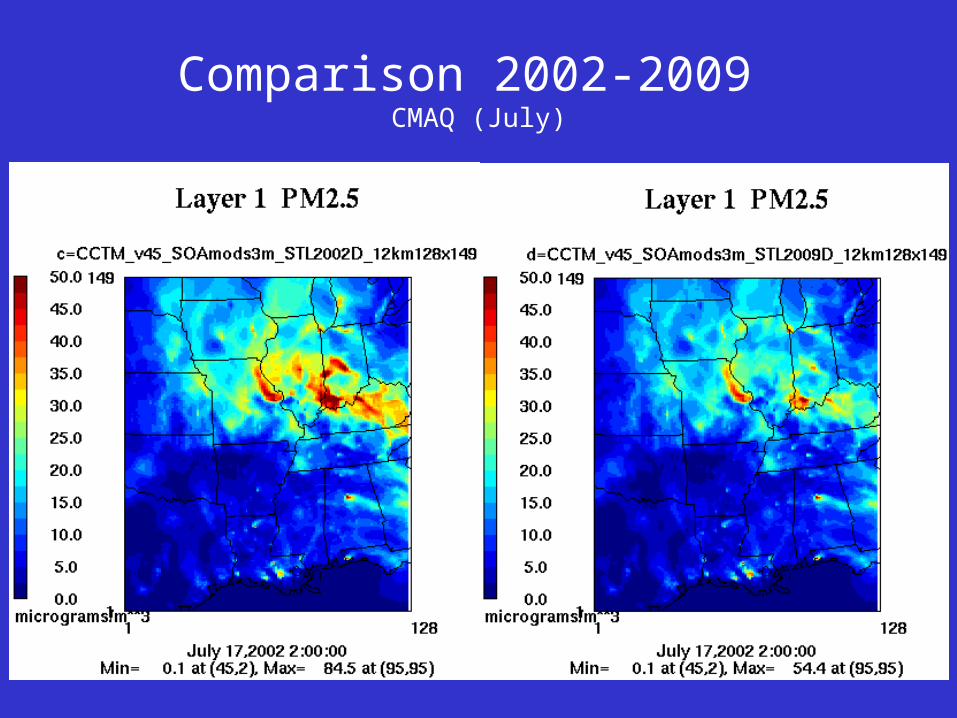
Comparison 2002-2009 CMAQ (July)
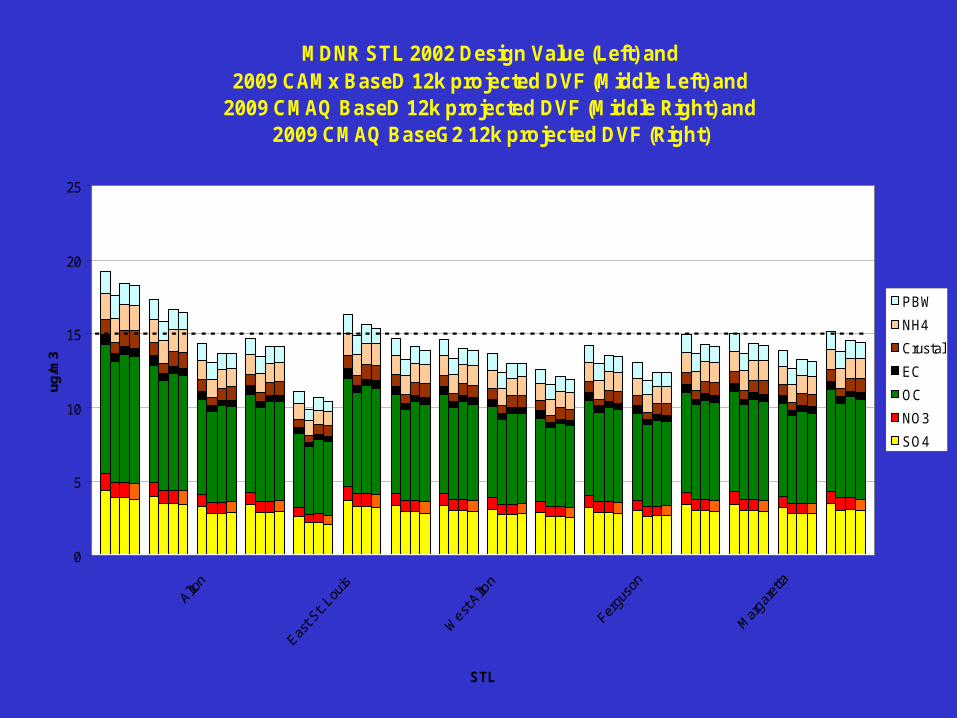
MDNR STL 2002 Design Value (Left) and2009 CAMx BaseD 12k projected DVF (Middle Left) and
2009 CMAQ BaseD 12k projected DVF (Middle Right) and2009 CMAQ BaseG2 12k projected DVF (Right)
0
5
10
15
20
25
STL
ug
/m3
PBW
NH4
Crustal
EC
OC
NO3
SO4
Conclusions
• The preliminary 2009 modeling shows that St Louis will not meet the annual PM2.5 standard based only on “on-the-books” controls.
• Additional emission reductions from local sources and/or regional transported will be needed.
• From a control strategy standpoint, need to improve 2002 model performance for organic carbon, nitrate, and other PM2.5 species (i.e. fugitive emissions)
PM2.5 Carbon Apportionment
• Carbonaceous matter is ~40% of the PM2.5 mass at East St. Louis
• PM2.5 mass apportionment cannot adequately resolve local carbon sources (from a control strategy perspective)
• Apportion PM2.5 carbon using organic molecular marker data (every sixth day for two years at East St. Louis)
• Organic carbon (OC) apportionment by chemical mass balance (CMB) and positive matrix factorization (PMF)– Jamie Schauer group (University of Wisconsin)– PMF identified several OC sources not used in the CMB
(CMB requires knowing the sources and having representative emissions source profiles)