St. Lawrence County - Cornell University Nutrient Management
39
Rao, R., P. Barney, Q.M. Ketterings, and H. Krol (2007). St. Lawrence Soil Sample Survey (2002-2006). CSS Extension Bulletin E07-2. 35 pages. i Soil Sample Survey St. Lawrence County Samples analyzed by CNAL (2002-2006) St Lawrence County (photo credit: Peter Barney, CCE of St Lawrence County). Summary compiled by Renuka Rao, Peter Barney, Quirine M. Ketterings, and Hettie Krol Cornell Nutrient Analysis Laboratory http://www.css.cornell.edu/soiltest/newindex.asp & Nutrient Management Spear Program http://nmsp.css.cornell.edu/
Transcript of St. Lawrence County - Cornell University Nutrient Management

Rao, R., P. Barney, Q.M. Ketterings, and H. Krol (2007). St. Lawrence Soil Sample Survey (2002-2006). CSS Extension Bulletin E07-2. 35 pages.
i
Soil Sample Survey
St. Lawrence County Samples analyzed by CNAL (2002-2006)
St Lawrence County (photo credit: Peter Barney, CCE of St Lawrence County).
Summary compiled by
Renuka Rao, Peter Barney, Quirine M. Ketterings, and Hettie Krol
Cornell Nutrient Analysis Laboratory http://www.css.cornell.edu/soiltest/newindex.asp
& Nutrient Management Spear Program
http://nmsp.css.cornell.edu/
Rao, R., P. Barney, Q.M. Ketterings, and H. Krol (2007). St. Lawrence Soil Sample Survey (2002-2006). CSS Extension Bulletin E07-2. 35 pages.
ii
Soil Sample Survey
St Lawrence County Samples analyzed by CNAL (2002-2006)
Summary compiled by
Renuka Rao
Director Cornell Nutrient Analysis Laboratory Department of Crop and Soil Sciences 804 Bradfield Hall, Cornell University
Ithaca NY 14853
Peter Barney Field Crops Educator
St. Lawrence County Cornell Cooperative Extension
Quirine M. Ketterings and Hettie Krol Nutrient Management Spear Program Department of Crop and Soil Sciences
July 12, 2007
Correct Citation:
Rao, R. P. Barney, Q.M. Ketterings, and H. Krol (2007). Soil sample survey of St. Lawrence County. Samples analyzed by the Cornell Nutrient Analysis Laboratory (2002-2006). CSS Extension Bulletin E07-2. 35 pages.
Rao, R., P. Barney, Q.M. Ketterings, and H. Krol (2007). St. Lawrence Soil Sample Survey (2002-2006). CSS Extension Bulletin E07-2. 35 pages.
iii
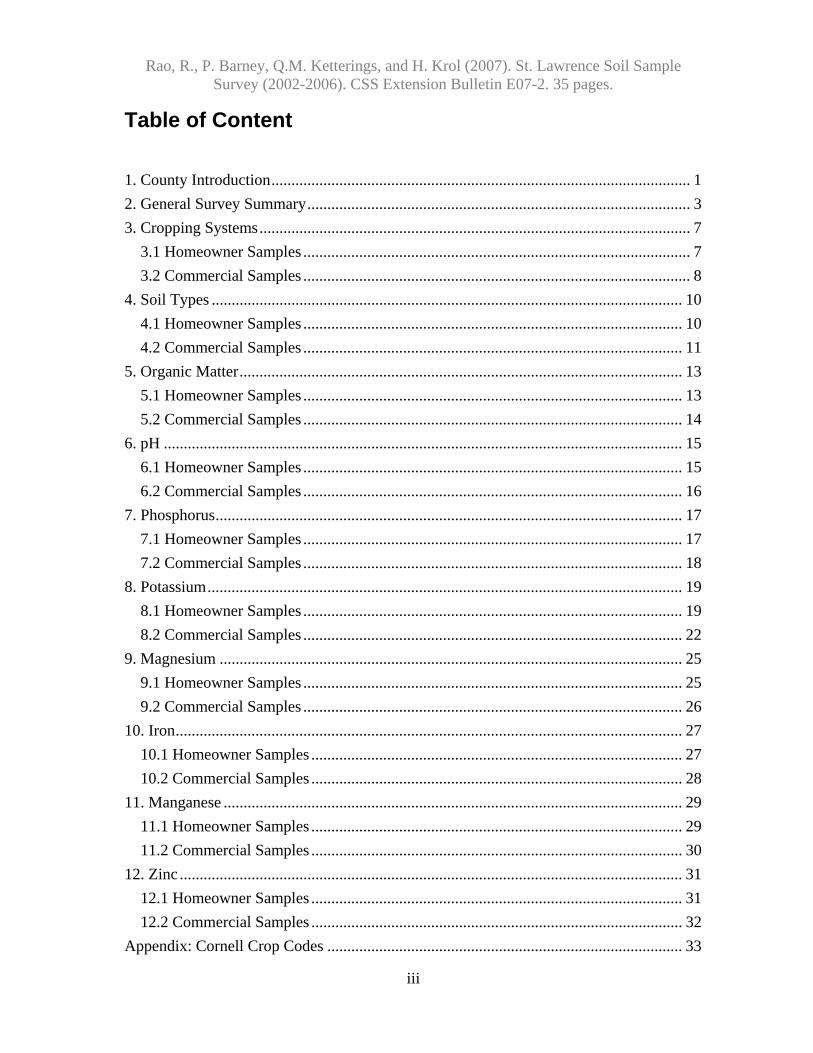
Table of Content 1. County Introduction......................................................................................................... 1 2. General Survey Summary................................................................................................ 3 3. Cropping Systems............................................................................................................ 7
3.1 Homeowner Samples ................................................................................................. 7 3.2 Commercial Samples ................................................................................................. 8
4. Soil Types ...................................................................................................................... 10 4.1 Homeowner Samples ............................................................................................... 10 4.2 Commercial Samples ............................................................................................... 11
5. Organic Matter............................................................................................................... 13 5.1 Homeowner Samples ............................................................................................... 13 5.2 Commercial Samples ............................................................................................... 14
6. pH .................................................................................................................................. 15 6.1 Homeowner Samples ............................................................................................... 15 6.2 Commercial Samples ............................................................................................... 16
7. Phosphorus..................................................................................................................... 17 7.1 Homeowner Samples ............................................................................................... 17 7.2 Commercial Samples ............................................................................................... 18
8. Potassium....................................................................................................................... 19 8.1 Homeowner Samples ............................................................................................... 19 8.2 Commercial Samples ............................................................................................... 22
9. Magnesium .................................................................................................................... 25 9.1 Homeowner Samples ............................................................................................... 25 9.2 Commercial Samples ............................................................................................... 26
10. Iron............................................................................................................................... 27 10.1 Homeowner Samples ............................................................................................. 27 10.2 Commercial Samples ............................................................................................. 28
11. Manganese ................................................................................................................... 29 11.1 Homeowner Samples ............................................................................................. 29 11.2 Commercial Samples ............................................................................................. 30
12. Zinc .............................................................................................................................. 31 12.1 Homeowner Samples ............................................................................................. 31 12.2 Commercial Samples ............................................................................................. 32
Appendix: Cornell Crop Codes ......................................................................................... 33

Rao, R., P. Barney, Q.M. Ketterings, and H. Krol (2007). St. Lawrence Soil Sample Survey (2002-2006). CSS Extension Bulletin E07-2. 35 pages.
iv
St. Lawrence County (photo credit: Peter Barney, CCE of St Lawrence County).

1
1. County Introduction
St. Lawrence County is the largest of the six Northern New York Counties. It is also the largest county in New York State and in the top ten for the largest counties east of the Mississippi River. The county is bluntly wedge shaped, bordered on the northwest by the St. Lawrence River, east by Franklin County, west by Jefferson County, southwest by Lewis County, south by Herkimer County, and southeast by Hamilton County. Its land area is 2,041 square miles or 1,306,240 acres. The county is made up of two belts. The first is a low land belt extending inland from the St. Lawrence River to the foothills of the Adirondacks. The second belt is the Adirondack Mountains. The low land belt’s width is about 20 miles relatively flat to gently rolling. This area is underlain by lake-laid clays and glacial-outwash deposits covering limestone or sandstone. This makes up the bedrock. Being a glaciated area, soil types ranging from sand to clay can be found in the county; quite often in the same field. Drainage in the county varies. All water flows north to the St. Lawrence River. There are seven watersheds that cover the county. The low land belt naturally is poorly drained. In order to farm effectively, ditching, tile drainage or ideally both are needed. The climate of the county is generally cool and damp. The annual mean temperature for the valley is 44.4oF; for the mountains it is 41.2oF. Our frost-free season ranges from 107 to 152 days. St. Lawrence County is basically a dairy county. The county has 481 dairy farms and 38,400 milk cows producing an average of 631,000,000 pounds of milk yearly. St. Lawrence County ranks 36th in the top 500 dairy counties in the U.S. The county has a total of 1,585 farms, #1 in the state, with 397,600 acres of farmland and 108,900 acres of woodland. Other than dairy you can find 3,500 head of beef, as well as sheep, goats and other livestock in the county. Due to the climate St Lawrence County is an excellent forage-producing county. Grasses and legume/grass sods make up much of the farmland with 84,500 acres in hay production. Corn silage comes in at 26,600 acres. Much land is under pasture, both

Rao, R., P. Barney, Q.M. Ketterings, and H. Krol (2007). St. Lawrence Soil Sample Survey (2002-2006). CSS Extension Bulletin E07-2. 35 pages.
2
rotational and conventional grazing. Other crops grown are small grains, soybeans and various summer annual crops. St. Lawrence County has a very strong forest product industry as well. This includes hardwood and softwood logs, pulp for paper and pelletizing wood waste for energy. The maple industry is another very strong business with 150 producers, producing 18,580 gallons per year, ranking St Lawrence County third in the state. “Progressive Farmer” magazine, May 2007 rates St. Lawrence County as number six in the nation as a preferred rural area to live. “Log Cabin” magazine also rates St. Lawrence County in the top ten.
Peter Barney Field Crop Extension Educator
St Lawrence County Cornell Cooperative Extension
St. Lawrence County (photo credit: Peter Barney, CCE of St Lawrence County).

Rao, R., P. Barney, Q.M. Ketterings, and H. Krol (2007). St. Lawrence Soil Sample Survey (2002-2006). CSS Extension Bulletin E07-2. 35 pages.
3
2. General Survey Summary
This survey summarizes the soil test results from grower (identified as “commercial samples”) and homeowner samples from Lewis County submitted to the Cornell Nutrient Analysis Laboratory (CNAL) from 2002 to 2006. The total number of samples analyzed in these years amounted to 2938. Of these 2763 samples (94%) were submitted by commercial growers while 175 samples (6%) were submitted by homeowners. The number of samples fluctuated over the years.
0
100
200
300
400
500
600
700
800
900
2002 2003 2004 2005 2006
Num
ber o
f sam
ples
Samples for commercial production
Samples for home and garden
Homeowners
Commercial
Total
2002
45
2002
789
834
2003 31 2003 479 510 2004 36 2004 499 535 2005 40 2005 328 368 2006 23 2006 668 691 Total 175 Total 2763 2938

Rao, R., P. Barney, Q.M. Ketterings, and H. Krol (2007). St. Lawrence Soil Sample Survey (2002-2006). CSS Extension Bulletin E07-2. 35 pages.
4
The majority (74%) of the homeowners that submitted soil samples to the Cornell Nutrient Analysis Laboratory during 1995-2001 requested fertilizer recommendations for home garden vegetable production (39%) or lawns (27%). Commercial growers submitted samples to grow corn silage or grain (34%), grass hay production (28%), and alfalfa or alfalfa/grass mixes (22%), and while a few growers were planning to grow clover, oats and other crops. Soils tested for home and garden in St Lawrence County were classified as soil management group 5 soils (57%), group 4 soil (21%), group 3 soils (19%), or group 2 soils (4%). A description of the different management groups is given below. Soil Management Groups for New York.
1
Fine-textured soils developed from clayey lake sediments and medium- to fine-textured soils developed from lake sediments.
2
Medium- to fine-textured soils developed from calcareous glacial till and medium-textured to moderately fine-textured soils developed from slightly calcareous glacial till mixed with shale and medium-textured soils developed in recent alluvium.
3 Moderately coarse textured soil developed from glacial outwash and recent alluvium and medium-textured acid soil developed on glacial till.
4 Coarse- to medium-textured soils formed from glacial till or glacial outwash.
5
Coarse- to very coarse-textured soils formed from gravelly or sandy glacial outwash or glacial lake beach ridges or deltas.
6 Organic or muck soils with more than 80% organic matter.
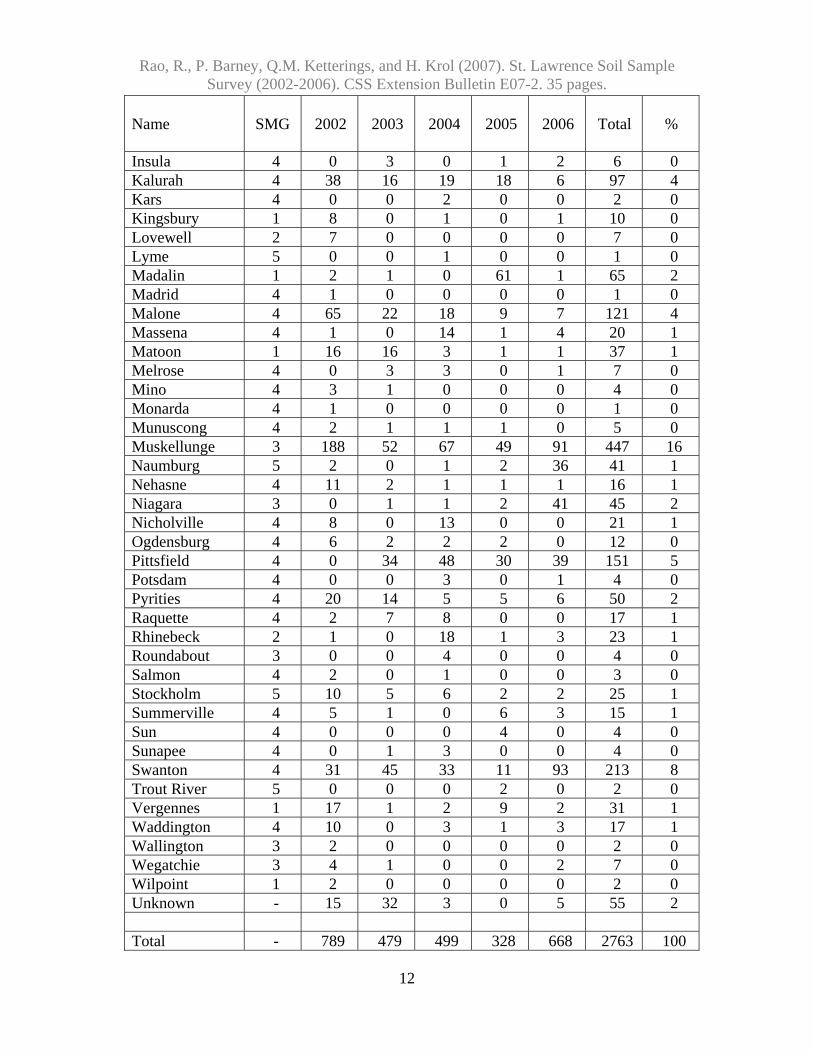
Of the samples submitted by commercial growers, 10% belonged to soil management group 1, 3% were group 2 soils, 24% were group 3 soils, 54% were group 4 soils, 8% belonged to group 5 and less than 1% were organic soils. Muskellunge was the most common soil series (16% of all samples), followed by Hogansburg (14%), Swanton (8%), and Pittsfield (5%).
Rao, R., P. Barney, Q.M. Ketterings, and H. Krol (2007). St. Lawrence Soil Sample Survey (2002-2006). CSS Extension Bulletin E07-2. 35 pages.
5
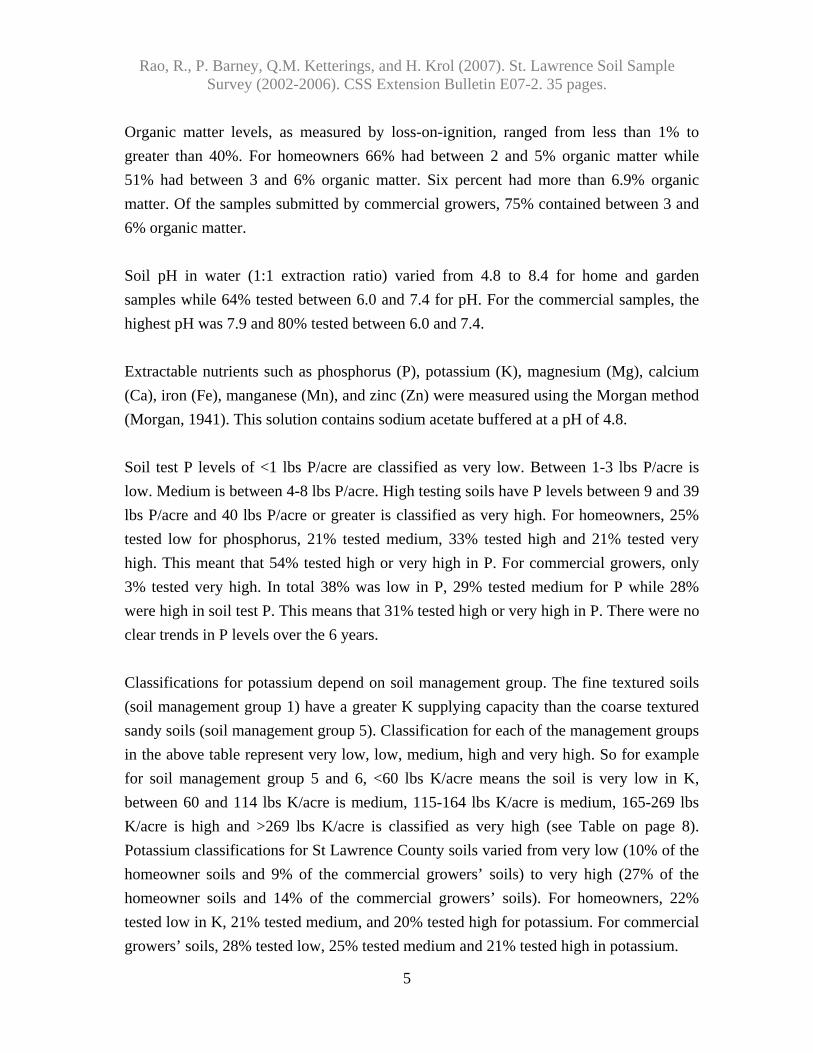
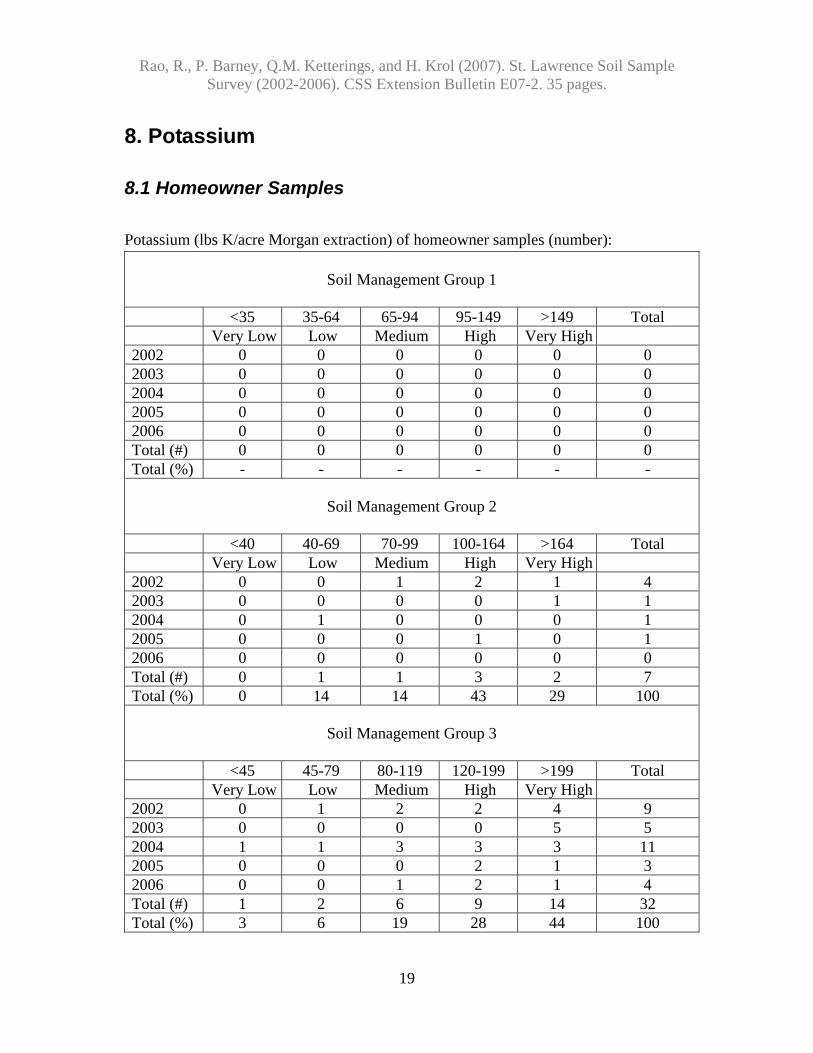
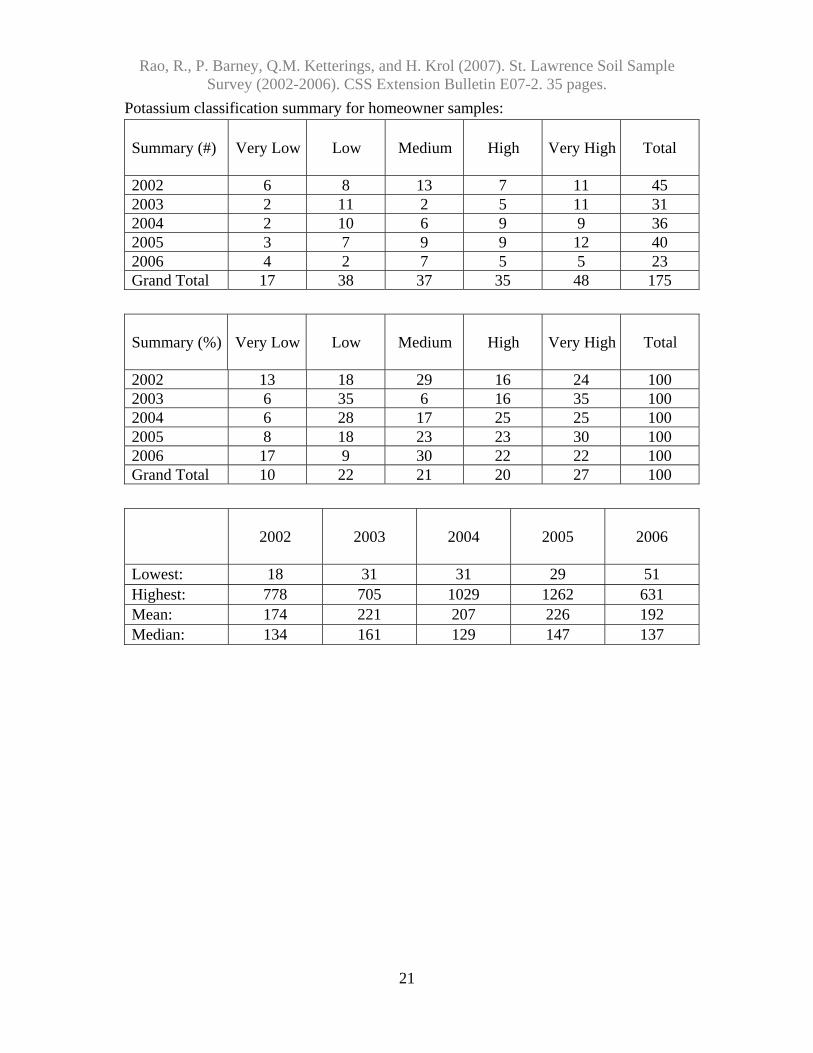
Organic matter levels, as measured by loss-on-ignition, ranged from less than 1% to greater than 40%. For homeowners 66% had between 2 and 5% organic matter while 51% had between 3 and 6% organic matter. Six percent had more than 6.9% organic matter. Of the samples submitted by commercial growers, 75% contained between 3 and 6% organic matter. Soil pH in water (1:1 extraction ratio) varied from 4.8 to 8.4 for home and garden samples while 64% tested between 6.0 and 7.4 for pH. For the commercial samples, the highest pH was 7.9 and 80% tested between 6.0 and 7.4. Extractable nutrients such as phosphorus (P), potassium (K), magnesium (Mg), calcium (Ca), iron (Fe), manganese (Mn), and zinc (Zn) were measured using the Morgan method (Morgan, 1941). This solution contains sodium acetate buffered at a pH of 4.8. Soil test P levels of <1 lbs P/acre are classified as very low. Between 1-3 lbs P/acre is low. Medium is between 4-8 lbs P/acre. High testing soils have P levels between 9 and 39 lbs P/acre and 40 lbs P/acre or greater is classified as very high. For homeowners, 25% tested low for phosphorus, 21% tested medium, 33% tested high and 21% tested very high. This meant that 54% tested high or very high in P. For commercial growers, only 3% tested very high. In total 38% was low in P, 29% tested medium for P while 28% were high in soil test P. This means that 31% tested high or very high in P. There were no clear trends in P levels over the 6 years. Classifications for potassium depend on soil management group. The fine textured soils (soil management group 1) have a greater K supplying capacity than the coarse textured sandy soils (soil management group 5). Classification for each of the management groups in the above table represent very low, low, medium, high and very high. So for example for soil management group 5 and 6, <60 lbs K/acre means the soil is very low in K, between 60 and 114 lbs K/acre is medium, 115-164 lbs K/acre is medium, 165-269 lbs K/acre is high and >269 lbs K/acre is classified as very high (see Table on page 8). Potassium classifications for St Lawrence County soils varied from very low (10% of the homeowner soils and 9% of the commercial growers’ soils) to very high (27% of the homeowner soils and 14% of the commercial growers’ soils). For homeowners, 22% tested low in K, 21% tested medium, and 20% tested high for potassium. For commercial growers’ soils, 28% tested low, 25% tested medium and 21% tested high in potassium.

Rao, R., P. Barney, Q.M. Ketterings, and H. Krol (2007). St. Lawrence Soil Sample Survey (2002-2006). CSS Extension Bulletin E07-2. 35 pages.
6
Potassium Soil Test Value (Morgan extraction in lbs K/acre)
Soil Management
Group
Very low
Low
Medium
High
Very High
1
<35
35-64
65-94
95-149
>149
2 <40 40-69 70-99 100-164 >164 3 <45 45-79 80-119 120-199 >199 4 <55 55-99 100-149 150-239 >239
5 and 6 <60 60-114 115-164 165-269 >269
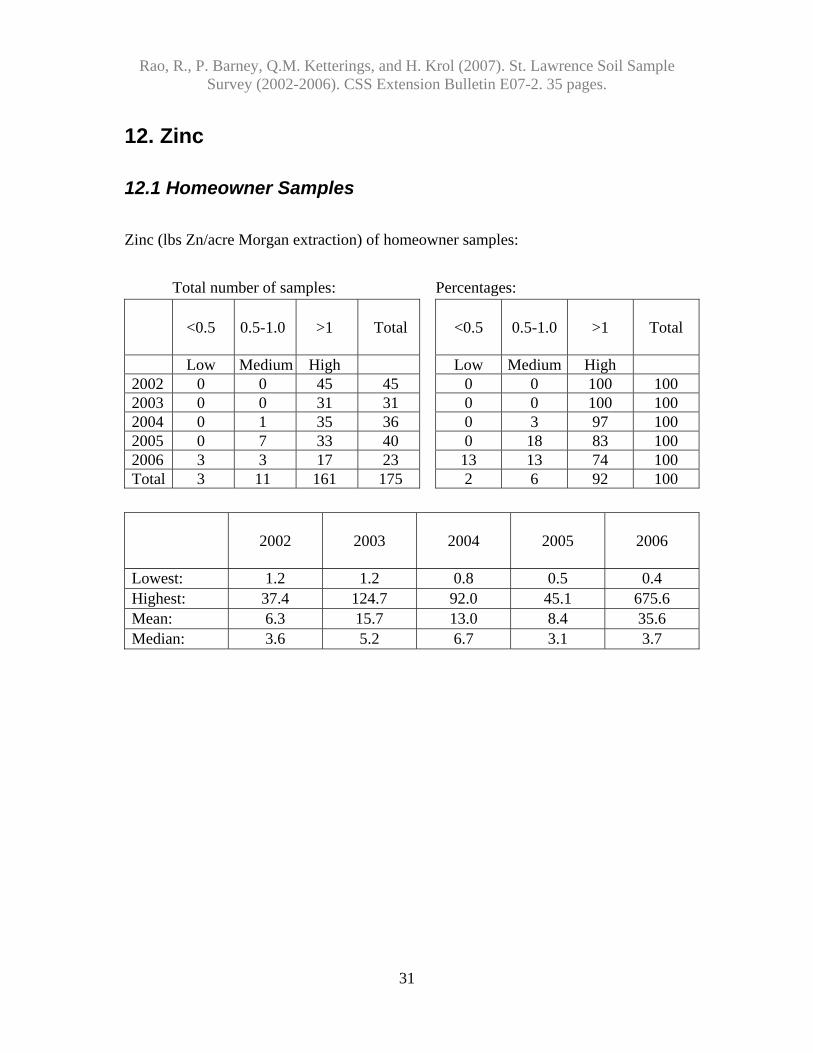
Soils test very low for magnesium if Morgan extractable Mg is less than 20 lbs Mg/acre. Low testing soils have 20-65 lbs Morgan Mg per acre. Soils with 66-100 lbs Mg/acre test medium for magnesium. High testing soils have 101-199 lbs Mg/acre while soils with more than 200 lbs Mg/acre are classified as very high in Mg. Magnesium levels ranged from 5 to 4570 lbs Mg/acre. There were no soils that tested very low for Mg among the homeowner samples and only 8 samples for commercial production were very low in Mg. Most soils were very high or very high in Mg (95% of the homeowner soils and 97% of the soils of the commercial growers). In total, 5% of the homeowner soils and 3% of the commercial growers’ soil tested low or medium in Mg. Thus, Mg deficiency is not likely to occur in St Lawrence County provided the soil pH is maintained in a desirable range. Soils with more than 50 lbs Morgan extractable Fe per acre test excessive for Fe. Anything lower than 50 lbs Fe/acre is considered normal. Iron levels fell for 93-94% in the normal range with only 7% of the homeowner soils and 6% of the commercial grower soils testing excessive for Fe. Similarly, most soils (97-100%) tested normal for manganese. Soils with more than 100 lbs Morgan extractable Mn per acre are classified as excessive in Mn. Anything less than 100 lbs Mn per acre is classified as normal. Soils with less than 0.5 lb/acre Zn are classified as low in Zn. Medium testing soils have between 0.5 and 1 lb/acre Zn. If more than 1 lb of Zn/acre is extracted, the soil tests high in Zn. For the homeowner soils, 92% tested high while 6% tested medium for Zn. Of the commercial growers’ samples, 19% tested medium while 80% was high in Zn. In the following sections, the summary tables for each of the soil fertility indicators described above are given. The appendix contains the crop codes used in section 2.

Rao, R., P. Barney, Q.M. Ketterings, and H. Krol (2007). St. Lawrence Soil Sample Survey (2002-2006). CSS Extension Bulletin E07-2. 35 pages.
7
3. Cropping Systems
3.1 Homeowner Samples Crops for which recommendations are requested by homeowners:
2002
2003
2004
2005
2006
Total
%
ALG 0 0 0 1 0 1 1 ATF 1 1 7 1 1 11 6 BLU 3 2 2 0 1 8 5 CEM 1 0 0 0 0 1 1 FAR 4 0 0 0 0 4 2 FLA 1 0 1 0 0 2 1 GEN 3 0 0 0 0 3 2 GRA 0 0 0 1 0 1 1 LAW 11 10 14 5 8 48 27 MIX 0 0 0 0 1 1 1 MVG 16 13 7 24 8 68 39 OTH 0 0 0 2 0 2 1 PER 0 1 0 3 0 4 2 PTO 0 0 0 1 0 1 1 RSP 0 0 3 0 3 6 3 SAG 1 4 0 2 1 8 5 STR 1 0 0 0 0 1 1 TRF 3 0 1 0 0 4 2 Unknown 0 0 1 0 0 1 1 Total 45 31 36 40 23 175 100
Notes: See Appendix for Cornell crop codes.

Rao, R., P. Barney, Q.M. Ketterings, and H. Krol (2007). St. Lawrence Soil Sample Survey (2002-2006). CSS Extension Bulletin E07-2. 35 pages.
8
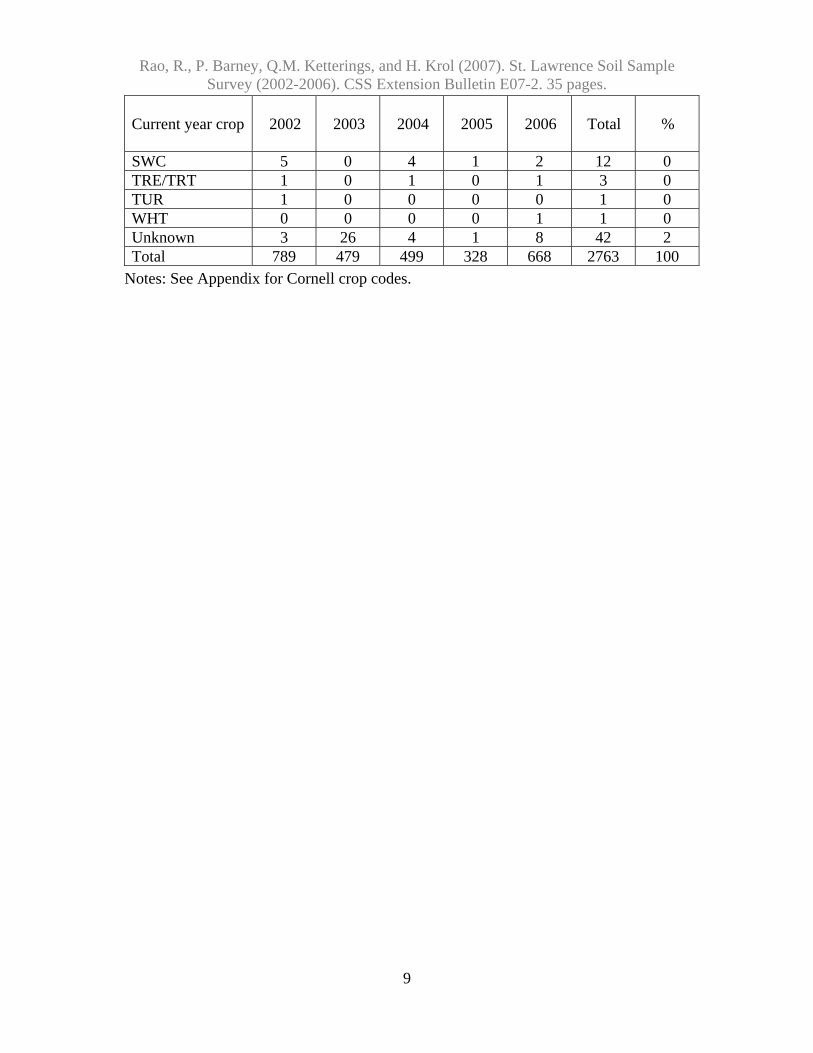
3.2 Commercial Samples Crops for which recommendations are requested in commercial samples: Current year crop
2002
2003
2004
2005
2006
Total
%
ABE/ABT 2 2 1 0 2 7 0 AGE/AGT 181 71 109 42 115 518 19 ALE/ALT 3 20 32 9 29 93 3 ALG 0 0 0 1 0 1 0 APP 0 1 0 0 0 1 0 BCE 3 0 0 1 0 4 0 BDR 0 0 0 0 1 1 0 BKB 0 0 0 0 1 1 0 BRS 0 0 0 0 1 1 0 BSS 0 0 0 1 0 1 0 BUK 0 6 3 2 0 11 0 CBP 0 0 0 0 1 1 0 CGE/CGT 54 18 20 7 42 141 5 CLE/CLT 14 5 2 3 12 36 1 COG/COS 237 181 178 106 231 933 34 CSE 2 0 0 0 2 4 0 CVE 0 1 0 0 0 1 0 GIE/GIT 115 14 15 2 4 150 5 GRE/GRT 117 98 97 141 178 631 23 IDL 9 0 1 0 2 12 0 LET 0 0 0 0 1 1 0 MIX 3 1 0 0 6 10 0 OAS 12 8 4 0 2 26 1 OAT 1 5 1 4 10 21 1 OTH 3 13 15 3 5 39 1 PEP 1 0 0 0 0 1 0 PGE/PGT 1 2 0 0 0 3 0 PIE/PIT 1 1 0 0 0 2 0 PLE/PLT 0 0 2 0 0 2 0 PNE/PNT 6 0 3 0 3 12 0 POT 0 0 0 0 1 1 0 PUM 3 0 2 0 2 7 0 RSS 1 0 0 1 0 2 0 SOF 0 1 2 0 0 3 0 SOY 2 2 2 1 5 12 0 SSH 6 2 1 2 0 11 0 STS 2 1 0 0 0 3 0
Rao, R., P. Barney, Q.M. Ketterings, and H. Krol (2007). St. Lawrence Soil Sample Survey (2002-2006). CSS Extension Bulletin E07-2. 35 pages.
9
Current year crop
2002
2003
2004
2005
2006
Total
%
SWC 5 0 4 1 2 12 0 TRE/TRT 1 0 1 0 1 3 0 TUR 1 0 0 0 0 1 0 WHT 0 0 0 0 1 1 0 Unknown 3 26 4 1 8 42 2 Total 789 479 499 328 668 2763 100
Notes: See Appendix for Cornell crop codes.

Rao, R., P. Barney, Q.M. Ketterings, and H. Krol (2007). St. Lawrence Soil Sample Survey (2002-2006). CSS Extension Bulletin E07-2. 35 pages.
10
4. Soil Types
4.1 Homeowner Samples Soil types (soil management groups) for homeowner samples:
2002
2003
2004
2005
2006
Total
%
SMG 1 (clayey) 0 0 0 0 0 0 0 SMG 2 (silty) 4 1 1 1 0 7 4 SMG 3 (silt loam) 9 5 11 3 4 33 19 SMG 4 (sandy loam) 14 8 5 4 6 37 21 SMG 5 (sandy) 18 17 19 32 13 99 57 SMG 6 (mucky) 0 0 0 0 0 0 0 Total 45 31 36 40 23 175 100

Rao, R., P. Barney, Q.M. Ketterings, and H. Krol (2007). St. Lawrence Soil Sample Survey (2002-2006). CSS Extension Bulletin E07-2. 35 pages.
11
4.2 Commercial Samples Soil series for commercial samples: Name
SMG
2002
2003
2004
2005
2006
Total
%
Adams 5 12 4 16 2 21 55 2 Adjidaumo 1 22 1 7 15 8 53 2 Berkshire 5 8 0 0 0 0 8 0 Brayton 4 10 0 0 0 0 10 0 Canandaigua 3 0 0 0 0 3 3 0 Carbondale 6 1 0 0 0 0 1 0 Chaumont 1 13 2 0 19 13 47 2 Cheektowaga 5 0 0 0 1 0 1 0 Collamer 3 1 2 0 3 1 7 0 Colton 5 3 0 0 0 1 4 0 Cornish 3 8 0 0 0 0 8 0 Coveytown 4 3 0 0 2 1 6 0 Covington 1 3 0 5 0 0 8 0 Crary 4 5 0 3 0 2 10 0 Croghan 5 15 6 8 5 25 59 2 Deford 4 1 1 7 0 2 11 0 Depeyster 3 9 21 5 9 4 48 2 Dixmont 5 7 4 10 4 2 27 1 Dorval 6 4 0 0 0 0 4 0 Dunkirk 3 0 1 0 1 2 4 0 Eelweir 4 0 0 1 0 0 1 0 Elmwood 4 14 15 13 5 49 96 3 Empeyville 4 4 0 0 0 0 4 0 Fahey 5 5 0 0 2 0 7 0 Flackville 4 18 9 5 3 15 50 2 Georgia 4 1 1 3 0 5 10 0 Grenville 4 22 22 15 1 39 99 4 Guff 1 0 0 0 0 2 2 0 Guffin 1 0 0 0 7 0 7 0 Hailsboro 3 15 13 11 19 20 78 3 Hannawa 4 1 0 0 0 1 2 0 Hermon 4 0 0 0 1 0 1 0 Heuvelton 2 14 9 2 5 10 40 1 Hogansburg 4 85 106 99 4 87 381 14 Hollis 4 0 0 5 0 3 8 0 Hoosic 4 1 0 0 0 0 1 0 Hudson 2 4 1 0 1 1 7 0
Rao, R., P. Barney, Q.M. Ketterings, and H. Krol (2007). St. Lawrence Soil Sample Survey (2002-2006). CSS Extension Bulletin E07-2. 35 pages.
12
Name
SMG
2002
2003
2004
2005
2006
Total
%
Insula 4 0 3 0 1 2 6 0 Kalurah 4 38 16 19 18 6 97 4 Kars 4 0 0 2 0 0 2 0 Kingsbury 1 8 0 1 0 1 10 0 Lovewell 2 7 0 0 0 0 7 0 Lyme 5 0 0 1 0 0 1 0 Madalin 1 2 1 0 61 1 65 2 Madrid 4 1 0 0 0 0 1 0 Malone 4 65 22 18 9 7 121 4 Massena 4 1 0 14 1 4 20 1 Matoon 1 16 16 3 1 1 37 1 Melrose 4 0 3 3 0 1 7 0 Mino 4 3 1 0 0 0 4 0 Monarda 4 1 0 0 0 0 1 0 Munuscong 4 2 1 1 1 0 5 0 Muskellunge 3 188 52 67 49 91 447 16 Naumburg 5 2 0 1 2 36 41 1 Nehasne 4 11 2 1 1 1 16 1 Niagara 3 0 1 1 2 41 45 2 Nicholville 4 8 0 13 0 0 21 1 Ogdensburg 4 6 2 2 2 0 12 0 Pittsfield 4 0 34 48 30 39 151 5 Potsdam 4 0 0 3 0 1 4 0 Pyrities 4 20 14 5 5 6 50 2 Raquette 4 2 7 8 0 0 17 1 Rhinebeck 2 1 0 18 1 3 23 1 Roundabout 3 0 0 4 0 0 4 0 Salmon 4 2 0 1 0 0 3 0 Stockholm 5 10 5 6 2 2 25 1 Summerville 4 5 1 0 6 3 15 1 Sun 4 0 0 0 4 0 4 0 Sunapee 4 0 1 3 0 0 4 0 Swanton 4 31 45 33 11 93 213 8 Trout River 5 0 0 0 2 0 2 0 Vergennes 1 17 1 2 9 2 31 1 Waddington 4 10 0 3 1 3 17 1 Wallington 3 2 0 0 0 0 2 0 Wegatchie 3 4 1 0 0 2 7 0 Wilpoint 1 2 0 0 0 0 2 0 Unknown - 15 32 3 0 5 55 2 Total - 789 479 499 328 668 2763 100

Rao, R., P. Barney, Q.M. Ketterings, and H. Krol (2007). St. Lawrence Soil Sample Survey (2002-2006). CSS Extension Bulletin E07-2. 35 pages.
13
5. Organic Matter
5.1 Homeowner Samples Organic matter (loss-on-ignition method) of homeowner samples (number):
<1
1.0-1.9
2.0-2.9
3.0-3.9
4.0-4.9
5.0-5.9
6.0-6.9
>6.9
Total
2002 2 6 17 9 5 5 0 1 45 2003 0 4 5 9 5 4 1 3 31 2004 1 3 7 10 6 4 1 4 36 2005 0 3 10 10 10 3 4 0 40 2006 3 2 5 4 4 1 1 3 23 Total 6 18 44 42 30 17 7 11 175
2002
2003
2004
2005
2006
Lowest: 0.1 1.5 0.9 1.6 0.1 Highest: 28.3 36.3 16.4 6.6 8.9 Mean: 3.5 4.9 4.3 3.7 3.6 Median: 2.6 3.8 3.9 3.5 3.5
Organic matter of homeowner samples (% of total number of samples):
<1
1.0-1.9
2.0-2.9
3.0-3.9
4.0-4.9
5.0-5.9
6.0-6.9
>6.9
Total
2002 4 13 38 20 11 11 0 2 100 2003 0 13 16 29 16 13 3 10 100 2004 3 8 19 28 17 11 3 11 100 2005 0 8 25 25 25 8 10 0 100 2006 13 9 22 17 17 4 4 13 100 Total 3 10 25 24 17 10 4 6 100

Rao, R., P. Barney, Q.M. Ketterings, and H. Krol (2007). St. Lawrence Soil Sample Survey (2002-2006). CSS Extension Bulletin E07-2. 35 pages.
14
5.2 Commercial Samples Organic matter (loss-on-ignition method) of commercial samples (number):
<1
1.0-1.9
2.0-2.9
3.0-3.9
4.0-4.9
5.0-5.9
6.0-6.9
>6.9
Total
2002 0 27 132 299 201 84 23 23 789 2003 0 13 89 224 124 22 5 2 479 2004 0 14 107 225 119 24 4 6 499 2005 0 7 56 124 72 40 16 13 328 2006 0 13 144 304 141 44 14 8 668 Total 0 74 528 1176 657 214 62 52 2763
2002
2003
2004
2005
2006
Lowest: 1.0 1.1 1.2 1.1 1.2 Highest: 29.7 44.1 19.0 32.7 9.9 Mean: 4.0 3.7 3.6 4.2 3.7 Median: 3.7 3.6 3.5 3.8 3.5
Organic matter of commercial samples (% of total number of samples):
<1
1.0-1.9
2.0-2.9
3.0-3.9
4.0-4.9
5.0-5.9
6.0-6.9
>6.9
Total
2002 0 3 17 38 25 11 3 3 100 2003 0 3 19 47 26 5 1 0 100 2004 0 3 21 45 24 5 1 1 100 2005 0 2 17 38 22 12 5 4 100 2006 0 2 22 46 21 7 2 1 100 Total 0 3 19 43 24 8 2 2 100

Rao, R., P. Barney, Q.M. Ketterings, and H. Krol (2007). St. Lawrence Soil Sample Survey (2002-2006). CSS Extension Bulletin E07-2. 35 pages.
15
6. pH
6.1 Homeowner Samples pH of homeowner samples (numbers):
<4.5
4.5-4.9
5.0-5.4
5.5-5.9
6.0-6.4
6.5-6.9
7.0-7.4
7.5-7.9
8.0-8.4
>8.4
Total
2002 0 0 2 6 11 4 10 11 1 0 45 2003 0 1 0 6 1 4 15 4 0 0 31 2004 0 1 2 6 8 8 7 3 1 0 36 2005 0 1 0 4 5 7 17 6 0 0 40 2006 0 0 0 2 3 4 9 3 2 0 23 Total 0 3 4 24 28 27 58 27 4 0 175
2002
2003
2004
2005
2006
Lowest: 5.2 4.8 4.9 4.8 5.7 Highest: 8.4 7.7 8.3 7.8 8.2 Mean: - - - - - Median: 6.8 7.1 6.5 7.0 7.1
pH of homeowner of samples (% of total number of samples):
<4.5
4.5-4.9
5.0-5.4
5.5-5.9
6.0-6.4
6.5-6.9
7.0-7.4
7.5-7.9
8.0-8.4
>8.4
Total
2002 0 0 4 13 24 9 22 24 2 0 100 2003 0 3 0 19 3 13 48 13 0 0 100 2004 0 3 6 17 22 22 19 8 3 0 100 2005 0 3 0 10 13 18 43 15 0 0 100 2006 0 0 0 9 13 17 39 13 9 0 100 Total 0 2 2 14 16 15 33 15 2 0 100

Rao, R., P. Barney, Q.M. Ketterings, and H. Krol (2007). St. Lawrence Soil Sample Survey (2002-2006). CSS Extension Bulletin E07-2. 35 pages.
16
6.2 Commercial Samples pH of commercial samples (number):
<4.5
4.5-4.9
5.0-5.4
5.5-5.9
6.0-6.4
6.5-6.9
7.0-7.4
7.5-7.9
8.0-8.4
>8.4
Total
2002 1 6 25 85 204 278 129 61 0 0 789 2003 0 0 9 53 121 156 105 35 0 0 479 2004 2 1 8 42 142 188 98 18 0 0 499 2005 0 1 10 70 113 108 24 2 0 0 328 2006 4 1 6 69 166 230 132 60 0 0 668 Total 7 9 58 319 746 960 488 176 0 0 2763
2002
2003
2004
2005
2006
Lowest: 4.1 5.0 4.0 4.8 4.1 Highest: 7.9 7.8 7.8 7.5 7.9 Mean: - - - - - Median: 6.6 6.6 6.6 6.3 6.6
pH of commercial samples (% of total number of samples):
<4.5
4.5-4.9
5.0-5.4
5.5-5.9
6.0-6.4
6.5-6.9
7.0-7.4
7.5-7.9
8.0-8.4
>8.4
Total
2002 0 1 3 11 26 35 16 8 0 0 100 2003 0 0 2 11 25 33 22 7 0 0 100 2004 0 0 2 8 28 38 20 4 0 0 100 2005 0 0 3 21 34 33 7 1 0 0 100 2006 1 0 1 10 25 34 20 9 0 0 100 Total 0 0 2 12 27 35 18 6 0 0 100
Rao, R., P. Barney, Q.M. Ketterings, and H. Krol (2007). St. Lawrence Soil Sample Survey (2002-2006). CSS Extension Bulletin E07-2. 35 pages.
17
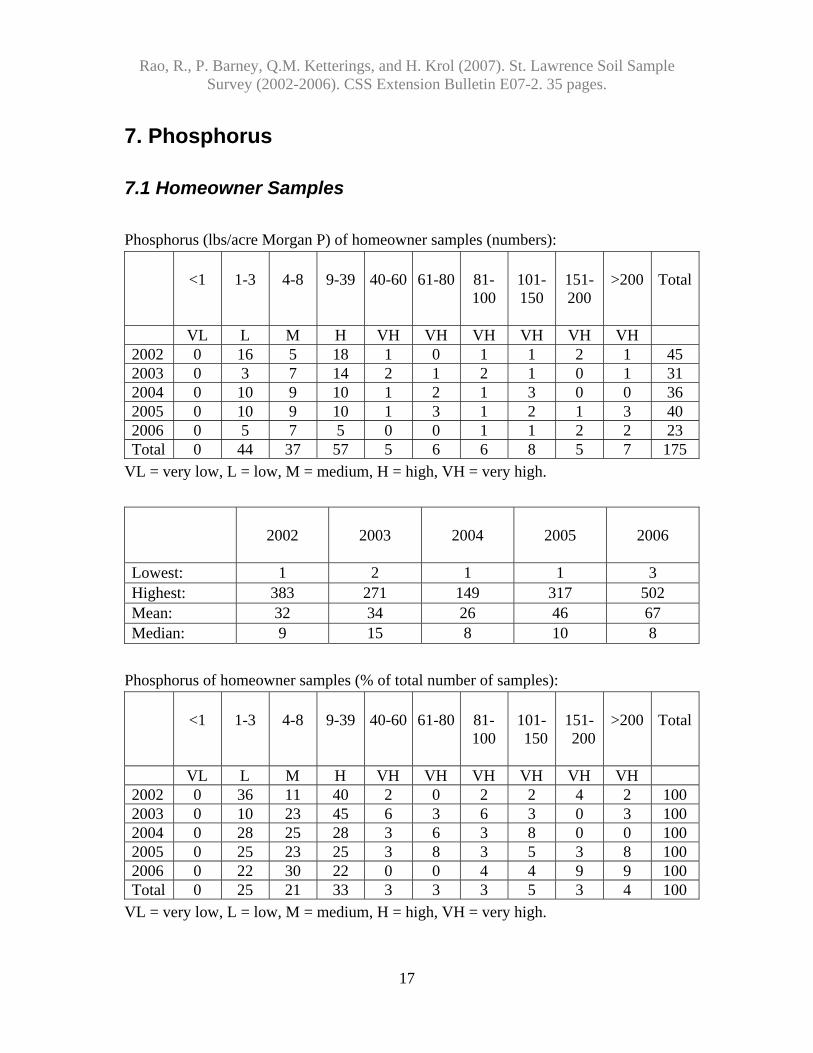
7. Phosphorus
7.1 Homeowner Samples
Phosphorus (lbs/acre Morgan P) of homeowner samples (numbers):
<1
1-3
4-8
9-39
40-60
61-80
81- 100
101-150
151-200
>200 Total
VL L M H VH VH VH VH VH VH 2002 0 16 5 18 1 0 1 1 2 1 45 2003 0 3 7 14 2 1 2 1 0 1 31 2004 0 10 9 10 1 2 1 3 0 0 36 2005 0 10 9 10 1 3 1 2 1 3 40 2006 0 5 7 5 0 0 1 1 2 2 23 Total 0 44 37 57 5 6 6 8 5 7 175
VL = very low, L = low, M = medium, H = high, VH = very high.
2002
2003
2004
2005
2006
Lowest: 1 2 1 1 3 Highest: 383 271 149 317 502 Mean: 32 34 26 46 67 Median: 9 15 8 10 8
Phosphorus of homeowner samples (% of total number of samples):
<1
1-3
4-8
9-39
40-60
61-80
81- 100
101-150
151-200
>200 Total
VL L M H VH VH VH VH VH VH 2002 0 36 11 40 2 0 2 2 4 2 100 2003 0 10 23 45 6 3 6 3 0 3 100 2004 0 28 25 28 3 6 3 8 0 0 100 2005 0 25 23 25 3 8 3 5 3 8 100 2006 0 22 30 22 0 0 4 4 9 9 100 Total 0 25 21 33 3 3 3 5 3 4 100
VL = very low, L = low, M = medium, H = high, VH = very high.
Rao, R., P. Barney, Q.M. Ketterings, and H. Krol (2007). St. Lawrence Soil Sample Survey (2002-2006). CSS Extension Bulletin E07-2. 35 pages.
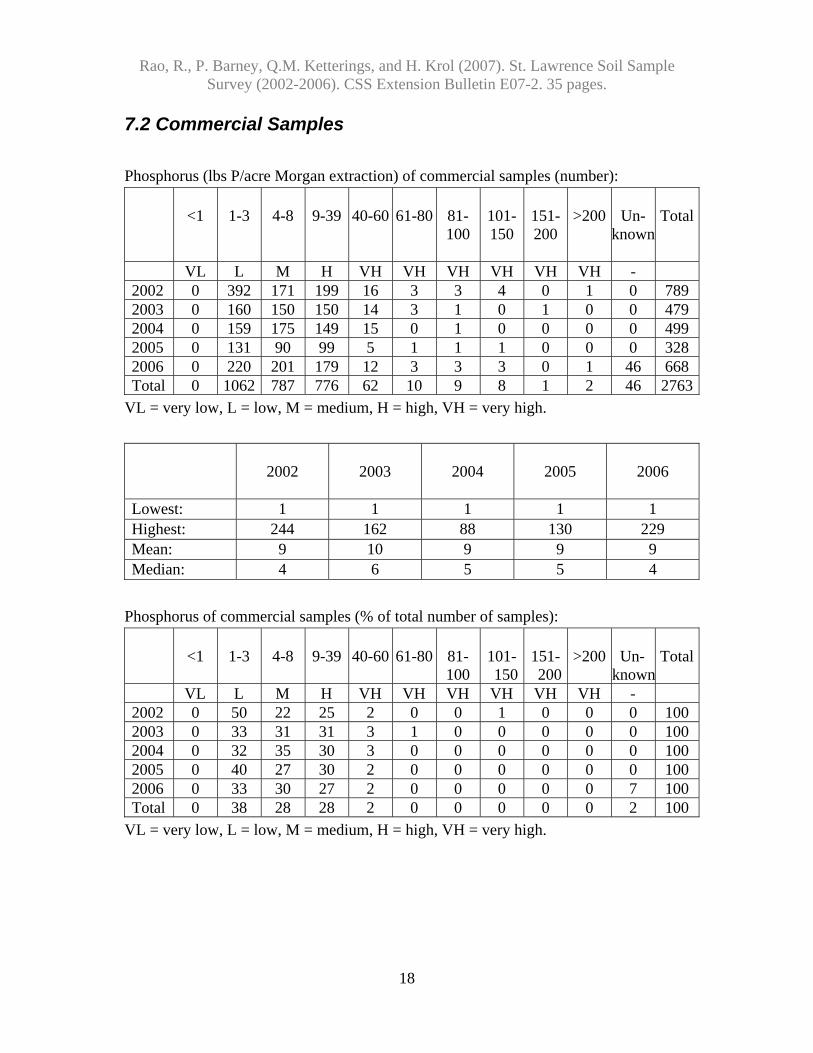
18
7.2 Commercial Samples Phosphorus (lbs P/acre Morgan extraction) of commercial samples (number):
<1
1-3
4-8
9-39
40-60
61-80
81- 100
101-150
151-200
>200
Un-
knownTotal
VL L M H VH VH VH VH VH VH - 2002 0 392 171 199 16 3 3 4 0 1 0 789 2003 0 160 150 150 14 3 1 0 1 0 0 479 2004 0 159 175 149 15 0 1 0 0 0 0 499 2005 0 131 90 99 5 1 1 1 0 0 0 328 2006 0 220 201 179 12 3 3 3 0 1 46 668 Total 0 1062 787 776 62 10 9 8 1 2 46 2763
VL = very low, L = low, M = medium, H = high, VH = very high.
2002
2003
2004
2005
2006
Lowest: 1 1 1 1 1 Highest: 244 162 88 130 229 Mean: 9 10 9 9 9 Median: 4 6 5 5 4
Phosphorus of commercial samples (% of total number of samples):
<1
1-3
4-8
9-39
40-60
61-80
81- 100
101-150
151-200
>200
Un-
knownTotal
VL L M H VH VH VH VH VH VH - 2002 0 50 22 25 2 0 0 1 0 0 0 100 2003 0 33 31 31 3 1 0 0 0 0 0 100 2004 0 32 35 30 3 0 0 0 0 0 0 100 2005 0 40 27 30 2 0 0 0 0 0 0 100 2006 0 33 30 27 2 0 0 0 0 0 7 100 Total 0 38 28 28 2 0 0 0 0 0 2 100
VL = very low, L = low, M = medium, H = high, VH = very high.
Rao, R., P. Barney, Q.M. Ketterings, and H. Krol (2007). St. Lawrence Soil Sample Survey (2002-2006). CSS Extension Bulletin E07-2. 35 pages.
19
8. Potassium
8.1 Homeowner Samples Potassium (lbs K/acre Morgan extraction) of homeowner samples (number):
Soil Management Group 1
<35 35-64 65-94 95-149 >149 Total Very Low Low Medium High Very High 2002 0 0 0 0 0 0 2003 0 0 0 0 0 0 2004 0 0 0 0 0 0 2005 0 0 0 0 0 0 2006 0 0 0 0 0 0 Total (#) 0 0 0 0 0 0 Total (%) - - - - - -
Soil Management Group 2
<40 40-69 70-99 100-164 >164 Total Very Low Low Medium High Very High 2002 0 0 1 2 1 4 2003 0 0 0 0 1 1 2004 0 1 0 0 0 1 2005 0 0 0 1 0 1 2006 0 0 0 0 0 0 Total (#) 0 1 1 3 2 7 Total (%) 0 14 14 43 29 100
Soil Management Group 3
<45 45-79 80-119 120-199 >199 Total Very Low Low Medium High Very High 2002 0 1 2 2 4 9 2003 0 0 0 0 5 5 2004 1 1 3 3 3 11 2005 0 0 0 2 1 3 2006 0 0 1 2 1 4 Total (#) 1 2 6 9 14 32 Total (%) 3 6 19 28 44 100

Rao, R., P. Barney, Q.M. Ketterings, and H. Krol (2007). St. Lawrence Soil Sample Survey (2002-2006). CSS Extension Bulletin E07-2. 35 pages.
20
Soil Management Group 4
<55 55-99 100-149 150-239 >239 Total Very Low Low Medium High Very High 2002 2 1 6 2 3 14 2003 0 5 0 3 0 8 2004 1 0 1 1 2 5 2005 0 1 0 0 3 4 2006 0 0 1 1 4 6 Total (#) 3 7 8 7 12 37 Total (%) 8 19 22 19 32 100
Soil Management Group 5
<60 60-114 115-164 165-269 >269 Total Very Low Low Medium High Very High 2002 4 6 4 1 3 18 2003 2 6 2 2 5 17 2004 0 8 2 5 4 19 2005 3 6 9 6 8 32 2006 4 2 5 2 0 13 Total (#) 13 28 22 16 20 99 Total (%) 13 28 22 16 20 100
Soil Management Group 6
<60 60-114 115-164 165-269 >269 Total Very Low Low Medium High Very High 2002 0 0 0 0 0 0 2003 0 0 0 0 0 0 2004 0 0 0 0 0 0 2005 0 0 0 0 0 0 2006 0 0 0 0 0 0 Total (#) 0 0 0 0 0 0 Total (%) - - - - - -
Rao, R., P. Barney, Q.M. Ketterings, and H. Krol (2007). St. Lawrence Soil Sample Survey (2002-2006). CSS Extension Bulletin E07-2. 35 pages.
21
Potassium classification summary for homeowner samples: Summary (#)
Very Low
Low
Medium
High
Very High
Total
2002 6 8 13 7 11 45 2003 2 11 2 5 11 31 2004 2 10 6 9 9 36 2005 3 7 9 9 12 40 2006 4 2 7 5 5 23 Grand Total 17 38 37 35 48 175
Summary (%)
Very Low
Low
Medium
High
Very High
Total
2002 13 18 29 16 24 100 2003 6 35 6 16 35 100 2004 6 28 17 25 25 100 2005 8 18 23 23 30 100 2006 17 9 30 22 22 100 Grand Total 10 22 21 20 27 100
2002
2003
2004
2005
2006
Lowest: 18 31 31 29 51 Highest: 778 705 1029 1262 631 Mean: 174 221 207 226 192 Median: 134 161 129 147 137

Rao, R., P. Barney, Q.M. Ketterings, and H. Krol (2007). St. Lawrence Soil Sample Survey (2002-2006). CSS Extension Bulletin E07-2. 35 pages.
22
8.2 Commercial Samples Potassium (lbs K/acre Morgan extraction) of commercial samples (number):
Soil Management Group 1
<35 35-64 65-94 95-149 >149 Total Very Low Low Medium High Very High 2002 3 20 27 21 12 83 2003 0 1 1 7 12 21 2004 0 1 3 8 6 18 2005 0 6 23 40 43 112 2006 0 2 5 12 9 28 Total (#) 3 30 59 88 82 262 Total (%) 1 11 23 34 31 100
Soil Management Group 2
<40 40-69 70-99 100-164 >164 Total Very Low Low Medium High Very High 2002 1 3 10 4 8 26 2003 0 0 1 8 1 10 2004 0 0 5 6 9 20 2005 0 0 4 2 1 7 2006 0 0 4 6 4 14 Total (#) 1 3 24 26 23 77 Total (%) 1 4 31 34 30 100
Soil Management Group 3
<45 45-79 80-119 120-199 >199 Total Very Low Low Medium High Very High 2002 7 60 67 53 40 227 2003 0 20 32 29 10 91 2004 0 21 45 17 5 88 2005 0 9 31 26 17 83 2006 1 29 59 63 12 164 Total (#) 8 139 234 188 84 653 Total (%) 1 21 36 29 13 100

Rao, R., P. Barney, Q.M. Ketterings, and H. Krol (2007). St. Lawrence Soil Sample Survey (2002-2006). CSS Extension Bulletin E07-2. 35 pages.
23
Soil Management Group 4
<55 55-99 100-149 150-239 >239 Total Very Low Low Medium High Very High 2002 66 129 55 47 74 371 2003 38 124 69 53 22 306 2004 50 106 79 56 37 328 2005 11 21 25 25 24 106 2006 25 144 113 61 27 370 Total (#) 190 524 341 242 184 1481 Total (%) 13 35 23 16 12 100
Soil Management Group 5
<60 60-114 115-164 165-269 >269 Total Very Low Low Medium High Very High 2002 19 28 3 8 4 62 2003 9 6 2 0 2 19 2004 13 11 11 7 0 42 2005 6 7 4 1 2 20 2006 5 26 16 24 16 87 Total (#) 52 78 36 40 24 230 Total (%) 23 34 16 17 10 100
Soil Management Group 6
<60 60-114 115-164 165-269 >269 Total Very Low Low Medium High Very High 2002 0 3 1 1 0 5 2003 0 0 0 0 0 0 2004 0 0 0 0 0 0 2005 0 0 0 0 0 0 2006 0 0 0 0 0 0 Total (#) 0 3 1 1 0 5 Total (%) 0 60 20 20 0 100

Rao, R., P. Barney, Q.M. Ketterings, and H. Krol (2007). St. Lawrence Soil Sample Survey (2002-2006). CSS Extension Bulletin E07-2. 35 pages.
24
Potassium classification summary of commercial samples. Summary (#)
Very Low
Low
Medium
High
Very High
Un-
known
Total
2002 96 243 163 134 138 15 789 2003 47 151 105 97 47 32 479 2004 63 139 143 94 57 3 499 2005 17 43 87 94 87 0 328 2006 31 201 197 166 68 5 668 Grand Total 254 777 695 585 397 55 2763
Summary (%)
Very Low
Low
Medium
High
Very High
Un-
known
Total
2002 12 31 21 17 17 2 100 2003 10 32 22 20 10 7 100 2004 13 28 29 19 11 1 100 2005 5 13 27 29 27 0 100 2006 5 30 29 25 10 1 100 Grand Total 9 28 25 21 14 2 100
2002
2003
2004
2005
2006
Lowest: 6 25 22 19 30 Highest: 1772 1031 1322 585 1612 Mean: 134 138 128 155 136 Median: 95 107 105 125 112

Rao, R., P. Barney, Q.M. Ketterings, and H. Krol (2007). St. Lawrence Soil Sample Survey (2002-2006). CSS Extension Bulletin E07-2. 35 pages.
25
9. Magnesium
9.1 Homeowner Samples Magnesium (lbs Mg/acre Morgan extraction) in homeowner samples (numbers):
<20
20-65
66-100
101-199
>199
Total
Very Low Low Medium High Very High 2002 0 1 0 4 40 45 2003 0 2 0 1 28 31 2004 0 0 3 5 28 36 2005 0 1 0 1 38 40 2006 0 1 0 3 19 23 Total 0 5 3 14 153 175
2002
2003
2004
2005
2006
Lowest: 64 49 73 55 52 Highest: 1272 1292 1516 1108 1542 Mean: 483 571 437 465 589 Median: 450 595 361 406 507
Magnesium of homeowner samples (% of total number of samples):
<20
20-65
66-100
101-199
>199
Total
Very Low Low Medium High Very High 2002 0 2 0 9 89 100 2003 0 6 0 3 90 100 2004 0 0 8 14 78 100 2005 0 3 0 3 95 100 2006 0 4 0 13 83 100 Total 0 3 2 8 87 100

Rao, R., P. Barney, Q.M. Ketterings, and H. Krol (2007). St. Lawrence Soil Sample Survey (2002-2006). CSS Extension Bulletin E07-2. 35 pages.
26
9.2 Commercial Samples Magnesium (lbs Mg/acre Morgan extraction) of commercial samples (number):
<20
20-65
66-100
101-199
>199
Total
Very Low Low Medium High Very High 2002 5 15 12 34 723 789 2003 0 7 4 30 438 479 2004 0 5 11 17 466 499 2005 0 4 7 23 294 328 2006 3 5 8 23 629 668 Total 8 36 42 127 2550 2763
2002
2003
2004
2005
2006
Lowest: 5 25 27 31 12 Highest: 2377 2364 1504 2042 4570 Mean: 633 566 564 620 640 Median: 592 527 530 531 567
Magnesium content of commercial samples (% of total number of samples):
<20
20-65
66-100
101-199
>199
Total
Very Low Low Medium High Very High 2002 1 2 2 4 92 100 2003 0 1 1 6 91 100 2004 0 1 2 3 93 100 2005 0 1 2 7 90 100 2006 0 1 1 3 94 100 Total 0 1 2 5 92 100

Rao, R., P. Barney, Q.M. Ketterings, and H. Krol (2007). St. Lawrence Soil Sample Survey (2002-2006). CSS Extension Bulletin E07-2. 35 pages.
27
10. Iron
10.1 Homeowner Samples Iron (lbs Fe/acre Morgan extraction) of homeowner samples: Total number of samples: Percentages:
0-49
>49
Total
0-49
>49
Total
Normal Excessive Normal Excessive 2002 41 4 45 91 9 100 2003 31 1 32 97 3 100 2004 34 2 36 94 6 100 2005 35 5 40 88 13 100 2006 23 0 23 100 0 100 Total 164 12 176 93 7 100
2002
2003
2004
2005
2006
Lowest: 1 2 2 1 2 Highest: 134 74 61 204 44 Mean: 17 10 13 16 12 Median: 7 6 8 8 7

Rao, R., P. Barney, Q.M. Ketterings, and H. Krol (2007). St. Lawrence Soil Sample Survey (2002-2006). CSS Extension Bulletin E07-2. 35 pages.
28
10.2 Commercial Samples Iron (lbs Fe/acre Morgan extraction) of commercial samples: Total number of samples: Percentages:
0-49
>49
Total
0-49
>49
Total
Normal Excessive Normal Excessive 2002 754 35 789 96 4 100 2003 454 25 479 95 5 100 2004 471 28 499 94 6 100 2005 291 37 328 89 11 100 2006 639 29 668 96 4 100 Total 2609 154 2763 94 6 100
2002
2003
2004
2005
2006
Lowest: 1 1 1 2 1 Highest: 635 133 346 294 551 Mean: 15 15 16 25 16 Median: 7 8 9 16 8

Rao, R., P. Barney, Q.M. Ketterings, and H. Krol (2007). St. Lawrence Soil Sample Survey (2002-2006). CSS Extension Bulletin E07-2. 35 pages.
29
11. Manganese
11.1 Homeowner Samples Manganese (lbs Mn/acre Morgan extraction) of homeowner samples: Total number of samples: Percentages:
0-99
>99
Total
0-99
>99
Total
Normal Excessive Normal Excessive 2002 44 1 45 98 2 100 2003 31 1 32 97 3 100 2004 34 2 36 94 6 100 2005 40 0 40 100 0 100 2006 22 1 23 96 4 100 Total 171 5 176 97 3 100
2002
2003
2004
2005
2006
Lowest: 4 4 4 4 7 Highest: 115 686 118 53 102 Mean: 24 46 30 23 24 Median: 20 23 22 21 20

Rao, R., P. Barney, Q.M. Ketterings, and H. Krol (2007). St. Lawrence Soil Sample Survey (2002-2006). CSS Extension Bulletin E07-2. 35 pages.
30
11.2 Commercial Samples Manganese (lbs Mn/acre Morgan extraction) of commercial samples: Total number of samples: Percentages:
0-99
>99
Total
0-99
>99
Total
Normal Excessive Normal Excessive 2002 788 1 789 100 0 100 2003 479 0 479 100 0 100 2004 496 3 499 99 1 100 2005 327 1 328 100 0 100 2006 666 2 668 100 0 100 Total 2756 7 2763 100 0 100
2002
2003
2004
2005
2006
Lowest: 2 2 2 4 2 Highest: 108 98 223 102 174 Mean: 20 24 23 25 24 Median: 19 22 19 23 22
Rao, R., P. Barney, Q.M. Ketterings, and H. Krol (2007). St. Lawrence Soil Sample Survey (2002-2006). CSS Extension Bulletin E07-2. 35 pages.
31
12. Zinc
12.1 Homeowner Samples Zinc (lbs Zn/acre Morgan extraction) of homeowner samples: Total number of samples: Percentages:
<0.5
0.5-1.0
>1
Total
<0.5
0.5-1.0
>1
Total
Low Medium High Low Medium High 2002 0 0 45 45 0 0 100 100 2003 0 0 31 31 0 0 100 100 2004 0 1 35 36 0 3 97 100 2005 0 7 33 40 0 18 83 100 2006 3 3 17 23 13 13 74 100 Total 3 11 161 175 2 6 92 100
2002
2003
2004
2005
2006
Lowest: 1.2 1.2 0.8 0.5 0.4 Highest: 37.4 124.7 92.0 45.1 675.6 Mean: 6.3 15.7 13.0 8.4 35.6 Median: 3.6 5.2 6.7 3.1 3.7

Rao, R., P. Barney, Q.M. Ketterings, and H. Krol (2007). St. Lawrence Soil Sample Survey (2002-2006). CSS Extension Bulletin E07-2. 35 pages.
32
12.2 Commercial Samples Zinc (lbs Zn/acre Morgan extraction) of commercial samples: Total number of samples: Percentages:
<0.5
0.5-1.0
>1
Total
<0.5
0.5-1.0
>1
Total
Low Medium High Low Medium High 2002 7 96 686 789 1 12 87 100 2003 8 106 365 479 2 22 76 100 2004 4 134 361 499 1 27 72 100 2005 5 45 278 328 2 14 85 100 2006 26 131 511 668 4 20 76 100 Total 50 512 2201 2763 2 19 80 100
2002
2003
2004
2005
2006
Lowest: 0.3 0.2 0.3 0.1 0.1 Highest: 188.0 500.3 28.7 161.4 196.2 Mean: 3.4 3.5 2.3 4.0 2.6 Median: 1.9 1.7 1.5 1.9 1.5
Rao, R., P. Barney, Q.M. Ketterings, and H. Krol (2007). St. Lawrence Soil Sample Survey (2002-2006). CSS Extension Bulletin E07-2. 35 pages.
33
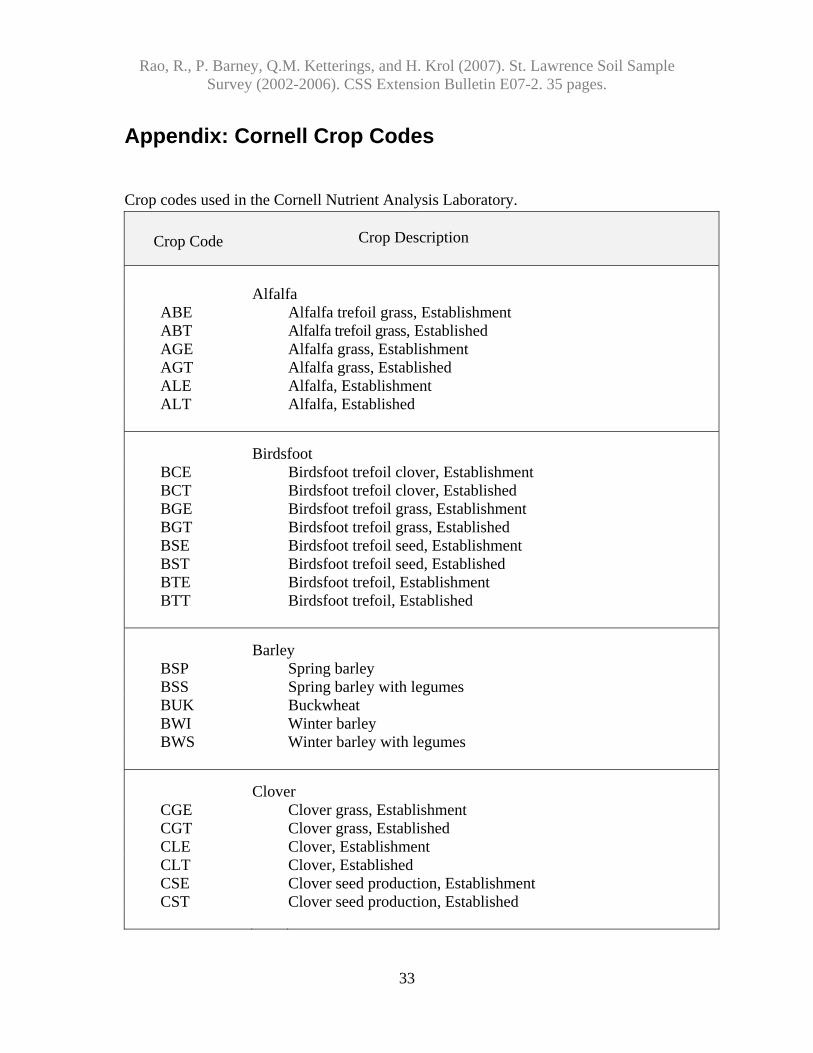
Appendix: Cornell Crop Codes
Crop codes used in the Cornell Nutrient Analysis Laboratory.
Crop Code
Crop Description
Alfalfa
ABE Alfalfa trefoil grass, Establishment ABT Alfalfa trefoil grass, Established AGE Alfalfa grass, Establishment AGT Alfalfa grass, Established ALE Alfalfa, Establishment ALT Alfalfa, Established
Birdsfoot
BCE Birdsfoot trefoil clover, Establishment BCT Birdsfoot trefoil clover, Established BGE Birdsfoot trefoil grass, Establishment BGT Birdsfoot trefoil grass, Established BSE Birdsfoot trefoil seed, Establishment BST Birdsfoot trefoil seed, Established BTE Birdsfoot trefoil, Establishment BTT Birdsfoot trefoil, Established
Barley
BSP Spring barley BSS Spring barley with legumes BUK Buckwheat BWI Winter barley BWS Winter barley with legumes
Clover
CGE Clover grass, Establishment CGT Clover grass, Established CLE Clover, Establishment CLT Clover, Established CSE Clover seed production, Establishment CST Clover seed production, Established

Rao, R., P. Barney, Q.M. Ketterings, and H. Krol (2007). St. Lawrence Soil Sample Survey (2002-2006). CSS Extension Bulletin E07-2. 35 pages.
34
Crop Code
Crop Description
Corn
COG Corn grain COS Corn silage
Grasses, pastures, covercrops
CVE Crownvetch, Establishment CVT Crownvetch, Established GIE Grasses intensively managed, Establishment GIT Grasses intensively managed, Established GRE Grasses, Establishment GRT Grasses, Established PGE Pasture, Establishment PGT Pasture improved grasses, Established PIE Pasture intensively grazed, Establishment PIT Pasture intensively grazed, Established PLE Pasture with legumes, Establishment PLT Pasture with legumes, Established PNT Pasture native grasses RYC Rye cover crop RYS Rye seed production TRP Triticale peas
Small grains
MIL Millet OAS Oats seeded with legume OAT Oats SOF Sorghum forage SOG Sorghum grain SOY Soybeans SSH Sorghum sudan hybrid SUD Sudangrass WHS Wheat with legume WHT Wheat
Others
ALG APP ATF BDR/DND
Azalea Apples Athletic field Beans-dry

Rao, R., P. Barney, Q.M. Ketterings, and H. Krol (2007). St. Lawrence Soil Sample Survey (2002-2006). CSS Extension Bulletin E07-2. 35 pages.
35
Crop Code
Crop Description
BLU CEM FAR FLA GRA GEN HRB IDL LAW MIX/MVG PER PRK POT/PTO PUM ROD ROS RSF RSP RSS SAG SQW STE STR STS SUN SWC TOM TRE TRF TRT
Blueberries Cemetery Fairway Flowering annuals Grapes Green Herbs Idle land Lawn Mixed vegetables Perennials Park Potatoes Pumpkins Roadside Roses Raspberries, Fall Raspberries (homeowners) Raspberries, Summer Ornamentals adapted to pH 6.0 to 7.5 Squash, Winter Strawberries, Ever Strawberries (homeowners) Strawberries, Spring Sunflowers Sweet corn Tomatoes Christmas trees, Established Turf Christmas trees, Topdressing