
ST. GEORGE W ATER POLLUTION CONTROL PLANT … · Scenario A: straight aerobic bioreactor without...
79
ST. GEORGE WATER POLLUTION CONTROL PLANT OPTIMIZATION STUDY TECHNICAL MEMORANDUM TREATMENT PROCESS MODELING January 2012 Our File: 110-003 GAMSBY AND MANNEROW LIMITED CONSULTING PROFESSIONAL ENGINEERS GUELPH – OWEN SOUND – KITCHENER – LISTOWEL – EXETER
Transcript of ST. GEORGE W ATER POLLUTION CONTROL PLANT … · Scenario A: straight aerobic bioreactor without...

ST. GEORGE WATER POLLUTION CONTROL PLANTOPTIMIZATION STUDY
TECHNICAL MEMORANDUM
TREATMENT PROCESS MODELING
January 2012Our File: 110-003
GAMSBY AND MANNEROW LIMITEDCONSULTING PROFESSIONAL ENGINEERS
GUELPH – OWEN SOUND – KITCHENER – LISTOWEL – EXETER

110-003 Page i
ST. GEORGE WPCP TECHNICAL MEMORANDUM – TREATMENT PROCESS MODELING
TABLE OF CONTENTS
1.0 INTRODUCTION .............................................................................................................................. 1
2.0 DESCRIPTION OF EXISTING TREATMENT PLANT .................................................................. 1
3.0 MODEL DEVELOPMENT ................................................................................................................ 2
3.1 GENERAL ......................................................................................................................................... 2 3.2 MODEL CALIBRATION ...................................................................................................................... 3 3.3 MODEL VERIFICATION ..................................................................................................................... 4 3.4 MODEL CALIBRATION SUMMARY .................................................................................................... 6
4.0 PROCESS MODELING RESULTS................................................................................................... 6
4.1 ALTERNATIVE 1 ............................................................................................................................... 8 4.1.1 Effluent Quality ...................................................................................................................... 8 4.1.2 Conceptual Design Considerations ......................................................................................... 8
4.2 ALTERNATIVE 2 ............................................................................................................................... 9 4.2.1 Effluent Quality .................................................................................................................... 10 4.2.2 Conceptual Design Considerations ....................................................................................... 10
5.0 SUMMARY ...................................................................................................................................... 11
REFERENCES ......................................................................................................................................... 12
LIST OF TABLES Table 1 Model Verification Data Table 2 Settling Parameters Averages for the Month of April (2007 to 2010) Table 3 Process Modeling Results for the Existing Plant Table 4a Process Modeling Results for Alternative 1 (Average Conditions) – Effluent Quality Table 4b Process Modeling Results for Alternative 1 (Average Conditions) – Sludge Management Table 5a Process Modeling Results for Alternative 1 at Max. Plant Capacity (Average Conditions)
– Effluent Quality Table 5b Process Modeling Results for Alternative 1 at Max. Plant Capacity (90th Percentile
Conditions) – Effluent Quality Table 6a Process Modeling Results for Alternative 2 (Average Conditions) – Effluent Quality Table 6b Process Modeling Results for Alternative 2 (Average Conditions) – Sludge Management Table 7a Process Modeling Results for Alternative 2 (90th Percentile Conditions) – Effluent
Quality Table 7b Process Modeling Results for Alternative 2 (90th Percentile Conditions) – Sludge
Management
LIST OF FIGURES Figure 1 BioWin® Schematic Flow Diagram of St. George WPCP Model Figure 2 BioWin® Schematic Flow Diagram of Proposed MLE Process for the St. George WPCP
110-003 Page ii
ST. GEORGE WPCP TECHNICAL MEMORANDUM – TREATMENT PROCESS MODELING
APPENDICES Appendix “A” Calibration Tables for Scenario A
Appendix “B” Modeling Results for Scenario A
Appendix “C” Calibration Tables for Scenario B
Appendix “D” Modeling Results for Scenario B
Appendix “E” Process Modeling Results
ST. GEORGE WATER POLLUTION CONTROL PLANTOPTIMIZATION STUDY
TECHNICAL MEMORANDUMTREATMENT PROCESS MODELING
1.0 INTRODUCTION
Gamsby and Mannerow Ltd. (G&M) together with process specialists from Conestoga-Roversand Associates (CRA), University of Western Ontario (UWO), and Huber EnvironmentalConsulting (HEC) were retained by the St. George Landowners’ Group to complete anOptimization Study of the St. George Water Pollution Control Plant (WPCP). This TechnicalMemorandum presents the results of computer-based treatment process modeling that wasundertaken as part of the assignment. This Memo will form part of the final Optimization Studydocument with other Technical Memoranda prepared by the project team covering other aspectsof the overall Study.
The St. George WPCP is located at 43 Victor Boulevard in the Village of St. George and servesthe community of St. George by means of a gravity collection system. The plant serves anestimated population of 2,300 people. The community is primarily residential and consequentlythe waste stream from the community is considered to be typical municipal domestic wastewater.The plant is owned by The County of Brant and operated under contract by the Ontario CleanWater Agency (OCWA).
2.0 DESCRIPTION OF EXISTING TREATMENT PLANT
The St. George WPCP is an extended aeration activated sludge plant with a rated hydrauliccapacity of 1,300 m3/d and a design peak flow rate of 3,412 m3/d. The plant operates underMinistry of Environment Certificate of Approval No. 941 5-6CQKH5 dated June 24, 2005.
The original plant was constructed in 1981 as a package extended aeration plant with a ratedhydraulic capacity of 1,063 m3/d. Main plant processes include grit removal, comminution,aeration, coagulant feed system for phosphorous removal, secondary clarification, disinfection bychlorine, tertiary media filtration, and sludge digestion. The plant also includes a back-up dieselgenerator. The effluent receiving stream is an unnamed tributary of Fairchild Creek. The plantwas rerated in 2005 to a capacity of 1,300 m3Jd, as a result of upgrades that included new finebubble diffusers, a third positive displacement air blower, inlet channel grinder, conversion fromgas chlorination to liquid sodium hypochlorite, dechlorination facilities, and a larger aerobicdigestion facility. The original aerobic digester was converted to a sludge holding tank.
people engineering env!ronmentsGamsby and Manrierow Limited • Guelph, Owen Sound, Listowel, Kitchener, Exeter
650 Woodavri Road’ 8[ock C, Unit 2 Gueiph, ON NI K 188 519-824-8 50 fax 5 9-954-3Q39 wz.gamsbyron
Ganisby and Mannerow

110-003 Page 2
ST. GEORGE WPCP TECHNICAL MEMORANDUM – TREATMENT PROCESS MODELING
A Process Capacity Assessment conducted by G&M in 2009 concluded that based on historical data, the existing plant (without any improvements) can achieve reasonable effluent quality at flows up to an average processing capacity of 1,000 m3/d. The plant is currently running at 86% of the estimated capacity (66% of the rated capacity); therefore, there is limited remaining capacity to meet future servicing requirements for the St. George catchment area (estimated to be ~ 4,000 m3/day). Consequently, one of the primary objectives of the overall Optimization Study is to evaluate feasible interim upgrades to restore plant capacity to 1,300 m3/d and ultimate plant expansion configurations. Detailed process modeling was therefore conducted to evaluate various alternatives for optimization of the existing plant, and to evaluate alternatives for plant expansion to accommodate ultimate design flows.
3.0 MODEL DEVELOPMENT 3.1 GENERAL
A detailed sampling program was conducted in April 2010 at the plant that generally involved sampling and analysis of wastewater at several locations throughout the treatment process for a comprehensive list of parameters. The program included daily sampling for 30 days plus discrete hourly sampling for a 72-hour period. Results from the sampling program are presented in a separate Technical Memorandum. Analytical data from the sampling program was used for calibration and modeling using BioWin® (3.0) software developed by Envirosim Associates Ltd. (Burlington, ON, Canada). The St. George WPCP was modeled using basic reactors available in BioWin® (i.e. influent, aerobic reactor, ideal clarifier, aerobic digester, clarifiers, effluent, chemical feed system, and sludge wastage effluent). An overall plant process flow schematic used for process modeling is shown below in Figure 1. Although the plant does not operate at a fixed solids retention time (SRT), with sludge wastage controlled primarily by both the quantity of sludge in the aerobic digester and aeration tank mixed-liquor suspended solids (MLSS), the SRT was estimated manually at around 28 days. Part of the model calibration involved testing SRTs in the range of 15 to 25 days.
Figure 1. BioWin® Schematic Flow Diagram of St. George WPCP Model

110-003 Page 3
ST. GEORGE WPCP TECHNICAL MEMORANDUM – TREATMENT PROCESS MODELING
3.2 MODEL CALIBRATION Plant historical records along with data obtained from the detailed sampling program, as discussed above, were analyzed and used for BioWin model calibration. The purpose of the calibration was to confirm the existing data for consistency, establish details of wastewater characteristics, and confirm biological growth and decay parameters. The model was calibrated for various COD fractionations to represent the actual influent wastewater characteristics at the St. George WPCP. The calibration was then validated by matching steady state simulation predictions with averages of plant historical operating records. Model calibration focused primarily on matching the clarifier effluent characteristics since filtration in the model only removes particulate contaminants, as well as the various biomass concentrations (as TSS) in the aeration tank and return activated sludge (RAS) primarily due to lack of reliable information on the sludge holding tank (thickener) decant and thickened waste activated sludge (WAS) going to the aerobic digester. In addition, thickener performance in terms of solids capture and flow rates was set to match the hauled sludge average daily flow rates for 2010 of 3.97 m3/d. Plant records indicate that historically about 17.8 kg Fe2+/d (iron in the form of ferric chloride) were added at the end of the aeration tank for phosphorus removal. With such a high chemical dose, not only is the effluent soluble phosphorus (P) too low (0.01 mg/L modeled versus 0.1 to 0.3 observed) but also the volatile fraction of biomass was unrealistically low at 47 percent. Thus, in all calibration scenarios, the ferric chloride dose was set at 21 kg/d, corresponding to an iron dose of 7.2 kg Fe2+/d, about 40 percent of the plant’s dose. This suggests that the chemical dispersion and mixing with the wastewater may not be complete.
It was also apparent from analysis of the April 2010 monitoring data that about 15 percent to 20 percent of influent Total Kjeldahl Nitrogen (TKN) is lost through nitrification/denitrification. This prompted thorough evaluation of the oxidation-reduction potential (ORP) and dissolved oxygen (DO) data. Recognizing that denitrification can occur at DO concentrations of <0.5 mg/L and ORP <50 mV, the DO and ORP at the aeration tank inlet, outlet and average (of both locations) were analyzed. On average, the DO was less than 0.5 mg/L, 46 percent of the time (43 percent at the inlet and 51 percent at the outlet). Similarly average ORP was less than 50 mV, 37 percent of the time (36 percent at the inlet and 38 percent at the outlet). Thus the modeling effort evaluated two scenarios:
Scenario A: straight aerobic bioreactor without denitrification, and Scenario B: an aerobic bioreactor with anoxic condition for denitrification (i.e. DO of 0
mg/L, 50 percent of the time, with an overall cycle time of 10 hours). Detailed calibration tables and modeling results for the existing plant are appended to this report as follows.
Appendix “A” Calibration Tables for Scenario A Appendix “B” Modeling Results for Scenario A Appendix “C” Calibration Tables for Scenario B Appendix “D” Modeling Results for Scenario B
It is noted that in order to ensure proper fractionation since the influent specifier in BioWin calculates volatile suspended solids (VSS) and BOD from the COD fractionation, both sets of calibration tables show the comparison between modeled influent and measured influent

110-003 Page 4
ST. GEORGE WPCP TECHNICAL MEMORANDUM – TREATMENT PROCESS MODELING
characteristics as appendix tables “1” (i.e. Tables A-1 in Appendix “A” and B-1 in Appendix “C’ are identical). Scrutiny of the summarized data in Appendices “B” and “D” reveals the following:
• The calibrated model at an SRT of 24 days matches the effluent characteristics very well (excluding nitrates without denitrification) with all parameters well within the average + standard deviation of the experimental data.
• The various biomass streams such as RAS and sludge holding tank decant were also well predicted. Even the thickened WAS TSS of 20,600 mg/L closely matches the one measured sample on July 29, 2010 of 22,000 mg/L.
• Upon comparing the calibration with and without denitrification, it is apparent that the only major difference is effluent nitrates which decreased by about 10 percent to 27 mg/L as opposed to the 15 percent estimated based on mass balances. This is due to continuous sludge decant assumed in the model which supplies organic nitrogen (N) and ammonia (NH3) continuously as opposed to actual operating practice at the plant which involves manually controlled decant weekday mornings for a period of 2 to 3 hours.
• The volatile fraction of biomass predicted by the model is 60 percent lower than the measured 70 percent. This is primarily due to the long SRT contributing additional inserts due to biomass decay, which increase the concentration of inert volatile solids in the system. Consequently, due to under-prediction of VSS, the model under-predicted the total COD of various sludge streams, and also TKN in the aeration tank.
• The estimated WAS flow rate of 14 m3/d does not agree with the 24 m3/d (720 m3/month) indicated by plant records.
• The model is predicting that the 280-m3 aerobic digester would achieve 20 percent volatile solids destruction efficiency. The limited experimental data shows no significant difference between the thickened WAS and digested sludge characteristics during the sampling period of April 2010.
3.3 MODEL VERIFICATION
The available historical data include influent and final effluent general characteristics as well as operational data. Results of model verification data for 2007 to 2009 are presented in Table 1. It is noted that the model effluent represents the clarifier effluent characteristics. The calibrated model with denitrification was used for verification of historical performance. As apparent from Table 1 for 2007, although the model predicted MLSS and sludge wastage accurately, effluent NH3 was significantly under-predicted while nitrates (NO3
-) and nitrites (NO2-) were significantly
over-predicted. It is noted that effluent NH3 in 2007 was significantly above the averages for 2008 and 2009. The variability, as reflected by the coefficient of variation (i.e. standard deviation divided by mean), was 217 percent for effluent NH3 and 61 percent for effluent nitrates-plus-nitrites in 2007. For 2008 and 2009, there is a major discrepancy between the aeration tank MLSS and sludge haulage data, and accordingly each of the two parameters was fitted separately. In general, effluent NH3, nitrates-plus-nitrites, and BOD were accurately predicted for 2008 and 2009. The model over prediction of effluent TSS is due to lack of filtration and is expected. However, it is evident that the solids balance is an underlying problem, as the MLSS and handled sludge volume varied by close to 100 percent with fitting each parameter individually. It is noteworthy that the sludge haulage in 2008 and 2009 were much greater (30 percent to 70 percent) than 2007 and 2010 despite same influent characteristics.

110-003 Page 5
ST. GEORGE WPCP TECHNICAL MEMORANDUM – TREATMENT PROCESS MODELING
In order to validate the historical 2007 to 2009 data, a calibrated settling velocity, adjusted using the experimental sludge volume index shown below in Table 2 as a function of the maximum zone settling velocity (Vo) and settling coefficient K as shown in equations (1) and (2) [Ozinsky and Ekama, 1995] , was used to estimate settling parameters.
(1)
(2)
Table 2 generally shows the annual average SVIs for 2007-2010, and clearly indicate that 2008 and 2009 were both characterized by poor settling, which may rationalize the relatively higher hauled sludge volumes yet contradicts the observed high MLSS concentrations. Table 1. Model Verification Data
Parameter
April 2007 April 2008 April 2009
Exp. Calibrated
Model Prediction
Exp.
Calibrated Model
Prediction Exp.
Calibrated Model
Prediction (a) (b) (a) (b)
Influent Flow (m3/d) 855 855 985 985 985 984 984 984 TSS (mg/L) 225±62* 188 162±102 145 145 119±130 140 140
BOD (mg/L) 134±19 155 131±102 133 133 148±69 156 156 TKN (mg/L) 35±4 35 22±7 22 22 26±4 26 26
TP (mg/L) 6±1 6 4±1 4 4 4±1 4 4 pH 8 8 8 8 8 8 8 8
Operational MLSS (mg/L) 4349±1331 4297 4680±659 4283 2561 476±366 4639 2543
SRT (day) - 22 - 27 15 - 27 14 Thickener Solids Capture
Efficiency (%) - 65 - 65 65 - 65 65
Sludge Haulage Flow Rate (m3/d)
4.7 4.6 6.1 3.5 6.2 6.9 3.4 6.7
Effluent TSS (mg/L) 3.3±2.8 3.7 1.9±0.5 5.3 4.9 1.9±0.9 5.2 4.8
BOD (mg/L) 12±7.1 1.4 3.5±0.7 1.5 1.9 2.0±0.1 1.7 2.0 NH3 (mg/L) 2.4±5.2 0.4 0.4±0.4 0.3 0.4 0.2±0.1 0.4 0.4
NO2 + NO3 (mg/L) 12.7±7.8 23.6 16.5±3.7 12.8 11.7 16.9±4.1 15.4 14.3 pH 7.2 6.8 7.1 7.0 7.0 7.4 6.9 6.9
Notes: *Average ± STD Model calibration and verification against actual historical operating data (Exp.) involved efforts to match aeration tank MLSS concentration and sludge haulage quantities as closely as possible between the model and actual operating data. This was achieved for 2007 data as indicated in the above table at an SRT of 22 days. However, there was a discrepancy when comparing operating data for 2008 and 2009. Consequently, two different calibration scenarios were tested, one with an SRT of 27 days which predicted MLSS well but underestimated sludge haulage flow by ~ 50

110-003 Page 6
ST. GEORGE WPCP TECHNICAL MEMORANDUM – TREATMENT PROCESS MODELING
percent, and another scenario with an SRT of 14 to 15 days which predicted sludge haulage flow well but underestimated MLSS by ~ 50 percent. Table 2. Average Settling Parameters for the Month of April (2007 to 2010)
Year Vo (m/day) K (m3/kg) SVI
2007 181.5 0.3 73
2008 152.6 0.4 178
2009 155.7 0.4 166
2010 183.9 0.3 65 3.4 MODEL CALIBRATION SUMMARY
Based on the above observations, the calibrated model can be used to model various upgrade scenarios. Particular attention should be paid to using the model for inorganic solids determination resulting from chemical addition. Any upgrades to the sludge management system must be based on sludge quantities across a relatively wide range of SRTs as the plant has experienced sludge bulking in the past, not necessarily the long SRT that the plant is currently operating at. The aerobic digester performance could not be modeled well, indicating that the effective digester volume may be less than 240 m3 since the digester is filled intermittently and is not operating as a fixed volume reactor.
4.0 PROCESS MODELING RESULTS
The calibrated model was used to determine the maximum capacity of the existing plant. Given the condition of the existing filters, it was determined that the maximum solids concentration to the filters would be 10 mg/L. The existing plant was modelled at flow rates of 1,000 m3/d and 1,100 m3/d, and the results are summarized in Table 3. As shown in Table 3, the maximum capacity for the existing plant is 1,100 m3/d as shown by effluent TSS concentration of >10 mg/L. The results of process modeling verified that the maximum capacity for the existing plant is 1,100 m3/d above which the solids loading rate to the clarifier increases and results in high (<10 mg/L) TSS in the effluent, thus strongly compromising the ability to meet the effluent TSS criteria. The calibrated model was also used to simulate the performance of a retrofitted plant with a Biological Nutrient Removal (BNR) process (Alternative 1) as well as a newly built BNR plant (Alternative 2). The results of process modeling were used to size the process units, estimate the sludge production rate and storage capacity, and chemical dose. Modeling results can also be used as a basis for rough budget estimates for full scale implementation. Both the liquid and solids processes at the St. George WPCP were modeled for the retrofitted plant with the Modified Ludzack Ettinger (MLE) or Anoxic-Aerobic (AO) Process (Alternative 1) as well as the newly built MLE plant (Alternative 2). The components involved in the retrofitted plant included an addition of a new 350 m3 anoxic tank and a Waste Activated Sludge (WAS) thickener to the existing plant. The newly built MLE plant included rectangular anoxic and aerobic tanks, circular clarifier, WAS thickener, and the existing aerobic sludge digester. An overall process flow schematic used for modeling of the MLE process for the St. George WPCP is provided in Figure 2.

110-003 Page 7
ST. GEORGE WPCP TECHNICAL MEMORANDUM – TREATMENT PROCESS MODELING
Figure 2. BioWin® Schematic Flow Diagram of Proposed MLE Process for the St. George WPCP
The design raw wastewater characteristics, which represent the average observed during the April 2010 sampling program (described elsewhere), were as follows:
TCOD = 300 mg/L SCOD = 85 mg/L
BOD-5 = 140 mg/L SBOD-5 = 45 mg/L
VSS = 135 mg/L TSS = 155 mg/L TKN = 38 mg/L
STKN = 32 mg/L TP = 4.7 mg/L SP = 3.4 mg/L
Alkalinity (as CaCO3) = 400 mg/L The modeling effort evaluated three scenarios for Alternative 1 at flow rates of 1,100 m3/d, 1,300 m3/d, and 1,500 m3/d, and three scenarios for Alternative 2 at flow rates of 1,600 m3/d, 2,600 m3/d and 3,600 m3/d. Sensitivity analysis was conducted to determine the maximum plant capacity for Alternative 1. The process modeling for Alternative 1 was conducted at the average design concentrations while both average and the 90th percentile concentrations were considered in modeling of Alternative 2. The 90th percentile concentrations are summarized in Table A-1. For both alternatives, methanol was added as a carbon source to achieve higher levels of denitrification. Detailed process modeling results are discussed in Sections 4.1 for Alternative 1 and Section 4.2 for Alternative 2. The detailed modeling reports for the flow rates of 1,500 m3/d (retrofitted plant) and 3,600 m3/d (new plant) are attached in Appendix “E”. Tables 4a and 4b summarize the effluent quality and sludge management for the retrofitted plant at average design concentrations (Alternative 1), respectively. Tables 5a and 5b present the effluent quality management results for the maximum capacity of the existing plant after conversion to BNR Alternative 1 at average and 90th percentile design concentrations, respectively. Tables 6a and 6b, and 7a and 7b summarize the effluent quality and sludge management results for Alternative 2 at the average and 90th percentile concentrations, respectively.

110-003 Page 8
ST. GEORGE WPCP TECHNICAL MEMORANDUM – TREATMENT PROCESS MODELING
4.1 ALTERNATIVE 1 4.1.1 Effluent Quality
As noted above, the model-predicted effluent characteristics are presented in Table 4a for Alternative 1. The plant will produce an effluent quality which meets all of the effluent quality criteria stipulated in the current Ministry of the Environment (MOE) Certificate of Approval (C of A) 9415-6CQKH5. For all scenarios presented in Table 4a (plant flow rates of 1,100 m3/d, 1300 m3/d, and 1500 m3/d), clarified effluent NH3 concentration is < 0.6 mg/L, TP < 0.2 mg/L, TN < 10 mg/L, and TSS and BOD concentrations are < 5 mg/L.
4.1.2 Conceptual Design Considerations
Sludge Production By retrofitting an existing plant with the MLE process, the biological processing capacity of the plant increases as a result of the introduction of an anoxic tank, reduced sludge yield, and improved sludge settling characteristics. Considering that the overall sludge management capability at the plant is limited, application of the MLE process to reduce the sludge yield is an attractive alternative for the St. George WPCP. Based on plant records, the St. George WPCP currently produces approximately 720 m3/month (24 m3/d) WAS at the plant hydraulic flow rate of 830 m3/d as indicated by the operator in a teleconference. The results of modeling in terms of sludge management are presented in Table 4b for Alternative 1 and Tables 5b and 6b for Alternative 2 at average design and 90th percentile concentrations. Process modeling for the retrofitted plant (Alternative 1) operating at an SRT of 15 days treating 1,100 m3/d, 1,300 m3/d, and 1,500 m3/d at 15oC, indicated that the plant will produce approximately 6.54 m3/d of WAS which is significantly less than the WAS generation for the current plant. It should be noted that under current conditions, the calibrated model estimates that the total dry solids production of the Extended Aeration plant, prior to thickening and digestion, based on a WAS flow of 14 m3/d and WAS solids concentration of 8,740 mg/L (Tables A-4a and B-4a) is 122 kgTSS/d, corresponding to an overall yield of 1.14 kgTSS/kgBOD-5. The same calculations for the MLE process using the WAS flows and solids concentrations depicted in Table 4b, result in sludge production rate of 140 kg TSS/d to 190 kg TSS/d and overall biological sludge yields of 0.90 kgTSS/kgBOD-5, 0.91 kgTSS/kgBOD-5, and 1.15 kgTSS/kgBOD-5 for the 1,100 m3/d, 1,300 m3/d, and 1,500 m3/d, representing an average reduction of 14%, relative to the Extended Aeration plant. It must be asserted that the above yield calculations for the BNR are solely based on the wastewater BOD and do not include the methanol. It is concluded that the sludge production and hauled sludge average daily flow rates decrease by converting the Extended Aeration Activated Sludge (EAAS) plant to the MLE process which is beneficial to the operation of the plant in terms of longer sludge storage time and lower sludge haulage costs. As presented in Table 4b the retention time in the aerobic digester will be 43 days for Alternative 1 which corresponds to one truckload per week. In order to address constraints in sludge processing capability of the current sludge management system at St. George WPCP and to reduce haulage rate of digested sludge to Paris WPCP, sludge thickening through application of Dissolved Air Flotation (DAF) technology is proposed. Application of DAF at St. George WPCP is an economically attractive solution to reduce the overall WAS quantity and volume, while extending the retention time in the aerobic digester in

110-003 Page 9
ST. GEORGE WPCP TECHNICAL MEMORANDUM – TREATMENT PROCESS MODELING
the existing sludge management system. A DAF unit could be installed between the secondary clarifier and the aerobic digester. Thickened sludge entrained by rising air bubbles would be removed from the top of the DAF and transferred to the digester while clarified underflow could be returned to the plant influent stream. Chemical Dose The estimated chemical doses for the retrofitted plant are 8.31 kg Fe3+/d, 10.85 kg Fe3+/d, and 12.87kg Fe3+/d at the plant flow rates of 1,100 m3/d, 1,300 m3/d, and 1,500 m3/d, respectively. The ferric chloride dose for Alternative 1 (retrofitted plant) is 13 to 26 percent lower than the flow pro-rated dose of 11.3 kg Fe3+/d to 14.8 kg Fe3+/d based on the modeled ferric chloride dose of 7.2 kg Fe3+/d at a flow rate of 830 m3/d. The conversion of the existing EAAS plant to the MLE process will reduce the chemical consumption and the associated costs due to enhanced biological phosphorous removal resulting in higher P content of biomass despite the reduced sludge yield. Methanol doses for the various flows of Alternative 1 are 40 L/d, 50 L/d, and 60 L/d at plant flow rates of 1,100 m3/d, 1,300 m3/d, and 1,500 m3/d, respectively.
Maximum Plant Capacity Sensitivity analysis was conducted to determine the plant maximum capacity by retrofitting the existing plant to a BNR process in Alternative 1 which includes addition of a 350 m3 anoxic tank and a DAF system. Biological process modeling indicated that the treatment capacity at the plant can increase to 2,000 m3/d for Alternative 1. Clarifier effluent TSS concentration > 10 mg/L was selected as the criteria to determine the maximum plant capacity. The effluent quality at the ultimate plant capacity for Alternative 1 (2,000 m3/d) is presented in Tables 5a and 5b for the average and 90th percentile conditions. As apparent from Tables 5a and 5b, the clarifier effluent TSS concentration at 2,000 m3/d is 10 and 10.1 mg/L at the average and 90th percentile conditions. Flow rates higher than 2,000 m3/d resulted in clarifier effluent TSS concentrations exceeding the 10 mg/L criteria. Therefore, to further increase the plant processing capacity, Alternative 2 will need to be considered which includes building new rectangular anoxic and aerobic tanks and a circular clarifier.
4.2 ALTERNATIVE 2
As noted above, the process modeling for Alternative 2 (at plant flow rates of 1,600 m3/d, 2,600 m3/d and 3,600 m3/d) was conducted at the average design concentrations as defined in Section 4.0 as well as the 90th percentile concentrations (Table A-1). Tables 6a and 6b present the effluent quality and sludge management results for Alternative 2 at average design concentrations, respectively, while Tables 7a and 7b summarize the effluent quality and sludge management results for Alternative 2 at 90th percentile concentrations, respectively. The tank sizes for the new plants are also specified in Tables 6a and 7a for the plant flow rate of 1,600 m3/d, 2,600 m3/d, and 3,600 m3/d. The components involved in the new plant at 1,600 m3/d included an addition of a 250 m3 anoxic tank, a 1000 m3 aerobic tank, a 110 m2 circular clarifier, a new Waste Activated Sludge (WAS) thickener, and the existing aerobic digester. The new plant at 2,600 m3/d included a 350 m3 anoxic tank, a 1,400 m3 aerobic tank, a 110 m2 circular clarifier, a WAS thickener and uses the existing aerobic sludge digester. The tank sizes for the flow rate of 3,600 m3/d include a 700 m3 anoxic tank (two- 350 m3 tanks), 2,310 m3 aerobic tank (830 m3

110-003 Page 10
ST. GEORGE WPCP TECHNICAL MEMORANDUM – TREATMENT PROCESS MODELING
existing aerobic tank + 80 m3 existing sludge storage tank + 1,400 m3 new aerobic tank), a 199 m2 clarifier (89 m2 existing clarifier + 110 m2 new clarifier), a WAS thickener and the existing aerobic sludge digester. Detailed process modeling results are discussed below.
4.2.1 Effluent Quality
As noted above, the model-predicted effluent characteristics are presented in Tables 6a and 7a for Alternative 2 at average and 90th percentile concentrations, respectively. The plant will produce an effluent quality which meets all of the effluent quality criteria stipulated in the current Ministry of the Environment (MOE) Certificate of Approval (C of A) 9415-6CQKH5. For all scenarios at both average and 90th percentile conditions, clarified effluent NH3 concentration is < 0.6 mg/L, TP < 0.2 mg/L, TN < 10 mg/L, and TSS and BOD concentrations are < 5 mg/L.
4.2.2 Conceptual Design Considerations
Sludge Production The sludge generation rates for Alternative 2 are 9.2 m3/d, 11 m3/d and 21 m3/d at the plant flow rates of 1,600 m3/d (both average and 90th percentile), 2,600 m3/d (both average and 90th percentile) and 3,600 m3/d (both average and 90th percentile). As presented in Tables 6b and 7b, the retention time in the aerobic digester will be 30, 25, and 13 days for Alternative 2 at 1,600 m3/d, 2,600 m3/d, and 3,600 m3/d, at both average and 90th percentile concentrations, respectively. This corresponds to two truckloads per week at 1,600 m3/d and 2,600 m3/d, and four truckloads per week at 3,600 m3/d for Alternative 2 at both average and 90th percentile concentrations. Similar to Alternative 1, the application of DAF technology is proposed to reduce the overall WAS quantity and volume, while extending the retention time in the aerobic digester in the existing sludge management system. A DAF unit could be installed between the secondary clarifier and the aerobic digester. Thickened sludge entrained by rising air bubbles would be removed from the top of the DAF and transferred to the digester while clarified underflow could be returned to the plant influent stream.
Chemical Dose
For Alternative 2 (new plant), the chemical dose is estimated to be 11.6 kg Fe/d to 16 kg Fe/d at the plant flow rate of 1,600 m3/d at the average and 90th percentile conditions, respectively. As apparent from Tables 6a and 7a, 29 Fe2+/d is required at the average conditions for plant flow rates of 2,600 m3/d and 3,600 m3/d while 31 kg Fe2+/d to 34 kg Fe2+/d is required at the 90th percentile conditions for the plant flow rates of 2,600 m3/d and 3,600 m3/d, respectively. The conversion of the existing EAAS plant to the MLE process will reduce the chemical consumption and the associated costs due to enhanced biological phosphorous removal resulting in higher P content of biomass despite the reduced sludge yield.
Methanol doses at the plant flow rate of 1,600 m3/d are 120 L/d and 140 L/d for the average and 90th percentile conditions, respectively. At the plant flow rate of 2600 m3/d, 160 L/d and 200 L/d of methanol is required at average and 90th percentile conditions, respectively, while 250 L/d of methanol are required at the plant flow rate of 3,600 m3/d for both average and 90th percentile conditions to achieve high levels of denitrification.

110-003 Page 11
ST. GEORGE WPCP TECHNICAL MEMORANDUM – TREATMENT PROCESS MODELING
5.0 SUMMARY Historical plant data for St. George Water Pollution Control Plant (WPCP) were reviewed and modeled using a process modeling software. A process model was developed for the retrofitted existing plant with the MLE process (Alternative 1) as well as a newly built MLE plant (Alternative 2). The results of process modeling indicated that the maximum biological processing capacity of the existing plant is 1,100 m3/d, above which the solids loading rate to the clarifier increases and results in high (>10 mg/L) effluent TSS concentrations. By retrofitting the existing EAAS process with the MLE process, the biological processing capacity can increase to a maximum of 2,000 m3/d with the addition of a new 350 m3 anoxic tank. To further increase the plant capacity, Alternative 2 is proposed. The biological processing capacity can increase to 3,600 m3/d by building a new MLE plant. For both alternatives, the plant will produce a clarified effluent with NH3 < 0.6 mg/L, TP < 0.2 mg/L, TN < 10 mg/L, and TSS and BOD concentrations < 5 mg/L. Lower sludge yield and consequently lower sludge production for the MLE process makes it an economical alternative to address the sludge processing capacity limitations both on site as well as at the Paris WPCP. In addition, the chemical (ferric) dose at the plant will decrease by converting the existing plant to MLE process. In order to reduce the overall WAS quantity and extend the retention time in the existing aerobic digester, application of a DAF unit is proposed for WAS thickening. It should be noted that Alternative 2 is superior to Alternative 1 in terms of ease of maintenance/repairs and flexibility of operation. Furthermore, retrofitting the existing plant to an MLE process, as described by Alternative 1, may pose some operational difficulties during construction as the existing plant will stay in operation while the modifications are done for conversion to the MLE process. Also, the effluent from the existing plant may exceed effluent quality criteria during the construction period for Alternative 1. Thus for Alternative 1, a temporary treatment system may be required during construction. Alternative 2 will allow the existing plant to be in operation while the new MLE plant is constructed. Process design for Alternative 2 includes two treatment trains, thus allowing the existing plant to be used when the portion (or all) of the new plant is removed from service for preventative maintenance purposes.
All of which is respectfully submitted. GAMSBY AND MANNEROW LIMITED Per: Per: Paul McLennan, P.Eng. Grant Parkinson, P.Eng. POLLUTION CONTROL PROCESS CONSULTING Per: Dr. George Nakhla, PhD, P. Eng., P.E. (Michigan)

110-003 Page 12
ST. GEORGE WPCP TECHNICAL MEMORANDUM – TREATMENT PROCESS MODELING
REFERENCES Ozinsky, A.E., and Ekama, G.A. (1995) Secondary Settling Tank Modeling and Design Part 2: Linking Sludge Settleability Measures. Water SA, Vol. 21, 4, 333.

110-003 Page 10
ST. GEORGE WPCP TECHNICAL MEMORANDUM – TREATMENT PROCESS MODELING
Table 3. Process Modeling Results for the Existing Plant
Flow SRT Temp Influent Unit Processes Operational Clarifier Effluent
COD TKN TP Aerobic
Vol. Clarifier
Area Ferric Dose MLSS MLVSS cBOD NH3 NO3 TN TSS TP
m3/d d (ºC) mg/L mg/L mg/L m3 m2 kg/d mg/L mg/L mg/L mg/L mg/L mg/L mg/L mg/L
830 24 15 300 38 4.7 830 89 7.2 3,450 1,970 1.8 0.35 30 33 7 0.47
1,000 24 15 300 38 4.7 830 89 9.4 4,150 2,130 2.3 0.42 30 33 9.4 0.42
1,100 24 15 300 38 4.7 830 89 10.1 4,480 2,530 2.4 0.35 30 33 10.9 0.49
Table 4a. Process Modeling Results for Alternative 1 (Average Conditions) – Effluent Quality
Scenario Flow SRT Temp
Influent Unit Processes Operational Clarifier Effluent Filtered Effluent (2)
COD TKN TP Anoxic Vol. (1)
Aerobic Vol.
Clarifier Area
Ferric Dose
Methanol Dose
MLSS MLVSS cBOD NH3 NO3 TN TSS TP SP cBOD NH3 NO3 TN TSS TP SP
m3/d d (ºC) mg/L mg/L mg/L m3 m3 m2 kg/d L/d mg/L mg/L mg/L mg/L mg/L mg/L mg/L mg/L mg/L mg/L mg/L mg/L mg/L mg/L mg/L mg/L
1 1,100 15 15 300 38 4.7 350 830 89 8.3 40 2,532 1,580 1.9 0.47 5.06 7.91 4.4 0.22 0.03 1.6 0.47 5.06 7.83 1--5 0.16 0.03
2 1,300 15 15 300 38 4.7 350 830 89 10.8 50 2,993 1,837 2.1 0.48 5.02 7.93 5.5 0.23 0.01 1.6 0.48 5.02 7.8 1--5 0.12 0.01
3 1,500 15 15 300 38 4.7 350 830 89 12.9 60 3,442 2,107 2.4 0.55 4.97 8.03 6.6 0.28 0.01 1.7 0.55 4.97 7.84 1--5 0.13 0.01
Table 4b. Process Modeling Results for Alternative 1 (Average Conditions) – Sludge Management
Scenario Flow
WAS Thickener Vol.
Aerobic Digester Vol.
WAS flow WAS Conc.
Thickener Solid Capture Efficiency
Thickened WAS Conc.
Digested Sludge Conc. Digested Sludge Flow Retention Time in Digester Storage Capacity
m3/d m3 m3 m3/d mg/L % % % m3/d d Truck/week (3)
1 1,100 112 278 23.7 5,910 85 1.8 1.5 6.5 43 1
2 1,300 112 278 23.7 6,980 85 2.1 1.8 6.5 43 1
3 1,500 112 278 23.7 8,024 85 2.4 2 6.5 43 1
Notes (1) SWD of 4.5 m to 5 m. (2) The filtered effluent BOD, TN, and TP are calculated based on the BOD, N, and P content of Biomass from BioWin as 20%, 5.2%, and 4.1% of TSS, respectively. (3) Assumed a Truck Capacity of 30,000 L (8,000 US gal.). Table 5a. Process Modeling Results for Alternative 1 at Max. Plant Capacity (Average Conditions) – Effluent Quality
Flow SRT Temp Influent Unit Processes Operational Clarifier Effluent Filtered Effluent (2)
COD TKN TP Anoxic Vol. (1)
Aerobic Vol.
Clarifier Area
Ferric Dose
Methanol Dose
MLSS MLVSS cBOD NH3 NO3 TN TSS TP SP cBOD NH3 NO3 TN TSS TP SP
m3/d d (ºC) mg/L mg/L mg/L m3 m3 m2 kg/d L/d mg/L mg/L mg/L mg/L mg/L mg/L mg/L mg/L mg/L mg/L mg/L mg/L mg/L mg/L mg/L mg/L
2,000 15 15 300 38 4.7 350 830 89 18 100 4,555 2,791 3.2 0.56 4.91 8.15 10 0.41 0.01 1.8 0.56 4.91 7.8 1--5 0.13 0.01

110-003 Page 11
ST. GEORGE WPCP TECHNICAL MEMORANDUM – TREATMENT PROCESS MODELING
Table 5b. Process Modeling Results for Alternative 1 at Max. Plant Capacity (90th Percentile Conditions) – Effluent Quality
Flow SRT Temp Influent Unit Processes Operational Clarifier Effluent Filtered Effluent (2)
COD TKN TP Anoxic Vol. (1)
Aerobic Vol.
Clarifier Area
Ferric Dose
Methanol Dose
MLSS MLVSS cBOD NH3 NO3 TN TSS TP SP cBOD NH3 NO3 TN TSS TP SP
m3/d d (ºC) mg/L mg/L mg/L m3 m3 m2 kg/d L/d mg/L mg/L mg/L mg/L mg/L mg/L mg/L mg/L mg/L mg/L mg/L mg/L mg/L mg/L mg/L mg/L
2,000 11 15 460 46 6.2 350 830 89 20.2 150 4,736 3,252 3.5 0.65 5.57 9.07 10.1 0.39 0.01 1.9 0.65 5.57 8.65 1--5 0.12 0.01
Notes (1) SWD of 4.5 m to 5 m. (2) The filtered effluent BOD, TN, and TP are calculated based on the BOD, N, and P content of Biomass from BioWin as 20% to 2 %, 5.3% to 5.9%, and 3.8% to 4% of TSS, respectively. Table 6a. Process Modeling Results for Alternative 2 (Average Conditions) – Effluent Quality
Scenario Flow SRT Temp
Influent Unit Processes Operational Clarifier Effluent Filtered Effluent (2)
COD TKN TP Anoxic Vol.
(1) Aerobic Vol. (1)
Clarifier Area
Ferric Dose
Methanol Dose
MLSS MLVSS cBOD NH3 NO3 TN TSS TP SP cBOD NH3 NO3 TN TSS TP SP
m3/d d ( C) mg/L mg/L mg/L m3 m3 m2 kg/d L/d mg/L mg/L mg/L mg/L mg/L mg/L mg/L mg/L mg/L mg/L mg/L mg/L mg/L mg/L mg/L mg/L
4 1,600 15 15 300 38 4.7 250 1,000 110 11.6 120 3,290 2,164 2.3 0.45 4.7 7.6 5.6 0.25 0.02 1.7 0.45 4.7 7.4 1--5 0.15 0.02
5 2,600 15 15 300 38 4.7 350 1,400 110 29 160 3,880 2,395 3.4 0.5 5 8.2 10.4 0.39 0.01 1.8 0.5 5 7.8 1--5 0.12 0.01
6 3,600 15 15 300 38 4.7 700 2,310 200 29 250 3,135 2,011 2.7 0.5 4.7 7.7 7.3 0.29 0.01 1.8 0.5 4.7 7.5 1--5 0.12 0.01
Table 6b. Process Modeling Results for Alternative 2 (Average Conditions) – Sludge Management
Scenario Flow
WAS Thickener Vol.
Aerobic Digester Vol.
WAS flow WAS Conc.
Thickener Solid capture Efficiency Thickened WAS
Conc. Digested Sludge Conc. Digested Sludge Flow Retention Time in Digester Storage Capacity (1)
m3/d m3 m3 m3/d mg/L % % % m3/d d Truck/week
4 1,600 112 278 33.3 6,575 85 2 1.6 9.2 30 2
5 2,600 112 278 40 9,045 85 2.8 2.3 11 25 2
6 3,600 112 278 77 6,259 85 1.9 1.7 21.2 13 4
Table 7a. Process Modeling Results for Alternative 2 (90th Percentile Conditions) – Effluent Quality
Scenario Flow SRT Temp
Influent Unit Processes Operational Clarifier Effluent Filtered Effluent (2)
COD TKN TP Anoxic Vol.
(1) Aerobic Vol.
(1) Clarifier
Area Ferric Dose Methanol Dose MLSS MLVSS cBOD NH3 NO3 TN TSS TP SP cBOD NH3 NO3 TN TSS TP SP
m3/d d (ºC) mg/L mg/L mg/L m3 m3 m2 kg/d L/d mg/L mg/L mg/L mg/L mg/L mg/L mg/L mg/L mg/L mg/L mg/L mg/L mg/L mg/L mg/L mg/L
4 1,600 15 15 460 46 6.2 250 1,000 110 16 140 4,482 3,107 2.4 0.5 5.47 8.5 5.8 0.23 0.01 1.7 0.5 5.47 8.3 1--5 0.12 0.01
5 2,600 15 15 460 46 6.2 350 1,400 110 31 200 5,556 3,490 3.4 0.5 5.57 8.91 11.3 0.39 0.01 0.9 0.5 5.57 8.17 1--5 0.11 0.01
6 3,600 15 15 460 46 6.2 700 2,310 200 34 250 4,500 2,857 2.5 0.45 5.53 8.61 7.8 0.29 0.01 1.6 0.45 5.53 8.35 1--5 0.11 0.01

110-003 Page 12
ST. GEORGE WPCP TECHNICAL MEMORANDUM – TREATMENT PROCESS MODELING
Table 7b. Process Modeling Results for Alternative 2 (90th Percentile Conditions) – Sludge Management
Scenario Flow
WAS Thickener Vol.
Aerobic Digester Vol.
WAS flow WAS Conc.
Thickener Solid Capture Efficiency Thickened WAS
Conc. Digested Sludge Conc. Digested Sludge Flow Retention Time in Digester Storage Capacity (3)
m3/d m3 m3 m3/d mg/L % % % m3/d d Truck/week
4 1.600 112 278 33.3 8,951 85 2.8 2.2 9.2 30 2
5 2.600 112 278 40 12,950 85 4 3.4 11 25 2
6 3.600 112 278 77 8,986 85 2.7 2.4 21.2 13 4
Notes (1) SWD of 4.5m to 5 m. (2) The filtered effluent BOD, TN, and TP are calculated based on the BOD, N, and P content of Biomass from BioWin as 20% to 24 %, 5.3% to 6 %, and 3.4% to 3.8% of TSS, respectively. (3) Assumed a Truck Capacity of 30,000 L (8,000 US gal.).

ST. GEORGE WATER POLLUTION CONTROL PLANT OPTIMIZATION STUDY
TECHNICAL MEMORANDUM
TREATMENT PROCESS MODELING
APPENDIX “A”
CALIBRATION TABLES FOR SCENARIO A

St. George WPCP Modeling Report (A- Without Denitrification)
Table A-1. Characteristics of Raw Sewage
Average ± STD 90th Percentile 10th
Percentile Calibrated Model
Prediction
Flow (m3/d) 827 ± 91 914 756 827
TSS (mg/L) 169 ± 104 311 46 147
VSS (mg/L) 152 ± 93 281 39 130
TBOD (mg/L) 129 ± 69 206 67 131
SBOD (mg/L) 40 ± 16 63 18 41
TCOD (mg/L) 288 ± 122 461 159 288
SCOD (mg/L) 76 ± 33 115 43 80
TKN (mg/L) 38 ± 13 46 29 38
STKN (mg/L) 30 ± 10 40 23 32
Ammonia (mg/L) 25.6 ± 4.6 32 21 25.6
Nitrite (mg/L) 0.10 ± 0.14 0.23 0.02 0
Nitrate (mg/L) 0.20 0.2 0.2 0.2
Nitrate and Nitrite (mg/L)
0.30 ± 0.28 0.46 0.14 0.2
TP (mg/L) 4.7 ± 1.7 6.2 3.3 4.7
SP (mg/L) 3.4 ± 1.1 4.3 2.7 3.4
Alk. (mgCaCO3/L) 403 ± 36 429 371 403
Oil and Grease 13.3 ± 6.2 23.0 6.7 -
pH 7.6 ± 0.2 7.8 7.3 7.6
Temp (oC) 13.6 ± 1.1 14.3 12.3 13
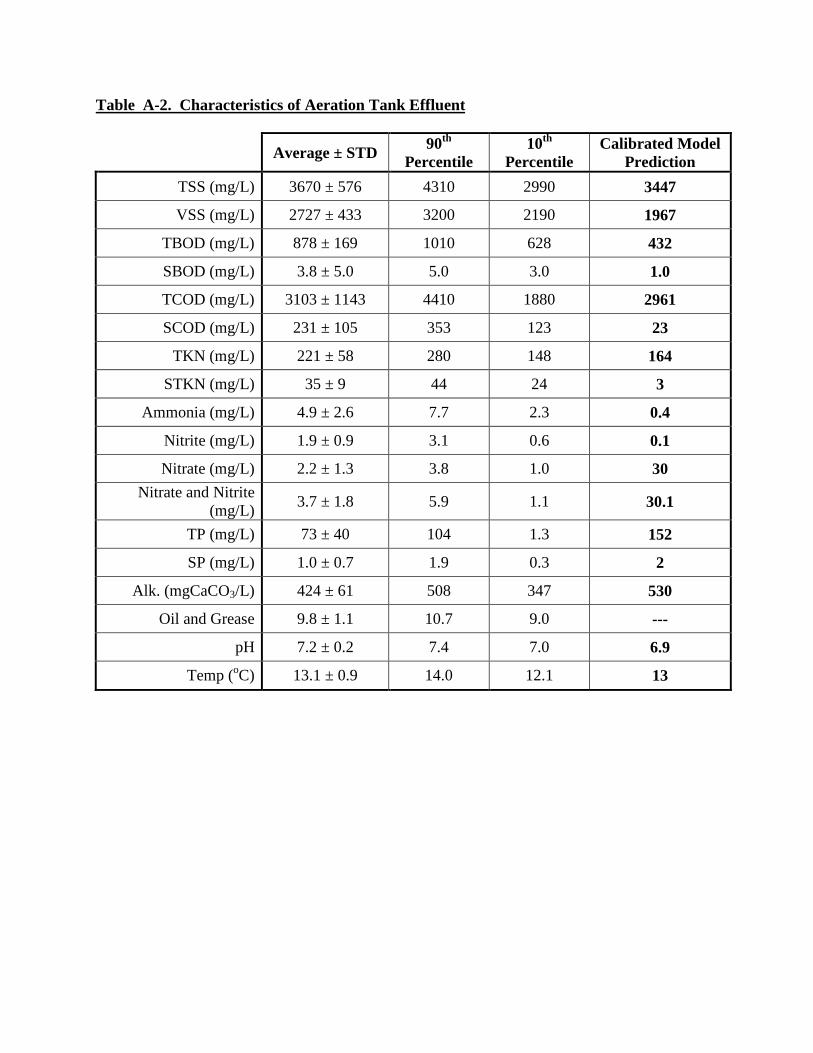
Table A-2. Characteristics of Aeration Tank Effluent
Average ± STD 90th
Percentile 10th
Percentile Calibrated Model
Prediction
TSS (mg/L) 3670 ± 576 4310 2990 3447
VSS (mg/L) 2727 ± 433 3200 2190 1967
TBOD (mg/L) 878 ± 169 1010 628 432
SBOD (mg/L) 3.8 ± 5.0 5.0 3.0 1.0
TCOD (mg/L) 3103 ± 1143 4410 1880 2961
SCOD (mg/L) 231 ± 105 353 123 23
TKN (mg/L) 221 ± 58 280 148 164
STKN (mg/L) 35 ± 9 44 24 3
Ammonia (mg/L) 4.9 ± 2.6 7.7 2.3 0.4
Nitrite (mg/L) 1.9 ± 0.9 3.1 0.6 0.1
Nitrate (mg/L) 2.2 ± 1.3 3.8 1.0 30
Nitrate and Nitrite (mg/L)
3.7 ± 1.8 5.9 1.1 30.1
TP (mg/L) 73 ± 40 104 1.3 152
SP (mg/L) 1.0 ± 0.7 1.9 0.3 2
Alk. (mgCaCO3/L) 424 ± 61 508 347 530
Oil and Grease 9.8 ± 1.1 10.7 9.0 ---
pH 7.2 ± 0.2 7.4 7.0 6.9
Temp (oC) 13.1 ± 0.9 14.0 12.1 13

Table A-3. Characteristics of Clarifier Effluent
Average ± STD 90th
Percentile 10th
Percentile Calibrated Model
Prediction
TSS (mg/L) 6.6 ± 3.3 10.1 4.0 6.9
VSS (mg/L) 5.7 ± 4.7 7.1 2.0 4.0
TBOD (mg/L) 3.9 ± 1.9 5.0 3.0 1.8
SBOD (mg/L) 3.0 ± 0.8 4.0 2.0 1.0
TCOD (mg/L) 26.3 ± 5.5 31.0 22.8 28.8
SCOD (mg/L) 22.6 ± 3.5 26.5 18.5 22.9
TKN (mg/L) 2.0 ± 1.3 2.8 1.3 2.8
STKN (mg/L) 1.3 ± 1.0 2.3 0.7 2.5
Ammonia (mg/L) 0.6 ± 1.1 1.1 0.1 0.4
Nitrite (mg/L) 0.6 ± 1.1 2.2 0.0 0.7
Nitrate (mg/L) 22.3 ± 4.3 26.1 16.8 30
Nitrate and Nitrite (mg/L)
23.2 ± 4.4 26.1 18.0 30.7
TP (mg/L) 0.4 ± 0.2 0.4 0.2 0.4
SP (mg/L) 0.1 ± 0.2 0.2 0.1 0.1
Alk. (mgCaCO3/L) 196 ± 15 210 181 189
Oil and Grease 1.5 ± 0.9 2.0 0.9 ---
pH 7.3 7.3 7.3 6.8
Temp (oC) 11.8 11.8 11.8 13

Table A-4a. Characteristics of RAS/WAS
Average ± STD 90th
Percentile 10th
Percentile Calibrated Model
Prediction
TSS (mg/L) 9692 ± 3642 15400 5740 8739
VSS (mg/L) 7223 ± 2744 11520 4140 4965
TCOD (mg/L) 9496 ± 5774 13900 4210 7440
SCOD (mg/L) 834 ± 602 1815 255 1088
Table A-4b. Characteristics of Sludge Tank Decant
Average ± STD 90th
Percentile 10th
Percentile Calibrated Model
Prediction
TSS (mg/L) 1933 ± 2832 4580 43 4220
VSS (mg/L) 1435 ± 2068 3380 31 2398
TCOD (mg/L) 1486 ± 1773 3540 276 3605
SCOD (mg/L) 740 ± 568 1473 204 526
Note: Two Decant samples on July 29th, 2010 indicated the following characteristics (mg/L): TCOD = 5,000, SCOD = 656-671, TSS = 3,000-5,700, VSS= 2,200-3,900, TKN=320-390, NH4-N = 69-71 Table A-4c. Characteristics of Digester Effluent
Average ± STD 90th
Percentile 10th
Percentile Calibrated Model
Prediction
TSS (mg/L) 23652 ± 1434 25000 22000 18133
VSS (mg/L) 16190 ± 928 17000 15000 9439
Note: A mixed thickened sludge sample on July 29th, 2010 indicated the following characteristics (mg/L): TCOD=27,000, SCOD = 1,080,TSS = 22,000,VSS= 15,000,TKN=1,300,NH4-N = 130

ST. GEORGE WATER POLLUTION CONTROL PLANT OPTIMIZATION STUDY
TECHNICAL MEMORANDUM
TREATMENT PROCESS MODELING
APPENDIX “B”
MODELING RESULTS FOR SCENARIO A
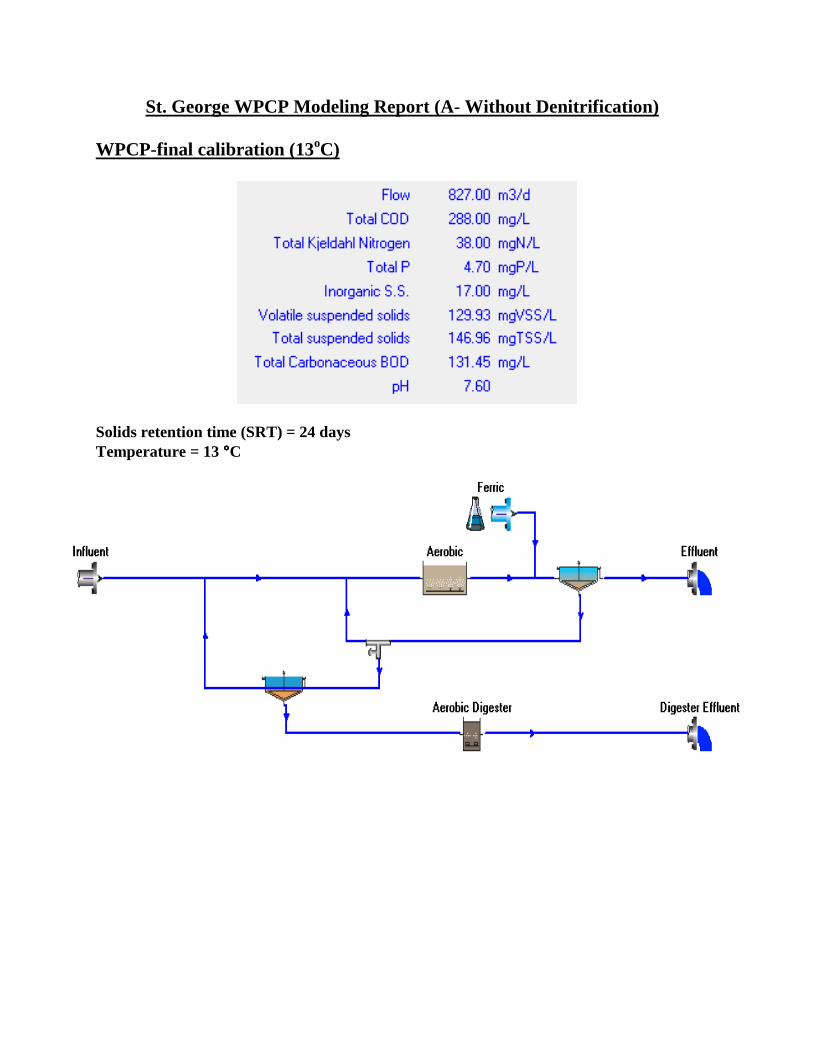
St. George WPCP Modeling Report (A- Without Denitrification) WPCP-final calibration (13oC)
Solids retention time (SRT) = 24 days
Temperature = 13 °°°°C

Influent Characteristics

Aerobic


Ferric addition

Clarifier

RAS from the clarifier

WAS Thickener

RAS from the Thickener
WAS from the Thickener to the Aerobic Digester
Aerobic Digester


Effluent Digester

Final Effluent Characteristics

ST. GEORGE WATER POLLUTION CONTROL PLANT OPTIMIZATION STUDY
TECHNICAL MEMORANDUM
TREATMENT PROCESS MODELING
APPENDIX “C”
CALIBRATION TABLES FOR SCENARIO B

St. George WPCP Modeling Report (B-With Denitrification)
Table B-1. Characteristics of Raw Sewage
Average ± STD 90th Percentile 10th
Percentile Calibrated Model
Prediction
Flow (m3/d) 827 ± 91 914 756 827
TSS (mg/L) 169 ± 104 311 46 147
VSS (mg/L) 152 ± 93 281 39 130
TBOD (mg/L) 129 ± 69 206 67 131
SBOD (mg/L) 40 ± 16 63 18 41
TCOD (mg/L) 288 ± 122 461 159 288
SCOD (mg/L) 76 ± 33 115 43 80
TKN (mg/L) 38 ± 13 46 29 38
STKN (mg/L) 30 ± 10 40 23 32
Ammonia (mg/L) 25.6 ± 4.6 32 21 25.6
Nitrite (mg/L) 0.10 ± 0.14 0.23 0.02 0
Nitrate (mg/L) 0.20 0.2 0.2 0.2
Nitrate and Nitrite (mg/L)
0.30 ± 0.28 0.46 0.14 0.2
TP (mg/L) 4.7 ± 1.7 6.2 3.3 4.7
SP (mg/L) 3.4 ± 1.1 4.3 2.7 3.4
Alk. (mgCaCo3/L) 403 ± 36 429 371 403
Oil and Grease 13.3 ± 6.2 23.0 6.7 -
pH 7.6 ± 0.2 7.8 7.3 7.6
Temp (oC) 13.6 ± 1.1 14.3 12.3 13

Table B-2. Characteristics of Aeration Tank Effluent
Average ± STD 90th
Percentile 10th
Percentile Calibrated Model
Prediction
TSS (mg/L) 3670 ± 576 4310 2990 3444
VSS (mg/L) 2727 ± 433 3200 2190 1964
TBOD (mg/L) 878 ± 169 1010 628 441
SBOD (mg/L) 3.8 ± 5.0 5.0 3.0 1.0
TCOD (mg/L) 3103 ± 1143 4410 1880 2959
SCOD (mg/L) 231 ± 105 353 123 23
TKN (mg/L) 221 ± 58 280 148 164
STKN (mg/L) 35 ± 9 44 24 3
Ammonia (mg/L) 4.9 ± 2.6 7.7 2.3 0.4
Nitrite (mg/L) 1.9 ± 0.9 3.1 0.6 0.1
Nitrate (mg/L) 2.2 ± 1.3 3.8 1.0 27.4
Nitrate and Nitrite (mg/L)
3.7 ± 1.8 5.9 1.1 27.5
TP (mg/L) 73 ± 40 104 1.3 152
SP (mg/L) 1.0 ± 0.7 1.9 0.3 2
Alk. (mgCaCo3/L) 424 ± 61 508 347 530
Oil and Grease 9.8 ± 1.1 10.7 9.0 ---
pH 7.2 ± 0.2 7.4 7.0 6.9
Temp (oC) 13.1 ± 0.9 14.0 12.1 13

Table B-3. Characteristics of Clarifier Effluent
Average ± STD 90th
Percentile 10th
Percentile Calibrated Model
Prediction
TSS (mg/L) 6.6 ± 3.3 10.1 4.0 6.9
VSS (mg/L) 5.7 ± 4.7 7.1 2.0 4.0
TBOD (mg/L) 3.9 ± 1.9 5.0 3.0 1.8
SBOD (mg/L) 3.0 ± 0.8 4.0 2.0 1.0
TCOD (mg/L) 26.3 ± 5.5 31.0 22.8 28.8
SCOD (mg/L) 22.6 ± 3.5 26.5 18.5 22.9
TKN (mg/L) 2.0 ± 1.3 2.8 1.3 2.8
STKN (mg/L) 1.3 ± 1.0 2.3 0.7 2.5
Ammonia (mg/L) 0.6 ± 1.1 1.1 0.1 0.4
Nitrite (mg/L) 0.6 ± 1.1 2.2 0.0 0.1
Nitrate (mg/L) 22.3 ± 4.3 26.1 16.8 27.4
Nitrate and Nitrite (mg/L)
23.2 ± 4.4 26.1 18.0 27.5
TP (mg/L) 0.4 ± 0.2 0.4 0.2 0.4
SP (mg/L) 0.1 ± 0.2 0.2 0.1 0.1
Alk. (mgCaCo3/L) 196 ± 15 210 181 189
Oil and Grease 1.5 ± 0.9 2.0 0.9 ---
pH 7.3 7.3 7.3 6.8
Temp (oC) 11.8 11.8 11.8 13

Table B-4a. Characteristics of RAS/WAS
Average ± STD 90th
Percentile 10th
Percentile Calibrated Model
Prediction
TSS (mg/L) 9692 ± 3642 15400 5740 8732
VSS (mg/L) 7223 ± 2744 11520 4140 4960
TCOD (mg/L) 9496 ± 5774 13900 4210 7432
SCOD (mg/L) 834 ± 602 1815 255 1113
Table B-4b. Characteristics of Sludge Tank Decant
Average ± STD 90th
Percentile 10th
Percentile Calibrated Model
Prediction
TSS (mg/L) 1933 ± 2832 4580 43 4218
VSS (mg/L) 1435 ± 2068 3380 31 2396
TCOD (mg/L) 1486 ± 1773 3540 276 3601
SCOD (mg/L) 740 ± 568 1473 204 526
Note: Two Decant samples on July 29th, 2010 indicated the following characteristics (mg/L): TCOD=5,000, SCOD = 656-671,TSS = 3,000-5,700,VSS= 2,200-3,900,TKN=320-390,NH4-N = 69-71 Table B-4c. Characteristics of Digester Effluent
Average ± STD 90th
Percentile 10th
Percentile Calibrated Model
Prediction
TSS (mg/L) 23652 ± 1434 25000 22000 18058
VSS (mg/L) 16190 ± 928 17000 15000 9384
Note: A mixed thickened sludge sample July 29th, 2010 indicated the following characteristics (mg/L): TCOD=27,000, SCOD = 1,080, TSS = 22,000, VSS= 15,000, TKN=1, 300, NH4-N = 130

ST. GEORGE WATER POLLUTION CONTROL PLANT OPTIMIZATION STUDY
TECHNICAL MEMORANDUM
TREATMENT PROCESS MODELING
APPENDIX “D”
MODELING RESULTS FOR SCENARIO B

St. George WPCP Modeling Report (B-With Denitrification)
WPCP-final calibration (13oC)
Solids retention time (SRT) = 24 days Temperature = 13 C

Influent Characteristics

Aerobic


Ferric addition

Clarifier

RAS from the clarifier

WAS Thickener

RAS from the Thickener
WAS from the Thickener to the Aerobic Digester
Aerobic Digester


Effluent Digester

Final Effluent Characteristics

ST. GEORGE WATER POLLUTION CONTROL PLANT OPTIMIZATION STUDY
TECHNICAL MEMORANDUM
TREATMENT PROCESS MODELING
APPENDIX “E”
PROCESS MODELING RESULTS
File C:\Documents and Settings\sarabi\Desktop\St. George WPCP- Final Modelling-Dec 2010\1500.bwc
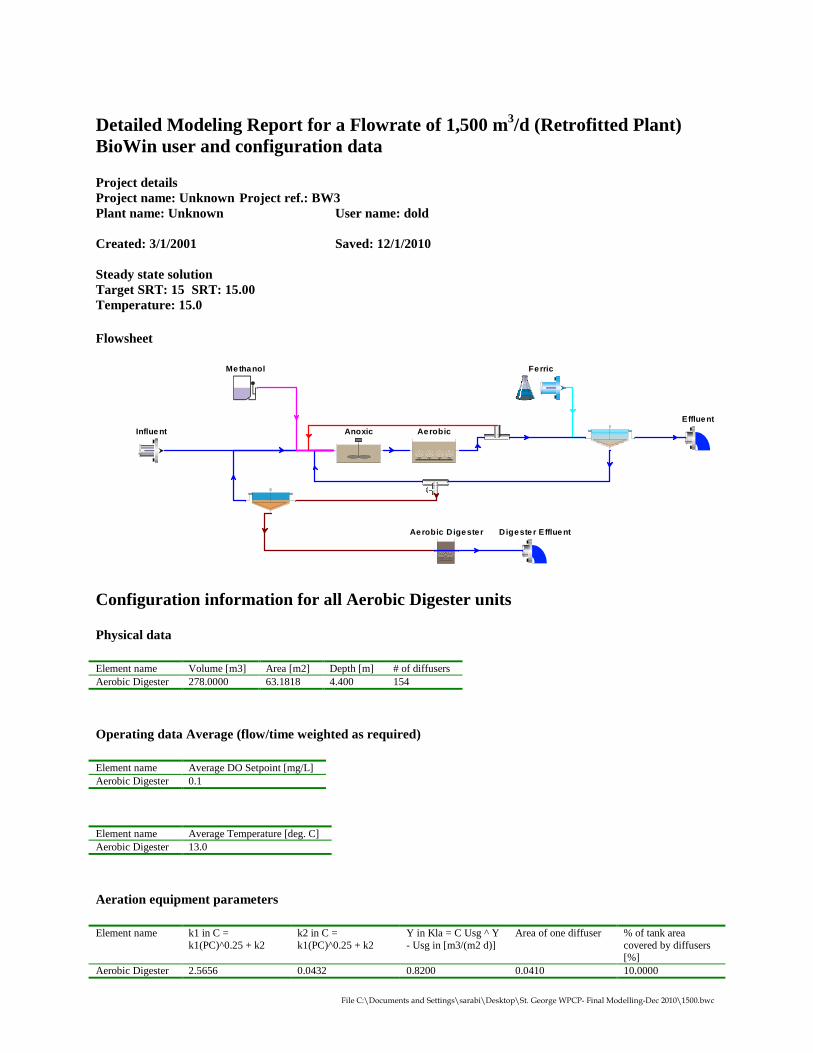
Detailed Modeling Report for a Flowrate of 1,500 m3/d (Retrofitted Plant)BioWin user and configuration data
Project detailsProject name: Unknown Project ref.: BW3Plant name: Unknown User name: dold
Created: 3/1/2001 Saved: 12/1/2010
Steady state solutionTarget SRT: 15 SRT: 15.00Temperature: 15.0
Flowsheet
Influe nt Aerobic
Effluent
Digeste r Efflue nt
Ferric
Aerobic Digester
Anoxic
Me thanol
Configuration information for all Aerobic Digester units
Physical data
Element name Volume [m3] Area [m2] Depth [m] # of diffusersAerobic Digester 278.0000 63.1818 4.400 154
Operating data Average (flow/time weighted as required)
Element name Average DO Setpoint [mg/L]Aerobic Digester 0.1
Element name Average Temperature [deg. C]Aerobic Digester 13.0
Aeration equipment parameters
Element name k1 in C =k1(PC)^0.25 + k2
k2 in C =k1(PC)^0.25 + k2
Y in Kla = C Usg ^ Y- Usg in [m3/(m2 d)]
Area of one diffuser % of tank areacovered by diffusers[%]
Aerobic Digester 2.5656 0.0432 0.8200 0.0410 10.0000

File C:\Documents and Settings\sarabi\Desktop\St. George WPCP- Final Modelling-Dec 2010\1500.bwc
Configuration information for all Bioreactor units
Physical data
Element name Volume [m3] Area [m2] Depth [m] # of diffusersAerobic 830.0000 184.4444 4.500 675Anoxic 350.0000 77.7778 4.500 Un-aerated
Operating data Average (flow/time weighted as required)
Element name Average DO Setpoint [mg/L]Aerobic 2.0Anoxic 0
Aeration equipment parameters
Element name k1 in C = k1(PC)^0.25+ k2
k2 in C = k1(PC)^0.25+ k2
Y in Kla = C Usg ^ Y- Usg in [m3/(m2 d)]
Area of one diffuser % of tank areacovered by diffusers[%]
Aerobic 2.5656 0.0432 0.8200 0.0410 15.0000Anoxic 2.5656 0.0432 0.8200 0.0410 10.0000
Element name Alpha (surf) OR Alpha F (diff) [-] Beta [-] Surface pressure [kPa] Fractional effective saturation depth (Fed) [-] Aerobic 0.5000 0.9500 101.3250 0.3250
Elementname
Supply gasCO2 content[vol. %]
Supply gasO2 [vol. %]
Off-gas CO2[vol. %]
Off-gas O2[vol. %]
Off-gas H2[vol. %]
Off-gas NH3[vol. %]
Off-gas CH4[vol. %]
Surfaceturbulencefactor [-]
Aerobic 0.0350 20.9500 2.0000 18.8000 0 0 0 2.0000
Configuration information for all Methanol units
Operating data Average (flow/time weighted as required)
Element name MethanolNon-polyP heterotrophs mgCOD/L 0Anoxic methanol utilizers mgCOD/L 0Ammonia oxidizing biomass mgCOD/L 0Nitrite oxidizing biomass mgCOD/L 0Anaerobic ammonia oxidizers mgCOD/L 0PolyP heterotrophs mgCOD/L 0Propionic acetogens mgCOD/L 0Acetoclastic methanogens mgCOD/L 0Hydrogenotrophic methanogens mgCOD/L 0Endogenous products mgCOD/L 0Slowly bio. COD (part.) mgCOD/L 0Slowly bio. COD (colloid.) mgCOD/L 0Part. inert. COD mgCOD/L 0Part. bio. org. N mgN/L 0Part. bio. org. P mgP/L 0Part. inert N mgN/L 0Part. inert P mgP/L 0Stored PHA mgCOD/L 0

File C:\Documents and Settings\sarabi\Desktop\St. George WPCP- Final Modelling-Dec 2010\1500.bwc
Releasable stored polyP mgP/L 0Fixed stored polyP mgP/L 0PolyP bound cations mg/L 0Readily bio. COD (complex) mgCOD/L 0Acetate mgCOD/L 0Propionate mgCOD/L 0Methanol mgCOD/L 1188000.00Dissolved H2 mgCOD/L 0Dissolved methane mg/L 0Ammonia N mgN/L 0Sol. bio. org. N mgN/L 0Nitrite N mgN/L 0Nitrate N mgN/L 0Dissolved nitrogen gas mgN/L 0PO4-P (Sol. & Me Complexed) mgP/L 0Sol. inert COD mgCOD/L 0Sol. inert TKN mgN/L 0Inorganic S.S. mgISS/L 0Struvite mgISS/L 0Hydroxy-dicalcium-phosphate mgISS/L 0Hydroxy-apatite mgISS/L 0Magnesium mg/L 0Calcium mg/L 0Metal mg/L 0Other Cations (strong bases) meq/L 0Other Anions (strong acids) meq/L 0Total CO2 mmol/L 0User defined 1 mg/L 0User defined 2 mg/L 0User defined 3 mgVSS/L 0User defined 4 mgISS/L 0Dissolved oxygen mg/L 0Flow 0.06
Configuration information for all Model clarifier units
Physical data
Element name Volume[m3] Area[m2] Depth[m] Number of layers Top feed layer Feed LayersModel clarifier19 338.2000 89.0000 3.800 10 6 1
Operating data Average (flow/time weighted as required)
Element name Split method Average Split specificationModel clarifier19 Flowrate [Under] 1125
Element name Average Temperature ReactiveModel clarifier19 Uses global setting No
Local settling parameters
Element name Maximum Vesilindsettling velocity (Vo)
Vesilind hinderedzone settlingparameter (K) [L/g]
Clarificationswitching function[mg/L]
Specified TSSconc.for height calc.[mg/L]
Maximumcompactabilityconstant [mg/L]
Model clarifier19 183.0000 0.0003 100.0000 2500.0000 15000.0000

File C:\Documents and Settings\sarabi\Desktop\St. George WPCP- Final Modelling-Dec 2010\1500.bwc
Configuration information for all Effluent units
Configuration information for all Ideal clarifier units
Physical data
Element name Volume [m3] Area [m2] Depth [m]WAS Thickener 112.0000 28.0000 4.000
Operating data Average (flow/time weighted as required)
Element name Split method Average Split specificationWAS Thickener Ratio 0.38
Element name Average Temperature Reactive Percent removal Blanket fractionWAS Thickener Uses global setting No 85.00 0.20
Configuration information for all COD Influent units
Operating data Average (flow/time weighted as required)
Element name InfluentTime 0Flow 1500Total COD mgCOD/L 300.00Total Kjeldahl Nitrogen mgN/L 38.00Total P mgP/L 4.70Nitrate N mgN/L 0.20pH 7.60Alkalinity mmol/L 8.06Inorganic S.S. mgISS/L 17.00Calcium mg/L 50.00Magnesium mg/L 20.00Dissolved oxygen mg/L 0
Element name InfluentFbs - Readily biodegradable (including Acetate) [gCOD/g of total COD] 0.0990Fac - Acetate [gCOD/g of readily biodegradable COD] 0.1750Fxsp - Non-colloidal slowly biodegradable [gCOD/g of slowly degradable COD] 0.8500Fus - Unbiodegradable soluble [gCOD/g of total COD] 0.0750Fup - Unbiodegradable particulate [gCOD/g of total COD] 0.1300Fna - Ammonia [gNH3-N/gTKN] 0.6740Fnox - Particulate organic nitrogen [gN/g Organic N] 0.5000Fnus - Soluble unbiodegradable TKN [gN/gTKN] 0.0200FupN - N:COD ratio for unbiodegradable part. COD [gN/gCOD] 0.0350Fpo4 - Phosphate [gPO4-P/gTP] 0.7230FupP - P:COD ratio for unbiodegradable part. COD [gP/gCOD] 0.0110FZbh - Non-poly-P heterotrophs [gCOD/g of total COD] 0.0001FZbm - Anoxic methanol utilizers [gCOD/g of total COD] 0.0001FZaob - Ammonia oxidizers [gCOD/g of total COD] 0.0001FZnob - Nitrite oxidizers [gCOD/g of total COD] 0.0001FZamob - Anaerobic ammonia oxidizers [gCOD/g of total COD] 0.0001FZbp - PAOs [gCOD/g of total COD] 0.0001FZbpa - Propionic acetogens [gCOD/g of total COD] 0.0001

File C:\Documents and Settings\sarabi\Desktop\St. George WPCP- Final Modelling-Dec 2010\1500.bwc
FZbam - Acetoclastic methanogens [gCOD/g of total COD] 0.0001FZbhm - H2-utilizing methanogens [gCOD/g of total COD] 0.0001
Configuration information for all Metal addition units
Operating data Average (flow/time weighted as required)
Element name FerricNon-polyP heterotrophs mgCOD/L 0Anoxic methanol utilizers mgCOD/L 0Ammonia oxidizing biomass mgCOD/L 0Nitrite oxidizing biomass mgCOD/L 0Anaerobic ammonia oxidizers mgCOD/L 0PolyP heterotrophs mgCOD/L 0Propionic acetogens mgCOD/L 0Acetoclastic methanogens mgCOD/L 0Hydrogenotrophic methanogens mgCOD/L 0Endogenous products mgCOD/L 0Slowly bio. COD (part.) mgCOD/L 0Slowly bio. COD (colloid.) mgCOD/L 0Part. inert. COD mgCOD/L 0Part. bio. org. N mgN/L 0Part. bio. org. P mgP/L 0Part. inert N mgN/L 0Part. inert P mgP/L 0Stored PHA mgCOD/L 0Releasable stored polyP mgP/L 0Fixed stored polyP mgP/L 0PolyP bound cations mg/L 0Readily bio. COD (complex) mgCOD/L 0Acetate mgCOD/L 0Propionate mgCOD/L 0Methanol mgCOD/L 0Dissolved H2 mgCOD/L 0Dissolved methane mg/L 0Ammonia N mgN/L 0Sol. bio. org. N mgN/L 0Nitrite N mgN/L 0Nitrate N mgN/L 0Dissolved nitrogen gas mgN/L 0PO4-P (Sol. & Me Complexed) mgP/L 0Sol. inert COD mgCOD/L 0Sol. inert TKN mgN/L 0Inorganic S.S. mgISS/L 0Struvite mgISS/L 0Hydroxy-dicalcium-phosphate mgISS/L 0Hydroxy-apatite mgISS/L 0Magnesium mg/L 0Calcium mg/L 0Metal mg/L 7230.23Other Cations (strong bases) meq/L 5.00Other Anions (strong acids) meq/L 407.79Total CO2 mmol/L 7.00User defined 1 mg/L 0User defined 2 mg/L 0User defined 3 mgVSS/L 0User defined 4 mgISS/L 0Dissolved oxygen mg/L 0Flow 1.78
Configuration information for all Splitter units
Operating data Average (flow/time weighted as required)
Element name Split method Average Split specificationWAS splitter Flowrate [Side] 23.738051228474

File C:\Documents and Settings\sarabi\Desktop\St. George WPCP- Final Modelling-Dec 2010\1500.bwc
Splitter21 Flowrate [Side] 6000
BioWin Album
Album page - Influent
InfluentParameters Conc. (mg/L) Mass rate (kg/d) NotesVolatile suspended solids 135.35 203.02Total suspended solids 152.37 228.56Particulate COD 216.52 324.78Filtered COD 83.48 125.22Total COD 300.00 450.00Soluble PO4-P 3.40 5.10Total P 4.70 7.05Filtered TKN 31.49 47.24Particulate TKN 6.51 9.76Total Kjeldahl Nitrogen 38.00 57.00Filtered Carbonaceous BOD 43.07 64.61Total Carbonaceous BOD 136.93 205.39Nitrite + Nitrate 0.20 0.30Total N 38.20 57.30Total inorganic N 25.81 38.72Alkalinity 8.06 12.09 mmol/L and kmol/dpH 7.60Volatile fatty acids 5.20 7.80Total precipitated solids 0 0Total inorganic suspended solids 17.03 25.54Ammonia N 25.61 38.42Nitrate N 0.20 0.30
Parameters Value Units
Album page - Anoxic
AnoxicParameters Conc. (mg/L) Mass rate (kg/d) NotesVolatile suspended solids 2118.46 18258.01Total suspended solids 3453.26 29761.99Particulate COD 3150.81 27155.30Filtered COD 30.35 261.57Total COD 3181.16 27416.87Soluble PO4-P 0.02 0.15Total P 141.38 1218.50Filtered TKN 7.58 65.31Particulate TKN 177.05 1525.92Total Kjeldahl Nitrogen 184.63 1591.24Filtered Carbonaceous BOD 4.45 38.34Total Carbonaceous BOD 709.92 6118.48Nitrite + Nitrate 0.11 0.97Total N 184.74 1592.21Total inorganic N 5.74 49.48Alkalinity 12.11 104.34 mmol/L and kmol/dpH 7.18Volatile fatty acids 1.53 13.20Total precipitated solids 707.13 6094.43Total inorganic suspended solids 1334.80 11503.98Ammonia N 5.63 48.51Nitrate N 0.08 0.73
Parameters Value UnitsHydraulic residence time 1.0 hours

File C:\Documents and Settings\sarabi\Desktop\St. George WPCP- Final Modelling-Dec 2010\1500.bwc
Flow 8618.52 m3/dMLSS 3453.26 mg/LTotal solids mass 1208.64 kgTotal readily biodegradable COD 6.03 mg/LTotal oxygen uptake rate 0.00 mgO/L/hrCarbonaceous OUR 0.00 mgO/L/hrNitrogenous OUR 0.00 mgO/L/hrNet. ammonia removal rate -0.74 mgN/L/hrNitrate production rate 0.00 mgN/L/hrNitrite production rate 4.17 mgN/L/hrNitrate removal rate 4.17 mgN/L/hrNitrite removal rate 4.25 mgN/L/hrNet. nitrate production rate -4.17 mgN/L/hrNet. nitrite production rate -0.09 mgN/L/hrDissolved N2 gas production rate 4.25 mgN/L/hrSpec. dissolved N2 gas production rate per VSS 2.01 mgN/gVSS/hrSpec. dissolved N2 gas production per VASS 5.30 mgN/gVASS/hrOTE 100.00 %OTR 0 kg/hrSOTE 100.00 %SOTR 0 kg/hrAir supply rate 0 m3/hr (20C, 101.325 kPa or 1 atm)Air flow rate / diffuser 0 m3/hr (20C, 101.325 kPa or 1 atm)# of diffusers 0Off gas flow rate (dry) 0.99 m3/hrOxygen content 0 %Carbon dioxide content 68.12 %Ammonia content 0.01 %Actual DO sat. conc. 9.65 mg/LVelocity gradient 67.97 1/s
Album page - Aerobic
AerobicParameters Conc. (mg/L) Mass rate (kg/d) NotesVolatile suspended solids 2106.68 18156.51Total suspended solids 3441.95 29664.53Particulate COD 3130.74 26982.37Filtered COD 24.23 208.87Total COD 3154.98 27191.23Soluble PO4-P 0.01 0.11Total P 141.38 1218.50Filtered TKN 2.59 22.32Particulate TKN 176.90 1524.61Total Kjeldahl Nitrogen 179.49 1546.93Filtered Carbonaceous BOD 1.13 9.74Total Carbonaceous BOD 694.46 5985.23Nitrite + Nitrate 5.11 44.05Total N 184.60 1590.98Total inorganic N 5.66 48.78Alkalinity 11.39 98.14 mmol/L and kmol/dpH 7.07Volatile fatty acids 0.02 0.18Total precipitated solids 707.01 6093.39Total inorganic suspended solids 1335.27 11508.03Ammonia N 0.55 4.72Nitrate N 4.98 42.89
Parameters Value UnitsHydraulic residence time 2.3 hoursFlow 8618.52 m3/dMLSS 3441.95 mg/LTotal solids mass 2856.82 kgTotal readily biodegradable COD 1.59 mg/LTotal oxygen uptake rate 20.67 mgO/L/hrCarbonaceous OUR 11.05 mgO/L/hrNitrogenous OUR 9.62 mgO/L/hr

File C:\Documents and Settings\sarabi\Desktop\St. George WPCP- Final Modelling-Dec 2010\1500.bwc
Net. ammonia removal rate 2.20 mgN/L/hrNitrate production rate 2.20 mgN/L/hrNitrite production rate 2.31 mgN/L/hrNitrate removal rate 0.08 mgN/L/hrNitrite removal rate 2.26 mgN/L/hrNet. nitrate production rate 2.12 mgN/L/hrNet. nitrite production rate 0.05 mgN/L/hrDissolved N2 gas production rate 0.06 mgN/L/hrSpec. dissolved N2 gas production rate per VSS 0.03 mgN/gVSS/hrSpec. dissolved N2 gas production per VASS 0.08 mgN/gVASS/hrOTE 13.26 %OTR 17.87 kg/hrSOTE 40.81 %SOTR 53.77 kg/hrAir supply rate 483.65 m3/hr (20C, 101.325 kPa or 1 atm)Air flow rate / diffuser 0.72 m3/hr (20C, 101.325 kPa or 1 atm)# of diffusers 675.00Off gas flow rate (dry) 474.78 m3/hrOxygen content 18.20 %Carbon dioxide content 2.33 %Ammonia content 0.00 %Actual DO sat. conc. 9.65 mg/LVelocity gradient 110.49 1/s
Album page - Effluent
EffluentParameters Conc. (mg/L) Mass rate (kg/d) NotesVolatile suspended solids 4.03 6.03Total suspended solids 6.60 9.87Particulate COD 5.99 8.95Filtered COD 24.22 36.21Total COD 30.21 45.17Soluble PO4-P 0.01 0.01Total P 0.28 0.42Filtered TKN 2.59 3.87Particulate TKN 0.34 0.51Total Kjeldahl Nitrogen 2.93 4.38Filtered Carbonaceous BOD 1.13 1.69Total Carbonaceous BOD 2.46 3.67Nitrite + Nitrate 5.11 7.64Total N 8.03 12.01Total inorganic N 5.66 8.46Alkalinity 5.58 8.34 mmol/L and kmol/dpH 6.96Volatile fatty acids 0.02 0.03Total precipitated solids 1.37 2.05Total inorganic suspended solids 2.57 3.85Ammonia N 0.55 0.82Nitrate N 4.97 7.44
Parameters Value Units
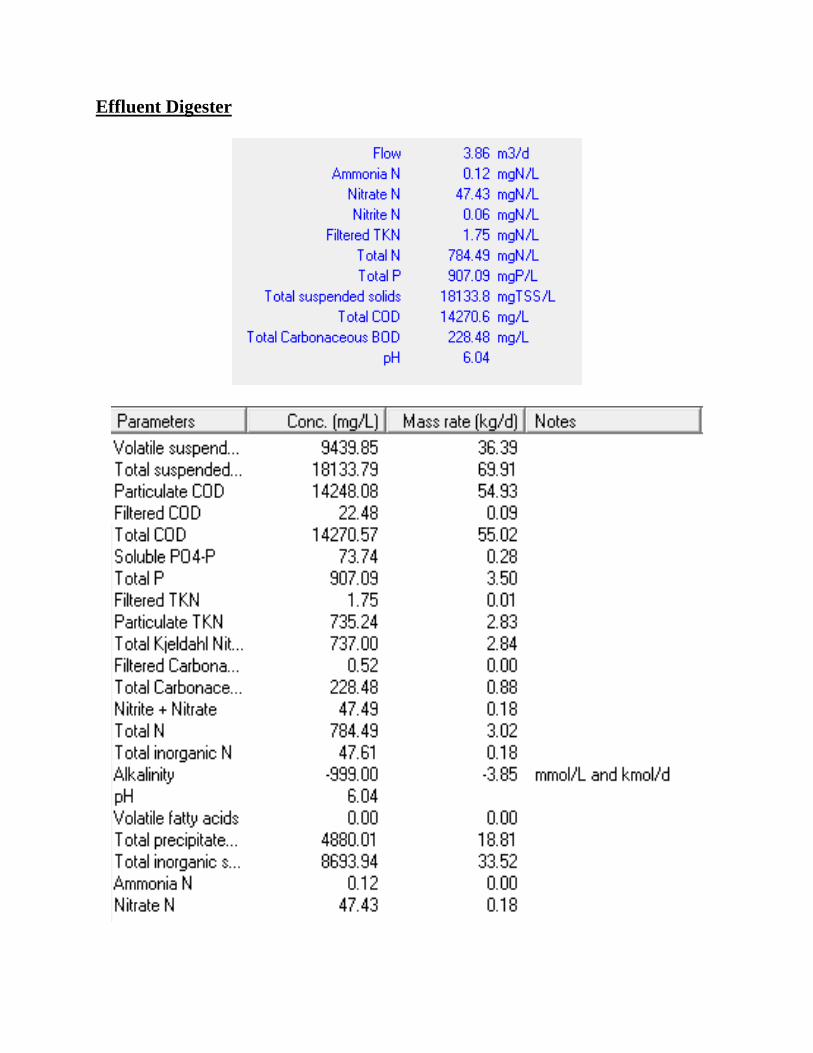
Album page - Digester effluent
Digester EffluentParameters Conc. (mg/L) Mass rate (kg/d) NotesVolatile suspended solids 11255.04 73.57Total suspended solids 20656.77 135.02Particulate COD 16936.57 110.71Filtered COD 23.55 0.15Total COD 16960.12 110.86Soluble PO4-P 92.20 0.60

File C:\Documents and Settings\sarabi\Desktop\St. George WPCP- Final Modelling-Dec 2010\1500.bwc
Total P 1014.64 6.63Filtered TKN 1.82 0.01Particulate TKN 890.30 5.82Total Kjeldahl Nitrogen 892.12 5.83Filtered Carbonaceous BOD 0.55 0.00Total Carbonaceous BOD 1041.79 6.81Nitrite + Nitrate 18.81 0.12Total N 910.93 5.95Total inorganic N 18.94 0.12Alkalinity -999.00 -6.53 mmol/L and kmol/dpH 6.37Volatile fatty acids 0.00 0.00Total precipitated solids 5207.08 34.04Total inorganic suspended solids 9401.73 61.46Ammonia N 0.13 0.00Nitrate N 18.75 0.12
Parameters Value Units
Album page - Clarifier
Model clarifier19Parameters Conc. (mg/L) Mass rate (kg/d) NotesVolatile suspended solids 4.03 6.03Total suspended solids 6.60 9.87Particulate COD 5.99 8.95Filtered COD 24.22 36.21Total COD 30.21 45.17Soluble PO4-P 0.01 0.01Total P 0.28 0.42Filtered TKN 2.59 3.87Particulate TKN 0.34 0.51Total Kjeldahl Nitrogen 2.93 4.38Filtered Carbonaceous BOD 1.13 1.69Total Carbonaceous BOD 2.46 3.67Nitrite + Nitrate 5.11 7.64Total N 8.03 12.01Total inorganic N 5.66 8.46Alkalinity 5.58 8.34 mmol/L and kmol/dpH 6.96Volatile fatty acids 0.02 0.03Total precipitated solids 1.37 2.05Total inorganic suspended solids 2.57 3.85Ammonia N 0.55 0.82Nitrate N 4.97 7.44
Parameters Value UnitsHydraulic residence time 3.10 hoursEffluent flow 1495.30 m3/dReturn activated sludge flow 1125.00 m3/dHeight of specified concentration 0.45 mReturn activated sludge TSS 8024.54 mg/LEffluent solids 6.60 mg/LSolids loading rate 101.54 kg/(m2 d)Surface overflow rate 16.80 m3/(m2 d)Total solids mass 371.81 kg
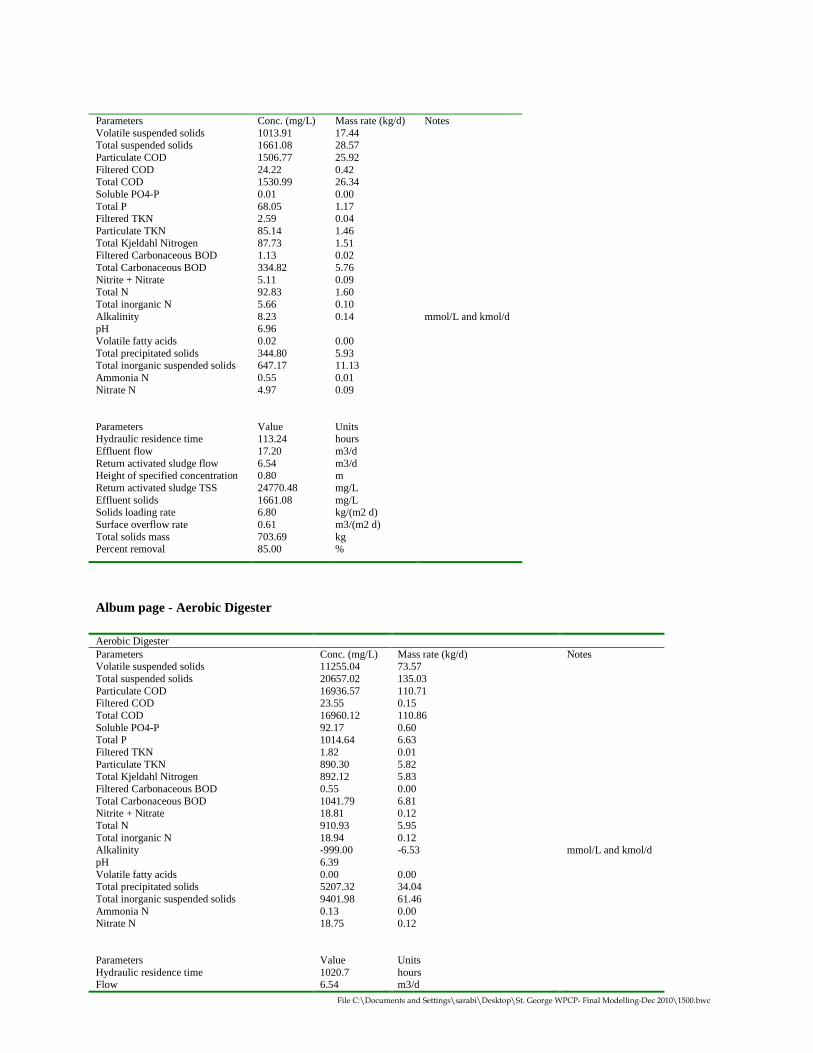
Album page - Thickener
WAS Thickener
File C:\Documents and Settings\sarabi\Desktop\St. George WPCP- Final Modelling-Dec 2010\1500.bwc
Parameters Conc. (mg/L) Mass rate (kg/d) NotesVolatile suspended solids 1013.91 17.44Total suspended solids 1661.08 28.57Particulate COD 1506.77 25.92Filtered COD 24.22 0.42Total COD 1530.99 26.34Soluble PO4-P 0.01 0.00Total P 68.05 1.17Filtered TKN 2.59 0.04Particulate TKN 85.14 1.46Total Kjeldahl Nitrogen 87.73 1.51Filtered Carbonaceous BOD 1.13 0.02Total Carbonaceous BOD 334.82 5.76Nitrite + Nitrate 5.11 0.09Total N 92.83 1.60Total inorganic N 5.66 0.10Alkalinity 8.23 0.14 mmol/L and kmol/dpH 6.96Volatile fatty acids 0.02 0.00Total precipitated solids 344.80 5.93Total inorganic suspended solids 647.17 11.13Ammonia N 0.55 0.01Nitrate N 4.97 0.09
Parameters Value UnitsHydraulic residence time 113.24 hoursEffluent flow 17.20 m3/dReturn activated sludge flow 6.54 m3/dHeight of specified concentration 0.80 mReturn activated sludge TSS 24770.48 mg/LEffluent solids 1661.08 mg/LSolids loading rate 6.80 kg/(m2 d)Surface overflow rate 0.61 m3/(m2 d)Total solids mass 703.69 kgPercent removal 85.00 %
Album page - Aerobic Digester
Aerobic DigesterParameters Conc. (mg/L) Mass rate (kg/d) NotesVolatile suspended solids 11255.04 73.57Total suspended solids 20657.02 135.03Particulate COD 16936.57 110.71Filtered COD 23.55 0.15Total COD 16960.12 110.86Soluble PO4-P 92.17 0.60Total P 1014.64 6.63Filtered TKN 1.82 0.01Particulate TKN 890.30 5.82Total Kjeldahl Nitrogen 892.12 5.83Filtered Carbonaceous BOD 0.55 0.00Total Carbonaceous BOD 1041.79 6.81Nitrite + Nitrate 18.81 0.12Total N 910.93 5.95Total inorganic N 18.94 0.12Alkalinity -999.00 -6.53 mmol/L and kmol/dpH 6.39Volatile fatty acids 0.00 0.00Total precipitated solids 5207.32 34.04Total inorganic suspended solids 9401.98 61.46Ammonia N 0.13 0.00Nitrate N 18.75 0.12
Parameters Value UnitsHydraulic residence time 1020.7 hoursFlow 6.54 m3/d

File C:\Documents and Settings\sarabi\Desktop\St. George WPCP- Final Modelling-Dec 2010\1500.bwc
MLSS 20657.02 mg/LTotal solids mass 5742.65 kgTotal readily biodegradable COD 0.78 mg/LTotal oxygen uptake rate 6.23 mgO/L/hrCarbonaceous OUR 4.21 mgO/L/hrNitrogenous OUR 2.01 mgO/L/hrNet. ammonia removal rate 0.00 mgN/L/hrNitrate production rate 0.65 mgN/L/hrNitrite production rate 1.03 mgN/L/hrNitrate removal rate 0.63 mgN/L/hrNitrite removal rate 1.03 mgN/L/hrNet. nitrate production rate 0.01 mgN/L/hrNet. nitrite production rate 0.00 mgN/L/hrDissolved N2 gas production rate 0.36 mgN/L/hrSpec. dissolved N2 gas production rate per VSS 0.03 mgN/gVSS/hrSpec. dissolved N2 gas production per VASS 0.29 mgN/gVASS/hrOTE 19.62 %OTR 1.73 kg/hrSOTE 48.48 %SOTR 4.18 kg/hrAir supply rate 31.65 m3/hr (20C, 101.325 kPa or 1 atm)Air flow rate / diffuser 0.21 m3/hr (20C, 101.325 kPa or 1 atm)# of diffusers 154.00Off gas flow rate (dry) 30.84 m3/hrOxygen content 16.87 %Carbon dioxide content 3.72 %Ammonia content 0.00 %Actual DO sat. conc. 10.07 mg/LVelocity gradient 74.67 1/sVSS destruction 25.56 %
Album page – Digester Effluent
Digester EffluentParameters Conc. (mg/L) Mass rate (kg/d) NotesVolatile suspended solids 11255.04 73.57Total suspended solids 20656.77 135.02Particulate COD 16936.57 110.71Filtered COD 23.55 0.15Total COD 16960.12 110.86Soluble PO4-P 92.20 0.60Total P 1014.64 6.63Filtered TKN 1.82 0.01Particulate TKN 890.30 5.82Total Kjeldahl Nitrogen 892.12 5.83Filtered Carbonaceous BOD 0.55 0.00Total Carbonaceous BOD 1041.79 6.81Nitrite + Nitrate 18.81 0.12Total N 910.93 5.95Total inorganic N 18.94 0.12Alkalinity -999.00 -6.53 mmol/L and kmol/dpH 6.37Volatile fatty acids 0.00 0.00Total precipitated solids 5207.08 34.04Total inorganic suspended solids 9401.73 61.46Ammonia N 0.13 0.00Nitrate N 18.75 0.12
Parameters Value Units

File C:\Documents and Settings\sarabi\Desktop\St. George WPCP- Final Modelling-Dec 2010\3600 m3d-MLE-Ferric-Sludge-Avg.bwc
Detailed Modeling Report for a Flowrate of 3,600 m3/d (New Plant)BioWin user and configuration data
Project detailsProject name: Unknown Project ref.: BW3Plant name: Unknown User name: dold
Created: 3/1/2001 Saved: 12/1/2010
Target SRT: 15 SRT: ****Temperature: 15.0
Flowsheet
Influent
Aerobic
Effluent
D igeste r Efflue nt
Ferric
Ae robic Digeste r
Anoxic
Me thanol
Configuration information for all Aerobic Digester units
Physical data
Element name Volume [m3] Area [m2] Depth [m] # of diffusersAerobic Digester 278.0000 63.1818 4.400 154
Operating data Average (flow/time weighted as required)
Element name Average DO Setpoint [mg/L]Aerobic Digester 0.1
Element name Average Temperature [deg. C]Aerobic Digester 13.0
Aeration equipment parameters
Element name k1 in C =k1(PC)^0.25 + k2
k2 in C =k1(PC)^0.25 + k2
Y in Kla = C Usg ^ Y- Usg in [m3/(m2 d)]
Area of one diffuser % of tank areacovered by diffusers[%]
Aerobic Digester 2.5656 0.0432 0.8200 0.0410 10.0000

File C:\Documents and Settings\sarabi\Desktop\St. George WPCP- Final Modelling-Dec 2010\3600 m3d-MLE-Ferric-Sludge-Avg.bwc
Configuration information for all Bioreactor units
Physical data
Element name Volume [m3] Area [m2] Depth [m] # of diffusersAerobic 2310.0000 513.3333 4.500 1878Anoxic 700.0000 155.5556 4.500 Un-aerated
Operating data Average (flow/time weighted as required)
Element name Average DO Setpoint [mg/L]Aerobic 2.0Anoxic 0
Aeration equipment parameters
Element name k1 in C = k1(PC)^0.25+ k2
k2 in C = k1(PC)^0.25+ k2
Y in Kla = C Usg ^ Y- Usg in [m3/(m2 d)]
Area of one diffuser % of tank areacovered by diffusers[%]
Aerobic 2.5656 0.0432 0.8200 0.0410 15.0000Anoxic 2.5656 0.0432 0.8200 0.0410 10.0000
Element name Alpha (surf) OR Alpha F (diff) [-] Beta [-] Surface pressure [kPa] Fractional effective saturation depth (Fed) [-] Aerobic 0.5000 0.9500 101.3250 0.3250
Elementname
Supply gasCO2 content[vol. %]
Supply gasO2 [vol. %]
Off-gas CO2[vol. %]
Off-gas O2[vol. %]
Off-gas H2[vol. %]
Off-gas NH3[vol. %]
Off-gas CH4[vol. %]
Surfaceturbulencefactor [-]
Aerobic 0.0350 20.9500 2.0000 18.8000 0 0 0 2.0000
Configuration information for all Methanol units
Operating data Average (flow/time weighted as required)
Element name MethanolNon-polyP heterotrophs mgCOD/L 0Anoxic methanol utilizers mgCOD/L 0Ammonia oxidizing biomass mgCOD/L 0Nitrite oxidizing biomass mgCOD/L 0Anaerobic ammonia oxidizers mgCOD/L 0PolyP heterotrophs mgCOD/L 0Propionic acetogens mgCOD/L 0Acetoclastic methanogens mgCOD/L 0Hydrogenotrophic methanogens mgCOD/L 0Endogenous products mgCOD/L 0Slowly bio. COD (part.) mgCOD/L 0Slowly bio. COD (colloid.) mgCOD/L 0Part. inert. COD mgCOD/L 0Part. bio. org. N mgN/L 0Part. bio. org. P mgP/L 0Part. inert N mgN/L 0Part. inert P mgP/L 0Stored PHA mgCOD/L 0

File C:\Documents and Settings\sarabi\Desktop\St. George WPCP- Final Modelling-Dec 2010\3600 m3d-MLE-Ferric-Sludge-Avg.bwc
Releasable stored polyP mgP/L 0Fixed stored polyP mgP/L 0PolyP bound cations mg/L 0Readily bio. COD (complex) mgCOD/L 0Acetate mgCOD/L 0Propionate mgCOD/L 0Methanol mgCOD/L 1188000.00Dissolved H2 mgCOD/L 0Dissolved methane mg/L 0Ammonia N mgN/L 0Sol. bio. org. N mgN/L 0Nitrite N mgN/L 0Nitrate N mgN/L 0Dissolved nitrogen gas mgN/L 0PO4-P (Sol. & Me Complexed) mgP/L 0Sol. inert COD mgCOD/L 0Sol. inert TKN mgN/L 0Inorganic S.S. mgISS/L 0Struvite mgISS/L 0Hydroxy-dicalcium-phosphate mgISS/L 0Hydroxy-apatite mgISS/L 0Magnesium mg/L 0Calcium mg/L 0Metal mg/L 0Other Cations (strong bases) meq/L 0Other Anions (strong acids) meq/L 0Total CO2 mmol/L 0User defined 1 mg/L 0User defined 2 mg/L 0User defined 3 mgVSS/L 0User defined 4 mgISS/L 0Dissolved oxygen mg/L 0Flow 0.25
Configuration information for all Model clarifier units
Physical data
Element name Volume[m3] Area[m2] Depth[m] Number of layers Top feed layer Feed LayersModel clarifier19 744.8000 196.0000 3.800 10 6 1
Operating data Average (flow/time weighted as required)
Element name Split method Average Split specificationModel clarifier19 Flowrate [Under] 3600
Element name Average Temperature ReactiveModel clarifier19 Uses global setting No
Local settling parameters
Element name Maximum Vesilindsettling velocity (Vo)
Vesilind hinderedzone settlingparameter (K) [L/g]
Clarificationswitching function[mg/L]
Specified TSSconc.for height calc.[mg/L]
Maximumcompactabilityconstant [mg/L]
Model clarifier19 183.0000 0.0003 100.0000 2500.0000 15000.0000
Configuration information for all Effluent units

File C:\Documents and Settings\sarabi\Desktop\St. George WPCP- Final Modelling-Dec 2010\3600 m3d-MLE-Ferric-Sludge-Avg.bwc
Configuration information for all Ideal clarifier units
Physical data
Element name Volume [m3] Area [m2] Depth [m]WAS Thickener 112.0000 28.0000 4.000
Operating data Average (flow/time weighted as required)
Element name Split method Average Split specificationWAS Thickener Ratio 0.38
Element name Average Temperature Reactive Percent removal Blanket fractionWAS Thickener Uses global setting No 85.00 0.20
Configuration information for all COD Influent units
Operating data Average (flow/time weighted as required)
Element name InfluentTime 0Flow 3600Total COD mgCOD/L 300.00Total Kjeldahl Nitrogen mgN/L 38.00Total P mgP/L 4.70Nitrate N mgN/L 0.20pH 7.60Alkalinity mmol/L 8.06Inorganic S.S. mgISS/L 17.00Calcium mg/L 50.00Magnesium mg/L 20.00Dissolved oxygen mg/L 0
Element name InfluentFbs - Readily biodegradable (including Acetate) [gCOD/g of total COD] 0.0990Fac - Acetate [gCOD/g of readily biodegradable COD] 0.1750Fxsp - Non-colloidal slowly biodegradable [gCOD/g of slowly degradable COD] 0.8500Fus - Unbiodegradable soluble [gCOD/g of total COD] 0.0750Fup - Unbiodegradable particulate [gCOD/g of total COD] 0.1300Fna - Ammonia [gNH3-N/gTKN] 0.6740Fnox - Particulate organic nitrogen [gN/g Organic N] 0.5000Fnus - Soluble unbiodegradable TKN [gN/gTKN] 0.0200FupN - N:COD ratio for unbiodegradable part. COD [gN/gCOD] 0.0350Fpo4 - Phosphate [gPO4-P/gTP] 0.7230FupP - P:COD ratio for unbiodegradable part. COD [gP/gCOD] 0.0110FZbh - Non-poly-P heterotrophs [gCOD/g of total COD] 0.0001FZbm - Anoxic methanol utilizers [gCOD/g of total COD] 0.0001FZaob - Ammonia oxidizers [gCOD/g of total COD] 0.0001FZnob - Nitrite oxidizers [gCOD/g of total COD] 0.0001FZamob - Anaerobic ammonia oxidizers [gCOD/g of total COD] 0.0001FZbp - PAOs [gCOD/g of total COD] 0.0001FZbpa - Propionic acetogens [gCOD/g of total COD] 0.0001FZbam - Acetoclastic methanogens [gCOD/g of total COD] 0.0001FZbhm - H2-utilizing methanogens [gCOD/g of total COD] 0.0001
Configuration information for all Metal addition units

File C:\Documents and Settings\sarabi\Desktop\St. George WPCP- Final Modelling-Dec 2010\3600 m3d-MLE-Ferric-Sludge-Avg.bwc
Operating data Average (flow/time weighted as required)
Element name FerricNon-polyP heterotrophs mgCOD/L 0Anoxic methanol utilizers mgCOD/L 0Ammonia oxidizing biomass mgCOD/L 0Nitrite oxidizing biomass mgCOD/L 0Anaerobic ammonia oxidizers mgCOD/L 0PolyP heterotrophs mgCOD/L 0Propionic acetogens mgCOD/L 0Acetoclastic methanogens mgCOD/L 0Hydrogenotrophic methanogens mgCOD/L 0Endogenous products mgCOD/L 0Slowly bio. COD (part.) mgCOD/L 0Slowly bio. COD (colloid.) mgCOD/L 0Part. inert. COD mgCOD/L 0Part. bio. org. N mgN/L 0Part. bio. org. P mgP/L 0Part. inert N mgN/L 0Part. inert P mgP/L 0Stored PHA mgCOD/L 0Releasable stored polyP mgP/L 0Fixed stored polyP mgP/L 0PolyP bound cations mg/L 0Readily bio. COD (complex) mgCOD/L 0Acetate mgCOD/L 0Propionate mgCOD/L 0Methanol mgCOD/L 0Dissolved H2 mgCOD/L 0Dissolved methane mg/L 0Ammonia N mgN/L 0Sol. bio. org. N mgN/L 0Nitrite N mgN/L 0Nitrate N mgN/L 0Dissolved nitrogen gas mgN/L 0PO4-P (Sol. & Me Complexed) mgP/L 0Sol. inert COD mgCOD/L 0Sol. inert TKN mgN/L 0Inorganic S.S. mgISS/L 0Struvite mgISS/L 0Hydroxy-dicalcium-phosphate mgISS/L 0Hydroxy-apatite mgISS/L 0Magnesium mg/L 0Calcium mg/L 0Metal mg/L 7230.23Other Cations (strong bases) meq/L 5.00Other Anions (strong acids) meq/L 407.79Total CO2 mmol/L 7.00User defined 1 mg/L 0User defined 2 mg/L 0User defined 3 mgVSS/L 0User defined 4 mgISS/L 0Dissolved oxygen mg/L 0Flow 4
Configuration information for all Splitter units
Operating data Average (flow/time weighted as required)
Element name Split method Average Split specificationWAS splitter Flowrate [Side] 76.9999999743333Splitter21 Flowrate [Side] 14400
BioWin Album

File C:\Documents and Settings\sarabi\Desktop\St. George WPCP- Final Modelling-Dec 2010\3600 m3d-MLE-Ferric-Sludge-Avg.bwc
Album page - Influent
InfluentParameters Conc. (mg/L) Mass rate (kg/d) NotesVolatile suspended solids 135.35 487.25Total suspended solids 152.37 548.54Particulate COD 216.52 779.47Filtered COD 83.48 300.53Total COD 300.00 1080.00Soluble PO4-P 3.40 12.23Total P 4.70 16.92Filtered TKN 31.49 113.38Particulate TKN 6.51 23.42Total Kjeldahl Nitrogen 38.00 136.80Filtered Carbonaceous BOD 43.07 155.06Total Carbonaceous BOD 136.93 492.94Nitrite + Nitrate 0.20 0.72Total N 38.20 137.52Total inorganic N 25.81 92.92Alkalinity 8.06 29.02 mmol/L and kmol/dpH 7.60Volatile fatty acids 5.20 18.71Total precipitated solids 0 0Total inorganic suspended solids 17.03 61.29Ammonia N 25.61 92.20Nitrate N 0.20 0.72
Parameters Value Units
lbum page - Anoxic
AnoxicParameters Conc. (mg/L) Mass rate (kg/d) NotesVolatile suspended solids 2022.81 43650.38Total suspended solids 3146.32 67894.53Particulate COD 2996.42 64659.97Filtered COD 33.52 723.33Total COD 3029.94 65383.30Soluble PO4-P 0.02 0.37Total P 121.74 2626.97Filtered TKN 7.22 155.85Particulate TKN 172.03 3712.20Total Kjeldahl Nitrogen 179.25 3868.05Filtered Carbonaceous BOD 6.95 150.00Total Carbonaceous BOD 732.08 15797.64Nitrite + Nitrate 0.15 3.25Total N 179.40 3871.29Total inorganic N 5.38 116.15Alkalinity 10.89 234.99 mmol/L and kmol/dpH 7.17Volatile fatty acids 0.99 21.30Total precipitated solids 566.34 12221.09Total inorganic suspended solids 1123.50 24244.15Ammonia N 5.23 112.90Nitrate N 0.11 2.48
Parameters Value UnitsHydraulic residence time 0.8 hoursFlow 21579.05 m3/dMLSS 3146.32 mg/LTotal solids mass 2202.42 kgTotal readily biodegradable COD 9.53 mg/LTotal oxygen uptake rate 0.00 mgO/L/hr

File C:\Documents and Settings\sarabi\Desktop\St. George WPCP- Final Modelling-Dec 2010\3600 m3d-MLE-Ferric-Sludge-Avg.bwc
Carbonaceous OUR 0.00 mgO/L/hrNitrogenous OUR 0.00 mgO/L/hrNet. ammonia removal rate -0.68 mgN/L/hrNitrate production rate 0.00 mgN/L/hrNitrite production rate 4.89 mgN/L/hrNitrate removal rate 4.89 mgN/L/hrNitrite removal rate 4.98 mgN/L/hrNet. nitrate production rate -4.89 mgN/L/hrNet. nitrite production rate -0.09 mgN/L/hrDissolved N2 gas production rate 4.98 mgN/L/hrSpec. dissolved N2 gas production rate per VSS 2.46 mgN/gVSS/hrSpec. dissolved N2 gas production per VASS 5.99 mgN/gVASS/hrOTE 100.00 %OTR 0 kg/hrSOTE 100.00 %SOTR 0 kg/hrAir supply rate 0 m3/hr (20C, 101.325 kPa or 1 atm)Air flow rate / diffuser 0 m3/hr (20C, 101.325 kPa or 1 atm)# of diffusers 0Off gas flow rate (dry) 1.95 m3/hrOxygen content 0 %Carbon dioxide content 70.83 %Ammonia content 0.01 %Actual DO sat. conc. 9.65 mg/LVelocity gradient 69.31 1/s
Album page - Aerobic
AerobicParameters Conc. (mg/L) Mass rate (kg/d) NotesVolatile suspended solids 2011.02 43396.00Total suspended solids 3134.99 67650.19Particulate COD 2976.30 64225.74Filtered COD 24.14 520.89Total COD 3000.44 64746.63Soluble PO4-P 0.01 0.27Total P 121.74 2626.97Filtered TKN 2.55 54.93Particulate TKN 171.89 3709.33Total Kjeldahl Nitrogen 174.44 3764.26Filtered Carbonaceous BOD 1.09 23.54Total Carbonaceous BOD 713.79 15402.99Nitrite + Nitrate 4.79 103.45Total N 179.23 3867.71Total inorganic N 5.31 114.55Alkalinity 10.22 220.55 mmol/L and kmol/dpH 7.07Volatile fatty acids 0.01 0.26Total precipitated solids 566.20 12217.98Total inorganic suspended solids 1123.97 24254.19Ammonia N 0.51 11.10Nitrate N 4.67 100.79
Parameters Value UnitsHydraulic residence time 2.6 hoursFlow 21579.05 m3/dMLSS 3134.99 mg/LTotal solids mass 7241.84 kgTotal readily biodegradable COD 1.54 mg/LTotal oxygen uptake rate 19.41 mgO/L/hrCarbonaceous OUR 11.30 mgO/L/hrNitrogenous OUR 8.11 mgO/L/hrNet. ammonia removal rate 1.84 mgN/L/hrNitrate production rate 1.86 mgN/L/hrNitrite production rate 1.96 mgN/L/hrNitrate removal rate 0.09 mgN/L/hrNitrite removal rate 1.93 mgN/L/hr
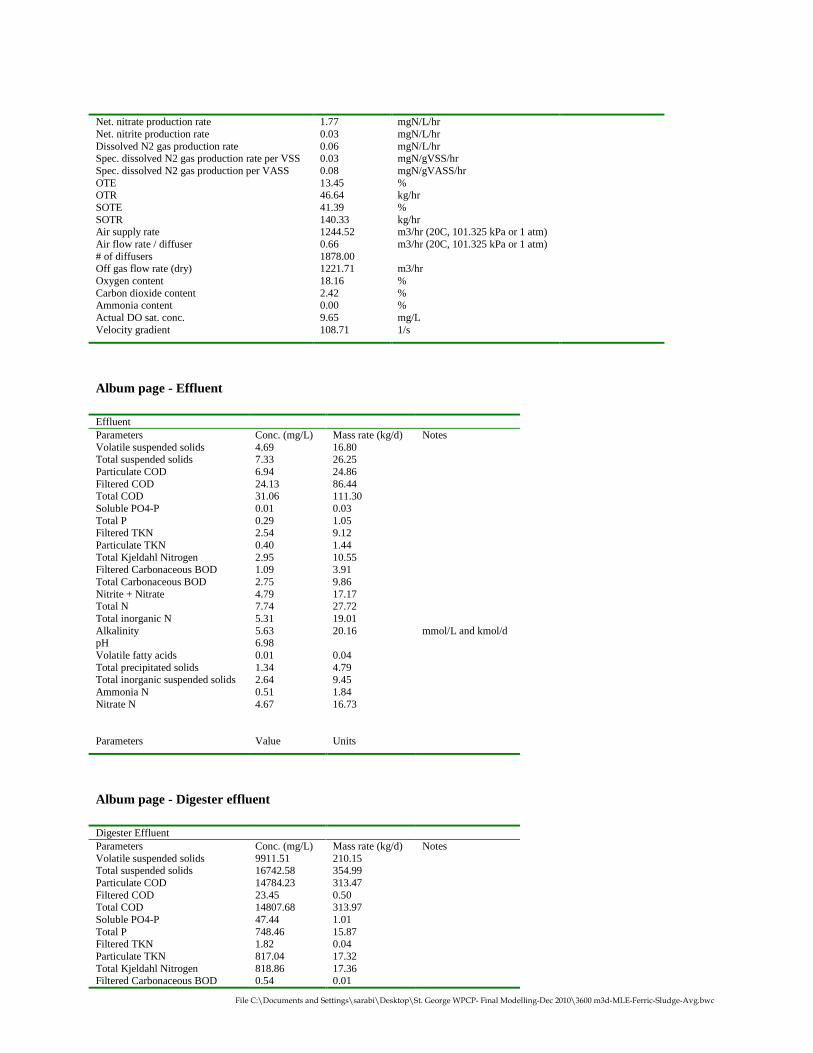
File C:\Documents and Settings\sarabi\Desktop\St. George WPCP- Final Modelling-Dec 2010\3600 m3d-MLE-Ferric-Sludge-Avg.bwc
Net. nitrate production rate 1.77 mgN/L/hrNet. nitrite production rate 0.03 mgN/L/hrDissolved N2 gas production rate 0.06 mgN/L/hrSpec. dissolved N2 gas production rate per VSS 0.03 mgN/gVSS/hrSpec. dissolved N2 gas production per VASS 0.08 mgN/gVASS/hrOTE 13.45 %OTR 46.64 kg/hrSOTE 41.39 %SOTR 140.33 kg/hrAir supply rate 1244.52 m3/hr (20C, 101.325 kPa or 1 atm)Air flow rate / diffuser 0.66 m3/hr (20C, 101.325 kPa or 1 atm)# of diffusers 1878.00Off gas flow rate (dry) 1221.71 m3/hrOxygen content 18.16 %Carbon dioxide content 2.42 %Ammonia content 0.00 %Actual DO sat. conc. 9.65 mg/LVelocity gradient 108.71 1/s
Album page - Effluent
EffluentParameters Conc. (mg/L) Mass rate (kg/d) NotesVolatile suspended solids 4.69 16.80Total suspended solids 7.33 26.25Particulate COD 6.94 24.86Filtered COD 24.13 86.44Total COD 31.06 111.30Soluble PO4-P 0.01 0.03Total P 0.29 1.05Filtered TKN 2.54 9.12Particulate TKN 0.40 1.44Total Kjeldahl Nitrogen 2.95 10.55Filtered Carbonaceous BOD 1.09 3.91Total Carbonaceous BOD 2.75 9.86Nitrite + Nitrate 4.79 17.17Total N 7.74 27.72Total inorganic N 5.31 19.01Alkalinity 5.63 20.16 mmol/L and kmol/dpH 6.98Volatile fatty acids 0.01 0.04Total precipitated solids 1.34 4.79Total inorganic suspended solids 2.64 9.45Ammonia N 0.51 1.84Nitrate N 4.67 16.73
Parameters Value Units
Album page - Digester effluent
Digester EffluentParameters Conc. (mg/L) Mass rate (kg/d) NotesVolatile suspended solids 9911.51 210.15Total suspended solids 16742.58 354.99Particulate COD 14784.23 313.47Filtered COD 23.45 0.50Total COD 14807.68 313.97Soluble PO4-P 47.44 1.01Total P 748.46 15.87Filtered TKN 1.82 0.04Particulate TKN 817.04 17.32Total Kjeldahl Nitrogen 818.86 17.36Filtered Carbonaceous BOD 0.54 0.01
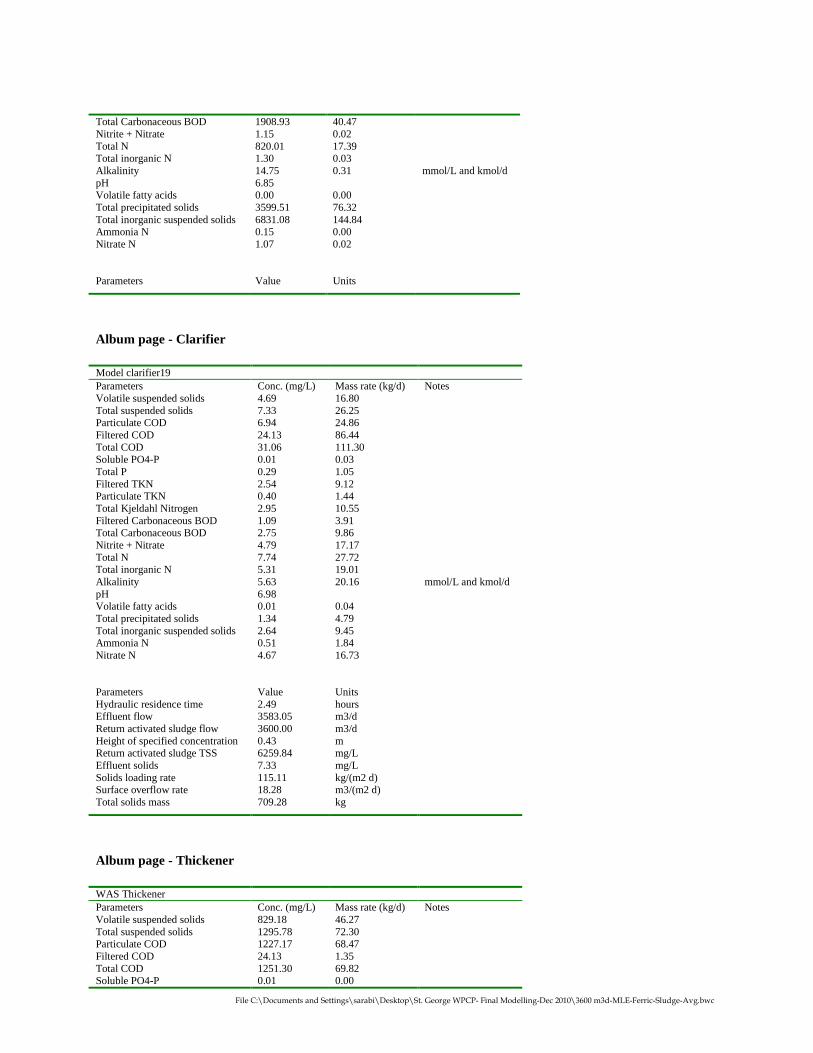
File C:\Documents and Settings\sarabi\Desktop\St. George WPCP- Final Modelling-Dec 2010\3600 m3d-MLE-Ferric-Sludge-Avg.bwc
Total Carbonaceous BOD 1908.93 40.47Nitrite + Nitrate 1.15 0.02Total N 820.01 17.39Total inorganic N 1.30 0.03Alkalinity 14.75 0.31 mmol/L and kmol/dpH 6.85Volatile fatty acids 0.00 0.00Total precipitated solids 3599.51 76.32Total inorganic suspended solids 6831.08 144.84Ammonia N 0.15 0.00Nitrate N 1.07 0.02
Parameters Value Units
Album page - Clarifier
Model clarifier19Parameters Conc. (mg/L) Mass rate (kg/d) NotesVolatile suspended solids 4.69 16.80Total suspended solids 7.33 26.25Particulate COD 6.94 24.86Filtered COD 24.13 86.44Total COD 31.06 111.30Soluble PO4-P 0.01 0.03Total P 0.29 1.05Filtered TKN 2.54 9.12Particulate TKN 0.40 1.44Total Kjeldahl Nitrogen 2.95 10.55Filtered Carbonaceous BOD 1.09 3.91Total Carbonaceous BOD 2.75 9.86Nitrite + Nitrate 4.79 17.17Total N 7.74 27.72Total inorganic N 5.31 19.01Alkalinity 5.63 20.16 mmol/L and kmol/dpH 6.98Volatile fatty acids 0.01 0.04Total precipitated solids 1.34 4.79Total inorganic suspended solids 2.64 9.45Ammonia N 0.51 1.84Nitrate N 4.67 16.73
Parameters Value UnitsHydraulic residence time 2.49 hoursEffluent flow 3583.05 m3/dReturn activated sludge flow 3600.00 m3/dHeight of specified concentration 0.43 mReturn activated sludge TSS 6259.84 mg/LEffluent solids 7.33 mg/LSolids loading rate 115.11 kg/(m2 d)Surface overflow rate 18.28 m3/(m2 d)Total solids mass 709.28 kg
Album page - Thickener
WAS ThickenerParameters Conc. (mg/L) Mass rate (kg/d) NotesVolatile suspended solids 829.18 46.27Total suspended solids 1295.78 72.30Particulate COD 1227.17 68.47Filtered COD 24.13 1.35Total COD 1251.30 69.82Soluble PO4-P 0.01 0.00

File C:\Documents and Settings\sarabi\Desktop\St. George WPCP- Final Modelling-Dec 2010\3600 m3d-MLE-Ferric-Sludge-Avg.bwc
Total P 50.20 2.80Filtered TKN 2.54 0.14Particulate TKN 70.87 3.95Total Kjeldahl Nitrogen 73.42 4.10Filtered Carbonaceous BOD 1.09 0.06Total Carbonaceous BOD 294.95 16.46Nitrite + Nitrate 4.79 0.27Total N 78.21 4.36Total inorganic N 5.31 0.30Alkalinity 7.42 0.41 mmol/L and kmol/dpH 6.98Volatile fatty acids 0.01 0.00Total precipitated solids 236.63 13.20Total inorganic suspended solids 466.61 26.04Ammonia N 0.51 0.03Nitrate N 4.67 0.26
Parameters Value UnitsHydraulic residence time 34.91 hoursEffluent flow 55.80 m3/dReturn activated sludge flow 21.20 m3/dHeight of specified concentration 0.80 mReturn activated sludge TSS 19323.13 mg/LEffluent solids 1295.78 mg/LSolids loading rate 17.21 kg/(m2 d)Surface overflow rate 1.99 m3/(m2 d)Total solids mass 548.94 kgPercent removal 85.00 %
Album page - Aerobic Digester
Aerobic DigesterParameters Conc. (mg/L) Mass rate (kg/d) NotesVolatile suspended solids 9911.51 210.15Total suspended solids 16742.60 354.99Particulate COD 14784.23 313.47Filtered COD 23.45 0.50Total COD 14807.68 313.97Soluble PO4-P 47.44 1.01Total P 748.46 15.87Filtered TKN 1.82 0.04Particulate TKN 817.04 17.32Total Kjeldahl Nitrogen 818.86 17.36Filtered Carbonaceous BOD 0.54 0.01Total Carbonaceous BOD 1908.93 40.47Nitrite + Nitrate 1.15 0.02Total N 820.01 17.39Total inorganic N 1.30 0.03Alkalinity 14.48 0.31 mmol/L and kmol/dpH 6.86Volatile fatty acids 0.00 0.00Total precipitated solids 3599.53 76.32Total inorganic suspended solids 6831.09 144.84Ammonia N 0.15 0.00Nitrate N 1.07 0.02
Parameters Value UnitsHydraulic residence time 314.7 hoursFlow 21.20 m3/dMLSS 16742.60 mg/LTotal solids mass 4654.44 kgTotal readily biodegradable COD 0.77 mg/LTotal oxygen uptake rate 12.53 mgO/L/hrCarbonaceous OUR 8.69 mgO/L/hrNitrogenous OUR 3.84 mgO/L/hrNet. ammonia removal rate 0.00 mgN/L/hr

File C:\Documents and Settings\sarabi\Desktop\St. George WPCP- Final Modelling-Dec 2010\3600 m3d-MLE-Ferric-Sludge-Avg.bwc
Nitrate production rate 1.11 mgN/L/hrNitrite production rate 1.92 mgN/L/hrNitrate removal rate 1.12 mgN/L/hrNitrite removal rate 1.92 mgN/L/hrNet. nitrate production rate -0.01 mgN/L/hrNet. nitrite production rate 0.00 mgN/L/hrDissolved N2 gas production rate 0.78 mgN/L/hrSpec. dissolved N2 gas production rate per VSS 0.08 mgN/gVSS/hrSpec. dissolved N2 gas production per VASS 0.34 mgN/gVASS/hrOTE 16.83 %OTR 3.48 kg/hrSOTE 41.59 %SOTR 8.41 kg/hrAir supply rate 74.22 m3/hr (20C, 101.325 kPa or 1 atm)Air flow rate / diffuser 0.48 m3/hr (20C, 101.325 kPa or 1 atm)# of diffusers 154.00Off gas flow rate (dry) 72.44 m3/hrOxygen content 17.43 %Carbon dioxide content 3.23 %Ammonia content 0.00 %Actual DO sat. conc. 10.07 mg/LVelocity gradient 86.02 1/sVSS destruction 19.84 %
Album page – Digester Effluent
Digester EffluentParameters Conc. (mg/L) Mass rate (kg/d) NotesVolatile suspended solids 9911.51 210.15Total suspended solids 16742.58 354.99Particulate COD 14784.23 313.47Filtered COD 23.45 0.50Total COD 14807.68 313.97Soluble PO4-P 47.44 1.01Total P 748.46 15.87Filtered TKN 1.82 0.04Particulate TKN 817.04 17.32Total Kjeldahl Nitrogen 818.86 17.36Filtered Carbonaceous BOD 0.54 0.01Total Carbonaceous BOD 1908.93 40.47Nitrite + Nitrate 1.15 0.02Total N 820.01 17.39Total inorganic N 1.30 0.03Alkalinity 14.75 0.31 mmol/L and kmol/dpH 6.85Volatile fatty acids 0.00 0.00Total precipitated solids 3599.51 76.32Total inorganic suspended solids 6831.08 144.84Ammonia N 0.15 0.00Nitrate N 1.07 0.02
Parameters Value Units


![Index [ftp.feq.ufu.br]ftp.feq.ufu.br/Luis_Claudio/Books/E-Books... · Aeration-agitation 20, 46 Aeration-agitation bioreactor 58, 62 Aerobic fermentation 3, 18 1 Aerobic metabolic](https://static.fdocuments.us/doc/165x107/5ecd4084c5979741945851bb/index-ftpfequfubrftpfequfubrluisclaudiobookse-books-aeration-agitation.jpg)


