sss.usf.edusss.usf.edu/resources/presentations/2015/essei/Absenses-Add-Up...violence, unreliable...
16
Absences Add Up: How School Attendance .SĆZJSHJX 8YZIJSY 8ZHHJXX By Alan Ginsburg, Phyllis Jordan and Hedy Chang August 2014 This analysis of national testing data shows that students with higher absenteeism rates have lower scores on national standardized tests. It reinforce a growing body of research confirming the connection between school attendance and student achievement and reveals the critical importance of intervening as soon as absences begin to add up, whether early in a child’s school career or at the beginning of the school year. The good news is poor attendance can be turned around when policies and practices encourage schools and communities to partner with students and their families to monitor their data and implement promising and proven practices.
Transcript of sss.usf.edusss.usf.edu/resources/presentations/2015/essei/Absenses-Add-Up...violence, unreliable...

Absences Add Up: How School Attendance .SĆZJSHJX�8YZIJSY�8ZHHJXX
By Alan Ginsburg, Phyllis Jordan and Hedy Chang August 2014
This analysis of national testing data shows that students with higher absenteeism rates have lower scores on national standardized tests. It reinforce a growing body of research confirming the connection between school attendance and student achievement and reveals the critical importance of intervening as soon as absences begin to add up, whether early in a child’s school career or at the beginning of the school year. The good news is poor attendance can be turned around when policies and practices encourage schools and communities to partner with students and their families to monitor their data and implement promising and proven practices.

2
Absences Add Up | Attendance Works
Amid the sometimes fierce debate about improving our nation’s schools lies an indisputable truth: Students must
attend school regularly to benefit from what is taught there. But each year, an estimated 5 million to 7.5 million U.S.
students miss nearly a month of school. This lost instructional time exacerbates dropout rates and achievement
gaps. It erodes the promise of early education and confounds efforts to master reading by the end of third grade. Too
often, though, states and school districts overlook this problem because they simply aren’t looking at the right data.
They know how many students show up for school every day and how many are truant, but they don’t add up all
absences — excused and unexcused — to see how many students miss so many days that they are headed off track
academically.
A new state-by-state analysis of national testing data demonstrates that students who miss more school than their
peers score lower on the National Assessment for Educational Progress (NAEP). This is true at every age, in every racial
and ethnic group and in every state and city examined. In many cases, the students with more absences have skill
levels one to two years below their peers. While students from low-income families are more likely to be chronically
absent, the ill effects of missing too much school hold true for all socio-economic groups.
This analysis of results from the 2013 NAEP offers a unique nationwide and state-by-state snapshot of how students
with poor attendance perform compared to their better attending peers. The NAEP, considered the Nation’s Report
Card, is given every two years to a sample of
fourth- and eighth-grade students in all 50 states
and 21 large cities. In addition to testing math and
reading skills, NAEP asks students a series of non-
academic questions, including how many days
they missed in the month before the exam, which
is typically given from late January to early March.
This analysis defines poor attendance as missing
three or more days in that period, regardless of
whether the absences were excused or unexcused.
While the information is self-reported and limited
to a single month, the results nonetheless reflect
many of the achievement and demographic
trends found in research involving data from the
entire year. The state-by-state data, as well as the
city information, provide comparison points for
states and cities that have not looked closely at
their rates for excused and unexcused absences.
The information also underscores the need for
states and cities to take a deeper dive into their
own data to analyze chronic absence for an entire
school year so that they know the full scope of the
attendance problem.
DEFINING TERMS
Average Daily Attendance: The percentage of a
school’s student body that attends on a typical day.
The definition is the same nationwide, but does not
provide student-level data.
Truancy: A measure of how many students miss
school without an excuse. The definition varies from
state to state.
Chronic absence: A measure of how many students
miss a certain percentage or number of days,
including excused and unexcused absences and
suspensions. Researchers often track 10 percent of
the school year, but there is no common definition
among states.
Poor Attendance in NAEP: Missing 3 or more days in
the month before the assessment.
3
Absences Add Up | Attendance Works
Key Findings include:1. Poor attendance is a national challenge. About one in five students in both fourth and eighth grade reported
missing three or more days in the month before the test. If that pattern persisted all year, the students would have
missed 27 days or about 15 percent of the school year. About 3 percent of students missed 10 or more days in the
prior month, a level of absenteeism associated with the weakest scores.
• While absenteeism was a problem in every state, some states had greater rates of students
missing three or more days in the prior month. Montana and New Mexico had among the
worst statewide absenteeism rates at the fourth grade level, with 25 percent or more of students
reporting that they missed 3 or more days prior to the assessment. At the eighth grade level, they are joined
by Arizona, Oklahoma, Oregon and Wyoming. (See Appendix I for state-by-state tables)
• California, Georgia, Illinois, Indiana, Massachusetts, New Hampshire, Texas and the Department of Defense
schools have the best reported rates of attendance at the fourth grade level, using the same standard of
missing 3 or more days in the prior month. In eighth grade, the states with the best records are Georgia, Illinois,
Indiana, Massachusetts, Texas, Vermont and DOD schools.
• Absenteeism rates are especially high in some of the 21 large cities where the NAEP is administered to a
sample of students. In Detroit, for instance, about a third of the students reported missing three or more
days in the past month, compared to the 20 percent national average. Cleveland, the District of Columbia,
Milwaukee and Philadelphia also had high rates. (See Appendix 1 for city-by-city tables).
• Absenteeism rates of 3 or more days were consistently the lowest in the large urban districts of Houston and
Miami-Dade.
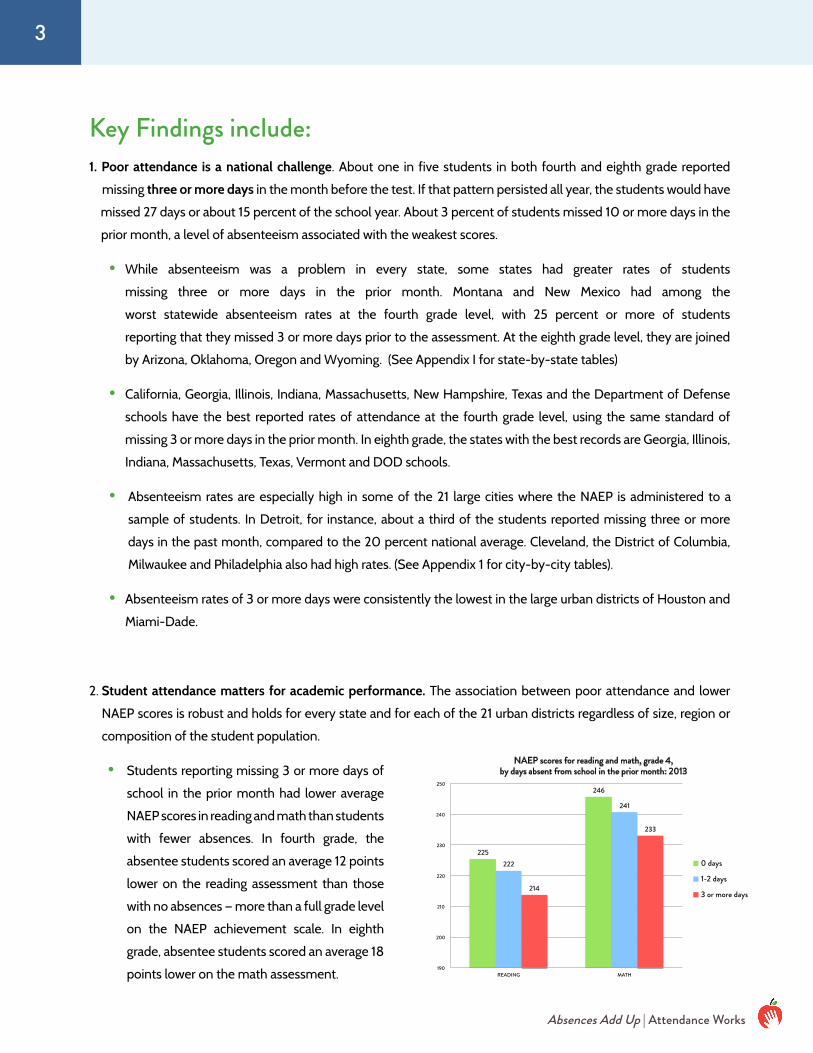
2. Student attendance matters for academic performance. The association between poor attendance and lower
NAEP scores is robust and holds for every state and for each of the 21 urban districts regardless of size, region or
composition of the student population.
• Students reporting missing 3 or more days of
school in the prior month had lower average
NAEP scores in reading and math than students
with fewer absences. In fourth grade, the
absentee students scored an average 12 points
lower on the reading assessment than those
with no absences — more than a full grade level
on the NAEP achievement scale. In eighth
grade, absentee students scored an average 18
points lower on the math assessment.
225
246
222
241
214
233
190
200
210
220
230
240
250
READING MATH
NAEP scores for reading and math, grade 4, by days absent from school in the prior month: 2013
0 days
1-2 days
3 or more days

4
Absences Add Up | Attendance Works
• Along with test scores, proficiency rates were lower for
students who missed more school. About 28 percent
of the students missing three or more days in the
prior month scored proficient or better on the fourth
grade reading assessment, compared to 38 percent
of those who missed no days in the prior month.
3. Poor attendance contributes to the achievement gap for students struggling with poverty and from
communities of color.
• Students eligible for free and reduced price meals,
a common marker for low-income status, are more
likely to miss three days or more in the prior month.
In fourth grade, these students are 30 percent more
likely to miss that much school. In eighth grade they
are 40 percent more likely.
• Low-income students generally scored lower on
the NAEP than their more affluent peers, although
the students from all socio-economic groups
experienced lower test scores when they missed
too much school. Low-income fourth graders with
poor attendance scored 10 points (equivalent to
one grade on the NAEP scale) lower than those with
perfect attendance. For fourth graders from more
affluent families, the difference was 8 points.
• Native-American students reported the highest rates
of poor attendance, and Asian/Pacific Islanders
experienced the lowest rates, findings consistent
with several state and local analyses. African
American and Hispanic students have rates slightly
higher than white students. Again, students from all
racial and ethnic groups experienced lower scores
when they had higher rates of absenteeism.
For supplementary data tables, go to:
http://www.attendanceworks.org/research/absences-add-supplementary-materials
271
290
269
285
258
272
240
250
260
270
280
290
300
READING MATH
NAEP scores for reading and math, grade 8, by days absent from school in the prior month: 2013
0 days
1-2 days
3 or more days
19 19 22 22
20 21
13 10
29 31
0
5
10
15
20
25
30
35
Grade 4 Grade 8
Percentages of students by days absent 3 or more days from school in the prior month and race/ethnicity,
grade 4 and 8: 2013
White
Black
Hispanic
Asian/Pacific Islander
American Indian/Alaska Native

5
Absences Add Up | Attendance Works
The Research CaseThe NAEP analysis reinforces a growing body of research showing the pernicious effects of chronic absence
throughout a student’s academic career. We know:
• Poor attendance in the first month of school can predict chronic absence for the entire year. A new study
by the Baltimore Education Research Consortium found that half the students who missed two to four days
in September went on to be chronically absent for the year, missing an average of 25 days. Nine out of 10
students who missed at least 5 days in September were chronically absent, averaging 70 absences. (See
Appendix II for more details)
• Absenteeism in kindergarten can affect whether a child develops the grit and perseverance needed to
succeed in school. A recently released study by researcher Michael Gottfried at the University of California,
Santa Barbara shows the negative impact of chronic absenteeism on both academic performance and
social-emotional skills needed to persist and engage in learning. The effects are particularly pronounced
among students who miss four or more weeks of school. (See Appendix II for more details)
• Absenteeism in preschool and kindergarten can influence whether a child will be held back in third grade.
Several studies document a link between chronic absence — missing 10 percent of the school year — in the
early grades and a child’s ability to master reading by the end of third grade. Researchers in Baltimore and
Chicago found the effects starting in preschool. With 14 states now linking third grade promotion to reading
performance, chronic absence can undermine the broader efforts to improve literacy. (See Apendix II for
more details)
• Absenteeism in middle and high school can predict dropout rates. As early as 6th grade, absenteeism
becomes an indicator that a student will drop out, Johns Hopkins University research shows. Other early
warning signs include poor grades in core courses and behavior leading to suspensions. A statewide study
in Utah found that a student who is chronically absent in any year between 8th and 12th grade is 7.4 times
more likely to drop out.
• Absenteeism influences not just chances for graduating but also for completing college. A new analysis
of Rhode Island data found that only 11 percent of the chronically absent students who graduated from
high school made it to a second year of college, compared to 51 percent of students with better high school
attendance records.
• Improving attendance is an essential strategy for reducing achievement gaps. State and national data
shows that students from low-income families are more likely to be chronically absent than their peers,
often because they face challenges to getting to school, such as a lack of access to health care, community
violence, unreliable transportation and unstable housing. Low-income students also lose out more when
they are absent, perhaps because their families lack resources to make up for lost time, research shows.
Children of color also have disproportionately higher rates of absenteeism and lower achievement levels.
Some local research has found chronic absence occurs much earlier for some groups, including African
American students, than others. In this case, it is essential to intervene early to ensure an equal opportunity
to learn.
6
Absences Add Up | Attendance Works
• When students reduce absences, they can make academic gains. When Chicago focused on attendance
and other risk factors in ninth grade, graduation rates rose. When New York City reduced chronic absence
rates through it success mentoring program, more students stayed in school until graduation. In the early
grades, several studies suggest that the children who arrived with the weakest skills and attended regularly
saw outsized gains in achievement.
• Research points to effective strategies for improving attendance. Early warning systems, like that used in
Chicago, and programs that offer preventative supports early in the school year, like New York City’s Success
Mentors, are evidence-based approaches that prevent or reduce chronic absence. Effective strategies use
data to target action, engage students and families working together to improve attendance, and bring in
extra resources (health, social, transportation etc.) to support those struggling with chronic absenteeism.
Taken together with other research, the NAEP analysis shows definitively how absenteeism can undermine student
achievement and our goals for school improvements. Research and experience also shows that when we turn around
chronic absence, we can turn around the trajectory of a student’s academic career. Parents, schools and state leaders
can work together to ensure we pay attention to student absenteeism and intervene to put students back on track
for success.
See Appendix II for more details on recent research
RecommendationsThe extent of absenteeism that the NAEP analysis and others studies document from kindergarten through high
school, along with its direct connection to student achievement, demands that school districts and state education
agencies take action to staunch the loss of valuable instructional time. This is important for educators and policymakers
investing in early education to ensure students have a strong start in school. This is critical for those working to ensure
all children master reading before moving into fourth grade. And this is paramount for those working to increase our
nation’s graduation rates and improve our standing in the 21st century economy. We have a better chance of meeting
goals if we have more students attending school regularly.
Policymakers and advocates at the local, state and federal level can take several key steps to support this work including:
1. Standard definition. Promote a standard definition in order to calculate chronic absenteeism across districts
and states. The definition should clarify that chronic absence includes excused and unexcused absences
(truancy), as well as days missed to suspensions or children switching schools. At a minimum, a standard
definition should exist for each state so they can compare rates across all of their schools and districts.
We also recommend exploring the development of a national definition of chronic absence for the purpose
of reporting and comparing rates across states. A 2014 analysis by the Data Quality Campaign found that only
17 states report that they track chronic absence, and few use the same definition. This NAEP analysis provides
the first consistent measure of student-level absenteeism that allows for comparison across states, but it is

7
Absences Add Up | Attendance Works
only a snapshot in time. A better measure for state-by-state comparison would be the proportion of students
missing 10 percent of the school year. This definition, recommended by Attendance Works, can be applied to
districts regardless of the length of school year and allows for earlier attention to intervention.
If adopted, a standard national metric could be used for reporting purposes only. States would retain the
authority to define chronic absence for the purposes of accountability within their own states based upon their
own realities and historical practice.
2. Attendance Tracking: Invest in tracking individual attendance and absences with longitudinal student databases.
Most school district data systems include this information, but this Data Quality Campaign brief shows six
states do not include it in statewide systems. Support accurate and consistent entry of attendance data.
3. Chronic Absence Data: Ensure that reports providing chronic absence data for every district, school, grade and
student subgroup are produced and made publicly available through school and district report cards. School
districts can also send the data — broken down by grade, school and other indicators — to principals and
teachers regularly so that they can address barriers to attendance or reach out to students with high rates of
absenteeism.
4. Parent Engagement: Provide parents with actionable, real-time data on their children’s attendance, as well as
an alert if their children are accruing so many absences — excused and unexcused — that they are academically
at risk. Ensure opportunities exist for school staff or community partners to meet with parents to review the
data on absenteeism for their children and identify how to work together to improve attendance.
5. Public awareness: Convey why absenteeism matters for doing well in school, graduating from high school and
eventually succeeding in the workplace. Encourage schools to promote good attendance for all students with
incentives, contests and positive messaging.
6. Strategies for intervening: Help schools and community partners to intervene with chronically absent students
through community-wide approaches to health and transportation challenges, as well as personalized
outreach. These interventions can use data from the first month of school and from the past year, along
with other factors, to identify which students are at risk of chronic absence. The students and their families
should be a priority for linking to positive supports that motivate good attendance. For additional insights into
effective strategies, see The Power of Positive Connections: Reducing Chronic Absence Through PEOPLE:
Priority Early Outreach for Positive Linkages and Engagement
7. Early Warning for Third-Grade Retention: Address poor attendance as a red flag that students need extra
support to read well by the end of third grade. This is especially important in states with retention policies that
hold back struggling third grade readers. As early as kindergarten, schools should look at absenteeism, along
with reading assessments, to identify which students need support.
8. Early Warning for High School Dropout: Adopt early warning indicator systems that track attendance and
other warning signs that students may drop out of high school. As early as middle school, school districts
should track absenteeism, as well as course failure and disciplinary action, to determine which students are off
track for graduation.

8
Absences Add Up | Attendance Works
9. Accountability: Build chronic absence into
accountability systems so that district and
school improvement plans include strategies
for nurturing a culture of attendance, partnering
with students and families to identify and
address causes of absences, and intervening
effectively with chronically absent students.
10. Resource Allocation: Use chronic absence
rates to determine allocation of community
resources, such as where to place health
services, early education and afterschool
programs and volunteer tutors. These
resources have proven successful in reducing
absenteeism.
11. Research: Invest in qualitative and quantitative
research to identify what are effective solutions
for different racial and ethnic populations and
age groups, as well as in different settings
such as inner-city neighborhoods and rural
communities. While the research shows
that absenteeism affects outcomes for
students of all backgrounds, it is important to
recognize that solutions must be grounded in
an understanding of the particular barriers to
attendance faced by students and families of
different linguistic, cultural, racial and socio-
economic backgrounds as well as the assets
different types of families and communities
bring to the table.
NAEP Scores and Grade Level Equivalency
The National Assessment of Educational Progress
(NAEP) rates student skill levels as basic, proficient or
advanced based on their scores on the assessments.
In addition, many students score below the basic
level. This report displays the association between
student attendance and the percent of students
achieving at the NAEP proficient level or above, as
proficiency represents solid academic performance
for each grade assessed. Note NAEP proficiency is a
national standard and does not equate with student
proficient performance on state-level tests, which
are set by each state.
NAEP Skill 4th Grade 8th Grade Level Scores Scores
Basic 208 243
Proficient 238 281
Advanced 268 323
Researchers who interpret NAEP data estimate that
10 points on the NAEP scale is the equivalent of
one grade worth of skills. That figure was derived
by dividing the roughly 40 points between grades 4
and 8 on the NAEP reading and math scales by 4 to
represent an average grade change.
9
Absences Add Up | Attendance Works
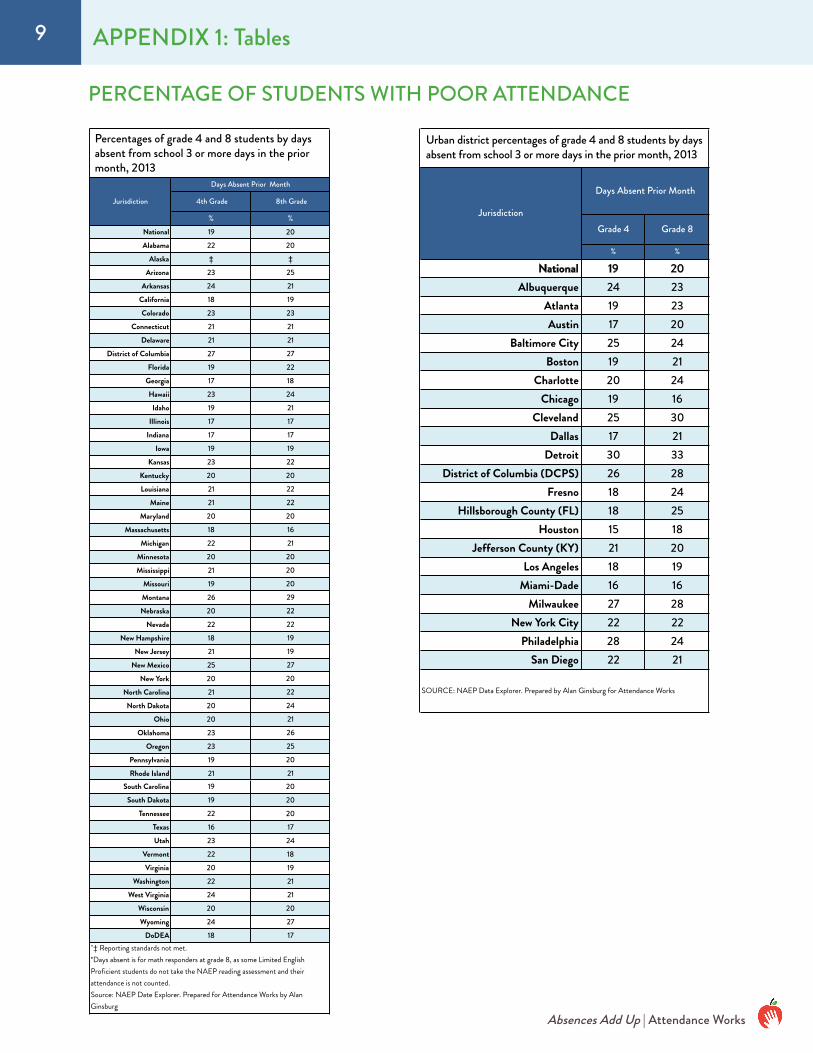
PERCENTAGE OF STUDENTS WITH POOR ATTENDANCE
Grade 4 Grade 8
% %
National 19 20Albuquerque 24 23
Atlanta 19 23Austin 17 20
Baltimore City 25 24Boston 19 21
Charlotte 20 24Chicago 19 16
Cleveland 25 30Dallas 17 21
Detroit 30 33District of Columbia (DCPS) 26 28
Fresno 18 24Hillsborough County (FL) 18 25
Houston 15 18Jefferson County (KY) 21 20
Los Angeles 18 19Miami-Dade 16 16
Milwaukee 27 28New York City 22 22
Philadelphia 28 24San Diego 22 21
Table 3. Urban district percentages of grade 4 and 8 students by days absent from school 3 or more days in the prior month: 2013
Jurisdiction
Days Absent Prior Month
SOURCE: NAEP Data Explorer. Prepared by Alan Ginsburg for Attendance Works
4th Grade
%National 19Alabama 22
Alaska ‡Arizona 23
Arkansas 24California 18Colorado 23
Connecticut 21Delaware 21
District of Columbia 27Florida 19
Georgia 17Hawaii 23
Idaho 19Illinois 17
Indiana 17Iowa 19
Kansas 23Kentucky 20Louisiana 21
Maine 21Maryland 20
Massachusetts 18Michigan 22
Minnesota 20Mississippi 21
Missouri 19Montana 26Nebraska 20
Nevada 22New Hampshire 18
New Jersey 21New Mexico 25
New York 20North Carolina 21
North Dakota 20Ohio 20
Oklahoma 23Oregon 23
Pennsylvania 19Rhode Island 21
20
Table . Percentages of grade 4 and 8 students by days absent from school 3 or more days in the prior month, 2013
Jurisdiction
Days Absent Prior Month
8th Grade
%
24
20‡252119232121272218
20
2117171922202222201621
21
2020292222191927202224
26252021
South Carolina 19South Dakota 19
Tennessee 22Texas 16Utah 23
Vermont 22Virginia 20
Washington 22West Virginia 24
Wisconsin 20Wyoming 24
DoDEA 18
21
20202017241819
21202717
"‡ Reporting standards not met.*Days absent is for math responders at grade 8, as some Limited English Proficient students do not take the NAEP reading assessment and their attendance is not counted.Source: NAEP Date Explorer. Prepared for Attendance Works by Alan Ginsburg
APPENDIX 1: Tables
Percentages of grade 4 and 8 students by days absent from school 3 or more days in the prior month, 2013
Urban district percentages of grade 4 and 8 students by days absent from school 3 or more days in the prior month, 2013
10
Absences Add Up | Attendance Works
West Virginia 218 215 210 8Wisconsin 224 221 214 10Wyoming 227 227 223 3
DoDEA 234 233 226 8*A 10 point difference is about equivalent to a one-year gain on NAEP between grades 4 and 8.
*A 10 point difference is about equivalent to a one-year gain on NAEP between grades 4 and 8.‡ Reporting standards not met.
SOURCE: NAEP Data Explorer. Prepared for Attendance Works by Alan Ginsburg
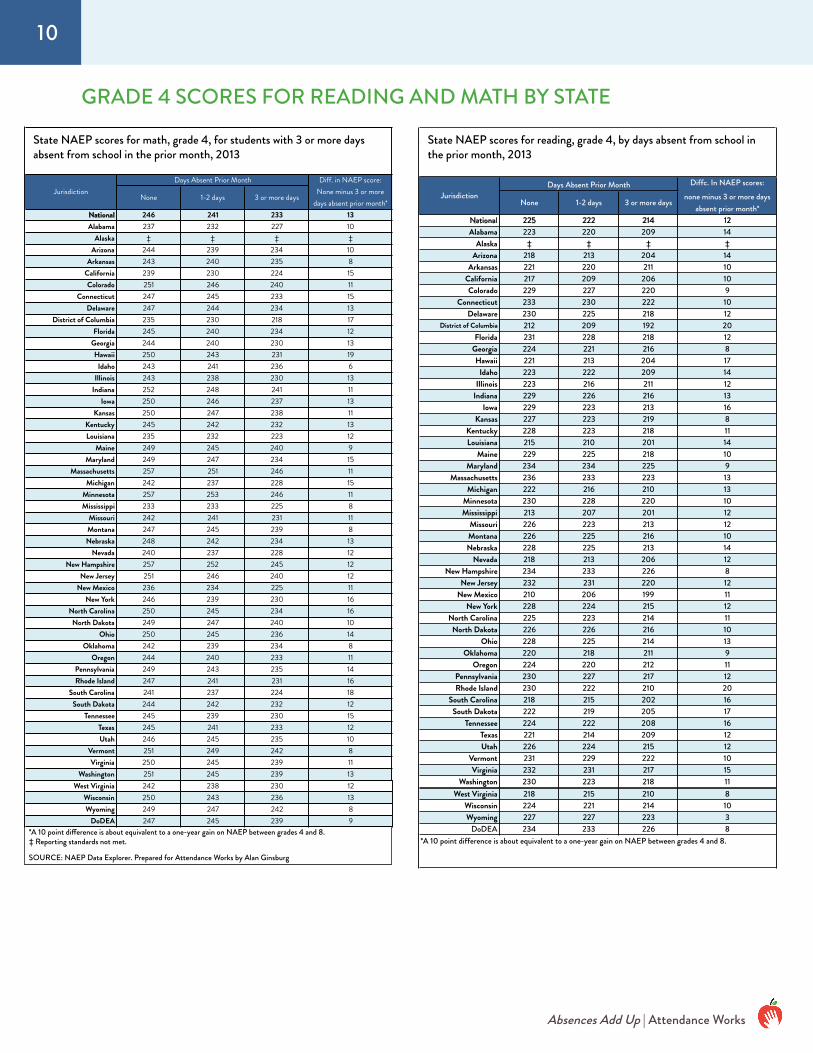
National 246 241 233 13Alabama 237 232 227 10
Alaska ‡ ‡ ‡ ‡Arizona 244 239 234 10
Arkansas 243 240 235 8California 239 230 224 15Colorado 251 246 240 11
Connecticut 247 245 233 15Delaware 247 244 234 13
District of Columbia 235 230 218 17Florida 245 240 234 12
Georgia 244 240 230 13Hawaii 250 243 231 19
Idaho 243 241 236 6Illinois 243 238 230 13
Indiana 252 248 241 11Iowa 250 246 237 13
Kansas 250 247 238 11Kentucky 245 242 232 13Louisiana 235 232 223 12
Maine 249 245 240 9Maryland 249 247 234 15
Massachusetts 257 251 246 11Michigan 242 237 228 15
Minnesota 257 253 246 11Mississippi 233 233 225 8
Missouri 242 241 231 11Montana 247 245 239 8Nebraska 248 242 234 13
Nevada 240 237 228 12New Hampshire 257 252 245 12
New Jersey 251 246 240 12New Mexico 236 234 225 11
New York 246 239 230 16North Carolina 250 245 234 16
North Dakota 249 247 240 10Ohio 250 245 236 14
Oklahoma 242 239 234 8Oregon 244 240 233 11
Pennsylvania 249 243 235 14Rhode Island 247 241 231 16
South Carolina 241 237 224 18South Dakota 244 242 232 12
Tennessee 245 239 230 15Texas 245 241 233 12Utah 246 245 235 10
Vermont 251 249 242 8Virginia 250 245 239 11
Washington 251 245 239 13
Table . State NAEP scores for math, grade 4, for students with 3 or more days absent from school in the prior month: 2013
JurisdictionDays Absent Prior Month
None 1-2 days 3 or more days
Diff. in NAEP score: None minus 3 or more
days absent prior month*
West Virginia 242 238 230 12Wisconsin 250 243 236 13Wyoming 249 247 242 8
DoDEA 247 245 239 9
Diffc. In NAEP scores:
National 225 222 214 12Alabama 223 220 209 14
Alaska ‡ ‡ ‡ ‡Arizona 218 213 204 14
Arkansas 221 220 211 10California 217 209 206 10Colorado 229 227 220 9
Connecticut 233 230 222 10Delaware 230 225 218 12
District of Columbia 212 209 192 20Florida 231 228 218 12
Georgia 224 221 216 8Hawaii 221 213 204 17
Idaho 223 222 209 14Illinois 223 216 211 12
Indiana 229 226 216 13Iowa 229 223 213 16
Kansas 227 223 219 8Kentucky 228 223 218 11Louisiana 215 210 201 14
Maine 229 225 218 10Maryland 234 234 225 9
Massachusetts 236 233 223 13Michigan 222 216 210 13
Minnesota 230 228 220 10Mississippi 213 207 201 12
Missouri 226 223 213 12Montana 226 225 216 10Nebraska 228 225 213 14
Nevada 218 213 206 12New Hampshire 234 233 226 8
New Jersey 232 231 220 12New Mexico 210 206 199 11
New York 228 224 215 12North Carolina 225 223 214 11
North Dakota 226 226 216 10Ohio 228 225 214 13
Oklahoma 220 218 211 9Oregon 224 220 212 11
Pennsylvania 230 227 217 12Rhode Island 230 222 210 20
South Carolina 218 215 202 16South Dakota 222 219 205 17
Tennessee 224 222 208 16Texas 221 214 209 12Utah 226 224 215 12
Vermont 231 229 222 10Virginia 232 231 217 15
Washington 230 223 218 11
None 1-2 days 3 or more days
Table 2. State NAEP scores for reading, grade 4, by days absent from school in the prior month: 2013
JurisdictionDays Absent Prior Month
none minus 3 or more days absent prior month*
West Virginia 218 215 210 8Wisconsin 224 221 214 10Wyoming 227 227 223 3
DoDEA 234 233 226 8*A 10 point difference is about equivalent to a one-year gain on NAEP between grades 4 and 8.
GRADE 4 SCORES FOR READING AND MATH BY STATE
State NAEP scores for math, grade 4, for students with 3 or more days absent from school in the prior month, 2013
State NAEP scores for reading, grade 4, by days absent from school in the prior month, 2013
11
Absences Add Up | Attendance Works
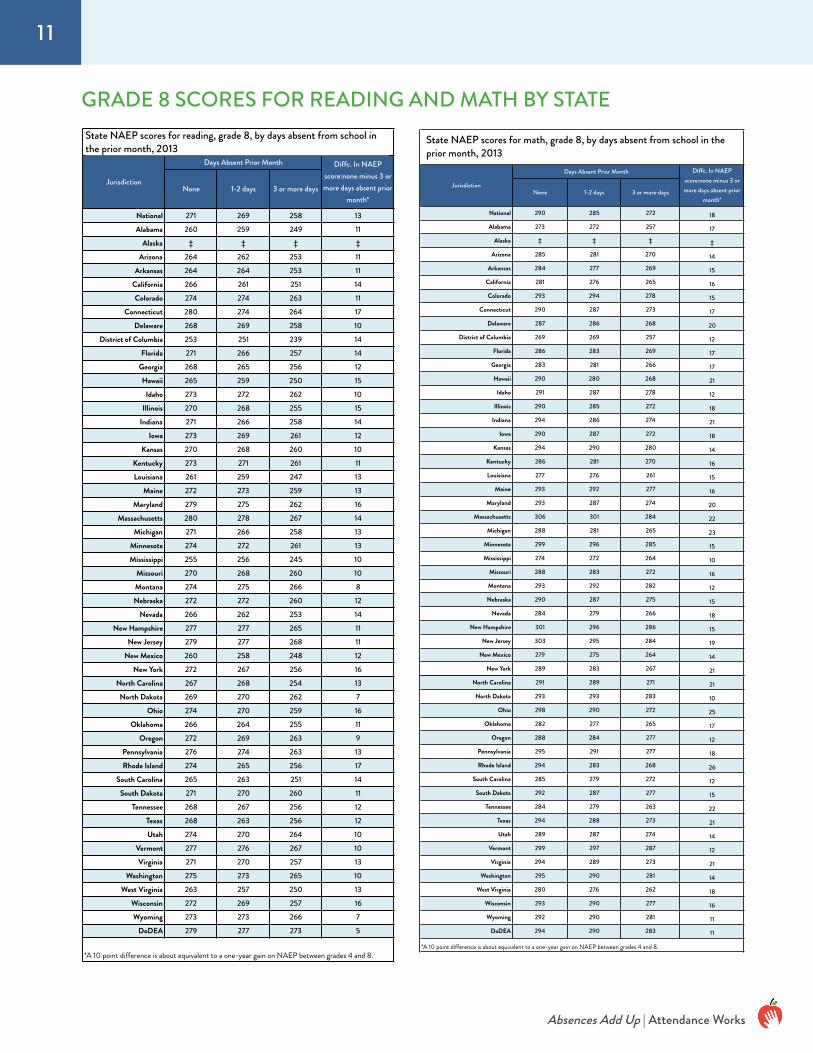
National 271 269 258 13Alabama 260 259 249 11
Alaska ‡ ‡ ‡ ‡Arizona 264 262 253 11
Arkansas 264 264 253 11California 266 261 251 14Colorado 274 274 263 11
Connecticut 280 274 264 17Delaware 268 269 258 10
District of Columbia 253 251 239 14Florida 271 266 257 14
Georgia 268 265 256 12Hawaii 265 259 250 15
Idaho 273 272 262 10Illinois 270 268 255 15
Indiana 271 266 258 14Iowa 273 269 261 12
Kansas 270 268 260 10Kentucky 273 271 261 11Louisiana 261 259 247 13
Maine 272 273 259 13Maryland 279 275 262 16
Massachusetts 280 278 267 14Michigan 271 266 258 13
Minnesota 274 272 261 13Mississippi 255 256 245 10
Missouri 270 268 260 10Montana 274 275 266 8Nebraska 272 272 260 12
Nevada 266 262 253 14New Hampshire 277 277 265 11
New Jersey 279 277 268 11New Mexico 260 258 248 12
New York 272 267 256 16North Carolina 267 268 254 13
North Dakota 269 270 262 7Ohio 274 270 259 16
Oklahoma 266 264 255 11Oregon 272 269 263 9
Pennsylvania 276 274 263 13Rhode Island 274 265 256 17
South Carolina 265 263 251 14South Dakota 271 270 260 11
Table . State NAEP scores for reading, grade 8, by days absent from school in the prior month: 2013
Jurisdiction
Days Absent Prior Month Diffc. In NAEP score:none minus 3 or more days absent prior
month*None 1-2 days 3 or more days
Tennessee 268 267 256 12Texas 268 263 256 12Utah 274 270 264 10
Vermont 277 276 267 10Virginia 271 270 257 13
Washington 275 273 265 10West Virginia 263 257 250 13
Wisconsin 272 269 257 16Wyoming 273 273 266 7
DoDEA 279 277 273 5
*A 10 point difference is about equivalent to a one-year gain on NAEP between grades 4 and 8.
National 290 285 272 18Alabama 273 272 257 17
Alaska ‡ ‡ ‡ ‡Arizona 285 281 270 14
Arkansas 284 277 269 15California 281 276 265 16Colorado 293 294 278 15
Connecticut 290 287 273 17Delaware 287 286 268 20
District of Columbia 269 269 257 12Florida 286 283 269 17
Georgia 283 281 266 17Hawaii 290 280 268 21
Idaho 291 287 278 12Illinois 290 285 272 18
Indiana 294 286 274 21Iowa 290 287 272 18
Kansas 294 290 280 14Kentucky 286 281 270 16Louisiana 277 276 261 15
Maine 293 292 277 16Maryland 293 287 274 20
Massachusetts 306 301 284 22Michigan 288 281 265 23
Minnesota 299 296 285 15Mississippi 274 272 264 10
Missouri 288 283 272 16Montana 293 292 282 12Nebraska 290 287 275 15
Nevada 284 279 266 18New Hampshire 301 296 286 15
New Jersey 303 295 284 19New Mexico 279 275 264 14
New York 289 283 267 21
Table . State NAEP scores for mathematics, grade 8, by days absent from school in the prior month: 2013
Jurisdiction
Days Absent Prior Month Diffc. In NAEP score:none minus 3 or more days absent prior
month*None 1-2 days 3 or more days
North Carolina 291 289 271 21North Dakota 293 293 283 10
Ohio 298 290 272 25Oklahoma 282 277 265 17
Oregon 288 284 277 12Pennsylvania 295 291 277 18Rhode Island 294 283 268 26
South Carolina 285 279 272 12South Dakota 292 287 277 15
Tennessee 284 279 263 22Texas 294 288 273 21Utah 289 287 274 14
Vermont 299 297 287 12Virginia 294 289 273 21
Washington 295 290 281 14West Virginia 280 276 262 18
Wisconsin 293 290 277 16Wyoming 292 290 281 11
DoDEA 294 290 283 11
*A 10 point difference is about equivalent to a one-year gain on NAEP between grades 4 and 8.
GRADE 8 SCORES FOR READING AND MATH BY STATEState NAEP scores for reading, grade 8, by days absent from school in the prior month, 2013
State NAEP scores for math, grade 8, by days absent from school in the prior month, 2013
12
Absences Add Up | Attendance Works
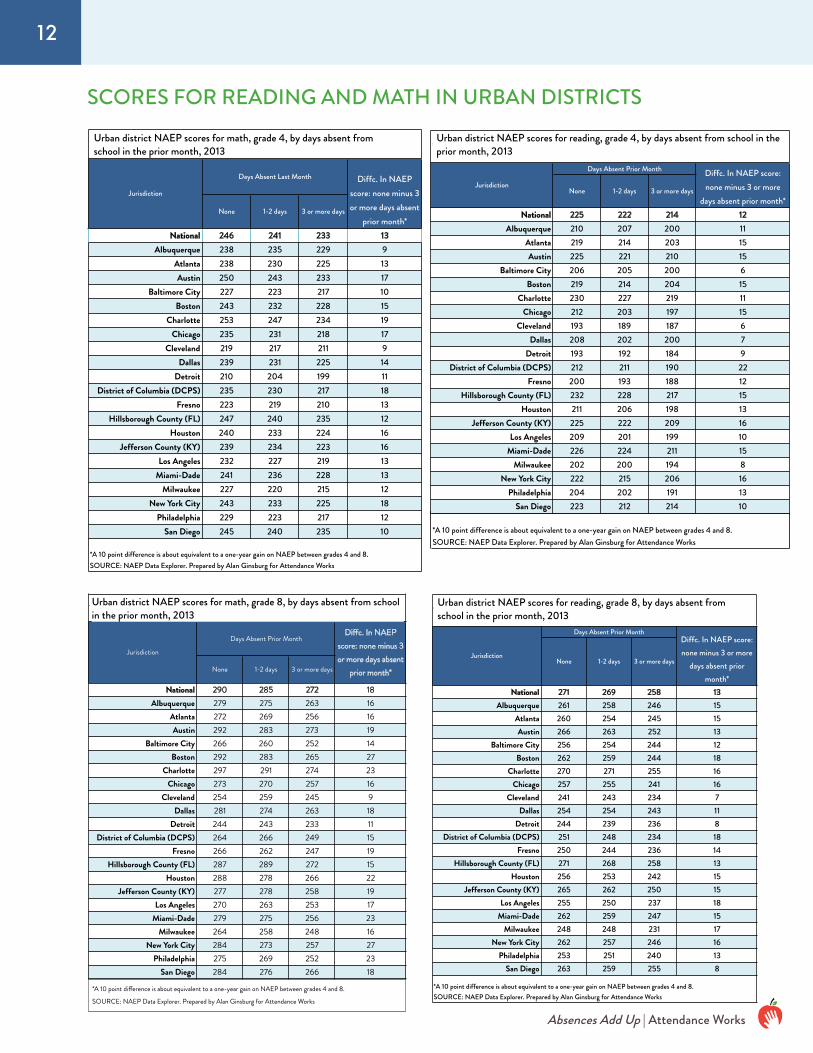
SCORES FOR READING AND MATH IN URBAN DISTRICTS
National 225 222 214 12Albuquerque 210 207 200 11
Atlanta 219 214 203 15Austin 225 221 210 15
Baltimore City 206 205 200 6Boston 219 214 204 15
Charlotte 230 227 219 11Chicago 212 203 197 15
Cleveland 193 189 187 6Dallas 208 202 200 7
Detroit 193 192 184 9District of Columbia (DCPS) 212 211 190 22
Fresno 200 193 188 12Hillsborough County (FL) 232 228 217 15
Houston 211 206 198 13Jefferson County (KY) 225 222 209 16
Los Angeles 209 201 199 10Miami-Dade 226 224 211 15
Milwaukee 202 200 194 8New York City 222 215 206 16
Philadelphia 204 202 191 13San Diego 223 212 214 10
*A 10 point difference is about equivalent to a one-year gain on NAEP between grades 4 and 8. SOURCE: NAEP Data Explorer. Prepared by Alan Ginsburg for Attendance Works
Table 2. Urban district NAEP scores for reading, grade 4, by days absent from school in the prior month: 2013
Jurisdiction
Days Absent Prior Month Diffc. In NAEP score: none minus 3 or more
days absent prior month*None 1-2 days 3 or more days
National 246 241 233 13Albuquerque 238 235 229 9
Atlanta 238 230 225 13Austin 250 243 233 17
Baltimore City 227 223 217 10Boston 243 232 228 15
Charlotte 253 247 234 19Chicago 235 231 218 17
Cleveland 219 217 211 9Dallas 239 231 225 14
Detroit 210 204 199 11District of Columbia (DCPS) 235 230 217 18
Fresno 223 219 210 13Hillsborough County (FL) 247 240 235 12
Houston 240 233 224 16Jefferson County (KY) 239 234 223 16
Los Angeles 232 227 219 13Miami-Dade 241 236 228 13
Milwaukee 227 220 215 12New York City 243 233 225 18
Philadelphia 229 223 217 12San Diego 245 240 235 10
Table 1. Urban district NAEP scores for math, grade 4, by days absent from school in the prior month: 2013
Jurisdiction
Days Absent Last Month Diffc. In NAEP score: none minus 3 or more days absent
prior month*3 or more days1-2 daysNone
*A 10 point difference is about equivalent to a one-year gain on NAEP between grades 4 and 8.SOURCE: NAEP Data Explorer. Prepared by Alan Ginsburg for Attendance Works
National 271 269 258 13Albuquerque 261 258 246 15
Atlanta 260 254 245 15Austin 266 263 252 13
Baltimore City 256 254 244 12Boston 262 259 244 18
Charlotte 270 271 255 16Chicago 257 255 241 16
Cleveland 241 243 234 7Dallas 254 254 243 11
Detroit 244 239 236 8District of Columbia (DCPS) 251 248 234 18
Fresno 250 244 236 14Hillsborough County (FL) 271 268 258 13
Houston 256 253 242 15Jefferson County (KY) 265 262 250 15
Los Angeles 255 250 237 18Miami-Dade 262 259 247 15
Milwaukee 248 248 231 17New York City 262 257 246 16
Philadelphia 253 251 240 13San Diego 263 259 255 8
None
Table 5. Urban district NAEP scores for reading, grade 8 by days absent from school in the prior month: 2013
Jurisdiction
Days Absent Prior MonthDiffc. In NAEP score: none minus 3 or more
days absent prior month*
*A 10 point difference is about equivalent to a one-year gain on NAEP between grades 4 and 8.SOURCE: NAEP Data Explorer. Prepared by Alan Ginsburg for Attendance Works
3 or more days1-2 days
National 290 285 272 18Albuquerque 279 275 263 16
Atlanta 272 269 256 16Austin 292 283 273 19
Baltimore City 266 260 252 14Boston 292 283 265 27
Charlotte 297 291 274 23Chicago 273 270 257 16
Cleveland 254 259 245 9Dallas 281 274 263 18
Detroit 244 243 233 11District of Columbia (DCPS) 264 266 249 15
Fresno 266 262 247 19Hillsborough County (FL) 287 289 272 15
Houston 288 278 266 22Jefferson County (KY) 277 278 258 19
Los Angeles 270 263 253 17Miami-Dade 279 275 256 23
Milwaukee 264 258 248 16New York City 284 273 257 27
Philadelphia 275 269 252 23San Diego 284 276 266 18
Table 4. Urban district NAEP scores for math, grade 8 by days absent from school in the prior month: 2013
Jurisdiction
Days Absent Prior MonthDiffc. In NAEP
score: none minus 3 or more days absent
prior month*None 3 or more days1-2 days
*A 10 point difference is about equivalent to a one-year gain on NAEP between grades 4 and 8.SOURCE: NAEP Data Explorer. Prepared by Alan Ginsburg for Attendance Works
Urban district NAEP scores for math, grade 4, by days absent from school in the prior month, 2013
Urban district NAEP scores for reading, grade 4, by days absent from school in the prior month, 2013
Urban district NAEP scores for math, grade 8, by days absent from school in the prior month, 2013
Urban district NAEP scores for reading, grade 8, by days absent from school in the prior month, 2013
National 246 241 233 13Albuquerque 238 235 229 9
Atlanta 238 230 225 13Austin 250 243 233 17
Baltimore City 227 223 217 10Boston 243 232 228 15
Charlotte 253 247 234 19Chicago 235 231 218 17
Cleveland 219 217 211 9Dallas 239 231 225 14
Detroit 210 204 199 11District of Columbia (DCPS) 235 230 217 18
Fresno 223 219 210 13Hillsborough County (FL) 247 240 235 12
Houston 240 233 224 16Jefferson County (KY) 239 234 223 16
Los Angeles 232 227 219 13Miami-Dade 241 236 228 13
Milwaukee 227 220 215 12New York City 243 233 225 18
Philadelphia 229 223 217 12San Diego 245 240 235 10
Table 1. Urban district NAEP scores for math, grade 4, by days absent from school in the prior month: 2013
Jurisdiction
Days Absent Last Month Diffc. In NAEP score: none minus 3 or more days absent
prior month*3 or more days1-2 daysNone
*A 10 point difference is about equivalent to a one-year gain on NAEP between grades 4 and 8.SOURCE: NAEP Data Explorer. Prepared by Alan Ginsburg for Attendance Works
13
Absences Add Up | Attendance Works
APPENDIX II: Summary of Recent ResearchThis brief contains information from several new research studies that were released recently or about to be released.
Below is a summary of these studies.
A. Why September Matters: Improving Student Attendance
A new analysis from the Baltimore Education Research Consortium provides evidence that poor attendance early
in the school year can predict chronic absence. In Why September Matters: Improving Student Attendance, Linda S.
Olson studies attendance in the Baltimore City Public Schools for pre-kindergarten through 12th grade students in
September and throughout the rest of the 2012-13 school year. She focused on students who missed 20 days of
school in excused or unexcused absences, which is Maryland’s measure of chronic absence. The study found:
• Students who missed fewer than 2 days in September typically had good attendance rates for the entire year.
• Half the students who missed 2-4 days in September went on to miss a month or more of school, which is
known as chronic absence. This group missed an average of 25 days.
• Nearly 9 out of 10 students who missed more than 4 days in September were chronically absent that year. These
students missed an average of 70 days.
B. Chronic Absence and Its Effects on Students’ Academic and Socioemotional Outcomes
A study that was accepted for publication in August 2014 in the Journal of Education for Students Placed at Risk reflects
on how chronic absence correlates with weaker achievement scores and social-emotional skills in kindergarten. For
the analysis, researcher Michael A. Gottfried at the University of California Santa Barbara used a U.S. Department of
Education data base that tracks 10,740 students. That data base, known as the Early Childhood Longitudinal Study,
includes results for kindergarten tests measuring reading and math ability, as well as six social and emotional skills.
While many researchers define chronic absence as missing 10 percent of the school year or about 18 days, Gottfried
divided the absentee students into two levels — those missing 11 to 19 days (what he calls “moderate”) and those
missing 20 or more days (which he calls “strong”).
Gottfried’s findings include:
• About 13 percent of the students were chronically absent — 10 percent of them at the moderate level and 3
percent at the strong level.
• Chronically absent students at both levels performed below their better-attending peers on math and reading
skills assessments. The differences were wider in math than reading, and more significant for those missing a
month or more than for those at the moderate level.
• Chronic absence is associated with a lack of certain social skills, including a child’s ability to pay attention, work
independently, adapt to change and persist in tasks. It also reflects a lack of eagerness to learn new things and
a lack of engagement in school. Again, the differences are greater for the students who miss more school. Poor
attendance did not correlate with a child’s ability to control emotions or make friends.

14
Absences Add Up | Attendance Works
• A comparison of social skills testing done in the fall and spring of the kindergarten years found that most
students started school with similar levels of engagement. Those with worse attendance showed decreases in
their engagement in school and eagerness to learn by the spring testing.
• Family circumstances mattered for chronic absence. Students from low-income families whose parents were
not married were more likely to be chronically absent.
• Parent involvement mattered for chronic absence. Students with lower absences had parents who were more
likely to take them to book stores, music lessons or tutoring, among other activities.
• Attending preschool mattered. Students who did not attend preschool were more likely to be chronically absent
in kindergarten.
C. Attendance in the Early Grades: Why It Matters for Reading. A 2014 brief from Attendance Works and the
Campaign for Grade-Level Reading provides a scan of the research documenting how chronic absence early on can
leave a child unable to read well. The research points include:
• A 2011 California study connected early attendance with third grade reading mastery, which is considered a
key indicator of future academic success. Applied Survey Research found that 64 percent of the students with
good attendance in kindergarten and first grade scored proficient on the state’s third grade English language
arts test. That compares to 17 percent of students chronically absent in both kindergarten and first grade. These
trends reflect the increased emphasis on literacy skills in the early grades. From 1998 to 2006, kindergarten
teachers reported devoting 25 percent more time to teaching early literacy, up from 5.5 hours to seven hours
per week, according to the working paper recently released by the University of Virginia.
• Missing this critical literacy instruction in kindergarten and first grade has graver consequences for children
from low-income families than their more affluent peers, according to a 2010 study by Douglas D. Ready.
Tapping a national data base, Ready found that chronically absent children gained 14 percent fewer literacy
skills in kindergarten than those who attended more regularly. The negative impact, though, is 75 percent
greater for a low-income student in kindergarten than for more affluent peers and 40 percent greater in first
grade. Ready’s study showed that poor children are far more likely to be chronically absent.
• The effects of absenteeism on literacy skills start before kindergarten, two recent studies show. The University
of Chicago Consortium of Chicago School Research followed 25,000 3- and 4-year-olds served by Chicago
Public Schools school-based preschool programs and found that nearly half of 3-year-olds and more than
one-third of 4-year-olds missed at least 10 percent of the school year. Chronic absence for 4-year-old students
correlated with weaker kindergarten readiness scores, including letter recognition and pre-literacy scores. The
effects were particularly pronounced for the children who arrived at preschool with the weakest skills. Once
again, these are the students who were more likely to be chronically absent, the 2013 study found. And for
every year a student is chronically absent, his or her chance for reading success diminished. The Baltimore

15
Absences Add Up | Attendance Works
Education Research Consortium also focused on Pre-Kindergarten (PreK) and Kindergarten (K) attendance and
followed these young students over time. The 2012 study finds that students with low attendance in both PreK
and K often continue to have low attendance, are more likely to be retained by grade 3 and on average have lower
academic outcomes than peers with better attendance.
• The good news is that when students attend school regularly, they can see outsized literacy gains. Ready’s study
showed that low-income kids who attended regularly appeared to benefit from the instruction more than their
higher income peers. They gained 8 percent more literacy skills in kindergarten and nearly 7 percent more in first
grade. This narrows the reading gap between rich and poor by nearly a third. Likewise the Chicago research showed
that students who arrived at preK with the weakest skill and attended regularly saw the biggest gains. And when
chronically absent students improve their attendance, they can get back on track acade mically, the Baltimore
research found.
Attendance Works is a national organization dedicated to improving the policy, practice and research around attendance. Its website offers materials, research and success stories about reducing chronic absence. Attendance Works also offers technical assistance to school districts and communities.
This report was made possible by through generous financial support provided to Attendance Works by the Annie E. Casey Foundation, Campaign for Grade-Level Reading and W.K. Kellogg Foundation. We appreciate their support and acknowledge that the conclusions in the report are those of the Attendance Works team alone.
www.attendanceworks.org