SSE Financial Results - SSE Irelandireland.sse.com/media/5397/FINAL_RESULTS_PRESENTATION.pdf · SSE...
46
1 SSE Financial Results Year Ended 31 March 2013
Transcript of SSE Financial Results - SSE Irelandireland.sse.com/media/5397/FINAL_RESULTS_PRESENTATION.pdf · SSE...
1
SSE
Financial Results Year Ended 31 March 2013
2
Lord Smith of Kelvin Chairman
Continuing the 4 Ds

3
Today’s SSE team
Lord Smith of Kelvin
Chairman
Alistair Phillips-Davies
Deputy Chief Executive
Gregor Alexander
Finance Director
Ian Marchant
Chief Executive
Jim McPhillimy
MD Group Services
Alan Young
MD Corporate Affairs
Jim Smith
MD Renewables
4
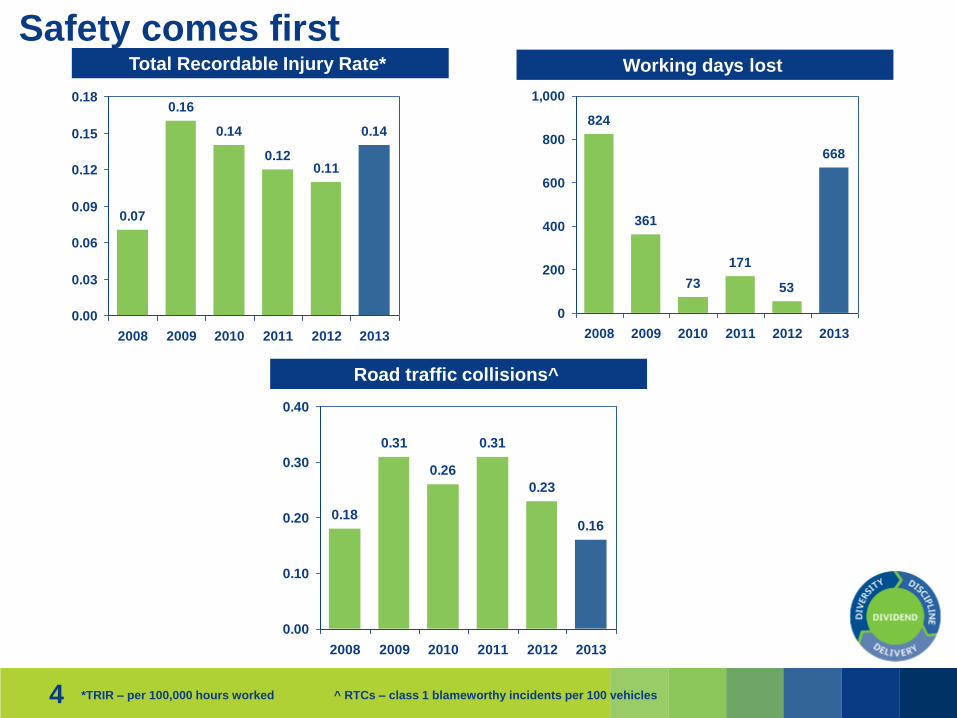
0.07
0.16
0.14
0.120.11
0.14
0.00
0.03
0.06
0.09
0.12
0.15
0.18
2008 2009 2010 2011 2012 2013
Safety comes first Total Recordable Injury Rate*
Road traffic collisions^
*TRIR – per 100,000 hours worked
^ RTCs – class 1 blameworthy incidents per 100 vehicles
0.18
0.31
0.26
0.31
0.23
0.16
0.00
0.10
0.20
0.30
0.40
2008 2009 2010 2011 2012 2013
Working days lost
824
361
73
171
53
668
0
200
400
600
800
1,000
2008 2009 2010 2011 2012 2013
5
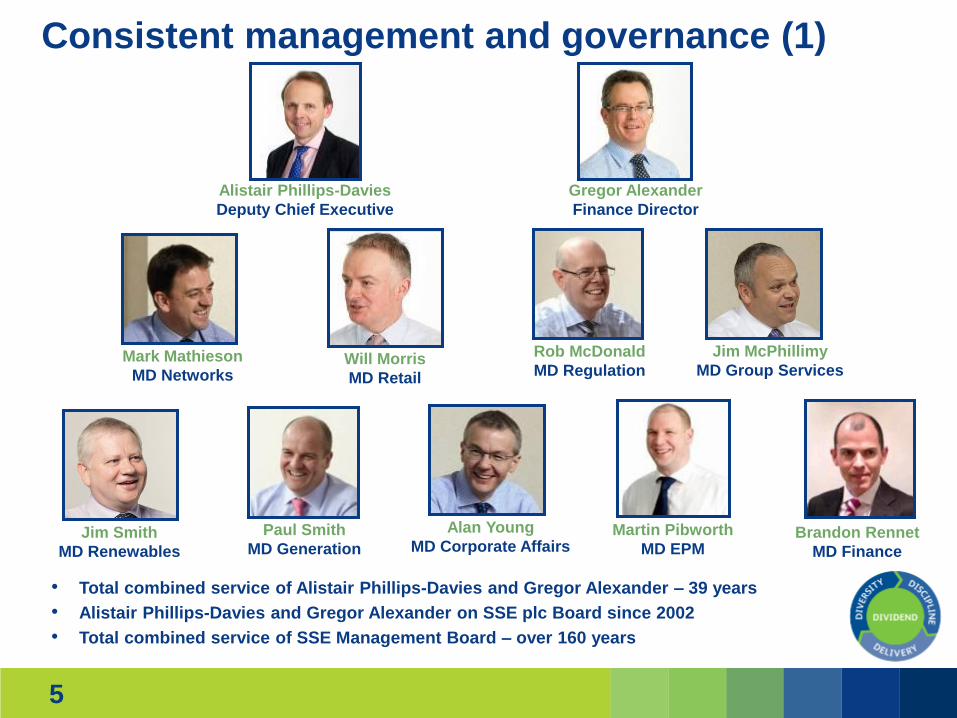
Consistent management and governance (1)
Alistair Phillips-Davies
Deputy Chief Executive
Will Morris
MD Retail
Paul Smith
MD Generation Jim Smith
MD Renewables
Mark Mathieson
MD Networks
Alan Young
MD Corporate Affairs
Gregor Alexander
Finance Director
Martin Pibworth
MD EPM
Jim McPhillimy
MD Group Services
Rob McDonald
MD Regulation
Brandon Rennet
MD Finance
• Total combined service of Alistair Phillips-Davies and Gregor Alexander – 39 years
• Alistair Phillips-Davies and Gregor Alexander on SSE plc Board since 2002
• Total combined service of SSE Management Board – over 160 years

6
Consistent management and governance (2)
7
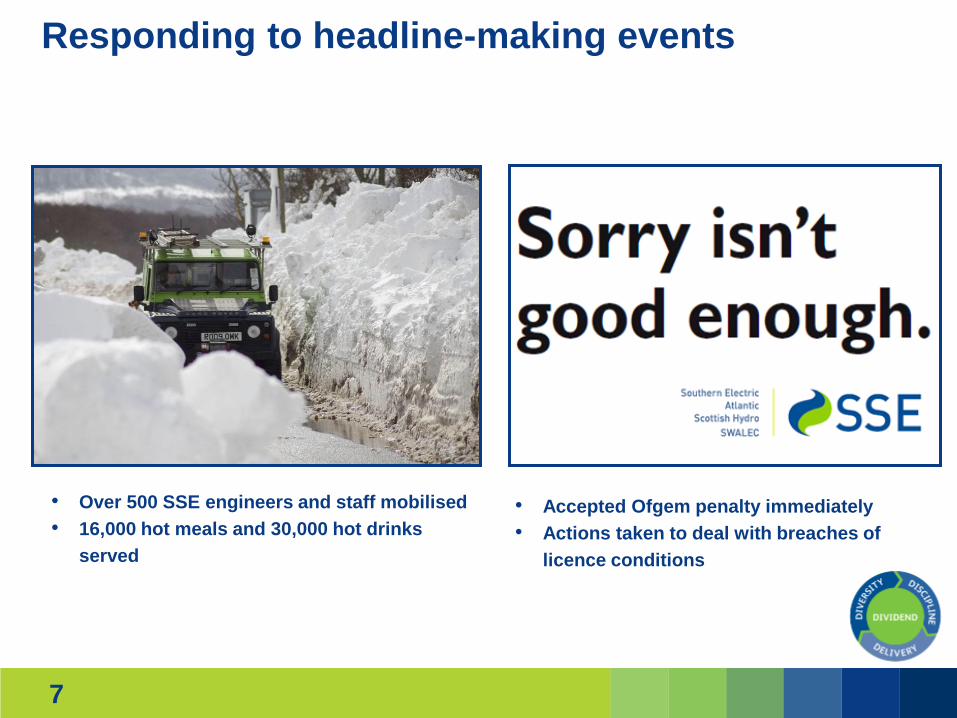
Responding to headline-making events
• Over 500 SSE engineers and staff mobilised
• 16,000 hot meals and 30,000 hot drinks
served
• Accepted Ofgem penalty immediately
• Actions taken to deal with breaches of
licence conditions
8
Ian Marchant Chief Executive
Delivering the dividend
9 9
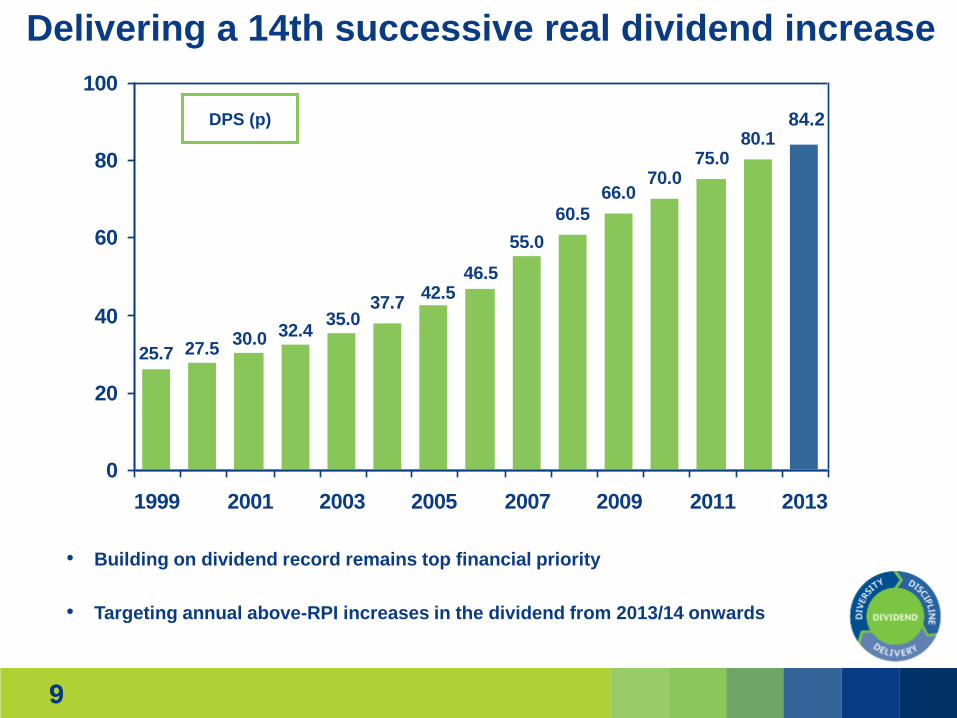
Delivering a 14th successive real dividend increase
60.5
66.070.0
75.080.1
25.7 27.530.0
46.5
55.0
42.537.7
35.032.4
0
20
40
60
80
100
1999 2001 2003 2005 2007 2009 2011 2013
84.2 DPS (p)
• Building on dividend record remains top financial priority
• Targeting annual above-RPI increases in the dividend from 2013/14 onwards

10
Delivering a 14th successive adjusted PBT increase
1,290.11,310.1
1,335.7
1,410.7
1,000
1,100
1,200
1,300
1,400
1,500
2010 2011 2012 2013
Increase in adjusted PBT, £m
110.2
112.3 112.7
118.0
100
104
108
112
116
120
2010 2011 2012 2013
Increase in adjusted EPS, pence
Year ended 31 March
2013 £m
2012 £m
Change
%
2011
£m
Adjusted profit before tax 1,410.7 1,335.7 5.6% 1,310.1
Fair value re-measurements (IAS 39) (199.7) (509.0) 1,423.3
Exceptional items (584.7) (551.6) (625.0)
Tax on JCEs and associates (25.4) (6.6) 3.3
Reported profit before tax 600.9 268.5 2,111.7
Adjusted effective tax rate 15.9% 16.0% 20.5%
Adjusted earnings per share 118.0p 112.7p 4.7% 112.3p
• Dividend cover of 1.4
times
• Dividend cover
averaged 1.5 times
over last 4 years
• Exceptional charge
reflects tough
operating
environment

11
Movements in Networks’ operating profit Networks’ operating profit split
Gas
Distribution*
27%
Other
Networks
4%
Electricity
Transmission
11%
Electricity
Distribution
58%
Delivering good financial performance in Networks
• 49% of SSE adjusted operating profit
• Electricity Transmission operating profit up –
increase in asset base from capital invested
• Electricity Distribution operating profit up –
timing of allowed revenue recovery
• Gas Distribution operating profit flat
• Other Networks’ achieved operating profit similar
to that achieved in 2011
Year ended 31 March 2013
£m 2012
£m
Change
%
2011
£m
Electricity Transmission 93.3 73.7 26.6 47.7
Electricity Distribution 512.8 396.5 29.3 418.9
Gas Distribution* 234.1 234.8 -0.3 186.8
Other networks 35.9 32.1 11.8 37.1
Networks segment operating profit 876.1 737.1 18.9 690.5
*SSE share
12
Movements in Retail’s operating profit Retail’s operating profit split
Energy Supply
89%
Energy-related
Services
11%
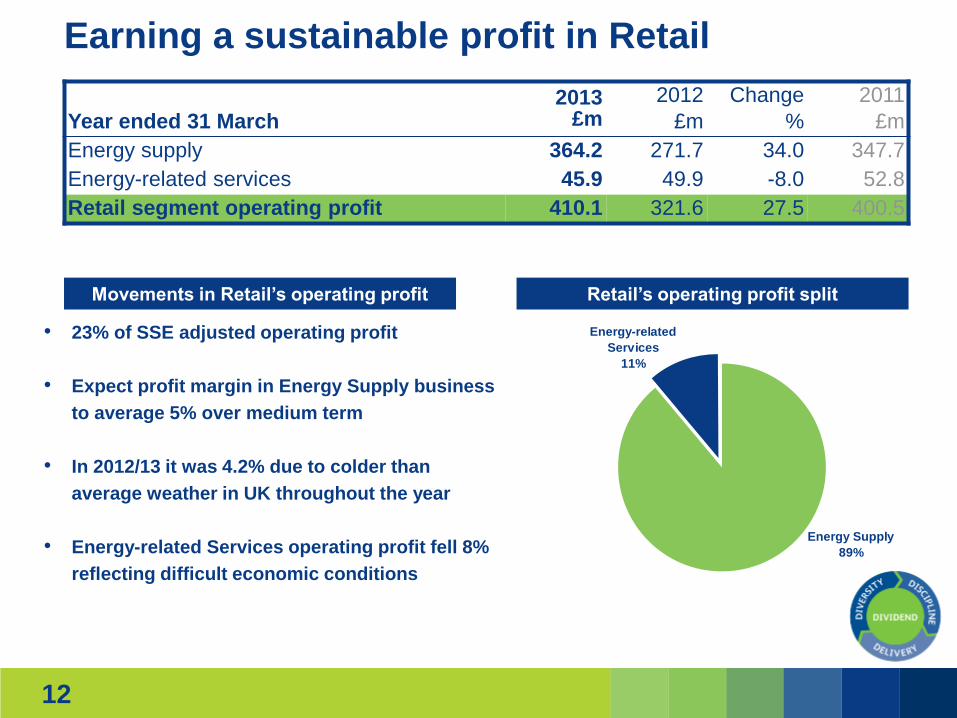
Earning a sustainable profit in Retail
• 23% of SSE adjusted operating profit
• Expect profit margin in Energy Supply business
to average 5% over medium term
• In 2012/13 it was 4.2% due to colder than
average weather in UK throughout the year
• Energy-related Services operating profit fell 8%
reflecting difficult economic conditions
Year ended 31 March 2013
£m 2012
£m
Change
%
2011
£m
Energy supply 364.2 271.7 34.0 347.7
Energy-related services 45.9 49.9 -8.0 52.8
Retail segment operating profit 410.1 321.6 27.5 400.5
13
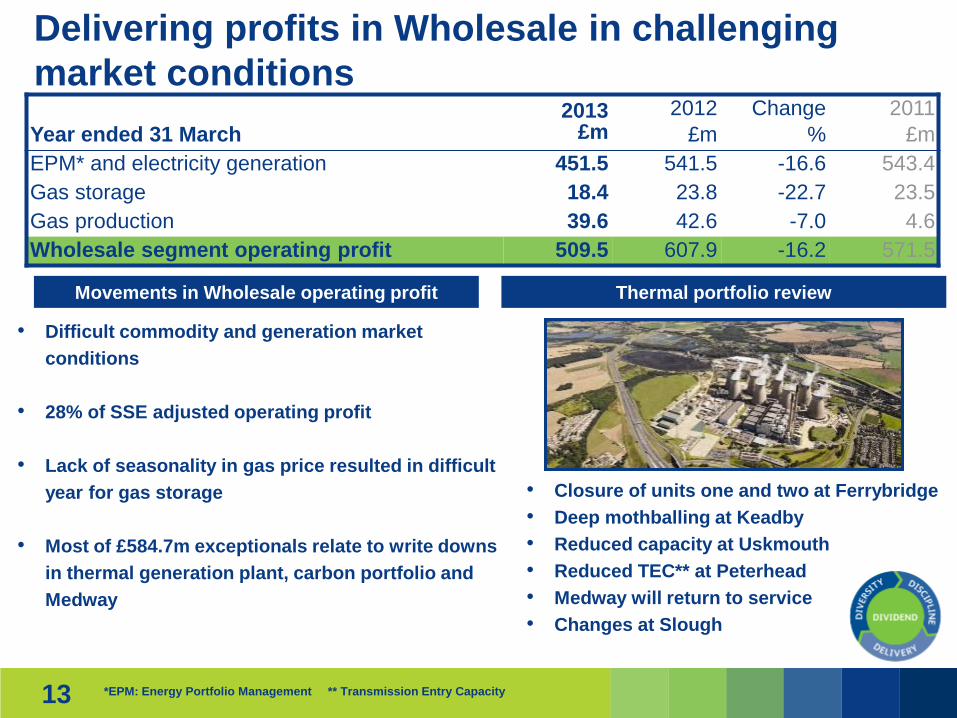
Movements in Wholesale operating profit
Delivering profits in Wholesale in challenging
market conditions
*EPM: Energy Portfolio Management ** Transmission Entry Capacity
• Difficult commodity and generation market
conditions
• 28% of SSE adjusted operating profit
• Lack of seasonality in gas price resulted in difficult
year for gas storage
• Most of £584.7m exceptionals relate to write downs
in thermal generation plant, carbon portfolio and
Medway
• Closure of units one and two at Ferrybridge
• Deep mothballing at Keadby
• Reduced capacity at Uskmouth
• Reduced TEC** at Peterhead
• Medway will return to service
• Changes at Slough
Thermal portfolio review
Year ended 31 March 2013
£m 2012
£m
Change
%
2011
£m
EPM* and electricity generation 451.5 541.5 -16.6 543.4
Gas storage 18.4 23.8 -22.7 23.5
Gas production 39.6 42.6 -7.0 4.6
Wholesale segment operating profit 509.5 607.9 -16.2 571.5

14 *Including corporation tax, rates, and NI **Capex ^Acquisitions
Business diversity delivering for our stakeholders
Employee numbers
Capex and acquisitions, £bn
Declared dividends of £5.6bn over last 10
years
Paid £3.5bn in tax over last ten years*
1 April 2003, SSE’s market cap was £5.5bn
15
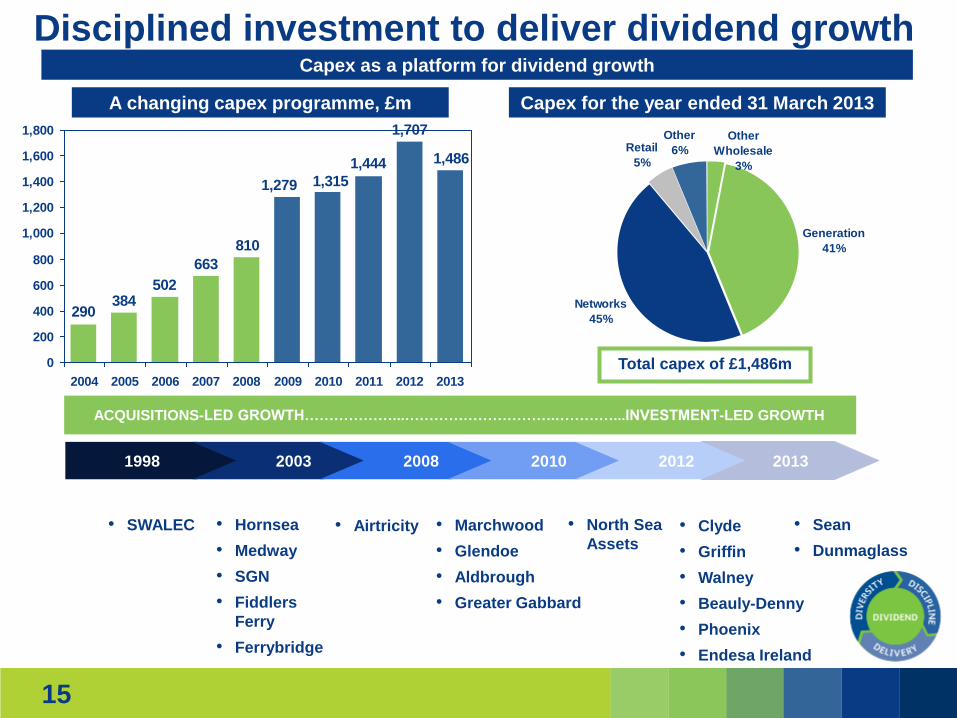
Capex as a platform for dividend growth
A changing capex programme, £m Capex for the year ended 31 March 2013
Generation
41%
Networks
45%
Retail
5%
Other
6%
Other
Wholesale
3%
Total capex of £1,486m
1,486
290384
502
1,444
1,707
1,3151,279
810
663
0
200
400
600
800
1,000
1,200
1,400
1,600
1,800
2004 2005 2006 2007 2008 2009 2010 2011 2012 2013
Disciplined investment to deliver dividend growth
1998 2003 2008 2010 2012 2013
• Marchwood
• Glendoe
• Aldbrough
• Greater Gabbard
• SWALEC • Hornsea
• Medway
• SGN
• Fiddlers
Ferry
• Ferrybridge
• Airtricity
ACQUISITIONS-LED GROWTH………………...………………………….…………...INVESTMENT-LED GROWTH
• Clyde
• Griffin
• Walney
• Beauly-Denny
• Phoenix
• Endesa Ireland
• North Sea
Assets
• Sean
• Dunmaglass
16 16
60.5
66.070.0
75.080.1
25.7 27.530.0
46.5
55.0
42.537.7
35.032.4
0
20
40
60
80
100
1999 2001 2003 2005 2007 2009 2011 2013
84.2 DPS (p)
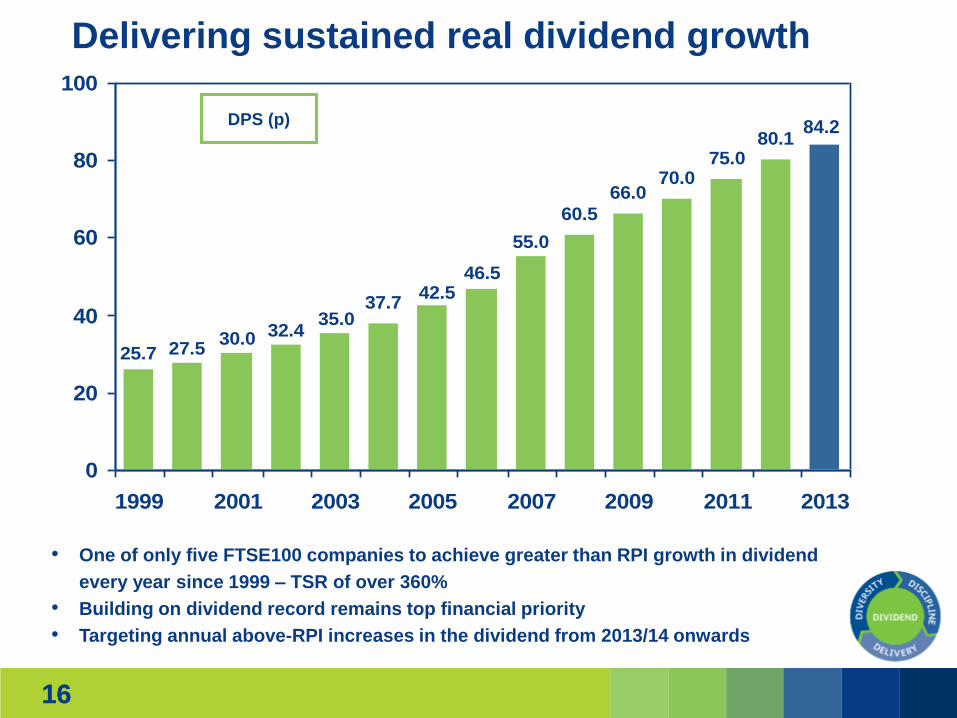
• One of only five FTSE100 companies to achieve greater than RPI growth in dividend
every year since 1999 – TSR of over 360%
• Building on dividend record remains top financial priority
• Targeting annual above-RPI increases in the dividend from 2013/14 onwards
Delivering sustained real dividend growth

17
Gregor Alexander Finance Director
Funding, Investment and Networks

18
Making sure SSE is well-financed
Mar 2013 Mar 2012
Adjusted net debt and hybrid capital - £m (7,347.7) (6,755.8)
Capital expenditure and investment 1,485.5 1,706.9
Average interest rate 5.26% 5.06%
Diverse sources of funding
Eurobonds
48%
US Private
Placement
6%
EIB
6%
Index-linked debt
3%
Other loans
9%
Hybrid securities
28%
• 33% Scrip uptake
• Wind asset sale (£131m net)
• Private US $ placement (£450m)
• Hybrid capital issued (£1.025bn)
• Interest cover of 5.4 times*
• c£5.4bn of medium to long-term borrowings**
• Average debt maturity of 10.6 years
• Secured £650m of additional bank facilities in
March 2013
*Excludes SGN **Excluding hybrid capital , also £1.5bn matures in next 12 months
Debt influenced by
• Three main acquisitions (£358m)
Remain committed to current criteria for single ‘A’ credit rating

19
Well-financed for future investment
• Forecasting spend of c£1.5bn in 2013/14
• Electricity networks and generation main components
• Economically regulated networks likely to require biggest proportion
0
200
400
600
800
1,000
1,200
1,400
1,600
1,800
2011 2012 2013 2014 2015
Other Retail Networks Wholesale
Annual capex spend, £m
20
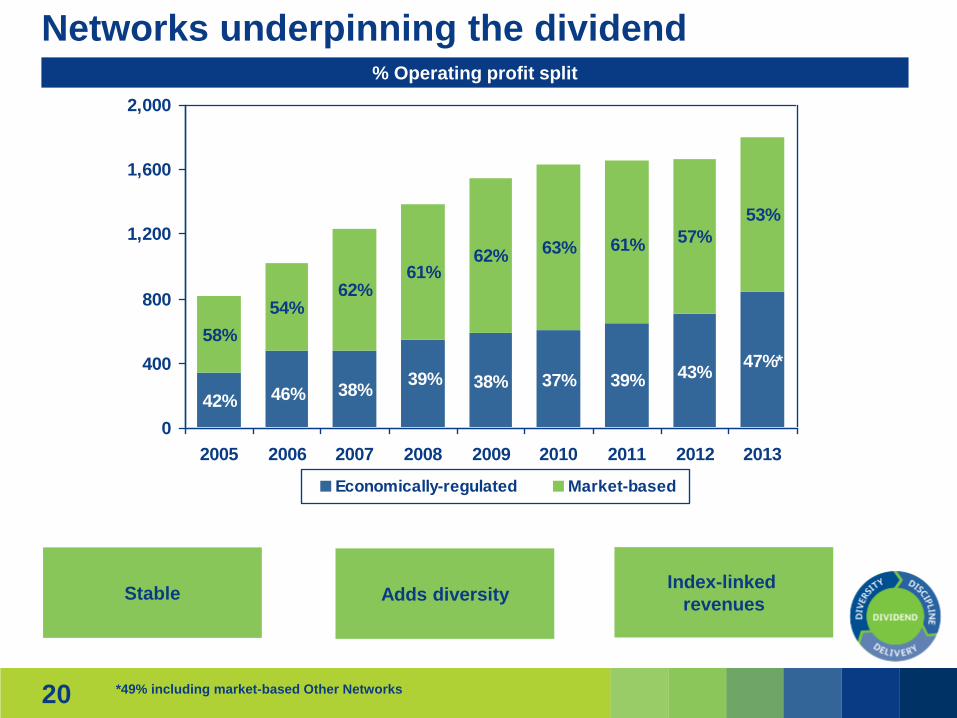
Networks underpinning the dividend
42% 46% 38%39% 38% 37% 39% 43%
47%*
58%
54%62%
61%62% 63% 61% 57%
53%
0
400
800
1,200
1,600
2,000
2005 2006 2007 2008 2009 2010 2011 2012 2013
Economically-regulated Market-based
Stable Adds diversity Index-linked
revenues
% Operating profit split
*49% including market-based Other Networks
21
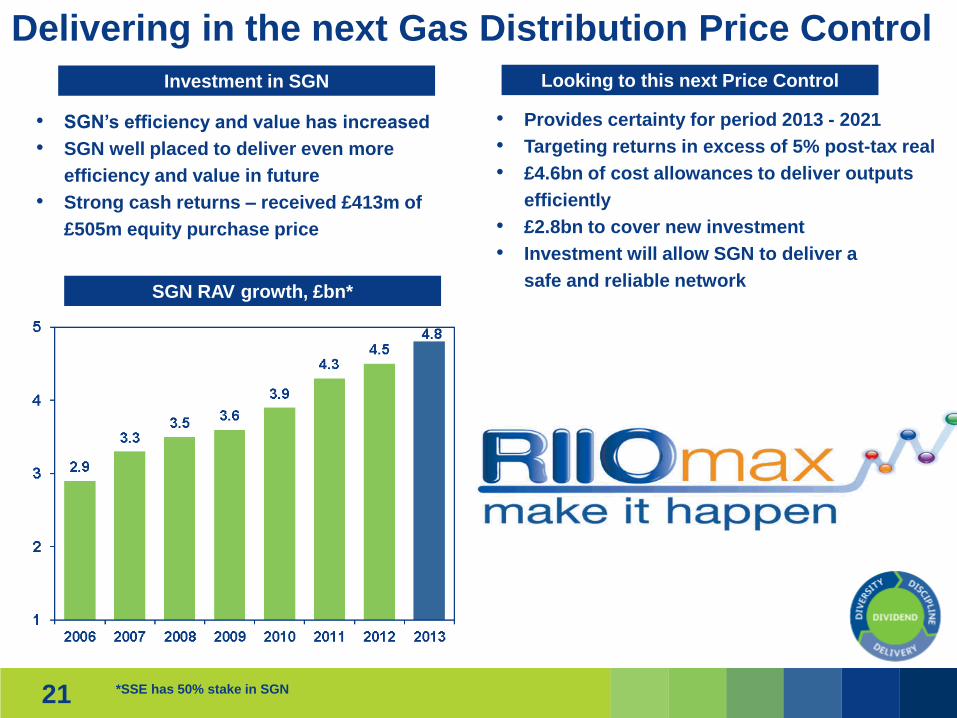
• SGN’s efficiency and value has increased
• SGN well placed to deliver even more
efficiency and value in future
• Strong cash returns – received £413m of
£505m equity purchase price
Delivering in the next Gas Distribution Price Control
Investment in SGN Looking to this next Price Control
• Provides certainty for period 2013 - 2021
• Targeting returns in excess of 5% post-tax real
• £4.6bn of cost allowances to deliver outputs
efficiently
• £2.8bn to cover new investment
• Investment will allow SGN to deliver a
safe and reliable network
*SSE has 50% stake in SGN
SGN RAV growth, £bn*

22
Maintaining an innovative approach in Gas Distribution
The new way to repair a joint
• Successful trials carried out in partnership with:
• Royal Borough of Kingston
• Croydon Council
• Glasgow City Council
• Approval from Transport for London and Glasgow City Council
• SGN now aim to use technique in all areas of operations
The coring device
Making the repair
using long handled
tools
Original core goes
back in and whole
process takes <5 hours
23
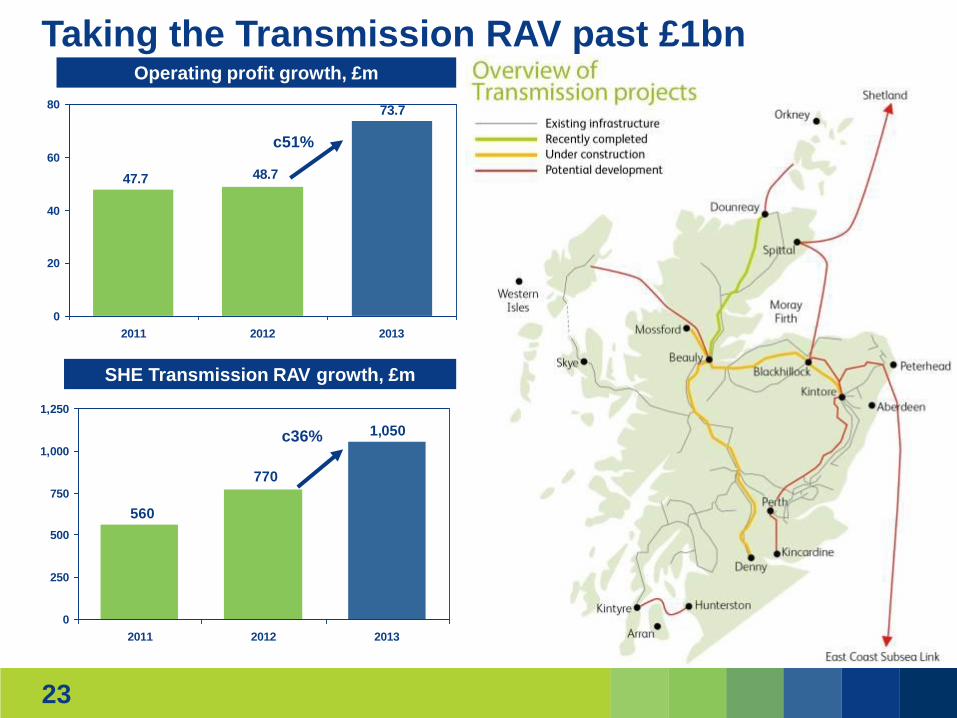
Taking the Transmission RAV past £1bn
47.7 48.7
73.7
0
20
40
60
80
2011 2012 2013
560
770
1,050
0
250
500
750
1,000
1,250
2011 2012 2013
SHE Transmission RAV growth, £m
Operating profit growth, £m
c36%
c51%

24
Building a modern Transmission network Beauly-Denny
Project update Project summary
• Project is now well under way
• At 30 April, 173 pylons now in place
• North Section almost complete
*SSE share **Based on April 2013 and will fluctuate depending on construction circumstances
• 536 pylons strung with 201km of cable*
• 40 SSE staff and 830 contractors**
• Added capacity – up to 2GW of generation
25
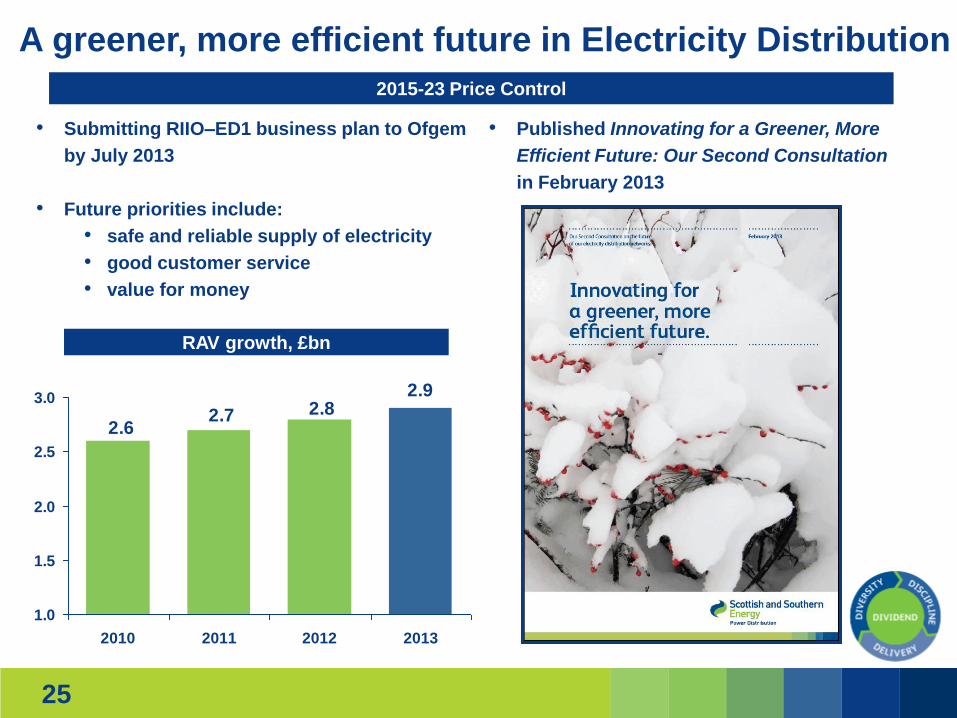
A greener, more efficient future in Electricity Distribution
2015-23 Price Control
• Submitting RIIO–ED1 business plan to Ofgem
by July 2013
• Future priorities include:
• safe and reliable supply of electricity
• good customer service
• value for money
• Published Innovating for a Greener, More
Efficient Future: Our Second Consultation
in February 2013
2.62.7 2.8
2.9
1.0
1.5
2.0
2.5
3.0
2010 2011 2012 2013
RAV growth, £bn
26
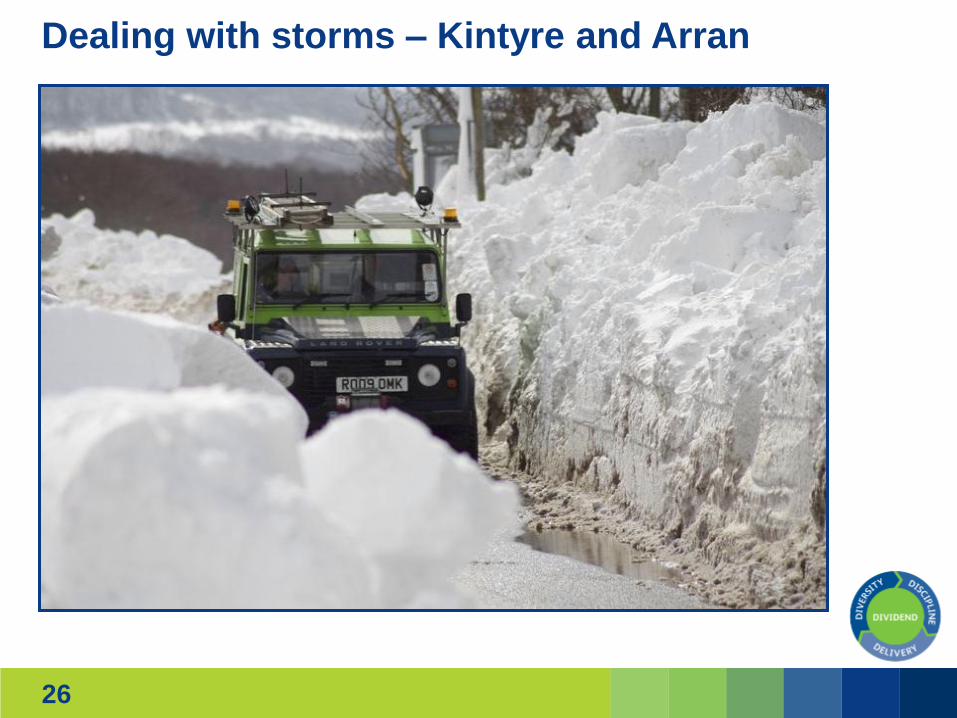
Dealing with storms – Kintyre and Arran
27
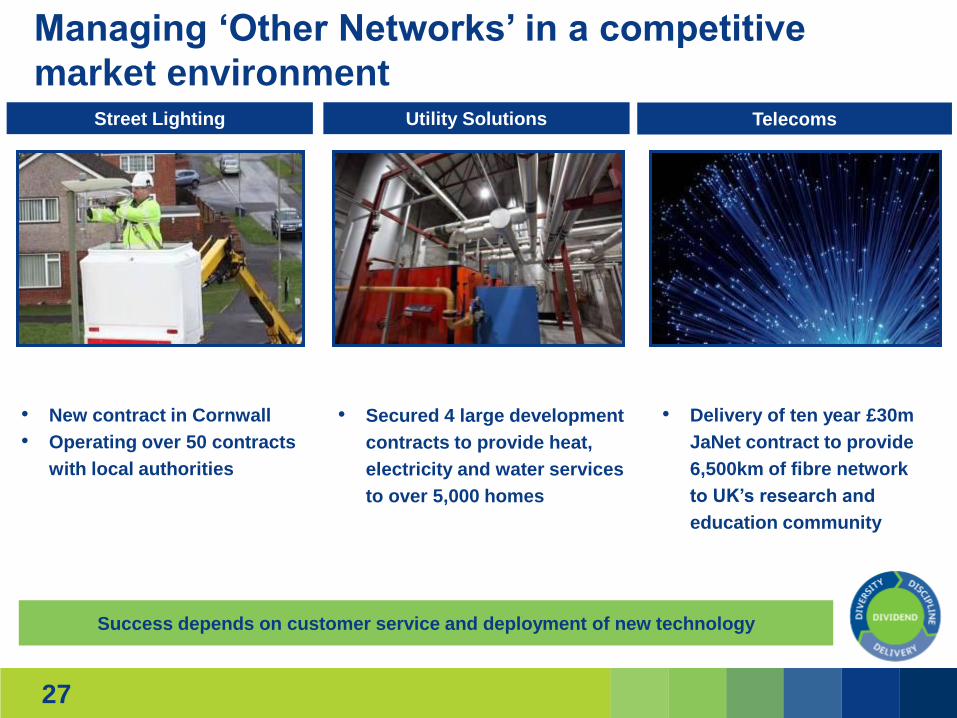
Utility Solutions Telecoms
Managing ‘Other Networks’ in a competitive
market environment Street Lighting
• New contract in Cornwall
• Operating over 50 contracts
with local authorities
• Secured 4 large development
contracts to provide heat,
electricity and water services
to over 5,000 homes
• Delivery of ten year £30m
JaNet contract to provide
6,500km of fibre network
to UK’s research and
education community
Success depends on customer service and deployment of new technology

28
60.566.0
70.075.0
80.1
25.7 27.530.0
46.5
55.0
42.537.7
35.032.4
0
20
40
60
80
100
1999 2001 2003 2005 2007 2009 2011 2013
84.2
0
1,000
2,000
3,000
4,000
5,000
6,000
7,000
1999 2001 2003 2005 2007 2009 2011 2013
Distribution Transmission SGN*
28
Networks underpinning the dividend
Operational focus
on delivery
Demand operational
and financial
discipline
Lend real diversity to
SSE’s balanced group
of businesses
Dividend, pence Total Regulated Networks RAV, £m
*SSE share
Economically-regulated Networks really matter
Underpin financial principles and long-term commitment to the dividend
29
Alistair Phillips-Davies Deputy Chief Executive
Retail and Wholesale
30
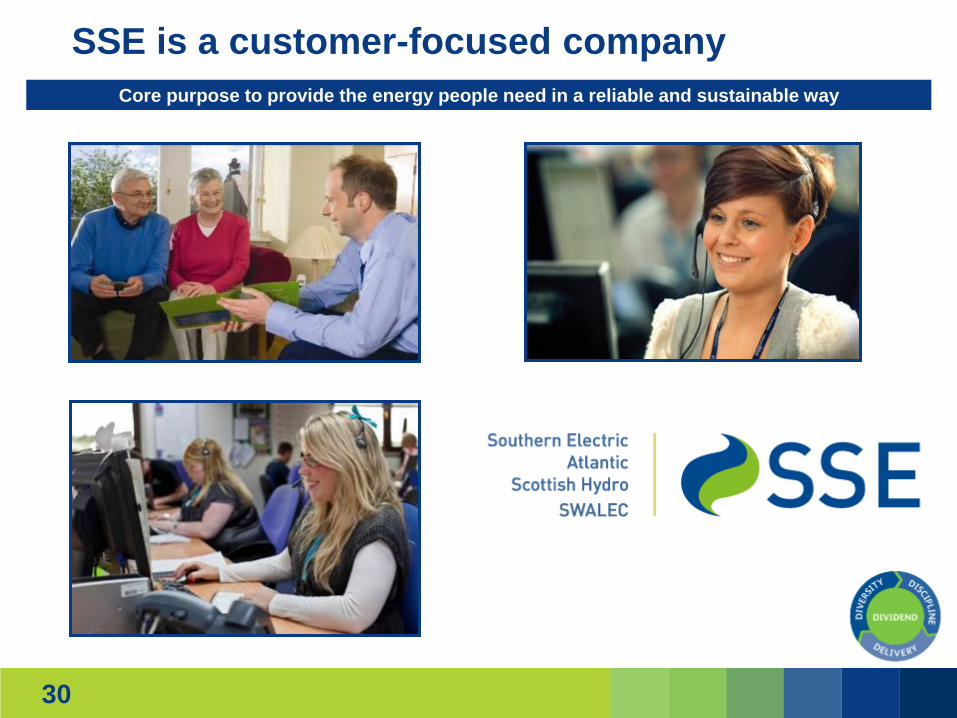
SSE is a customer-focused company
Core purpose to provide the energy people need in a reliable and sustainable way

31
Rebuilding trust in Energy Supply (1)
• Only one of its kind in the industry
• Received 14,000 claims since Ofgem announcement
• Paid an average of £80 to over 5,000 customers
• Balance of the £5m to be given to energy related charities
Sales Guarantee

32
• Goes significantly beyond existing industry-wide
standards
• Promise to meet new set of customer service
commitments or give customers £20 off next bill
• Three core objectives of
• Helping customers save money
• Making life easier for customers
• Helping customers when they need it most
• Payments being made where standards not met
Rebuilding trust in Energy Supply (2)
Customer Service Guarantee

33
Supplying energy to customers in GB and Ireland
8.469.06 9.16
8.658.939.16
0.050.82
0.490.190.62
0.04
5
6
7
8
9
10
2008 2009 2010 2011 2012 2013
Total GB energy accounts Total Irish energy accounts
Customer accounts, million
Gain customers in the right way and retain them for the long term
80,000 net loss in
account numbers
130,000 gas customer
accounts from Phoenix
acquisition
Underlying fall of
210,000 accounts
Customer base only
3% smaller than peak
two years ago
• Mix of fair prices, simple products and excellent service – resilient Energy Supply business
• Energy Supply about gaining customers in right way and retaining them for long term
34
0%
1%
2%
3%
4%
5%
6%
2011 2012 2013*
0%
2%
4%
6%
8%
10%
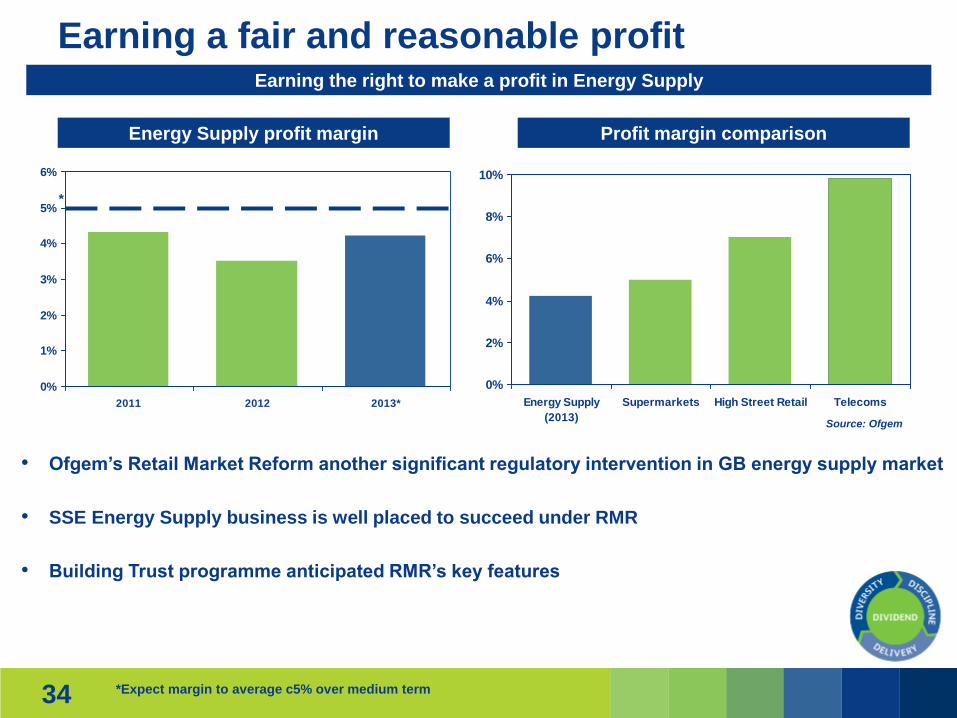
Energy Supply
(2013)
Supermarkets High Street Retail Telecoms
Earning a fair and reasonable profit
*
Profit margin comparison Energy Supply profit margin
• Ofgem’s Retail Market Reform another significant regulatory intervention in GB energy supply market
• SSE Energy Supply business is well placed to succeed under RMR
• Building Trust programme anticipated RMR’s key features
*Expect margin to average c5% over medium term
Earning the right to make a profit in Energy Supply
Source: Ofgem
35
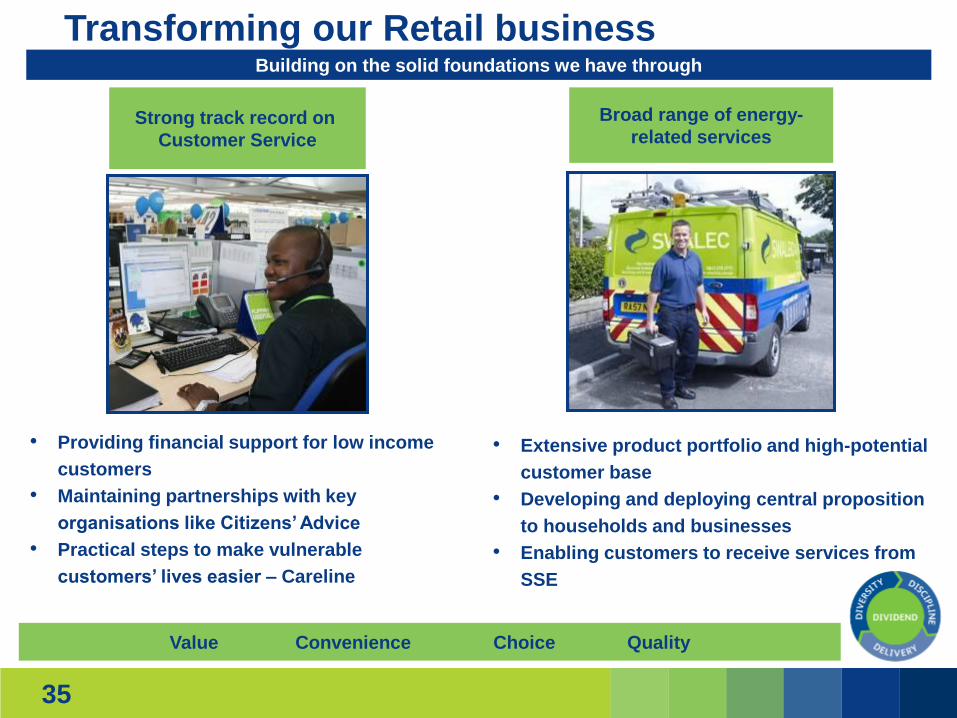
Transforming our Retail business
Strong track record on
Customer Service
Broad range of energy-
related services
• Providing financial support for low income
customers
• Maintaining partnerships with key
organisations like Citizens’ Advice
• Practical steps to make vulnerable
customers’ lives easier – Careline
• Extensive product portfolio and high-potential
customer base
• Developing and deploying central proposition
to households and businesses
• Enabling customers to receive services from
SSE
Value Convenience Choice Quality
Building on the solid foundations we have through

36
0
4,000
8,000
12,000
16,000
20,000
24,000
2008 2009 2010 2011 2012 2013
Electricity consumption Gas consumption
A challenging GB Generation Market (1)
-10
0
10
20
30
40
Apr-08 Apr-09 Apr-10 Apr-11 Apr-12 Apr-13 Apr-14 Apr-15 Apr-16
-6
-4
-2
0
2
4
6
1999 2001 2003 2005 2007 2009 2011
Purpose of Wholesale is to secure the energy people and businesses need
Y-O-Y GDP growth, % Weather adjusted fuel demand, kWh
Spark spreads, £/MWh Diversity*
Renewable
capacity
25%
Coal-fired/solid
fuel capacity
33%
Gas- and oil-
fired capacity
42%
*Including Irish capacity
37
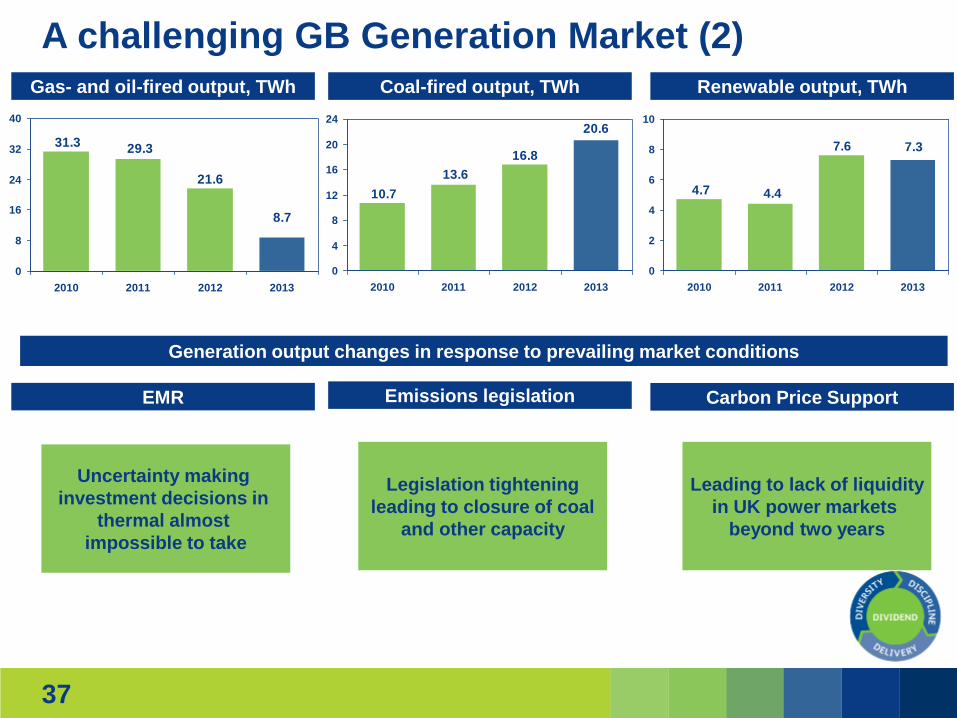
A challenging GB Generation Market (2)
31.329.3
21.6
8.7
0
8
16
24
32
40
2010 2011 2012 2013
10.7
13.6
16.8
20.6
0
4
8
12
16
20
24
2010 2011 2012 2013
Gas- and oil-fired output, TWh
4.7 4.4
7.6 7.3
0
2
4
6
8
10
2010 2011 2012 2013
Coal-fired output, TWh Renewable output, TWh
Generation output changes in response to prevailing market conditions
Uncertainty making
investment decisions in
thermal almost
impossible to take
Legislation tightening
leading to closure of coal
and other capacity
Leading to lack of liquidity
in UK power markets
beyond two years
EMR Emissions legislation Carbon Price Support

38
GRAIN OIL
Didcot A
Uskmouth
Tilbury Cockenzie
Fawley
Littlebrook
Kingsnorth
...partially
...partially
The 12/12/12 problem
39
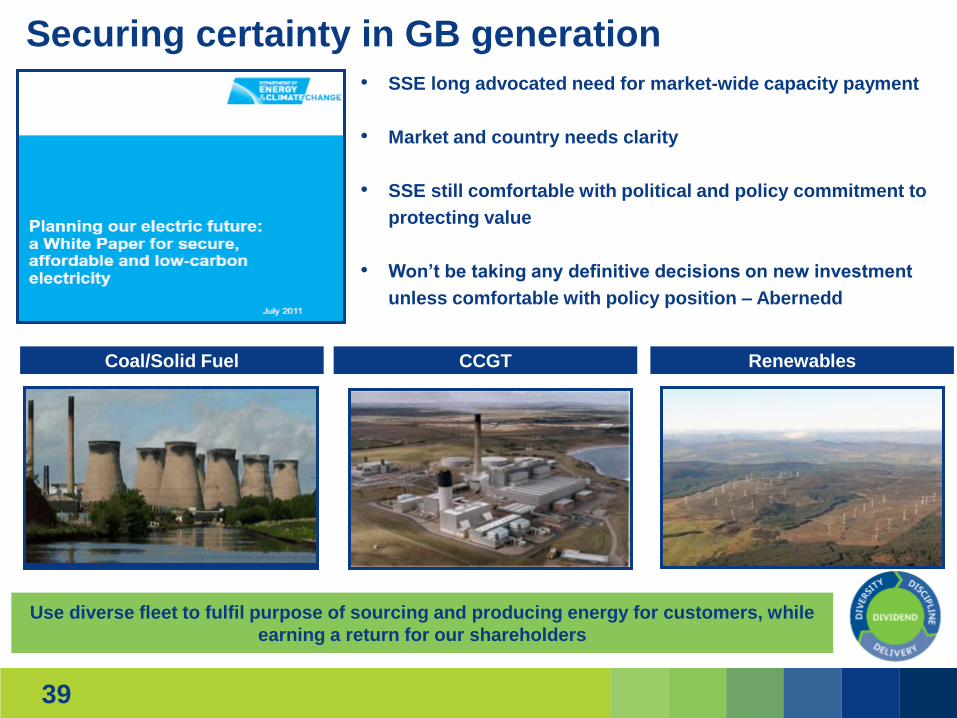
Coal/Solid Fuel
Securing certainty in GB generation
CCGT Renewables
• SSE long advocated need for market-wide capacity payment
• Market and country needs clarity
• SSE still comfortable with political and policy commitment to
protecting value
• Won’t be taking any definitive decisions on new investment
unless comfortable with policy position – Abernedd
Use diverse fleet to fulfil purpose of sourcing and producing energy for customers, while
earning a return for our shareholders
40
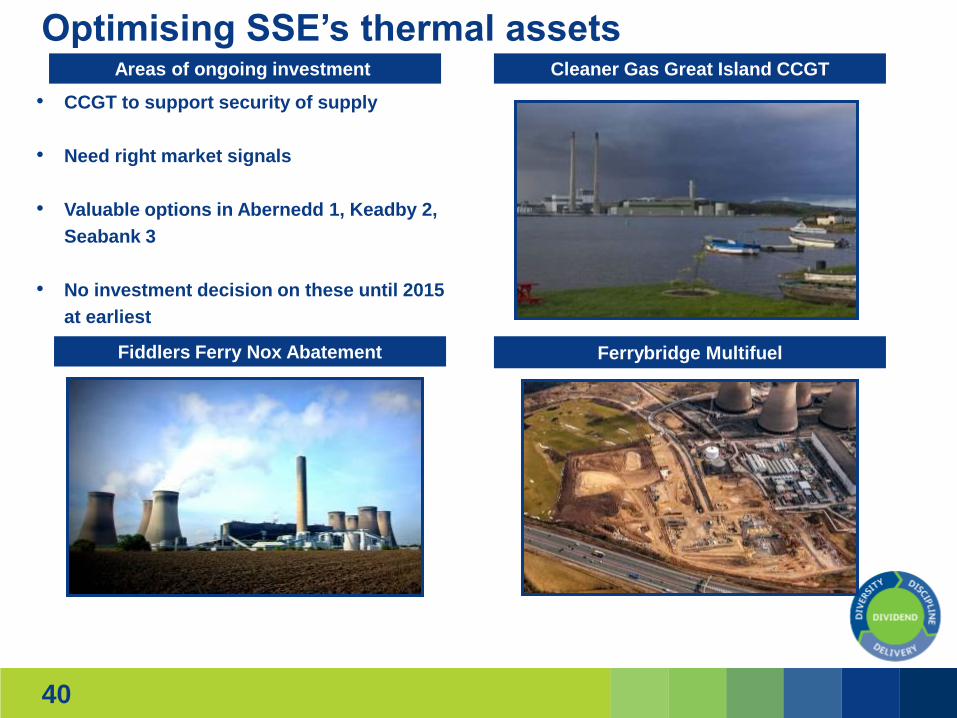
Optimising SSE’s thermal assets Areas of ongoing investment
Fiddlers Ferry Nox Abatement
Cleaner Gas Great Island CCGT
Ferrybridge Multifuel
• CCGT to support security of supply
• Need right market signals
• Valuable options in Abernedd 1, Keadby 2,
Seabank 3
• No investment decision on these until 2015
at earliest

41
Continuing to deliver renewable energy Hydro output, GWh
Wind farm output, GWh
Renewable generation capacity, MW
2,558
4,262
2,836
500
1,500
2,500
3,500
4,500
2011 2012 2013
1,653
3,199
4,281
200
1,000
1,800
2,600
3,400
4,200
5,000
2011 2012 2013
2,450
3,0203,240
1,000
1,500
2,000
2,500
3,000
3,500
2011 2012 2013
Invested £383m in renewables
Renewable portfolio
Priorities for 2013/14
• 138MW new onshore wind
• 162MW net offshore wind
• 87% of availability at Greater Gabbard –
expected to be over 90% in 2013/14
• Now have total of 3,240MW*
• Capacity generating electricity includes
Glendoe – returned to service last August
• Onshore wind developments at Calliachar,
Keadby, Strathy North and Dunmaglass
• Capex spend expected to be similar
in 2013/14
*
*Net of 79.6MW wind sale

42
Renewables in GB and Ireland CCGT in GB and Ireland
SSE has options Solid fuel with NOX abatement
Diversity will be the hallmark of our generation portfolio

43
Continuing to build up a good position in gas Sean gas field
• Purchased Sean gas field (£117m)
• Total portfolio of gas production assets represents
approximately 3bn therms of 2P reserves
• Expect volume/production profile of assets to
provide secure and fixed-price supply of gas to
meet c25% of forecast demand from domestic
customers over next three years
42.6
39.6
5
15
25
35
45
2012 2013
Gas production operating profit, £m Long-term fuel supply contracts
• Will cover significant portion of future gas
needs with fair pricing structure and minimal
risk
• Have further opportunities to build on asset
base and will do so provided value
can be secured

84.2p
RPI +2% increase
Discipline
Sticking to SSE’s four Ds (1)
• Balance between
three segments
• Diversity within
segments through
different assets,
customer bases
and different
markets
Diversity
• Strong financial
management
• Sale of non-core
assets and close
cost control
whether they are
revenue or capital
Delivery
• Delivered biggest increase in adjusted PBT for five years
• Unbroken record of annual profit increases against difficult background
44
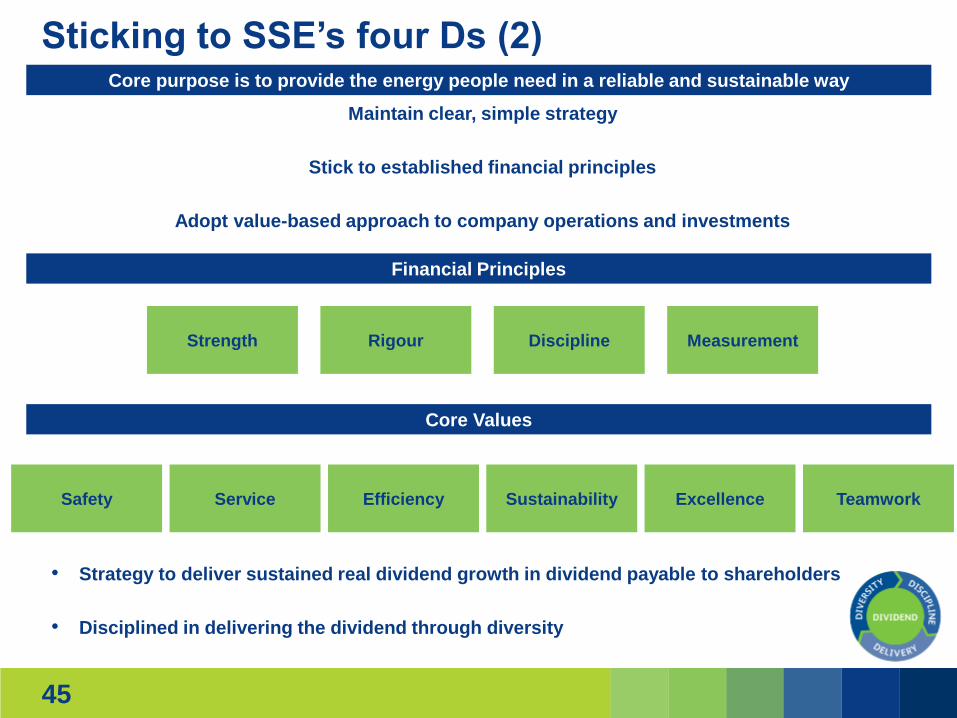
Sticking to SSE’s four Ds (2) Core purpose is to provide the energy people need in a reliable and sustainable way
• Strategy to deliver sustained real dividend growth in dividend payable to shareholders
• Disciplined in delivering the dividend through diversity
Financial Principles
Maintain clear, simple strategy
Stick to established financial principles
Adopt value-based approach to company operations and investments
Core Values
Safety Service Efficiency Sustainability Excellence Teamwork
45
Strength Rigour Discipline Measurement
46 46
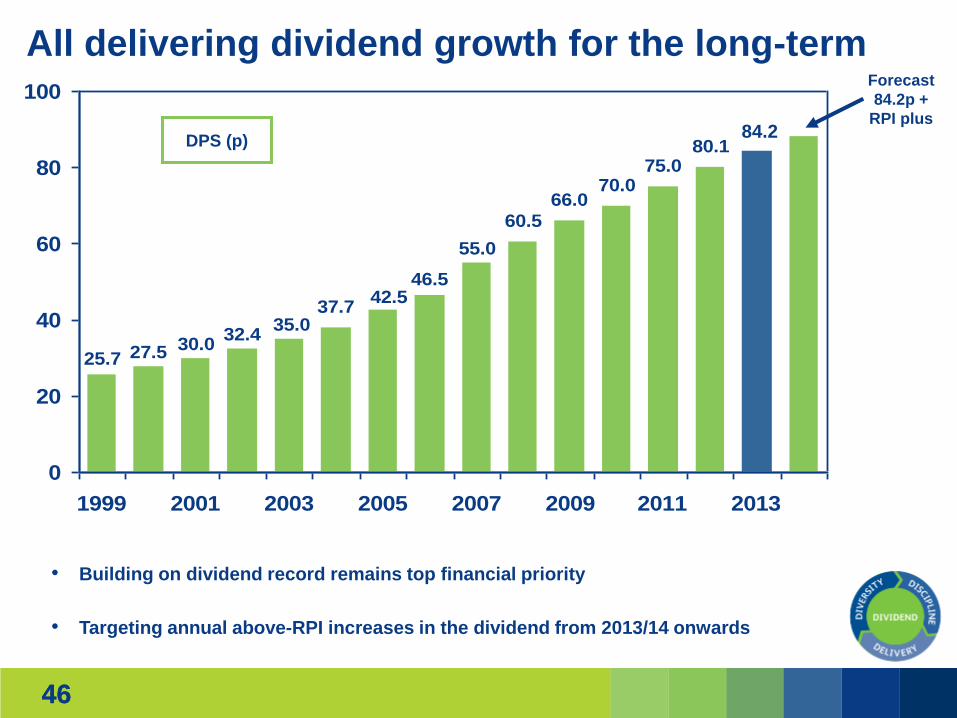
• Building on dividend record remains top financial priority
• Targeting annual above-RPI increases in the dividend from 2013/14 onwards
All delivering dividend growth for the long-term
60.5
66.070.0
75.080.1
25.7 27.5 30.0
46.5
55.0
42.537.7
35.032.4
0
20
40
60
80
100
1999 2001 2003 2005 2007 2009 2011 2013
84.2 DPS (p)
Forecast
84.2p +
RPI plus