Sri Lanka: Recent Economic Developments in Charts
44
Sri Lanka: Macroeconomic Developments in Charts June 2015 Central Bank of Sri Lanka Economic Research Department
Transcript of Sri Lanka: Recent Economic Developments in Charts

Sri Lanka: Macroeconomic Developments in
Charts
June 2015
Central Bank of Sri LankaEconomic Research Department

IndexReal Sector and Inflation
Real GDP Growth (Annual /Quarterly)
Sectoral GDP Growth
Per Capita GDP
Unemployment
Poverty
Inflation (Headline and Core Inflation)
External SectorEarnings from Merchandise Exports
Expenditure from Merchandise Imports
Trade Balance
Tourism: Arrivals and Earnings
Tourism: Monthly Arrivals
Workers’ Remittances
Current Account Balance
Balance of Payment
Foreign Direct Investment Flows
Gross Official Reserves
Exchange Rate Movements
Fiscal SectorGovernment Revenue
Government Expenditure
Public Investment
Budget Deficit
Public Debt
Monetary SectorReserve Money Growth and Money Multiplier
Broad Money Growth
Credit to the Private Sector
Net Credit to Government
Credit to Public Corporations
Net Foreign Assets
Policy Interest Rates and Overnight Money Market Rates
Treasury Bill Yields and the Yield Curve
Market Interest Rates
Financial SectorBanking Sector Indicators(i)
Banking Sector Indicators(ii)
Banking Density
Non-Bank Financial Sector Indicators(i)
Non-Bank Financial Sector Indicators(ii)
Stock Market Performance
Central Bank of Sri Lanka Economic Research Department
Real Sector and Inflation
Central Bank of Sri Lanka Economic Research Department
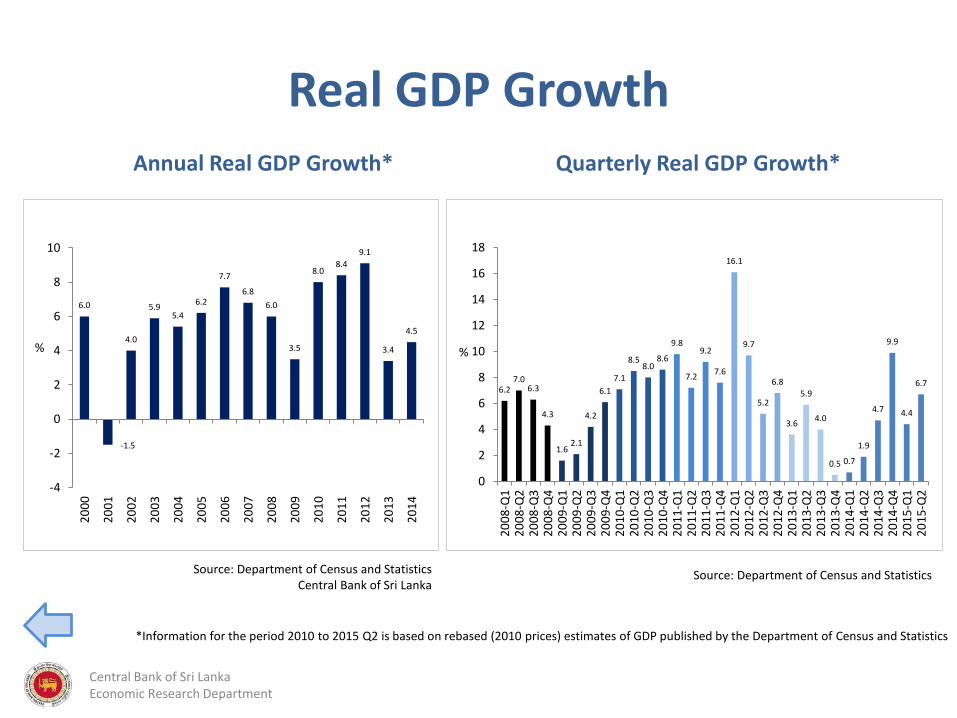
Real GDP GrowthAnnual Real GDP Growth* Quarterly Real GDP Growth*
6.0
-1.5
4.0
5.95.4
6.2
7.7
6.8
6.0
3.5
8.08.4
9.1
3.4
4.5
-4
-2
0
2
4
6
8
10
20
00
20
01
20
02
20
03
20
04
20
05
20
06
20
07
20
08
20
09
20
10
20
11
20
12
20
13
20
14
%
6.27.0
6.3
4.3
1.62.1
4.2
6.1
7.1
8.58.0
8.6
9.8
7.2
9.2
7.6
16.1
9.7
5.2
6.8
3.6
5.9
4.0
0.5 0.7
1.9
4.7
9.9
4.4
6.7
0
2
4
6
8
10
12
14
16
18
20
08
-Q1
20
08
-Q2
20
08
-Q3
20
08
-Q4
20
09
-Q1
20
09
-Q2
20
09
-Q3
20
09
-Q4
20
10
-Q1
20
10
-Q2
20
10
-Q3
20
10
-Q4
20
11
-Q1
20
11
-Q2
20
11
-Q3
20
11
-Q4
20
12
-Q1
20
12
-Q2
20
12
-Q3
20
12
-Q4
20
13
-Q1
20
13
-Q2
20
13
-Q3
20
13
-Q4
20
14
-Q1
20
14
-Q2
20
14
-Q3
20
14
-Q4
20
15
-Q1
20
15
-Q2
%
Central Bank of Sri Lanka Economic Research Department
Source: Department of Census and StatisticsSource: Department of Census and StatisticsCentral Bank of Sri Lanka
*Information for the period 2010 to 2015 Q2 is based on rebased (2010 prices) estimates of GDP published by the Department of Census and Statistics
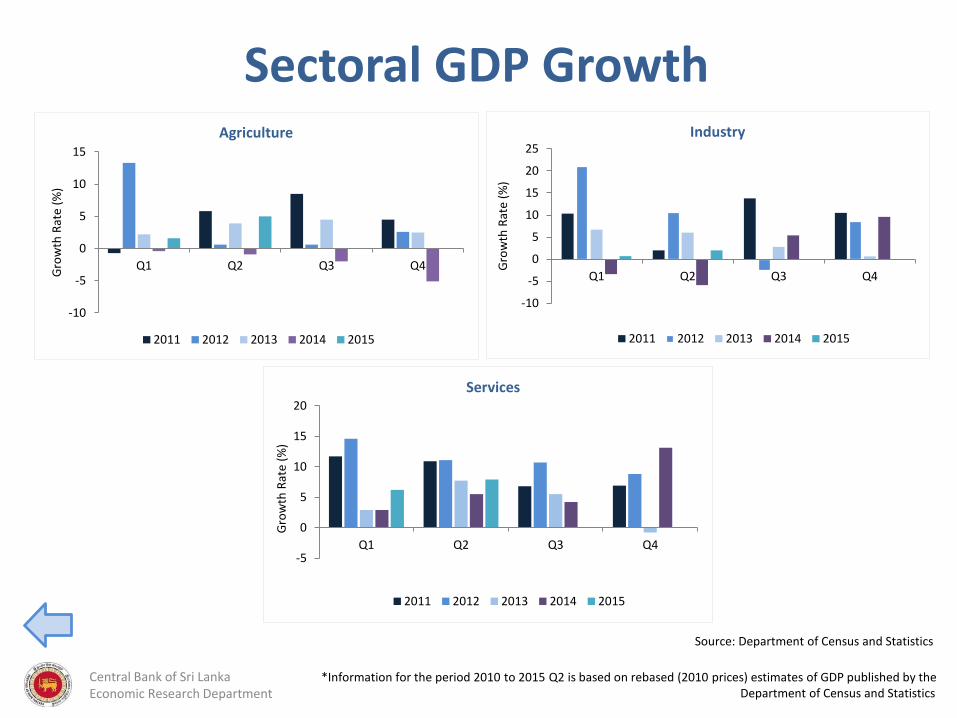
Sectoral GDP Growth
-10
-5
0
5
10
15
Q1 Q2 Q3 Q4
Gro
wth
Rat
e (%
)
Agriculture
2011 2012 2013 2014 2015
-10
-5
0
5
10
15
20
25
Q1 Q2 Q3 Q4
Gro
wth
Rat
e (%
)
Industry
2011 2012 2013 2014 2015
-5
0
5
10
15
20
Q1 Q2 Q3 Q4
Gro
wth
Rat
e (%
)
Services
2011 2012 2013 2014 2015
Central Bank of Sri Lanka Economic Research Department
Source: Department of Census and Statistics
*Information for the period 2010 to 2015 Q2 is based on rebased (2010 prices) estimates of GDP published by the Department of Census and Statistics
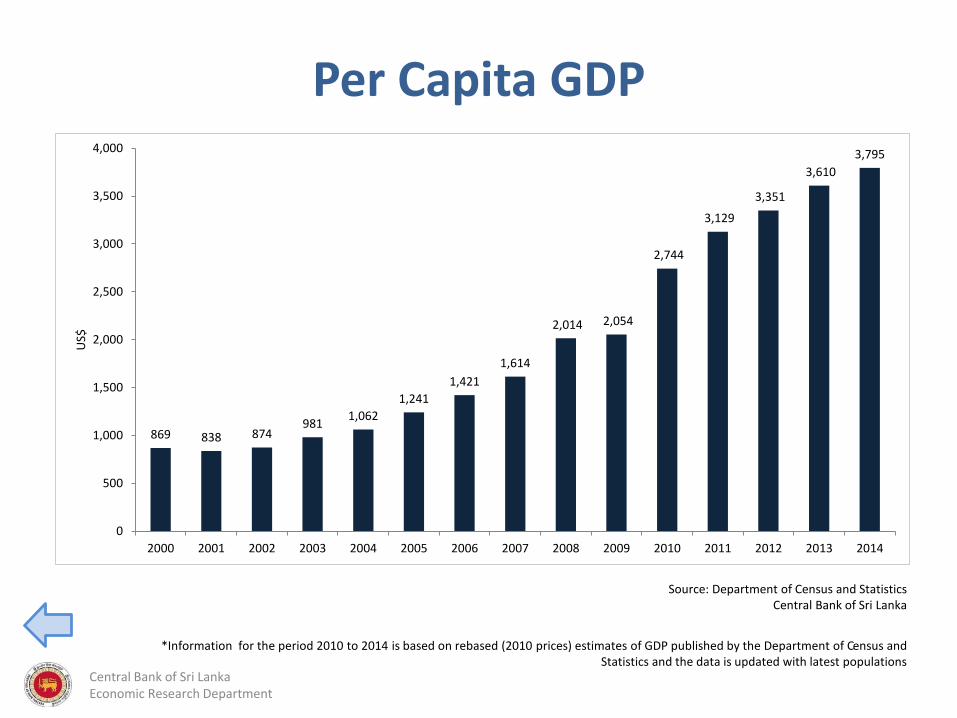
*Information for the period 2010 to 2014 is based on rebased (2010 prices) estimates of GDP published by the Department of Census and Statistics and the data is updated with latest populations
Per Capita GDP
869 838 874981
1,062
1,241
1,421
1,614
2,014 2,054
2,744
3,129
3,351
3,610
3,795
0
500
1,000
1,500
2,000
2,500
3,000
3,500
4,000
2000 2001 2002 2003 2004 2005 2006 2007 2008 2009 2010 2011 2012 2013 2014
US$
Central Bank of Sri Lanka Economic Research Department
Source: Department of Census and StatisticsCentral Bank of Sri Lanka

Unemployment
Central Bank of Sri Lanka Economic Research Department
Source: Department of Census and Statistics
7.67.9
8.88.4 8.3
7.7
6.5
6.0
5.45.8
4.9
4.24.0
4.4 4.34.5
0
1
2
3
4
5
6
7
8
9
10
2000 2001 2002 2003 2004 2005 2006 2007 2008 2009 2010 2011 2012 2013 2014 2015 H1
%
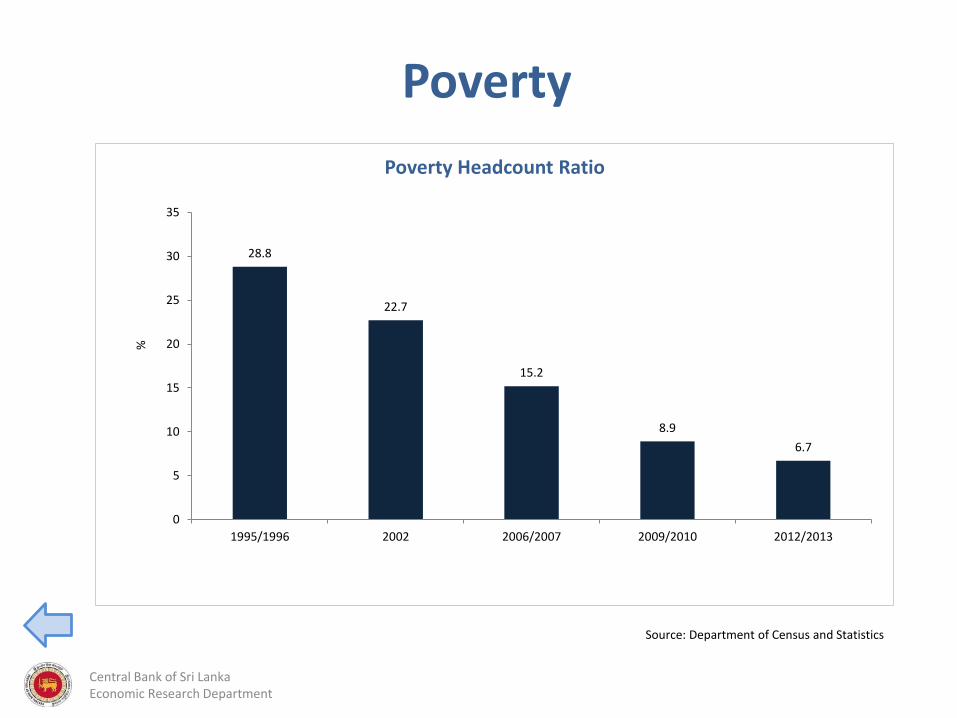
Poverty
28.8
22.7
15.2
8.9
6.7
0
5
10
15
20
25
30
35
1995/1996 2002 2006/2007 2009/2010 2012/2013
%
Poverty Headcount Ratio
Central Bank of Sri Lanka Economic Research Department
Source: Department of Census and Statistics
2.8
0
5
10
15
20
25
30
Mar
-07
Jun
-07
Sep
-07
Dec
-07
Mar
-08
Jun
-08
Sep
-08
Dec
-08
Mar
-09
Jun
-09
Sep
-09
Dec
-09
Mar
-10
Jun
-10
Sep
-10
Dec
-10
Mar
-11
Jun
-11
Sep
-11
Dec
-11
Mar
-12
Jun
-12
Sep
-12
Dec
-12
Mar
-13
Jun
-13
Sep
-13
Dec
-13
Mar
-14
Jun
-14
Sep
-14
Dec
-14
Mar
-15
Jun
-15
%
Core (Y-o-Y) Core (Annual Avg.)
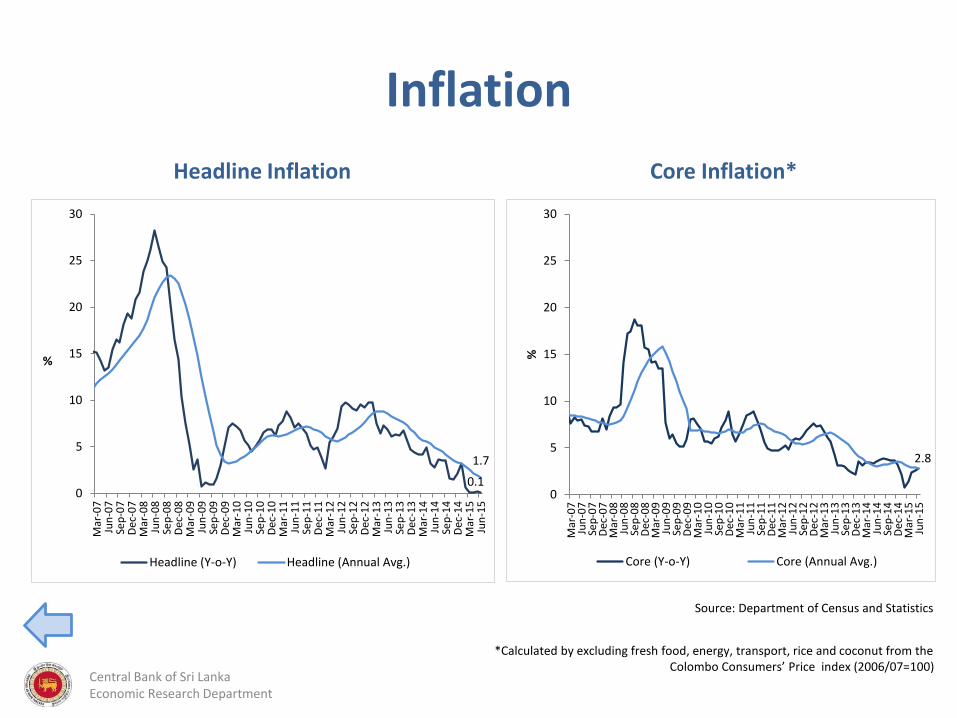
Inflation
Headline Inflation Core Inflation*
Central Bank of Sri Lanka Economic Research Department
Source: Department of Census and Statistics
0.1
1.7
0
5
10
15
20
25
30
Mar
-07
Jun
-07
Sep
-07
Dec
-07
Mar
-08
Jun
-08
Sep
-08
Dec
-08
Mar
-09
Jun
-09
Sep
-09
Dec
-09
Mar
-10
Jun
-10
Sep
-10
Dec
-10
Mar
-11
Jun
-11
Sep
-11
Dec
-11
Mar
-12
Jun
-12
Sep
-12
Dec
-12
Mar
-13
Jun
-13
Sep
-13
Dec
-13
Mar
-14
Jun
-14
Sep
-14
Dec
-14
Mar
-15
Jun
-15
%
Headline (Y-o-Y) Headline (Annual Avg.)
*Calculated by excluding fresh food, energy, transport, rice and coconut from the Colombo Consumers’ Price index (2006/07=100)
External Sector
Central Bank of Sri Lanka Economic Research Department

Earnings from Merchandise Exports
Central Bank of Sri Lanka Economic Research Department
Source: Central Bank of Sri Lanka and Sri Lanka Customs
600
650
700
750
800
850
900
950
1,000
1,050
1,100
Jan Feb Mar Apr May Jun Jul Aug Sep Oct Nov Dec
US$
mn
2013 2014 2015
Merchandise Exports - Monthly
5.5
4.8 4.75.1
5.86.3
6.9
7.68.1
7.1
8.6
10.6
9.810.4
11.1
5.4
0.0
2.0
4.0
6.0
8.0
10.0
12.0
20
00
20
01
20
02
20
03
20
04
20
05
20
06
20
07
20
08
20
09
20
10
20
11
20
12
20
13
20
14
20
15
H1
US$
bn
Merchandise Exports - Annually
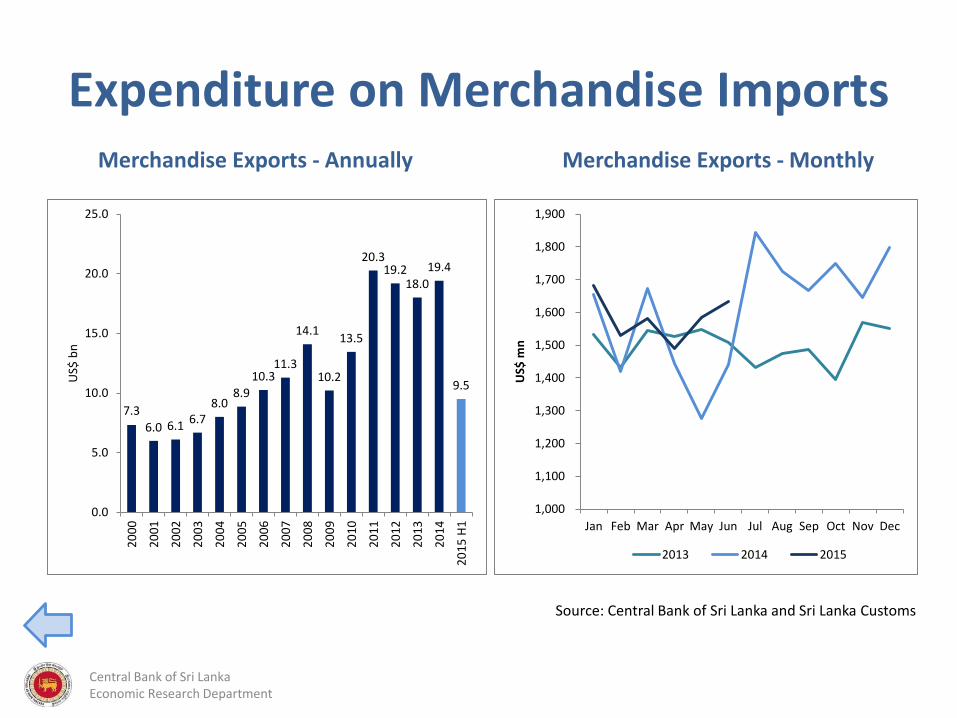
Expenditure on Merchandise Imports
Central Bank of Sri Lanka Economic Research Department
Source: Central Bank of Sri Lanka and Sri Lanka Customs
1,000
1,100
1,200
1,300
1,400
1,500
1,600
1,700
1,800
1,900
Jan Feb Mar Apr May Jun Jul Aug Sep Oct Nov DecU
S$ m
n
2013 2014 2015
Merchandise Exports - Monthly
7.3
6.0 6.16.7
8.08.9
10.311.3
14.1
10.2
13.5
20.319.2
18.0
19.4
9.5
0.0
5.0
10.0
15.0
20.0
25.0
20
00
20
01
20
02
20
03
20
04
20
05
20
06
20
07
20
08
20
09
20
10
20
11
20
12
20
13
20
14
20
15
H1
US$
bn
Merchandise Exports - Annually
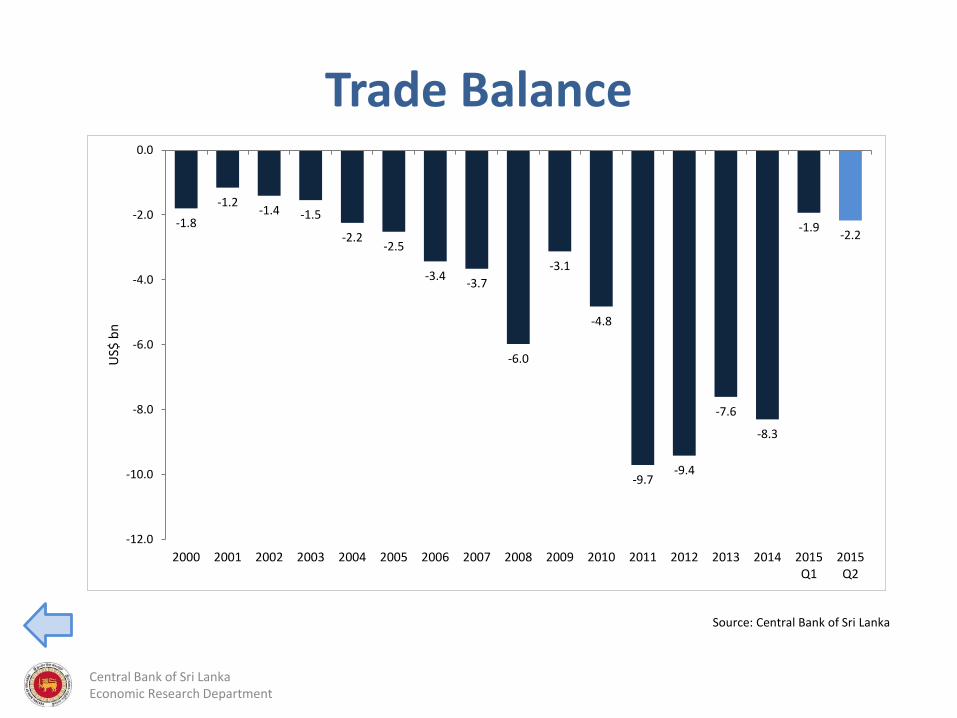
Trade Balance
-1.8
-1.2-1.4 -1.5
-2.2-2.5
-3.4-3.7
-6.0
-3.1
-4.8
-9.7-9.4
-7.6
-8.3
-1.9-2.2
-12.0
-10.0
-8.0
-6.0
-4.0
-2.0
0.0
2000 2001 2002 2003 2004 2005 2006 2007 2008 2009 2010 2011 2012 2013 2014 2015Q1
2015Q2
US$
bn
Central Bank of Sri Lanka Economic Research Department
Source: Central Bank of Sri Lanka

TourismArrivals and Earnings Monthly Arrivals
0
20,000
40,000
60,000
80,000
100,000
120,000
140,000
160,000
180,000
200,000
Jan Feb Mar Apr May Jun Jul Aug Sep Oct Nov Dec
Nu
mb
er2012 2013 2014 2015
252 213
363454 408 429 410 385 342 350
576
830
1,039
1,715
2,431
1,321
0
200,000
400,000
600,000
800,000
1,000,000
1,200,000
1,400,000
1,600,000
1,800,000
0
500
1,000
1,500
2,000
2,500
3,000
20
00
20
01
20
02
20
03
20
04
20
05
20
06
20
07
20
08
20
09
20
10
20
11
20
12
20
13
20
14
20
15 H
1
Nu
mb
er
US$
mn
Earnings from tourism(US$ mn) Tourist arrivals(No)
Central Bank of Sri Lanka Economic Research Department
Source: SLTDASource: Central Bank of Sri Lanka and Sri Lanka Tourist Development Authority (SLTDA)

Workers’ Remittances
1,160 1,155 1,287 1,414 1,305
1,968 2,161
2,502
2,918
3,330
4,116
5,145
5,985
6,407
7,018
3,433
0
1,000
2,000
3,000
4,000
5,000
6,000
7,000
8,000
2000 2001 2002 2003 2004 2005 2006 2007 2008 2009 2010 2011 2012 2013 2014 2015H1
US$
mn
Central Bank of Sri Lanka Economic Research Department
Source: Central Bank of Sri Lanka

Current Account Balance
Central Bank of Sri Lanka Economic Research Department
Source: Central Bank of Sri Lanka
-1.1
-0.2 -0.2-0.1
-0.6 -0.7
-1.5-1.4
-3.9
-0.2
-1.1
-4.6
-4.0
-2.5
-2.0
-0.9
-5.0
-4.5
-4.0
-3.5
-3.0
-2.5
-2.0
-1.5
-1.0
-0.5
0.0
2000 2001 2002 2003 2004 2005 2006 2007 2008 2009 2010 2011 2012 2013 2014 2015 H1
US$
bn

Foreign Direct Investment Inflows
175 82
197 229 223 272
604
734
889
601 516
1,066
1,382 1,437
1,685
544
0
200
400
600
800
1,000
1,200
1,400
1,600
1,800
20
00
20
01
20
02
20
03
20
04
20
05
20
06
20
07
20
08
20
09
20
10
20
11
20
12
20
13
20
14
20
15
H1
US$
mn
Central Bank of Sri LankaEconomic Research Department
Source: Central Bank of Sri Lanka, Board of Investment and Colombo Stock Exchange
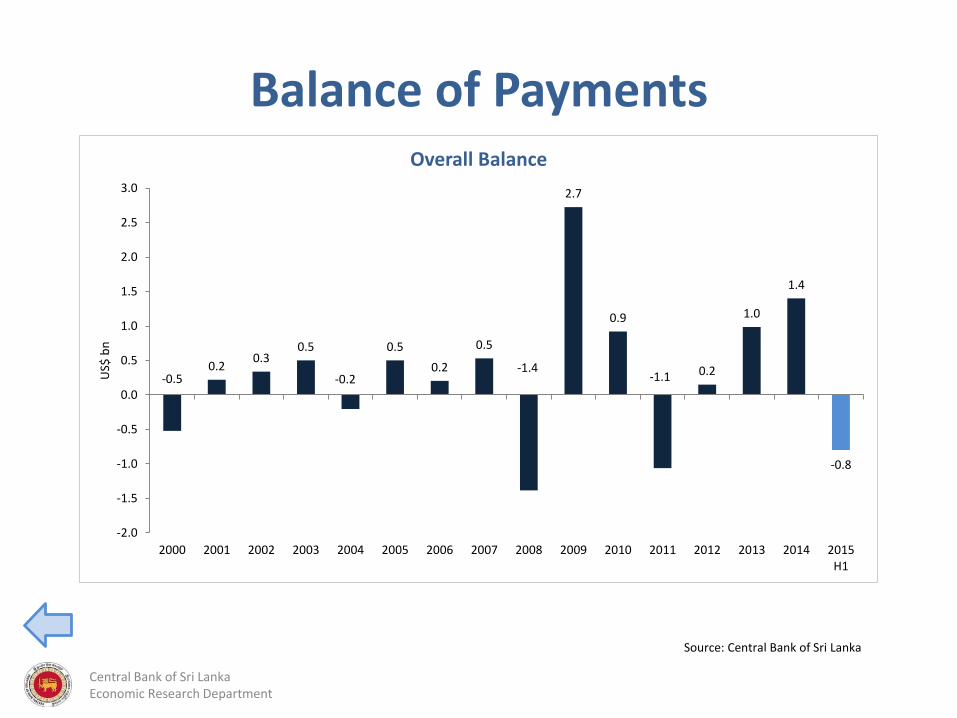
Balance of Payments
-0.50.2
0.30.5
-0.2
0.5
0.2
0.5
-1.4
2.7
0.9
-1.1 0.2
1.0
1.4
-0.8
-2.0
-1.5
-1.0
-0.5
0.0
0.5
1.0
1.5
2.0
2.5
3.0
2000 2001 2002 2003 2004 2005 2006 2007 2008 2009 2010 2011 2012 2013 2014 2015H1
US$
bn
Overall Balance
Central Bank of Sri Lanka Economic Research Department
Source: Central Bank of Sri Lanka

Gross Official Reserves
Central Bank of Sri Lanka Economic Research Department
Source: Central Bank of Sri Lanka
0
1
2
3
4
5
6
7
8
0
1
2
3
4
5
6
7
8
9
10
Mar
-09
Jun
-09
Sep
-09
De
c-0
9
Mar
-10
Jun
-10
Sep
-10
De
c-1
0
Mar
-11
Jun
-11
Sep
-11
De
c-1
1
Mar
-12
Jun
-12
Sep
-12
De
c-1
2
Mar
-13
Jun
-13
Sep
-13
De
c-1
3
Mar
-14
Jun
-14
Sep
-14
De
c-1
4
Mar
-15
Jun
-15
Mo
nth
s
US$
bn
Gross Official Reserves and Months of Imports
Gross Official Reserves Months of Imports

Exchange Rate Movements
Source: Central Bank of Sri Lanka
109
114
119
124
129
134
139
Mar
-12
Jun
-12
Sep
-12
De
c-1
2
Mar
-13
Jun
-13
Sep
-13
De
c-1
3
Mar
-14
Jun
-14
Sep
-14
De
c-1
4
Mar
-15
Jun
-15
Rs. US Dollar
98103108113118123128133138143
Mar
-12
Jun
-12
Sep
-12
De
c-1
2
Mar
-13
Jun
-13
Sep
-13
De
c-1
3
Mar
-14
Jun
-14
Sep
-14
De
c-1
4
Mar
-15
Jun
-15
Rs. Australian Dollar
1.00
1.10
1.20
1.30
1.40
1.50
1.60
1.70
1.80
Mar
-12
Jun
-12
Sep
-12
De
c-1
2
Mar
-13
Jun
-13
Sep
-13
De
c-1
3
Mar
-14
Jun
-14
Sep
-14
De
c-1
4
Mar
-15
Jun
-15
Rs. Japanese Yen
170
180
190
200
210
220
230
Mar
-12
Jun
-12
Sep
-12
De
c-1
2
Mar
-13
Jun
-13
Sep
-13
De
c-1
3
Mar
-14
Jun
-14
Sep
-14
De
c-1
4
Mar
-15
Jun
-15
Rs. Sterling Pound
1.90
2.00
2.10
2.20
2.30
2.40
2.50
2.60
2.70
Mar
-12
Jun
-12
Sep
-12
De
c-1
2
Mar
-13
Jun
-13
Sep
-13
De
c-1
3
Mar
-14
Jun
-14
Sep
-14
De
c-1
4
Mar
-15
Jun
-15
Rs. Indian Rupee
138
148
158
168
178
Mar
-12
Jun
-12
Sep
-12
De
c-1
2
Mar
-13
Jun
-13
Sep
-13
De
c-1
3
Mar
-14
Jun
-14
Sep
-14
De
c-1
4
Mar
-15
Jun
-15
Rs. Euro
Central Bank of Sri Lanka Economic Research Department

Fiscal Sector
Central Bank of Sri Lanka Economic Research Department
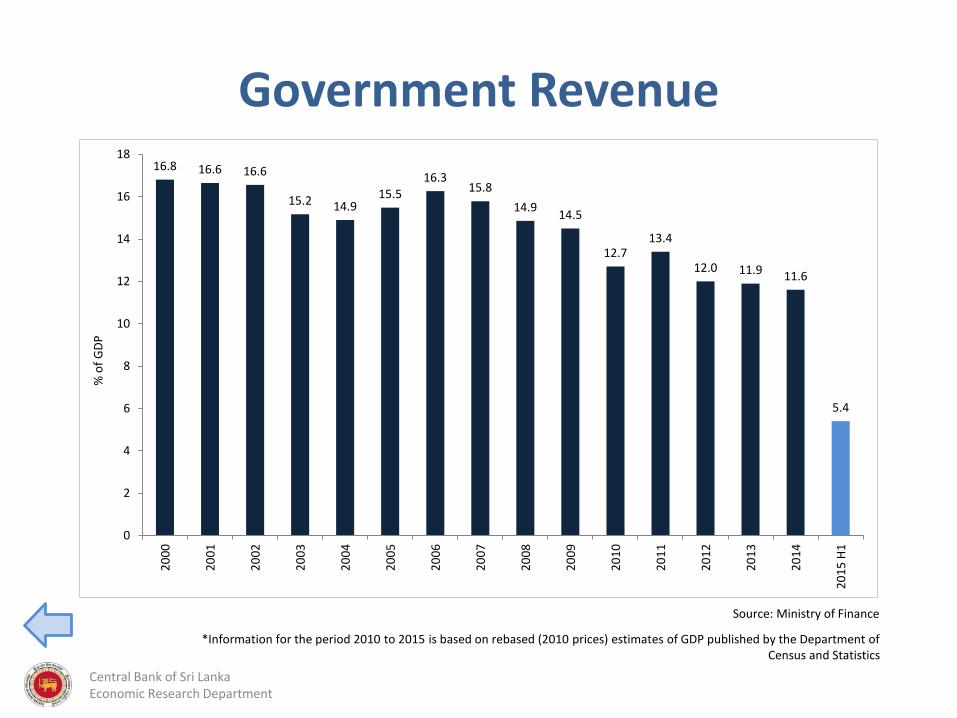
Government Revenue16.8 16.6 16.6
15.2 14.915.5
16.315.8
14.914.5
12.713.4
12.0 11.9 11.6
5.4
0
2
4
6
8
10
12
14
16
182
00
0
20
01
20
02
20
03
20
04
20
05
20
06
20
07
20
08
20
09
20
10
20
11
20
12
20
13
20
14
20
15
H1
% o
f G
DP
Central Bank of Sri Lanka Economic Research Department
Source: Ministry of Finance
*Information for the period 2010 to 2015 is based on rebased (2010 prices) estimates of GDP published by the Department of Census and Statistics

Government ExpenditureRecurrent Expenditure
20.2
21.6 20.9
18.4 18.6 18.1
18.6 17.4 16.9
18.2
14.6 14.213.0 12.6 12.9
6.8
0
5
10
15
20
25
20
00
20
01
20
02
20
03
20
04
20
05
20
06
20
07
20
08
20
09
20
10
20
11
20
12
20
13
20
14
20
15
H1
% o
f G
DP
Central Bank of Sri Lanka Economic Research Department
Source: Ministry of Finance
6.5
5.9
4.6 4.6
4.2
5.8 5.6
6.1
5.7
6.7
5.3
5.7
4.9 4.84.6
2.1
0
1
2
3
4
5
6
7
8
20
00
20
01
20
02
20
03
20
04
20
05
20
06
20
07
20
08
20
09
20
10
20
11
20
12
20
13
20
14
20
15
H1
% o
f G
DP
Capital and Net Lending
*Information for the period 2010 to 2015 is based on rebased (2010 prices) estimates of GDP published by the Department of Census and Statistics
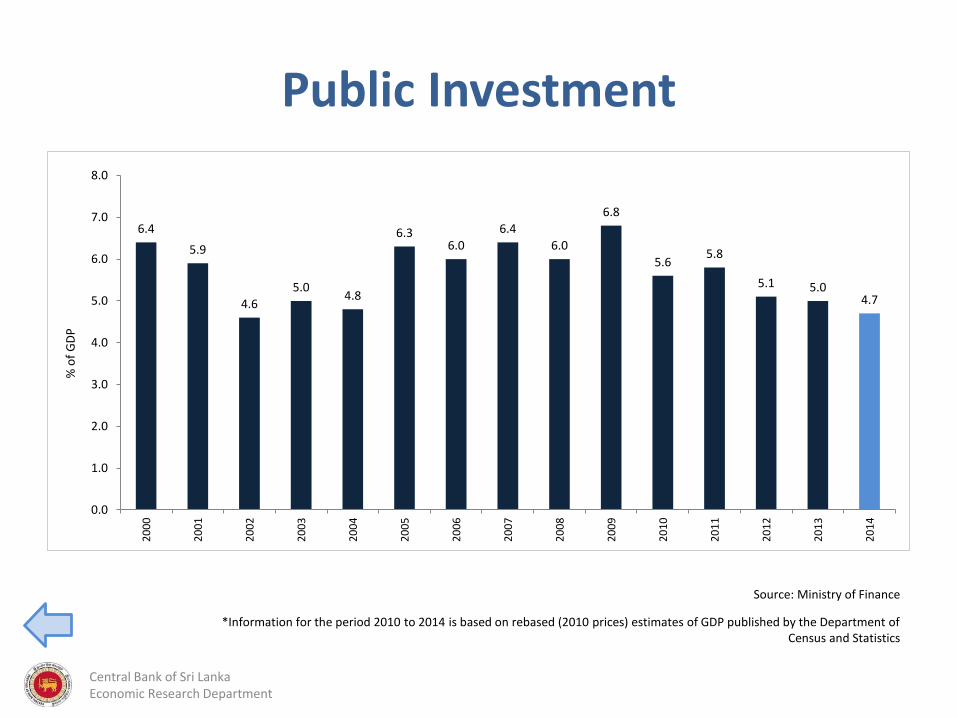
Public Investment
6.4
5.9
4.6
5.04.8
6.36.0
6.4
6.0
6.8
5.65.8
5.1 5.04.7
0.0
1.0
2.0
3.0
4.0
5.0
6.0
7.0
8.0
20
00
20
01
20
02
20
03
20
04
20
05
20
06
20
07
20
08
20
09
20
10
20
11
20
12
20
13
20
14
% o
f G
DP
Central Bank of Sri Lanka Economic Research Department
Source: Ministry of Finance
*Information for the period 2010 to 2014 is based on rebased (2010 prices) estimates of GDP published by the Department of Census and Statistics

Budget Deficit
9.5
10.4
8.5
7.3 7.57.0 7.0 6.9 7.0
9.9
7.0
6.2
5.6 5.45.7
3.6
0.0
2.0
4.0
6.0
8.0
10.0
12.0
2000 2001 2002 2003 2004 2005 2006 2007 2008 2009 2010 2011 2012 2013 2014 2015H1
% o
f G
DP
Central Bank of Sri Lanka Economic Research Department
Source: Ministry of Finance
*Information for the period 2010 to 2015 is based on rebased (2010 prices) estimates of GDP published by the Department of Census and Statistics

Central Government Debt
96.9
103.3105.6
102.3 102.3
90.687.9
85.081.4
86.2
71.6 71.168.7
70.8 71.8
0
20
40
60
80
100
120
20
00
20
01
20
02
20
03
20
04
20
05
20
06
20
07
20
08
20
09
20
10
20
11
20
12
20
13
20
14
% o
f G
DP
Central Bank of Sri Lanka Economic Research Department
Source: Ministry of Finance
*Information for the period 2010 to 2014 is based on rebased (2010 prices) estimates of GDP published by the Department of Census and Statistics

Monetary Sector
Central Bank of Sri Lanka Economic Research Department

Reserve Money Growth and Money Multiplier
Reserve Money Growth(Y-O-Y) Money Multiplier
Central Bank of Sri Lanka Economic Research Department
Source: Central Bank of Sri Lanka
0
1
2
3
4
5
6
7
20
00
20
01
20
02
20
03
20
04
20
05
20
06
20
07
20
08
20
09
20
10
20
11
20
12
20
13
20
14
20
15
H1
M1 M2 M2b
24.7
20.6
8.8
-1.6
3.4
1.5
18.919.8
-5
0
5
10
15
20
25
30
Mar
-11
Jun
-11
Sep
-11
De
c-1
1
Mar
-12
Jun
-12
Sep
-12
De
c-1
2
Mar
-13
Jun
-13
Sep
-13
De
c-1
3
Mar
-14
Jun
-14
Sep
-14
De
c-1
4
Mar
-15
Jun
-15
% Y
-O-Y
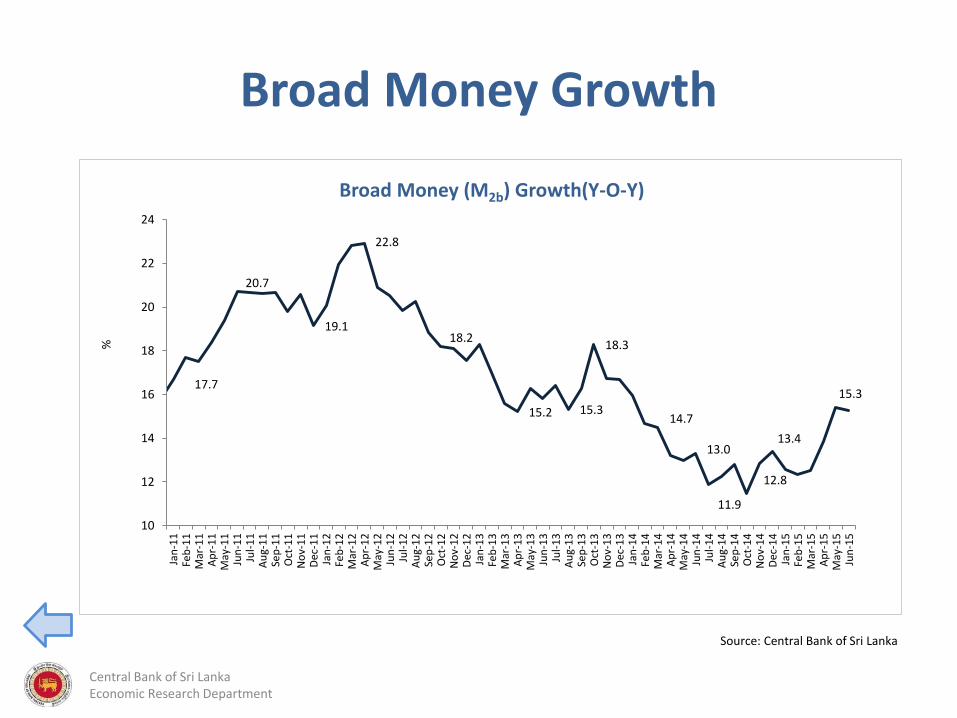
Broad Money Growth
17.7
20.7
19.1
22.8
18.2
15.2 15.3
18.3
14.7
13.0
11.9
12.8
13.4
15.3
10
12
14
16
18
20
22
24
Jan
-11
Feb
-11
Mar
-11
Ap
r-1
1M
ay-1
1Ju
n-1
1Ju
l-1
1A
ug-
11
Sep
-11
Oct
-11
No
v-1
1D
ec-1
1Ja
n-1
2Fe
b-1
2M
ar-1
2A
pr-
12
May
-12
Jun
-12
Jul-
12
Au
g-1
2Se
p-1
2O
ct-1
2N
ov-
12
Dec
-12
Jan
-13
Feb
-13
Mar
-13
Ap
r-1
3M
ay-1
3Ju
n-1
3Ju
l-1
3A
ug-
13
Sep
-13
Oct
-13
No
v-1
3D
ec-1
3Ja
n-1
4Fe
b-1
4M
ar-1
4A
pr-
14
May
-14
Jun
-14
Jul-
14
Au
g-1
4Se
p-1
4O
ct-1
4N
ov-
14
Dec
-14
Jan
-15
Feb
-15
Mar
-15
Ap
r-1
5M
ay-1
5Ju
n-1
5
%
Broad Money (M2b) Growth(Y-O-Y)
Central Bank of Sri Lanka Economic Research Department
Source: Central Bank of Sri Lanka

Credit to the Private Sector
Central Bank of Sri Lanka Economic Research Department
Source: Central Bank of Sri Lanka
-10
-5
0
5
10
15
20
25
30
35
40
0
500
1000
1500
2000
2500
3000
Mar
-01
Jun
-01
Sep
-01
Dec
-01
Mar
-02
Jun
-02
Sep
-02
Dec
-02
Mar
-03
Jun
-03
Sep
-03
Dec
-03
Mar
-04
Jun
-04
Sep
-04
Dec
-04
Mar
-05
Jun
-05
Sep
-05
Dec
-05
Mar
-06
Jun
-06
Sep
-06
Dec
-06
Mar
-07
Jun
-07
Sep
-07
Dec
-07
Mar
-08
Jun
-08
Sep
-08
Dec
-08
Mar
-09
Jun
-09
Sep
-09
Dec
-09
Mar
-10
Jun
-10
Sep
-10
Dec
-10
Mar
-11
Jun
-11
Sep
-11
Dec
-11
Mar
-12
Jun
-12
Sep
-12
Dec
-12
Mar
-13
Jun
-13
Sep
-13
Dec
-13
Mar
-14
Jun
-14
Sep
-14
Dec
-14
Mar
-15
Jun
-15
%
Rs.
bn
Private Sector Credit Volume(LHS) Private Sector Credit Growth(RHS)

Net Credit to the Government
Central Bank of Sri LankaEconomic Research Department
Source: Central Bank of Sri Lanka
0
200
400
600
800
1000
1200
1400
1600
1800
0
200
400
600
800
1000
1200
1400
1600
1800
Jan
-00
Jun
-00
No
v-0
0
Ap
r-0
1
Sep
-01
Feb
-02
Jul-
02
De
c-0
2
May
-03
Oct
-03
Mar
-04
Au
g-0
4
Jan
-05
Jun
-05
No
v-0
5
Ap
r-0
6
Sep
-06
Feb
-07
Jul-
07
De
c-0
7
May
-08
Oct
-08
Mar
-09
Au
g-0
9
Jan
-10
Jun
-10
No
v-1
0
Ap
r-1
1
Sep
-11
Feb
-12
Jul-
12
De
c-1
2
May
-13
Oct
-13
Mar
-14
Au
g-1
4
Jan
-15
Jun
-15
Rs.
bn
Central Bank Commercial Banks Claim on Government (net)
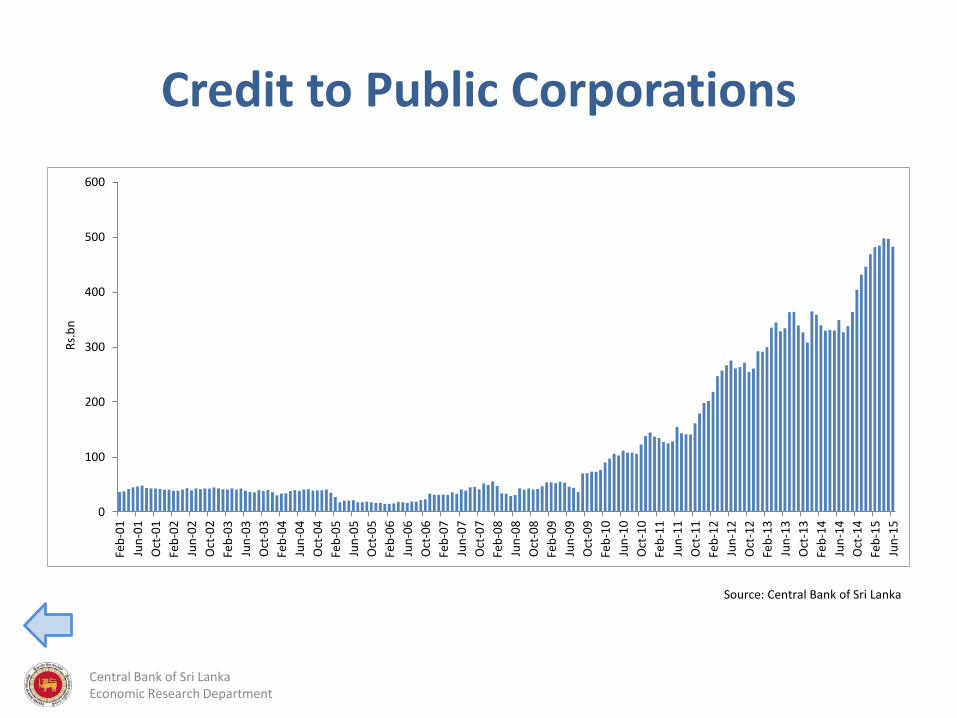
Credit to Public Corporations
Central Bank of Sri Lanka Economic Research Department
Source: Central Bank of Sri Lanka
0
100
200
300
400
500
600
Feb
-01
Jun
-01
Oct
-01
Feb
-02
Jun
-02
Oct
-02
Feb
-03
Jun
-03
Oct
-03
Feb
-04
Jun
-04
Oct
-04
Feb
-05
Jun
-05
Oct
-05
Feb
-06
Jun
-06
Oct
-06
Feb
-07
Jun
-07
Oct
-07
Feb
-08
Jun
-08
Oct
-08
Feb
-09
Jun
-09
Oct
-09
Feb
-10
Jun
-10
Oct
-10
Feb
-11
Jun
-11
Oct
-11
Feb
-12
Jun
-12
Oct
-12
Feb
-13
Jun
-13
Oct
-13
Feb
-14
Jun
-14
Oct
-14
Feb
-15
Jun
-15
Rs.
bn

Net Foreign Assets(NFA)
Central Bank of Sri Lanka Economic Research Department
Source: Central Bank of Sri Lanka
-1,000
-800
-600
-400
-200
0
200
400
600
800
1,000
De
c-0
2M
ar-0
3Ju
n-0
3Se
p-0
3D
ec-
03
Mar
-04
Jun
-04
Sep
-04
De
c-0
4M
ar-0
5Ju
n-0
5Se
p-0
5D
ec-
05
Mar
-06
Jun
-06
Sep
-06
De
c-0
6M
ar-0
7Ju
n-0
7Se
p-0
7D
ec-
07
Mar
-08
Jun
-08
Sep
-08
De
c-0
8M
ar-0
9Ju
n-0
9Se
p-0
9D
ec-
09
Mar
-10
Jun
-10
Sep
-10
De
c-1
0M
ar-1
1Ju
n-1
1Se
p-1
1D
ec-
11
Mar
-12
Jun
-12
Sep
-12
De
c-1
2M
ar-1
3Ju
n-1
3Se
p-1
3D
ec-
13
Mar
-14
Jun
-14
Sep
-14
De
c-1
4M
ar-1
5Ju
n-1
5
Rs.
bn
NFA of Central Bank NFA of Commercial Banks NFA of the Banking System
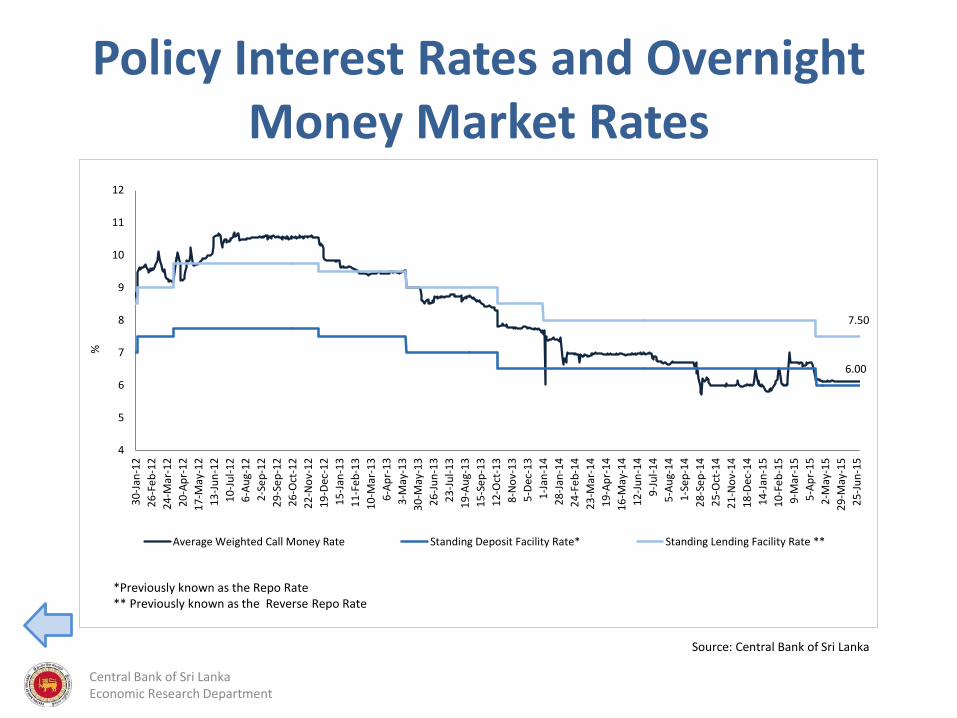
Policy Interest Rates and Overnight Money Market Rates
6.00
7.50
4
5
6
7
8
9
10
11
12
30
-Jan
-12
26
-Fe
b-1
2
24
-Mar
-12
20
-Ap
r-1
2
17
-May
-12
13
-Ju
n-1
2
10
-Ju
l-1
2
6-A
ug-
12
2-S
ep
-12
29
-Se
p-1
2
26
-Oct
-12
22
-No
v-1
2
19
-Dec
-12
15
-Jan
-13
11
-Fe
b-1
3
10
-Mar
-13
6-A
pr-
13
3-M
ay-1
3
30
-May
-13
26
-Ju
n-1
3
23
-Ju
l-1
3
19
-Au
g-1
3
15
-Se
p-1
3
12
-Oct
-13
8-N
ov-
13
5-D
ec-1
3
1-J
an-1
4
28
-Jan
-14
24
-Fe
b-1
4
23
-Mar
-14
19
-Ap
r-1
4
16
-May
-14
12
-Ju
n-1
4
9-J
ul-
14
5-A
ug-
14
1-S
ep
-14
28
-Se
p-1
4
25
-Oct
-14
21
-No
v-1
4
18
-Dec
-14
14
-Jan
-15
10
-Fe
b-1
5
9-M
ar-1
5
5-A
pr-
15
2-M
ay-1
5
29
-May
-15
25
-Ju
n-1
5
%
Average Weighted Call Money Rate Standing Deposit Facility Rate* Standing Lending Facility Rate **
*Previously known as the Repo Rate** Previously known as the Reverse Repo Rate
Central Bank of Sri Lanka Economic Research Department
Source: Central Bank of Sri Lanka

Treasury Bill Yields and the Yield Curve
0
2
4
6
8
10
12
14
16
1-J
an-1
12
8-F
eb-1
12
7-A
pr-
11
24
-Ju
n-1
12
1-A
ug-
11
18
-Oct
-11
15
-Dec
-11
11
-Feb
-12
9-A
pr-
126
-Ju
n-1
23
-Au
g-12
30
-Sep
-12
27
-No
v-1
22
4-J
an-1
32
3-M
ar-1
32
0-M
ay-1
31
7-J
ul-
13
13
-Sep
-13
10
-No
v-1
37
-Jan
-14
6-M
ar-1
43
-May
-14
30
-Ju
n-1
42
7-A
ug-
14
24
-Oct
-14
21
-Dec
-14
17
-Feb
-15
16
-Ap
r-1
51
3-J
un
-15
%
Treasury Bill Yields and Policy Interest Rates
91- Day Treasury bill 182- Day Treasury bill364- Day Treasury bill Standing Deposit Facility RateStanding Lending Facility Rate
Central Bank of Sri Lanka Economic Research Department
Source: Central Bank of Sri Lanka
5
6
7
8
9
10
11
12
13
3 M
on
th
6 M
on
th
12
Mo
nth
2 Y
ear
3 Y
ear
4 Y
ear
5 Y
ear
6 Y
ear
8 Y
ear
10
Yea
r
15
Yea
r
20
Yea
r
30
Yea
r
%
Secondary Market Yield Curve
End 2011 End 2012 End 2013
End 2014 2015 H1
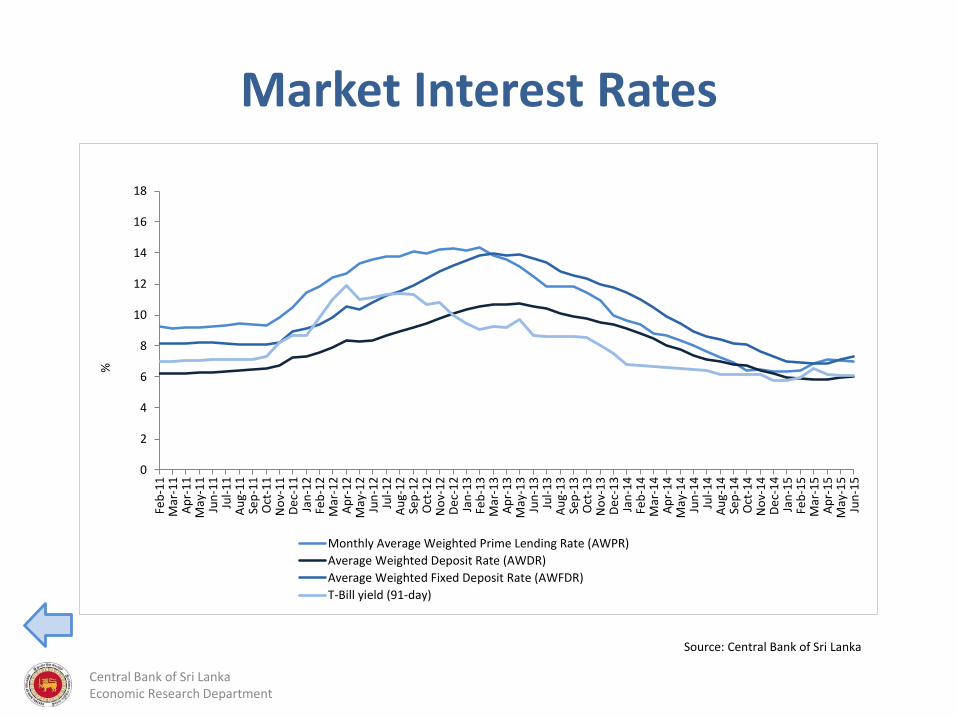
Market Interest Rates
0
2
4
6
8
10
12
14
16
18
Feb
-11
Mar
-11
Ap
r-1
1M
ay-1
1Ju
n-1
1Ju
l-1
1A
ug-
11
Sep
-11
Oct
-11
No
v-1
1D
ec-
11
Jan
-12
Feb
-12
Mar
-12
Ap
r-1
2M
ay-1
2Ju
n-1
2Ju
l-1
2A
ug-
12
Sep
-12
Oct
-12
No
v-1
2D
ec-
12
Jan
-13
Feb
-13
Mar
-13
Ap
r-1
3M
ay-1
3Ju
n-1
3Ju
l-1
3A
ug-
13
Sep
-13
Oct
-13
No
v-1
3D
ec-
13
Jan
-14
Feb
-14
Mar
-14
Ap
r-1
4M
ay-1
4Ju
n-1
4Ju
l-1
4A
ug-
14
Sep
-14
Oct
-14
No
v-1
4D
ec-
14
Jan
-15
Feb
-15
Mar
-15
Ap
r-1
5M
ay-1
5Ju
n-1
5
%
Monthly Average Weighted Prime Lending Rate (AWPR)
Average Weighted Deposit Rate (AWDR)
Average Weighted Fixed Deposit Rate (AWFDR)
T-Bill yield (91-day)
Central Bank of Sri Lanka Economic Research Department
Source: Central Bank of Sri Lanka

Financial Sector
Central Bank of Sri Lanka Economic Research Department
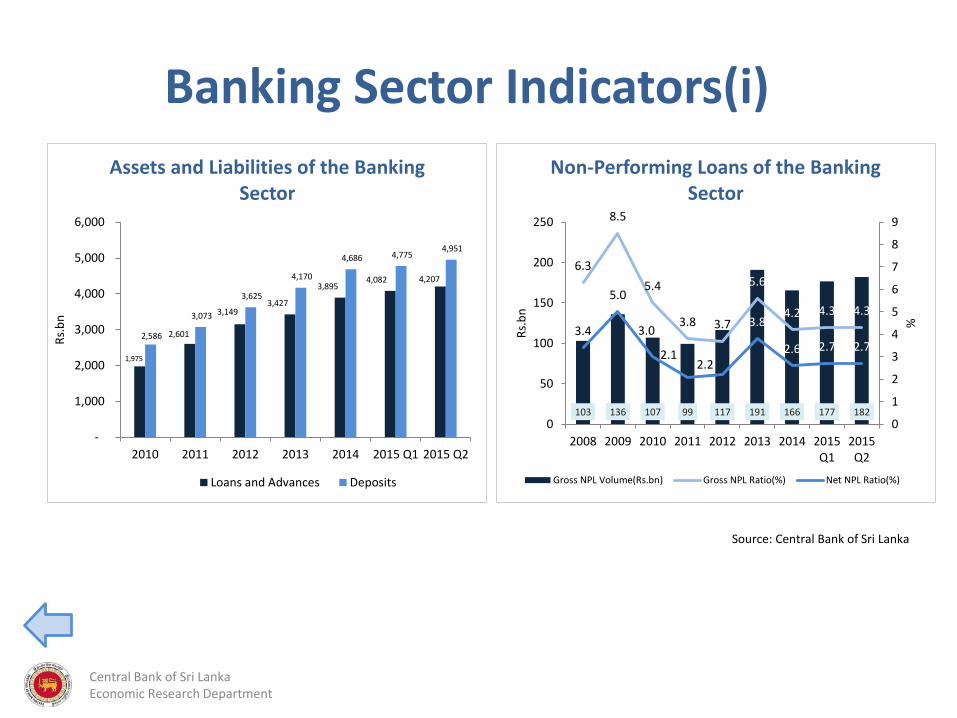
Banking Sector Indicators(i)
103 136 107 99 117 191 166 177 182
6.3
8.5
5.4
3.8 3.7
5.6
4.2 4.3 4.3
3.4
5.0
3.0
2.12.2
3.8
2.6 2.7 2.7
0
1
2
3
4
5
6
7
8
9
0
50
100
150
200
250
2008 2009 2010 2011 2012 2013 2014 2015Q1
2015Q2
%
Rs.
bn
Non-Performing Loans of the Banking Sector
Gross NPL Volume(Rs.bn) Gross NPL Ratio(%) Net NPL Ratio(%)
1,975
2,601
3,149 3,427
3,895 4,082 4,207
2,586
3,073
3,625
4,170
4,686 4,775 4,951
-
1,000
2,000
3,000
4,000
5,000
6,000
2010 2011 2012 2013 2014 2015 Q1 2015 Q2
Rs.
bn
Assets and Liabilities of the Banking Sector
Loans and Advances Deposits
Central Bank of Sri Lanka Economic Research Department
Source: Central Bank of Sri Lanka

Banking Sector Indicators(ii)
13.4
11.8
22.0
19.8 20.3
16.0 16.6 16.716.0
4.44.6 4.6
4.2 4.1
3.5 3.5
3.93.7
1.1 1.0
1.8 1.7 1.7
1.3 1.4 1.4 1.3
1
2
3
4
5
0
5
10
15
20
25
2008 2009 2010 2011 2012 2013 2014 2015Q1
2015Q2
%%
Profitability Indicators
Return on Equity Net Interest Margin Return on Assets
1,571 1,527 1,815 2,269 2,601 2,942 3,483 3,639 3,800
12.5
14.114.3 14.4
14.7 14.9
14.113.8
13.5
14.5
16.1 16.216.0
16.4
17.6
16.7
16.316.0
10
11
12
13
14
15
16
17
18
-
500
1,000
1,500
2,000
2,500
3,000
3,500
4,000
2008 2009 2010 2011 2012 2013 2014 2015Q1
2015Q2
%
Rs.
bn
Capital Adequacy Ratios
Risk Weighted Aseets (Rs.bn) Core CAR (%) Total CAR (%)
Central Bank of Sri Lanka Economic Research Department
Source: Central Bank of Sri Lanka

Banking Density by Province2009 2015 H1
Central Bank of Sri Lanka Economic Research Department
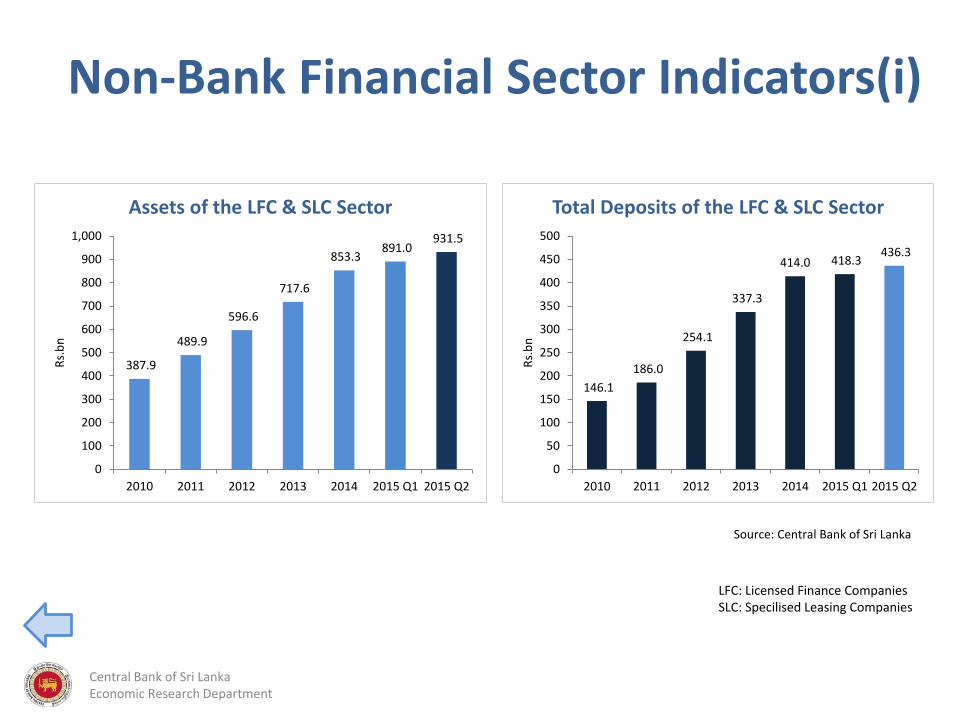
Non-Bank Financial Sector Indicators(i)
387.9
489.9
596.6
717.6
853.3 891.0
931.5
0
100
200
300
400
500
600
700
800
900
1,000
2010 2011 2012 2013 2014 2015 Q1 2015 Q2
Rs.
bn
Assets of the LFC & SLC Sector
146.1
186.0
254.1
337.3
414.0 418.3 436.3
0
50
100
150
200
250
300
350
400
450
500
2010 2011 2012 2013 2014 2015 Q1 2015 Q2
Rs.
bn
Total Deposits of the LFC & SLC Sector
Central Bank of Sri LankaEconomic Research Department
Source: Central Bank of Sri Lanka
LFC: Licensed Finance CompaniesSLC: Specilised Leasing Companies

Non-Bank Financial Sector Indicators(ii)
4.16.9
7.6 7.4
6.6
8.08.7
0.4 3.2 5.9 4.22.1
3.03.8
-2.8
11.6
34.3
18.9
8.2
13.117.8
-5
0
5
10
15
20
25
30
35
40
2009 2010 2011 2012 2013 2014 2015 H1
%
Profitability Indicators of the LFC and SLC Sector
Net Interest Margin Return on Assets Return on Equity
Central Bank of Sri LankaEconomic Research Department
Source: Central Bank of Sri Lanka
17.9 20.9 19.8 23.5 37.0 44.3 43.3 46.0
9.1
7.9
5.1
5.0
6.7 6.96.3 6.4
4.53.4
1.9 1.6
2.5 2.31.9 1.8
0
2
4
6
8
10
0
5
10
15
20
25
30
35
40
45
50
2009 2010 2011 2012 2013 2014 2015Q1
2015Q2
%
Rs.
bn
Non-Performing Advances
Gross NPA (Rs.bn) Gross NPA Ratio (%) Net NPA Ratio (%)

Stock Market PerformanceShare Price Indices and Market Capitalisation Net Foreign Inflows to the Secondary
Market
Central Bank of Sri Lanka Economic Research Department
Source: Colombo Stock Exchange
0
500
1,000
1,500
2,000
2,500
3,000
3,500
0
1,000
2,000
3,000
4,000
5,000
6,000
7,000
8,000
9,000
2-J
an-1
1
25
-Mar
-11
15
-Ju
n-1
1
5-S
ep
-11
26
-No
v-1
1
16
-Fe
b-1
2
8-M
ay-1
2
29
-Ju
l-1
2
19
-Oct
-12
9-J
an-1
3
1-A
pr-
13
22
-Ju
n-1
3
12
-Se
p-1
3
3-D
ec-1
3
23
-Fe
b-1
4
16
-May
-14
6-A
ug-
14
27
-Oct
-14
17
-Jan
-15
9-A
pr-
15
30
-Ju
n-1
5
Rs.
bn
Ind
ex
Share Price Indices and Market Capitalisation
Market Capitalisation (RHS) All Share Price Index (LHS)
S&P SL 20 Index (LHS)
-6.3
-229.7
-171.2
305.2
178.7158.3
13.6
-300
-200
-100
0
100
200
300
400
2009 2010 2011 2012 2013 2014 2015 H2
US$
mn
Net Foreign inflows
The sets of graphs above summarise macroeconomicand financial market trends in Sri Lanka. However,these graphs do not provide source data. An extensiveset of data is available in the CBSL website. Informationfor 2015 H1 is provisional.
Central Bank of Sri Lanka Economic Research Department