
Sri Lanka Banking Report - assets.kpmg · The banking industry in Sri Lanka continues to have a...
40
Sri Lanka Banking Report Issue 4 October 2019
Transcript of Sri Lanka Banking Report - assets.kpmg · The banking industry in Sri Lanka continues to have a...

Sri Lanka Banking Report
Issue 4October 2019

ContentsForeword 03
Executive Summary 04
Performance Highlights 05
Banking and TechnologyGoverning the Back Office Automation
Protecting your Organization in the Future
08
11
The Future is open: Reshaping the Banking Experience 12

Banking Sector Outlook 23
Outlook on the sector’s Non Performing loans 31
Acknowledgements 36
KPMG Leadership - Banking 38
Regulatory Outlook
SLFRS 16 - Leases
The Accounting Impact of the LIBOR transition
16
19
Combatting Financial Crime 21

3 | Sri Lanka Banking Report – Issue 04
© 2019 KPMG, a Sri Lankan partnership, and a member firm of the KPMG network of independent member firms affiliated with KPMG International Cooperative (“KPMG International”), a Swiss entity. All rights reserved. © 2019 KPMG, a Sri Lankan partnership, and a member firm of the KPMG network of independent member firms affiliated with KPMG International Cooperative (“KPMG International”), a Swiss entity. All rights reserved.
Ranjani JosephPartner,Head of Banking Services and Markets,Deputy Head of Audit
The banking industry in Sri Lanka continues to have a challenging year as 2019 progresses. New emerging technology risks, ongoing operational risks and a rising focus on environmental risks are all making the financial services agenda increasingly fluid, complex and uncertain. As liquidity remains a key focus, the economic conditions coupled with several stringent measures introduced by CBSL have put pressure on the NIMs of banks.
The traditional way of conducting business is reaching redundancy in ever accelerating ways. Digital transformation and automation of processes remain key factors for growth and sustainability in the long term. Looking ahead, the geo political environment remains indecisive as we enter a major election cycle. Digitalization and automation would bring the risk of cyber security to the fore and needs to be considered at a strategic level moving forward.
We have also seen a massive shift in the way financial services organizations view and manage their risk inventory. We expect to see regulators shift their focus towards ensuring that financial institutions have the capabilities they need to identify and manage risks as they emerge. Regulators are increasingly looking at whether financial institutions have the right data and analytical capabilities to properly identify, measure and manage potential risks. They are taking a closer look at whether decision-makers have the infrastructure - including the right systems, processes and talent - to help ensure a high degree of management attention on managing risks.
In today’s environment, decision-makers can either fret about the risks and challenges they face or they can take steps to capitalize on them.
This is the fourth issue of the Sri Lanka Banking Report we have produced. We have discussed in detail the key issues which we feel could affect the sector this year and have analyzed the industry performance during the first half of this challenging year. I hope you enjoy our perspective on the sector in 2019, and would welcome the opportunity to discuss the banking results and the current industry landscape in more detail.
Foreword
03

4 | Sri Lanka Banking Report – Issue 04
© 2019 KPMG, a Sri Lankan partnership, and a member firm of the KPMG network of independent member firms affiliated with KPMG International Cooperative (“KPMG International”), a Swiss entity. All rights reserved. © 2019 KPMG, a Sri Lankan partnership, and a member firm of the KPMG network of independent member firms affiliated with KPMG International Cooperative (“KPMG International”), a Swiss entity. All rights reserved.
The growth in the economy during the first six months of 2019 was hampered due to a combination of events - the spillover effects of the political turmoil during the latter part of 2018, the Easter attacks in April 2019, putting the growth trajectory of the economy on a slowdown and reaching a mere 2.6% in 1H2019compared to 4.2% of the corresponding period in 2018. All subsectors of the economy witnessed significant slowdown in 2Q2019 compared to 1Q2019 as the events of April 2019 took a severe toll on economic activity of the country.
The Political risks further exacerbated the situation, with the presidential and parliamentary elections scheduled for late 2019 and 2020, and previous bouts of political instability having triggered significant capital outflows and currency depreciation. The GDP growth for the 2Q-2019 recorded at 1.6% was significantly lower, compared to 3.9% recorded in 2Q-2018.
Potential deterioration in credit conditions aggravated by higher interest rates in the US and the volatile domestic currency, paved way for more difficult financing conditions in 2019. Although most banks are well capitalized and pose strong balance sheets to weather any economic shocks, the country reflects an array of banking risks that executives are mindful of as they re-strategize to face the second half of the year.
In order to circumvent these adverse developments, the Central Bank of Sri Lanka (CBSL) has taken prudent measures and has followed a loose monetary policy stance during the period. The policy rates were reduced in three separate instances up to August 2019 with the intention of resolving liquidity shortages and boosting credit growth. Furthermore, CBSL imposed an interest rate limit on all deposits in April 2019 since intended results of policy reductions did not materialize. As interest rates still failed to come down to the required levels, the CBSL has taken further measures by imposing a 200bp cut on lending rates in October 2019, while removing the previously imposed deposit cap. These measures have resulted in the marginal growth of credit extended to the private sector by 1.16% since the beginning of this year, remaining far below the levels observed in the corresponding period of 2018, while NPLs have grown due to various factors.
We expect the recovery rate of the economy to improve with political stability post elections and a rebound in the tourism sector. Furthermore, we anticipate improved cash flows across sectors enabling borrowers to service loan installments. Strict fiscal discipline and timely monetary policy will ensure a smooth transition to a sustainable path of growth.
Executive Summary
04
Ranjani is the Deputy Head of Audit and counts over 20 years of experience, including as lead partner for a number of multinational & local banks, insurance companies, conglomerates and companies listed in the Colombo Stock Exchange.
She leads KPMG’s Banking services and Financial Risk Management services in Sri Lanka and functions as Head of Markets for the Firm.
She also represents KPMG Sri Lanka in the KPMG Middle East South Asia (MESA) Financial Sector Network.

5 | Sri Lanka Banking Report – Issue 04
© 2019 KPMG, a Sri Lankan partnership, and a member firm of the KPMG network of independent member firms affiliated with KPMG International Cooperative (“KPMG International”), a Swiss entity. All rights reserved.
Performance
Net Interest Margin (NIM)(%)
0.1%
Core Capital Ratio
0.5%
Net Profit(LKR Bn)
20.5%
9.7%
Total Assets(LKR Bn)
Total Capital Ratio
0.5%
10,847.4 11,901.5
64.5 51.3
16.0% 16.5%
12.8% 13.3%
3.7% 3.6%
05
6 | Sri Lanka Banking Report – Issue 04
© 2019 KPMG, a Sri Lankan partnership, and a member firm of the KPMG network of independent member firms affiliated with KPMG International Cooperative (“KPMG International”), a Swiss entity. All rights reserved.
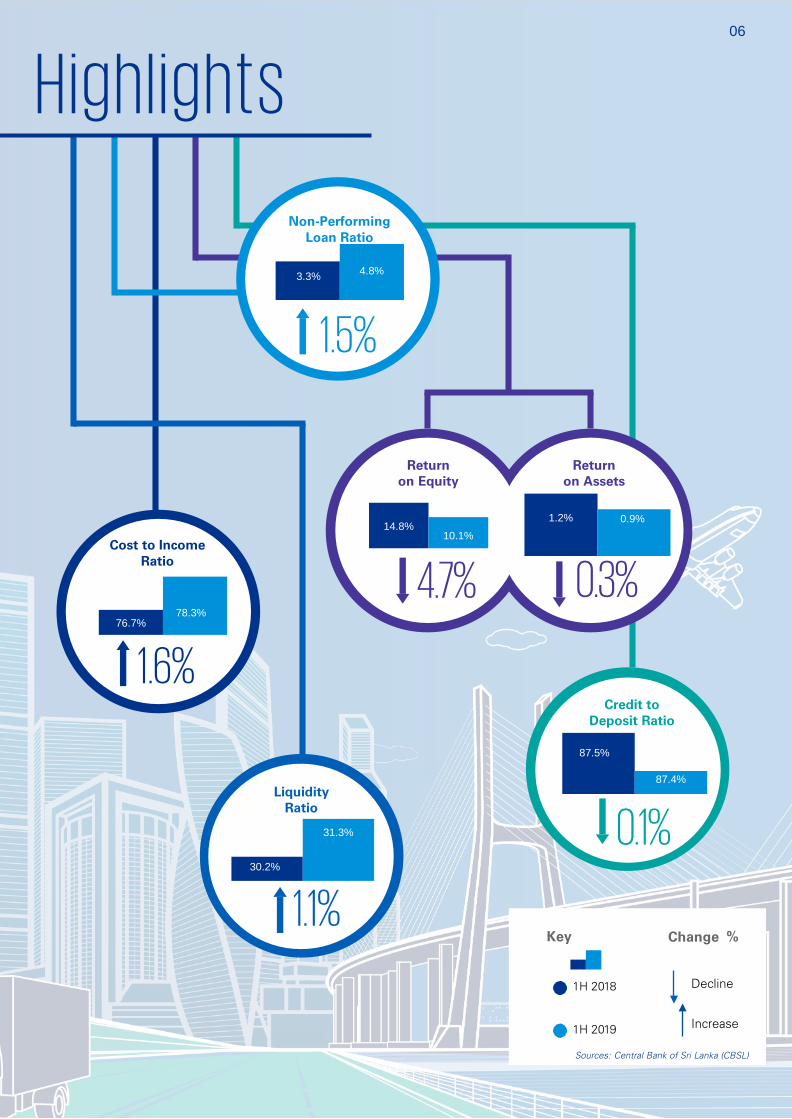
Highl ights
Cost to IncomeRatio
1.6%
Non-Performing Loan Ratio
1.5%
1.1%
Liquidity Ratio
Returnon Equity
Returnon Assets
4.7% 0.3%
Credit to Deposit Ratio
0.1%
87.5%
87.4%
14.8%10.1%
1.2% 0.9%
30.2%
31.3%
3.3% 4.8%
76.7%78.3%
Change %
Decline
Increase
Sources: Central Bank of Sri Lanka (CBSL)
1H 2018
1H 2019
Key
06

7 | Sri Lanka Banking Report – Issue 04
© 2019 KPMG, a Sri Lankan partnership, and a member firm of the KPMG network of independent member firms affiliated with KPMG International Cooperative (“KPMG International”), a Swiss entity. All rights reserved.
Banking and Technology
07

8
© 2019 KPMG, a Sri Lankan partnership, and a member firm of the KPMG network of independent member firms affiliated with KPMG International Cooperative (“KPMG International”), a Swiss entity. All rights reserved.
Solution enablement of RPA business services: Providing the
business units with the end services (e.g., process
assessments, automation design and build, run and support, etc.)
they need to leverage automation
RPA efficiencies and knowledge across the enterprise: The
deployment efficiencies that result from market intelligence, lessons learned, training, know-how, and
experience
Enterprise-wide governance: Helping avoid unnecessary risk,
control costs, and align with policies and objectives at a
corporate level.
Gone are the days of relying only on labor arbitrage, functional consolidation, and lean process models to deliver on process re-engineering and efficiencies. Today, organizations across the board are shifting away from processes based on low-cost labour and instead virtualizing that labor through a form of digital labor called robotic process automation (RPA).
Although less sophisticated than other types of artificial intelligence, intelligent automation, and digital labourtechnologies, RPA still promises to deliver immense value to organizations. Using RPA to automate transactional activities will improve accuracy, efficiency, and speed of critical business processes while also freeing up people to focus on more strategic work. Organizations are more active with basic process automation than enhanced process automation or cognitive automation.
Unlike complicated IT integration projects that can take months or years to deploy, RPA tools run at the user level, require no deep integration efforts, and can be installed on a desktop. RPA tools can be thought of as quick-hit technologies and allow for a very piecemeal approach to automation. They often return immediate benefits upon implementation of the very first process automation. They also deliver incremental benefits with every subsequent process or sub process you automate. Organizations can see meaningful benefits in a matter of weeks, or in a couple of months.
Thirsty for speed, many business units drool at the thought of such easy implementation and total deployment control. But it must always be borne in mind that eventually, things will start to change in the
environment. As Business processes evolve, new versions of the automation platform are deployed, business applications are updated, and suddenly there’s a multitude of tools across the organization that have become redundant.
When business units race straight ahead with RPA implementation, without thoughtful and planned enterprise-wide coordination and governance, it tends to cause serious problems down the line. Its adaptation across the enterprise can become explosive and disjointed, with business units acting on their own without governance and oversight. Chaos ensues. Organizations may experience unnecessary corporate risk, inconsistent quality, needless resource redundancy, and an overabundance of new robotic technologies deployed across the various business lines.
A better approach is centralizing RPA delivery through a bank-wide RPA approach. A bank-wide RPA approach balances the need for speed with the need for control, helping organizations realize the promised value of RPA initiatives. At KPMG, we have seen companies realize strong results with three different enterprise-wide RPA delivery models, moving from partial to full centralization: A center of excellence (CoE) model, a hybrid model, or a shared services model.
To varying degrees, all three models centralize some amount of governance and some amount of RPA shared capabilities and knowledge. Delivery of the business services component varies across the three different models with a model centralizing all such services, another which federates them completely, and one that is a mix of both.
How centralized control stops ad hoc RPA deployment and drives true transformation
Any bank-wide RPA approach should include:
While there is no one-size-fits-all approach to centralizing delivery of RPA, the hybrid model is most likely the end outcome for a typical bank simply because it provides the business units with a high
level of knowledge, efficiencies, and governance while allowing them to provide as much of the RPA capabilities as they choose to support.
Center of Excellence Hybrid Model Shared Service Model
Governing the Back Office Automation0

9 | Sri Lanka Banking Report – Issue 04
© 2019 KPMG, a Sri Lankan partnership, and a member firm of the KPMG network of independent member firms affiliated with KPMG International Cooperative (“KPMG International”), a Swiss entity. All rights reserved.
By providing a more methodical and deliberate delivery approach, your organization can realize range of bank-wide benefits:
Cost optimization: Avoid investment duplication by leveraging automation resources, tools, and solutions across the bank
Standardized platforms, tools, templates, and methodologies: Establish and maintain a portfolio of automation technologies, tools, templates, vendors, and methodologies that leverage standardization to empower rapid deployment from process assessment through design, build, run, and enhance.
Risk management: Define a bank wide risk appetite as well as the associated risk identification and mitigation guidelines, policies, and standardized control framework that is supported by centralized compliance monitoring and reporting.
Leading practices: Share digital labor experiences across the bank and capture lessons learned as well as workable solutions.
Market intelligence: Provide a centralized approach to key advances in automation capabilities and strategies.
Flexibility and scalability: A centralized solution model is more adaptive to changes in the business model and is able to more easily scale up and down and shift and share resources based on business needs.
Empowering the business: Enable each business unit to mature its digital labor capabilities at its own pace while simultaneously delivering automation by leveraging centralized resources.
Broad process automation: Allow broad process automation across multiple business units for maximum benefit.
0

10
© 2019 KPMG, a Sri Lankan partnership, and a member firm of the KPMG network of independent member firms affiliated with KPMG International Cooperative (“KPMG International”), a Swiss entity. All rights reserved.
Tips for success
Robotic Process Automation is a game-changing technology — one that is probably already changing the landscape of your front and back-office business functions, or soon will. Studies show software robots can help automate approximately 45 percent of the business activities people currently perform in the workplace. Smart, forward-thinking organizations will implement RPA in a careful, deliberate, planned, and strategic manner. An enterprise-wide RPA delivery model is a key enabler of this implementation plan, providing the necessary level of centralized control to minimize risks associated with technology enablement and realize the true, long-term value of RPA.
Problem: It is common, early in an RPA implementation, for the RPA center to provide virtually all of the automation delivery, know-how, and capacity. This model can become limiting when scaling to multiple business units or functions, unnecessarily inhibiting those business units with potentially strong RPA capabilities.
Lesson learned: A fully centralized model (i.e., a shared services model) can be a good practice when just starting out. However, a road map should be in place for evolving to a hybrid model in order to enable more rapid scaling while preserving core knowledge and standards.
Create a centralization plan
Problem: The urge to run fast often leads to a focus purely on the end state automated process development, which results in little to no documentation of the existing manual process or the transformed automated version of the process. When downstream errors occur, or there is a need to revert back to a manual process temporarily, the knowledge does not exist to resolve the execution issues or perform the process manually.
Lesson learned: Develop bank wide standards and templates for documenting the before and after process flows, systems required, data sources, feeds, and error checking. Adopt a release methodology that includes phases to help ensure all documentation is available prior to releasing to production. In addition, include documentation updates in all change control processes.
Document, document, document
Problem: Developing automation scripts can be a mix of art and science. A lack of scripting standards may lead to longer development time, inconsistent approaches, disparate results, quality issues, and maintenance nightmares.
Lesson learned: Develop or adopt development standards, such as standardizing log file placement, modularizing scripts for simplicity and reusability, using dynamic delays for application latencies, and leveraging variables whenever possible to reduce modifications. Provide thorough training in support of these standards, and leverage peer reviews as part of a formal quality assurance process to verify standards have been followed.
Set development standards

11 | Sri Lanka Banking Report – Issue 04
© 2019 KPMG, a Sri Lankan partnership, and a member firm of the KPMG network of independent member firms affiliated with KPMG International Cooperative (“KPMG International”), a Swiss entity. All rights reserved.
The strength of a chain lies with its weakest link, same as the strength of information security in the finance sector lie with its weakest member, which in turn poses a threat to all other members, which may lead to financial fraud. This is the preamble to the Baseline Security Standard set by the Central Bank of Sri Lanka and is the underlying thinking behind enhancing the cyber security of the financial system in the country.
Banks are aware of the threat posed by cyber crime. They have lost millions in rupees, reputation and trust over the years. The response has been to increase the spend on protection measures, although this on its own is not sufficient. One of the main reasons for this is that cyber security is a two pronged threat where the human element is as important as the technology element. Protection measures should begin at hiring where a robust screening framework is in place to select the right employees. Further, ongoing training and refresher courses in cyber security are a must. Red teaming exercises at organizations demonstrate the risks of a breach and precautions to be taken for all employees irrespective of their level of technology literacy.
Further, hackers are not always interested in financial fraud. They may place a greater importance on the data of the bank including client data. The damage to the bank may be directly financial in nature or can be a threat to its reputation and trust, which could result in financial loss. There may even be regulatory consequences. Cyber-attacks may be initiated due to various reasons. Financial benefit being only one reason. Other reasons may include sabotage by disgruntled stakeholders. In this light we at KPMG Sri Lanka have considered the important developments in Cyber Security this year and we feel the following are the main developments to be mindful of when evaluating the bank’s cyber strategy.
Protecting your Organization in the Future
The use of well-known security best practices, robust internal controls and routine security reviews are essential to combat any attacks in the future. These should go over and above mere regulatory compliance as a serious cyber breach can threaten the existence of the bank and can even have a systemic impact on the entire financial system.
Mobile apps and web portals will create more vulnerabilities than the traditional channels of banking. As customers seek greater convenience these alternate channels are essential for business. The vulnerabilities of mobile apps and web portals include insecure data storage, insecure authentication and code tampering.
Third Parties will be a target as banks have begun spending to protect their organizations from cyber-attacks. One of the large third party breaches in the recent past is the heist of almost USD 80 Million from Bangladesh Bank by exploiting a vulnerability in the shared banking system called SWIFT.
Employees at all levels are integral to the Cyber Security Strategy of the bank and cyber defense should include programmes for the employees.
11
Priyanka JayatilakePartner, Head of Advisory T: +94 11 5426401 E: [email protected]
Priyanka is a Partner of KPMG in Sri Lanka & Maldives and is the Head of Advisory & Technology practices of the firm. He is also the Managing Director of KPMG Technology Solutions ( Pvt.) Ltd.
He leads a team of over 600 professionals and associates across Technology, Management Consulting, Risk Consulting and Transactions & Restructuring Practices. Priyanka counts over 32 years of experience in Technology, Audit and Advisory spheres.
Priyanka has been instrumental in setting up some of the functional divisions of KPMG such as Technology Solutions, IT Audit & Advisory, Outsourcing, HR Solutions and Executive Search.
12
© 2019 KPMG, a Sri Lankan partnership, and a member firm of the KPMG network of independent member firms affiliated with KPMG International Cooperative (“KPMG International”), a Swiss entity. All rights reserved.
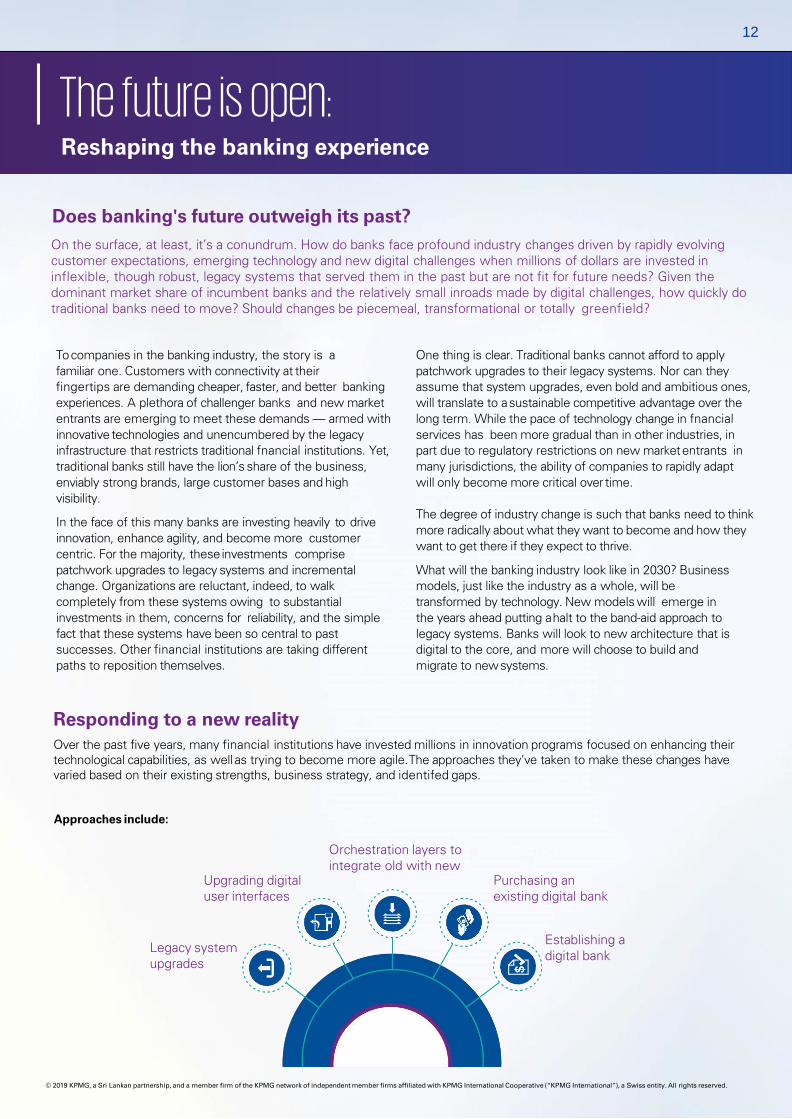
Reshaping the banking experience
To companies in the banking industry, the story is a familiar one. Customers with connectivity at theirfingertips are demanding cheaper, faster, and better banking experiences. A plethora of challenger banks and new market entrants are emerging to meet these demands — armed with innovative technologies and unencumbered by the legacy infrastructure that restricts traditional fnancial institutions. Yet, traditional banks still have the lion’s share of the business, enviably strong brands, large customer bases and high visibility.
In the face of this many banks are investing heavily t o drive innovation, enhance agility, and become more customer centric. For the majority, these investments comprise patchwork upgrades to legacy systems and incremental change. Organizations are reluctant, indeed, to walk completely from these systems owing to substantial investments in them, concerns for reliability, and the simple fact that these systems have been so central to past successes. Other financial institutions are taking different paths to reposition themselves.
One thing is clear. Traditional banks cannot afford to apply patchwork upgrades to their legacy systems. Nor can they assume that system upgrades, even bold and ambitious ones, will translate to asustainable competitive advantage over the long term. While the pace of technology change in fnancial services has been more gradual than in other industries, inpart due to regulatory restrictions on new marketentrants in many jurisdictions, the ability of companies to rapidly adapt will only become more critical over time.
The degree of industry change is such that banks need to thinkmore radically about what they want to become and how theywant to get there if they expect to thrive.
What will the banking industry look like in 2030? Business models, just like the industry as a whole, will be transformed by technology. New models will emerge in the years ahead putting ahalt to the band-aid approach to legacy systems. Banks will look to new architecture that is digital to the core, and more will choose to build and migrate to newsystems.
Does banking's future outweigh its past?On the surface, at least, it’s a conundrum. How do banks face profound industry changes driven by rapidly evolving customer expectations, emerging technology and new digital challenges when millions of dollars are invested in inflexible, though robust, legacy systems that served them in the past but are not fit for future needs? Given the dominant market share of incumbent banks and the relatively small inroads made by digital challenges, how quickly do traditional banks need to move? Should changes be piecemeal, transformational or totally greenfield?
The future is open:
Legacy system upgrades
Approaches include:
Establishing a digital bank
Upgrading digital user interfaces
Purchasing an existing digital bank
Orchestration layers tointegrate old with new
Responding to a new realityOver the past five years, many financial institutions have invested millions in innovation programs focused on enhancing their technological capabilities, as wellas trying to become more agile.The approaches they’ve taken to make these changes have varied based on their existing strengths, business strategy, and identifed gaps.

13 | Sri Lanka Banking Report – Issue 04
© 2019 KPMG, a Sri Lankan partnership, and a member firm of the KPMG network of independent member firms affiliated with KPMG International Cooperative (“KPMG International”), a Swiss entity. All rights reserved.
Legacy system updatesNumerous traditional banks, as noted, have invested heavily in updating their legacy technology in order to remain competitive. These investmentsinclude upgrading credit systems in order to approve loans more swiftly, making systems compatible with application programming interfaces (APIs) and open banking regimes, or finding ways to integrate more robust data analytics. While good, these incremental changes are unlikely to give traditional institutions the competitive edge they need to stave off new competitors.
Purchasing a digital bankA number of traditional banks have purchased digital banks as a way to make rapid changes, currently under development.
Purchasing an existing digital bank gives the incumbent the fexibility to change or retain the purchased brand name. They can also either migrate existing customers over or grow the offering’s existing customer base organically and through cross promotion. Banks that elect to migrate customers, however, run the risk of incurring signifcant expenses as a result of a need to write off aging legacy systems more quickly than they might have otherwise.
Establishing a digital bankA number of traditional banks have established their own digital banks. Establishing a digital bank provides legacy banks with similar flexibility in regards to branding and building a customer base. The time and investment required, however, to develop a new business model and build the brand can be exorbitant. Significant resources are needed to erect the five pillars of any digital bank: senior management, licensing, funding, technology, and customers. To deal with this, some banks are turning to digital banks for assistance. RBS for example have partnered with Starling Bank for help with their digital foray.
Starting a bank can provide a successful defense against new challengers with improved services and open capabilities. The new, more competitive business model provides for lower costs, greater agility and greater modularity. New technology stacks put incumbents on a level playing field with upstarts and customers can be readily migrated over.Digital banks are also often referred to as “lifeboat” banks. Should the digital bank prove operationally resilient, traditional banks will consider migrating their legacy customer books to the new entity. This helps replace legacy infrastructure with new technology, and helps solve the agility and customer experience issues that banks struggle with.
If banks are to successfully face the challenges posed by new digital competitors and changing customer expectations, they need to think beyond technology.
Whatever path of change a bank undertakes, whether organic or inorganic, it must be partnered with awillingness to entirely rethink their strategy and business processes in order for their transformation to be successful. This means objectively considering the use of mobile apps, the cloud, customer accessibility, the use of big data — and defining how any decisions will contribute to the organization’s overarching business strategy.
To be successful long-term, a major cultural shift is required, one in which employees at all levels come to appreciate and even value a company’s transformation. While many fnancial institutions know they need to change, few recognize the magnitude of change required or the degree of internal resistance they might face to change. To manage this resistance, change management needs to be an upfront, ongoing and persistent component of any bank transformation initiative.
Additionally, any associated communications program should be aimed at attracting converts, evenevangelists, to the effort right from the get-go.
The elephant in the room: change isn’t all about technology
14
© 2019 KPMG, a Sri Lankan partnership, and a member firm of the KPMG network of independent member firms affiliated with KPMG International Cooperative (“KPMG International”), a Swiss entity. All rights reserved.
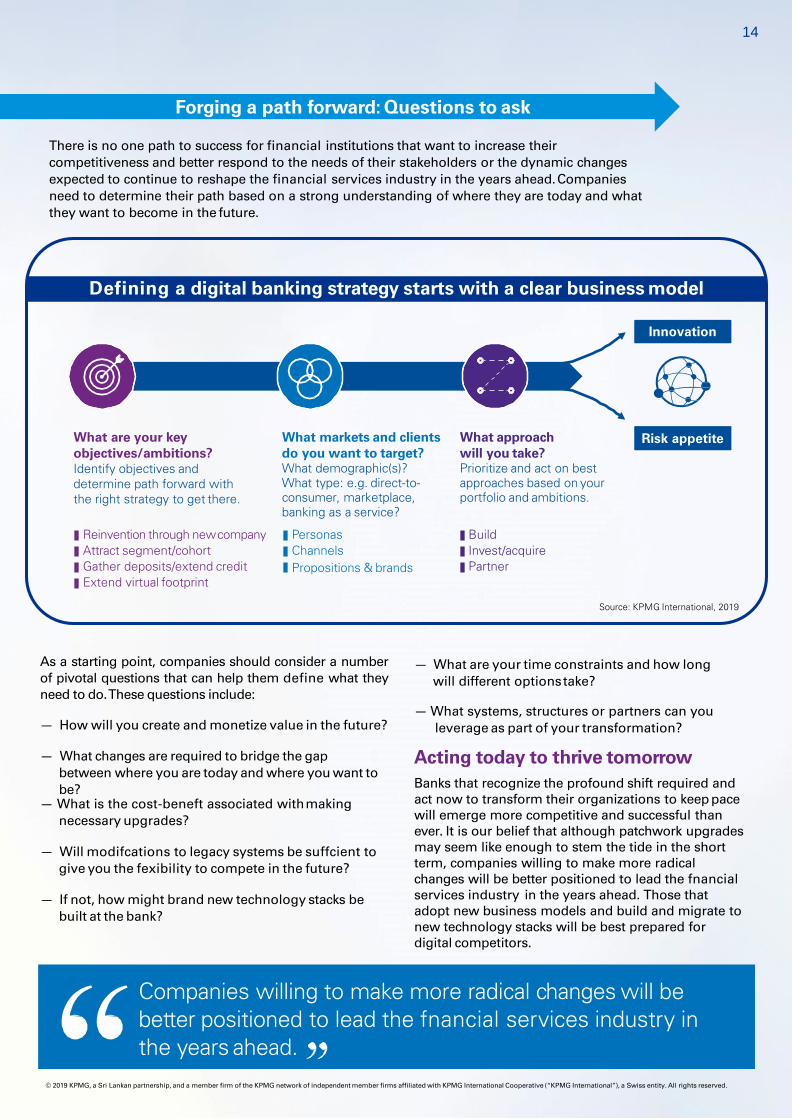
Risk appetiteWhat are your key objectives/ambitions? Identify objectives and determine path forward with the right strategy to get there.
Reinvention through newcompany Attract segment/cohortGather deposits/extend credit Extend virtual footprint
What markets and clients do you want to target?What demographic(s)? What type: e.g. direct-to-consumer, marketplace, banking as a service?
Personas ChannelsPropositions & brands
What approach will you take?Prioritize and act on best approaches based on your portfolio and ambitions.
Build Invest/acquire Partner
Source: KPMG International, 2019
Innovation
There is no one path to success for financial institutions that want to increase their competitiveness and better respond to the needs of their stakeholders or the dynamic changes expected to continue to reshape the financial services industry in the years ahead.Companies need to determine their path based on a strong understanding of where they are today and what they want to become in the future.
Forging a path forward: Questions to ask
Defining a digital banking strategy starts with a clear business model
As a starting point, companies should consider a numberof pivotal questions that can help them define what theyneed to do.These questions include:
— How will you create and monetize value in the future?
— What changes are required to bridge the gapbetween where you are today and where you want tobe?
— What is the cost-beneft associated withmaking necessary upgrades?
— Will modifcations to legacy systems be suffcient to give you the fexibility to compete in the future?
— If not, how might brand new technology stacks be built at the bank?
— What are your time constraints and how longwill different optionstake?
— What systems, structures or partners can you leverage as part of your transformation?
Acting today to thrive tomorrowBanks that recognize the profound shift required and act now to transform their organizations to keep pacewill emerge more competitive and successful than ever. It is our belief that although patchwork upgrades may seem like enough to stem the tide in the short term, companies willing to make more radical changes will be better positioned to lead the fnancial services industry in the years ahead. Those that adopt new business models and build and migrate to new technology stacks will be best prepared for digital competitors.
Companies willing to make more radical changes will be better positioned to lead the fnancial services industry in the years ahead.

15 | Sri Lanka Banking Report – Issue 04
© 2019 KPMG, a Sri Lankan partnership, and a member firm of the KPMG network of independent member firms affiliated with KPMG International Cooperative (“KPMG International”), a Swiss entity. All rights reserved.
Regulatory Outlook
15
16
© 2019 KPMG, a Sri Lankan partnership, and a member firm of the KPMG network of independent member firms affiliated with KPMG International Cooperative (“KPMG International”), a Swiss entity. All rights reserved.
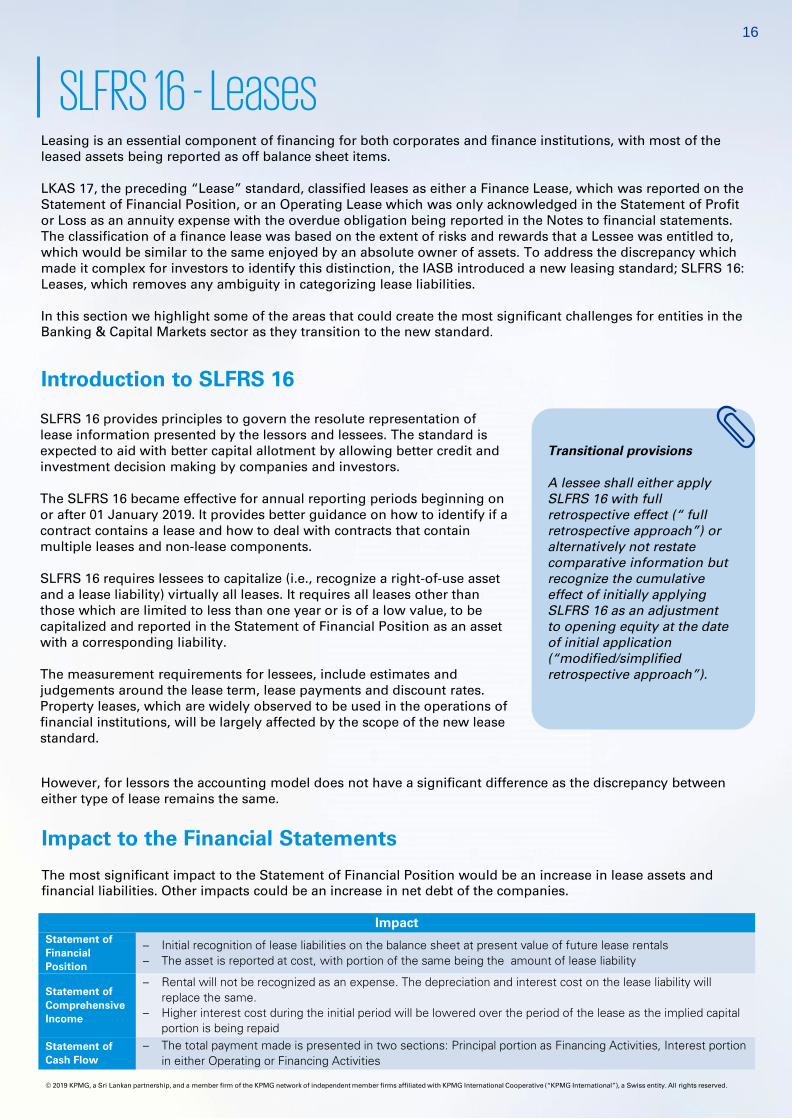
Leasing is an essential component of financing for both corporates and finance institutions, with most of the leased assets being reported as off balance sheet items.
LKAS 17, the preceding “Lease” standard, classified leases as either a Finance Lease, which was reported on the Statement of Financial Position, or an Operating Lease which was only acknowledged in the Statement of Profit or Loss as an annuity expense with the overdue obligation being reported in the Notes to financial statements. The classification of a finance lease was based on the extent of risks and rewards that a Lessee was entitled to, which would be similar to the same enjoyed by an absolute owner of assets. To address the discrepancy which made it complex for investors to identify this distinction, the IASB introduced a new leasing standard; SLFRS 16: Leases, which removes any ambiguity in categorizing lease liabilities.
In this section we highlight some of the areas that could create the most significant challenges for entities in the Banking & Capital Markets sector as they transition to the new standard.
SLFRS 16 - Leases
SLFRS 16 provides principles to govern the resolute representation of lease information presented by the lessors and lessees. The standard is expected to aid with better capital allotment by allowing better credit and investment decision making by companies and investors.
The SLFRS 16 became effective for annual reporting periods beginning on or after 01 January 2019. It provides better guidance on how to identify if a contract contains a lease and how to deal with contracts that contain multiple leases and non-lease components.
SLFRS 16 requires lessees to capitalize (i.e., recognize a right-of-use asset and a lease liability) virtually all leases. It requires all leases other than those which are limited to less than one year or is of a low value, to be capitalized and reported in the Statement of Financial Position as an asset with a corresponding liability.
The measurement requirements for lessees, include estimates and judgements around the lease term, lease payments and discount rates. Property leases, which are widely observed to be used in the operations of financial institutions, will be largely affected by the scope of the new lease standard.
Introduction to SLFRS 16
Transitional provisions
A lessee shall either apply SLFRS 16 with full retrospective effect (“ full retrospective approach”) or alternatively not restate comparative information but recognize the cumulative effect of initially applying SLFRS 16 as an adjustment to opening equity at the date of initial application (“modified/simplified retrospective approach”).
However, for lessors the accounting model does not have a significant difference as the discrepancy between either type of lease remains the same.
Impact to the Financial Statements
The most significant impact to the Statement of Financial Position would be an increase in lease assets and financial liabilities. Other impacts could be an increase in net debt of the companies.
ImpactStatement ofFinancial Position
– Initial recognition of lease liabilities on the balance sheet at present value of future lease rentals– The asset is reported at cost, with portion of the same being the amount of lease liability
Statement of Comprehensive Income
– Rental will not be recognized as an expense. The depreciation and interest cost on the lease liability will replace the same.
– Higher interest cost during the initial period will be lowered over the period of the lease as the implied capital portion is being repaid
Statement of Cash Flow
– The total payment made is presented in two sections: Principal portion as Financing Activities, Interest portion in either Operating or Financing Activities

17 | Sri Lanka Banking Report – Issue 04
© 2019 KPMG, a Sri Lankan partnership, and a member firm of the KPMG network of independent member firms affiliated with KPMG International Cooperative (“KPMG International”), a Swiss entity. All rights reserved.
As summarized on the previous page, the lease liability and asset value can be measured by determining the present value of the unpaid annual fixed lease payments and discounting it at the incremental borrowing rate. The lease asset would be depreciated on a straight line basis over the lease period, if the remaining economic life of the leased equipment is greater than the leased period. The principal portion of the rental figure is classified as a financing outflow in the cash flow statement, while the interest expense can be classified as a financing or operating outflow.
A higher EBITDA can be expected and EBIT will also increase although it would be less significant. However, there will be a higher invested capital for the lessee and it typically lowers the ROIC. The rental expense is no longer perceived as an expense but, instead as depreciation of the right-of-use asset (lease asset) and interest expense as a lease liability over the lease term in the Income Statement.
Impact on Financial institutions
For standardized banking institutions, the new concept on the lease assets may affect the calculation of regulatory capital ratios due to the increase in assets which in turn increases the denominator of the risk based capital ratios and leverage ratios. Thus a higher denominator would develop a lower capital ratio for the financial institutes.
Impact on Total Capital
Banks commonly enter into long-term operating leases, especially for the use of branches or call centres. Under LKAS 17, operating lease assets were not recognized on the bank’s balance sheet. Instead, an expense was recognized on the Income Statement.
Under SLFRS 16, the expense, recognized in the Income Statement, for the rental of the assets will be replaced with the depreciation and interest expense. As a result, Retained Earnings, are expected to remain broadly unchanged pre and post SLFRS 16 adoption. Thus the overall impact on Total Capital for the total lease period will be the same under SLFRS 16 and LKAS 17.
However, during the first years of the total lease period, capital may suffer a negative impact resulting from the higher interest expense on the Lease liability recognized under SLFRS 16.
Y1 Y2 Y3 Y4 Y5
LKAS 17 Vs SLFRS 16 - P&L impact
Rental - IAS 17
Total P&L- IFRS 16
Dep'n
Interest
Term of the lease
High effect on NI
Low effect on NI
1.
2. Impact on Risk Weighted Assets
The starting point for the calculation of Risk Weighted Assets for a credit institution is the asset position it reflects on its Balance Sheet. Under LKAS 17, banks did not report any, Operating lease assets on their Balance sheets (off balance sheet items). As a result, such assets received no risk weighting for the purposes of capital calculations.
LKAS 17

18
© 2019 KPMG, a Sri Lankan partnership, and a member firm of the KPMG network of independent member firms affiliated with KPMG International Cooperative (“KPMG International”), a Swiss entity. All rights reserved.
SLFRS 16 advocates that leased assets (Right-of-Use Assets) shall be reported on the Balance sheet as Non-Counter Party Related Assets, which is equivalent to the Property, Plant and Equipment asset category. As such, the risk weighted asset consideration for these assets will also be affected, thus impacting the calculation of capital ratios derived in assessing the regulatory equity.
737
579
285250 229
173111 114 67
0100200300400500600700800
-
500
1,000
1,500
2,000
2,500
No
of B
ranc
hes
LKR
'Bn
Total Assets Number of Branches
Higher the rented out properties, higher the impact
to the TCR
Institutions are offered the option of reporting the value of the asset either as a lease asset or simultaneously in the property, plant and equipment category on the statement of financial position.
3.
Total Asset Base Vs Number of branches of Commercial Banks
Indirect impact on the finance sector
Further to the direct impact on financial statements as discussed above, the new standard is also expected to indirectly impact credit institutions through affecting debt covenants of credit facilities. Debt covenants are a common place for many facilities which may be measured through metrics such as gearing ratios and interest cover.
Based on overall financial position and strength of a Company, debt covenants will impose restrictions and conditions on the extent of additional debt an entity may borrow. Given that the introduction of SLFRS 16 will convert operating lease rentals that were formerly considered as expenses to an asset/ with a corresponding finance liability, debt covenants for many companies may be inadvertently breached due to the rise in leverage and thus would require measures to rectify this and not be in violation of the covenant.
However, this impact may change over the term of the loan as the capital portion of the calculated lease value is assumed to be repaid (Similar to loans / finance leases).
The leased asset should be fully considered in terms of calculating the regulatory capital and thus be assigned with 100% risk weighting in deriving denominators for leverage and risk based capital ratio, which is the similar treatment for tangible assets. Further the asset of concern should be specific in its physical nature; it can be an entire asset or part of the same.
However, from the lessee’s perspective, the regulatory capital of most financial institutions are not expected to be significantly impacted by the changes in the new standards. According to IASB’s Quantitative Impact Study based on 20 European Banks, the estimated reduction in the reported TCR to be less than 0.5% of reported equity of the said banks and lower than 0.2% for almost half of the said banks.
In Conclusion
With the implementation of SLFRS 16, the reporting quality of financial statements for off-balance sheet leasing agreements will increase, thus increasing comparability. Due to better representation of assets and liabilities on the balance sheet, a more transparent image of the company is presented. This would in turn improve the company’s enterprise value. The new standard may result in renegotiations of existing leases to minimize impact under the new standard.

19 | Sri Lanka Banking Report – Issue 04
© 2019 KPMG, a Sri Lankan partnership, and a member firm of the KPMG network of independent member firms affiliated with KPMG International Cooperative (“KPMG International”), a Swiss entity. All rights reserved.
The Accounting Impact of the LIBOR transition Uncover the potential accounting impact of a shift in benchmark rateThe London Interbank Offered Rate (LIBOR) is expected to be phased out after 30 long years, and the shift to an alternative baseline reference rate could have a cascading effect beyond contract terms into the operations and financial reporting of thousands of institutions.
Organizations that do not act now may face increasing costs and resource needs to manage the transition in the coming years.
In July 2017, the Financial Conduct Authority in the UK (FCA), the governing body responsible for regulating LIBOR, announced that it will no longer compel or persuade the panel banks to make LIBOR submissions after 2021. As LIBOR is calculated based on the rates submitted by the panel of banks, the declaration by the FCA is expected to result in the sunset of LIBOR, which is issued for five currencies (U.S dollar, Pound
Sterling, Japanese yen, Swiss franc and Euro). Following FCA’s announcement, the Alternative Reference Rates Committee (ARRC) published the Paced Transition Plan, which outlines key steps and timelines through 2021 to assist entities with preparing for a smooth transition from LIBOR to an alternative reference rate.
With an estimated $370 trillion of global financial contracts referenced to LIBOR, the impact will be far reaching. Affected companies may see a rise in compliance, financial reporting, staffing and other costs related to the transition. Firms that have contracts referencing LIBOR should begin planning and preparing as soon as possible to ensure that a transition away from LIBOR has minimal financial and operational impact.
In particular, the change in benchmark reference rate could trigger accounting-related issues under both US Generally Accepted Accounting Principles (US GAAP) and International Financial Reporting Standards (IFRS). In an effort to assess the potential accounting implications, the accounting standard setters for US GAAP and IFRS have recently added projects to their agendas to evaluate the need for transition guidance. As accounting standards setters and market participants explore the breadth of impact, potential accounting issues are coming to light.
The shift in benchmark rates is expected to have wide-range of accounting implications, including effects on hedge accounting, debt modification, and discount rates for impairment testing, lease accounting and fair valuation.
Accounting Impacts
The LIBOR transition’s potential impact on hedge accounting will be most relevant to hedges of interest rate risk. In particular, under both US GAAP and IFRS, hedge accounting must be discontinued prospectively if the hedging instrument is terminated. A change in the critical terms of a derivative may result in its termination, thereby causing a de-designation of the associated hedging relationship.
In a cash flow hedging relationship, entities need to evaluate if the hedged forecasted transactions indexed to LIBOR may become less than ‘probable’ as we approach a transition to another reference rate.
Furthermore, generating data points for regression analysis using alternative risk free rates (RFR) may prove challenging. In order to qualify for hedge accounting, entities are required to demonstrate that the hedging relationship is highly effective both at inception and on an ongoing basis. In practice, hedge effectiveness is usually assessed using a statistical method such as a regression analysis which may prove challenging due to lack of data.
Hedge documentation may also need significant updating to reflect the change in transaction terms. In connection with any changes to the hedge instrument or hedge forecast transaction, there may be a need to evaluate whether the related descriptions should be updated to reflect a change from LIBOR to another reference rate.
1. Hedge Accounting
19
20 | Sri Lanka Banking Report – Issue 04
© 2019 KPMG, a Sri Lankan partnership, and a member firm of the KPMG network of independent member firms affiliated with KPMG International Cooperative (“KPMG International”), a Swiss entity. All rights reserved.
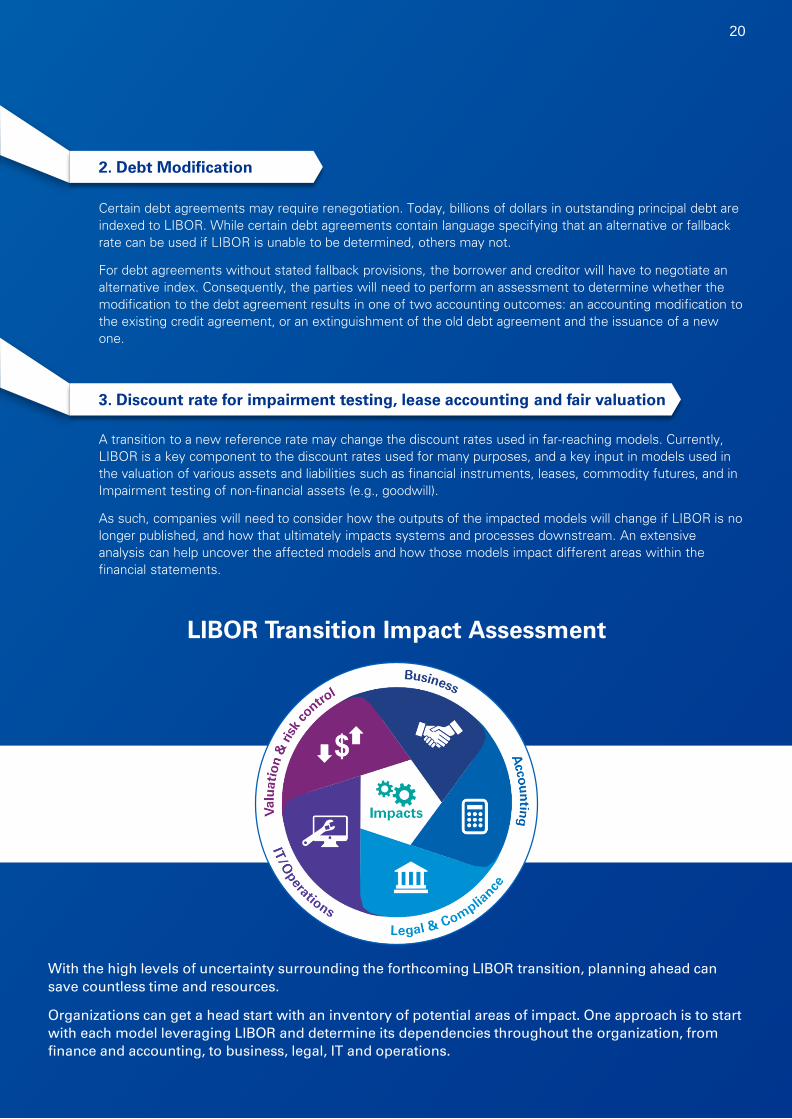
Certain debt agreements may require renegotiation. Today, billions of dollars in outstanding principal debt are indexed to LIBOR. While certain debt agreements contain language specifying that an alternative or fallback rate can be used if LIBOR is unable to be determined, others may not.
For debt agreements without stated fallback provisions, the borrower and creditor will have to negotiate an alternative index. Consequently, the parties will need to perform an assessment to determine whether the modification to the debt agreement results in one of two accounting outcomes: an accounting modification to the existing credit agreement, or an extinguishment of the old debt agreement and the issuance of a new one.
A transition to a new reference rate may change the discount rates used in far-reaching models. Currently, LIBOR is a key component to the discount rates used for many purposes, and a key input in models used in the valuation of various assets and liabilities such as financial instruments, leases, commodity futures, and in Impairment testing of non-financial assets (e.g., goodwill).
As such, companies will need to consider how the outputs of the impacted models will change if LIBOR is no longer published, and how that ultimately impacts systems and processes downstream. An extensive analysis can help uncover the affected models and how those models impact different areas within the financial statements.
LIBOR Transition Impact Assessment
With the high levels of uncertainty surrounding the forthcoming LIBOR transition, planning ahead can save countless time and resources.
Organizations can get a head start with an inventory of potential areas of impact. One approach is to start with each model leveraging LIBOR and determine its dependencies throughout the organization, from finance and accounting, to business, legal, IT and operations.
2. Debt Modification
3. Discount rate for impairment testing, lease accounting and fair valuation
20

21 | Sri Lanka Banking Report – Issue 04
© 2019 KPMG, a Sri Lankan partnership, and a member firm of the KPMG network of independent member firms affiliated with KPMG International Cooperative (“KPMG International”), a Swiss entity. All rights reserved.
Combatting Financial Crimeanks around theworld are spending billionsto improvetheir financial crime management.Yet thenumber of fines and sanctions being imposed on banks is still increasing. What will it take toachieveefficient and effectivecustomerdue diligence?B
One would be hard-pressed to suggest that banks are ignoring the need for better customer due diligence. Indeed, according toa Forbes article, some banks spend up to US$500million each year in an effort to improveand manage their Know YourCustomer (KYC) and Anti-Money Laundering (AML) processes.
The average bank spends around US$48 million per year. In the US alone, banks are spending more than US$25 billion a year onAML compliance. With this much investment going into customer due diligence processes, one would think that the number of fines and sanctions imposedonbankswoulddrop.But quite the opposite; our research suggests that the number of fines and sanctions has actually increased over the past 3 years. In the US, where regulators are among the world’s most aggressive in imposing fines and sanctions, banks have been hit with nearlyUS $24 billion innon-compliancefines since 2008.
It’s not just big fines and the possibility of sanctions that worry bank CEOs and boards; most also now recognize that inefficient AML and KYC processes also lead to lower productivity (due to significant re-work requirements), greater government scrutiny (in cases where problems persist) and the potential for decreased customer satisfaction.
Building maturity
Our recent global surveys and experience working with leading banks around the world suggests that many banks currently display a ‘fundamental’ level of maturity when it comes to customerdue diligence: they have a defined policy that is aligned to regulation and is well communicated within the business. But the policy is often poorly executed operationally. Banks with a fundamental level of maturity often find themselves doing significant re-work and manualdata entry.
Some of the more advanced banks have achieved an ‘evolving’ level of maturity. They also have a defined and aligned policy. But their policy is supported by effectively managed processes and procedures. Organizational structure is well established. Roles and responsibilities are clear and technology is being applied to improve KYC operational management.
However, our experience with banks in many regions suggests that most banks are looking for ways to be ‘transformational’ in their approach to customer due diligence. They want to make their policies actionable and embed them in the culture by creating a set of business rules with traceability that allows them to easily identify the impact that any changes to the policy may have on operations. They want processes and procedures that are well defined across customer onboarding, client refresh and screening. They want self-service capabilities that allow customers to easily update their KYC and AML data through multiple channels.
Policy and risk management: Every good AML or KYC process is underpinnedby relevant laws, regulations and companypolicies. The more mature organizations, however, are able to identify the linkagebetweenAML and KYC policies, data requirements, underlyingprocesses andtechnology. And that allows them to quicklyidentify how any changes in their policies will influence the wider AML and KYC ecosystem.
1Processes and services: Most banks now continuously monitor their customers throughout the life cycle with event-driven reviews and specific actions triggered at specific times. The more mature organizations are also working to reduce unnecessary customer outreach by creating bespoke customer due diligence portals that allow customers to perform their own profile maintenance. Some are also now using ‘search before’ contact models that harvest publicly available data from third-party sources.
2
Getting better
When we work with financial institutions to help achieve this type of transformational maturity, we often start by helping decision-makers think about the four key components of customer due diligence.

22
© 2019 KPMG, a Sri Lankan partnership, and a member firm of the KPMG network of independent member firms affiliated with KPMG International Cooperative (“KPMG International”), a Swiss entity. All rights reserved.
People and organization: Relationship managers are too valuable to have their time soaked up collecting customer data and conducting manual reviews. That’s why the more mature organizations are now starting to create specialized delivery centers that allow 24/7 access to deep pools of talent at an optimized cost. This allows them to bridge existing gaps in the end-to-end process, centralize resources and focus employee skill sets.
3
Data, technology and analytics: Many banks are struggling with siloed, duplicative and inconsistent data, which means their ability to search and access sources is limited. The more mature organizations are creating data models and dictionaries that can serve as the master source of requirements and business rules. Some of the more advanced organizations are now exploring how they can leverage their AML and KYC data to unlock new customer insights that can help influence both product offerings and risk decisions. The path to efficient and robust customer due diligence is never-ending. Banks will need to continue to invest into newer technologies and processes if they hope to remain ahead of regulator and customer expectations.
4
1. OptimizeKYC business operations to reduce thetotal cost of KYC compliance
— Implement a data model/data dictionary tocapture all required data elements, requirements and business rulesbased onentity type.
— Define data lineage between policy, business rules and technology to ensure alignment withpolicy and to easily understand the impacts ofpolicy changes.
— Leverage technology solutions (e.g. workflow/case management) and client channels to automate the processing of KYCcases, thereby reducing time and improving operationsefficiencies.
— Ensure the right skilled people are undertaking theright activities in the right way (e.g. sourcingoptions).
— Know your customer better through relevantdata collection.
2. Enhance the customer experience for onboardingand refresh
— ImprovethecustomerexperienceandenhancetheKYC data collection processes by leveraging clearly defined datarequirementsandbusinessrules.
— Minimize customer outreachby aggregatingpublicly available customerdata.
— Provide a true omni-channel experience byenabling self-service capabilities (e.g. portal,mobile).
3. Improve riskmanagement/financial crimes compliance by assessing and monitoring KYCclient information for criticalinsights
— Use evidence-based, robust and auditableprocesses.
— Conduct early risk-based assessmentthrough customer segmentation.
— Achieve quality financial crime judgment ratherthan simply conducting a data collectionexercise.
Three focus areas for transformational customer duediligence
22

23 | Sri Lanka Banking Report – Issue 04
© 2019 KPMG, a Sri Lankan partnership, and a member firm of the KPMG network of independent member firms affiliated with KPMG International Cooperative (“KPMG International”), a Swiss entity. All rights reserved.
Banking sectorOutlook
23
24 | Sri Lanka Banking Report – Issue 04
© 2019 KPMG, a Sri Lankan partnership, and a member firm of the KPMG network of independent member firms affiliated with KPMG International Cooperative (“KPMG International”), a Swiss entity. All rights reserved.
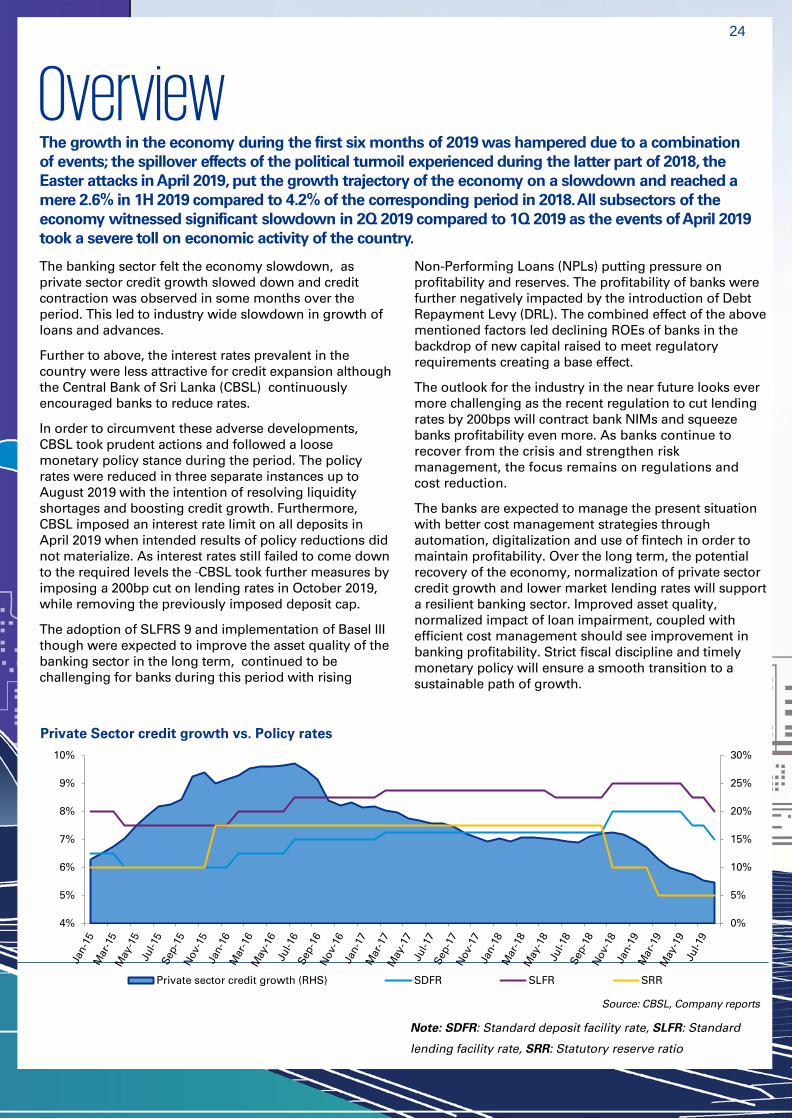
The growth in the economy during the first six months of 2019 was hampered due to a combination of events; the spillover effects of the political turmoil experienced during the latter part of 2018, the Easter attacks in April 2019, put the growth trajectory of the economy on a slowdown and reached a mere 2.6% in 1H 2019 compared to 4.2% of the corresponding period in 2018. All subsectors of the economy witnessed significant slowdown in 2Q 2019 compared to 1Q 2019 as the events of April 2019 took a severe toll on economic activity of the country.
The banking sector felt the economy slowdown, as private sector credit growth slowed down and credit contraction was observed in some months over the period. This led to industry wide slowdown in growth of loans and advances.
Further to above, the interest rates prevalent in the country were less attractive for credit expansion although the Central Bank of Sri Lanka (CBSL) continuously encouraged banks to reduce rates.
In order to circumvent these adverse developments, CBSL took prudent actions and followed a loose monetary policy stance during the period. The policy rates were reduced in three separate instances up to August 2019 with the intention of resolving liquidity shortages and boosting credit growth. Furthermore, CBSL imposed an interest rate limit on all deposits in April 2019 when intended results of policy reductions did not materialize. As interest rates still failed to come down to the required levels the CBSL took further measures by imposing a 200bp cut on lending rates in October 2019, while removing the previously imposed deposit cap.
The adoption of SLFRS 9 and implementation of Basel III though were expected to improve the asset quality of the banking sector in the long term, continued to be challenging for banks during this period with rising
Non-Performing Loans (NPLs) putting pressure on profitability and reserves. The profitability of banks were further negatively impacted by the introduction of Debt Repayment Levy (DRL). The combined effect of the above mentioned factors led declining ROEs of banks in the backdrop of new capital raised to meet regulatory requirements creating a base effect.
The outlook for the industry in the near future looks ever more challenging as the recent regulation to cut lending rates by 200bps will contract bank NIMs and squeeze banks profitability even more. As banks continue to recover from the crisis and strengthen risk management, the focus remains on regulations and cost reduction.
The banks are expected to manage the present situation with better cost management strategies through automation, digitalization and use of fintech in order to maintain profitability. Over the long term, the potential recovery of the economy, normalization of private sector credit growth and lower market lending rates will support a resilient banking sector. Improved asset quality, normalized impact of loan impairment, coupled with efficient cost management should see improvement in banking profitability. Strict fiscal discipline and timely monetary policy will ensure a smooth transition to a sustainable path of growth.
Overview
Note: SDFR: Standard deposit facility rate, SLFR: Standard
lending facility rate, SRR: Statutory reserve ratio
0%
5%
10%
15%
20%
25%
30%
4%
5%
6%
7%
8%
9%
10%
Private Sector credit growth vs. Policy rates
Private sector credit growth (RHS) SDFR SLFR SRR
24
Source: CBSL, Company reports

25 | Sri Lanka Banking Report – Issue 04
© 2019 KPMG, a Sri Lankan partnership, and a member firm of the KPMG network of independent member firms affiliated with KPMG International Cooperative (“KPMG International”), a Swiss entity. All rights reserved.
The banking sector consisted of 25 Licensed Commercial Banks (LCBs), and 7 Licensed Specialized Banks (LSBs) as at 30 June 2019. The growth in assets of the banking sector in 2019 showed slower growth rates compared to the last half of 2018.
The total asset base of the banking sector increased by 1.8% from LKR 11.8Tn in 2H 2018 to LKR 11.9Tn by the 1H 2019 as the industry was faced with increased pressure from BASEL and SLFRS to raise capital, thus the higher asset base. Domestic Systemically Important Banks (DSIBs) held over 70% of the total sector assets as at 1H 2019.
Asset Base
BOC19%
PB15%
COMB11%
NSB9%
HNB9%
SAMP8%
HSBC4%
SEYB4%
NDB4%
DFCC3%
NTB3%
SCB1%
Others (21 banks)10%
Composition of Total Assets of the Banking Sector - June 2019
-
500
1,000
1,500
2,000
2,500
BOC PB COMB NSB HNB SAMP HSBC SEYB NDB DFCC NTB SCB
LKR
'Bn
Total asset base of banks under review (LKR'Bn)
1H 2018 1H 2019
25
Source: CBSL, Company reports
Source: CBSL, Company reports

26 | Sri Lanka Banking Report – Issue 04
© 2019 KPMG, a Sri Lankan partnership, and a member firm of the KPMG network of independent member firms affiliated with KPMG International Cooperative (“KPMG International”), a Swiss entity. All rights reserved.
Term loans and overdrafts were the highest contributors of the gross loans and advances in 1H 2019 which accounted for 67.7% of total DSIB loans and advances amounting to LKR 3.5Tn.
The poor economic conditions negatively impacted revenues and enforced companies to fund day to day activities through overdrafts and term loans.
Trade finance contributed to 9.4%, compared to 9.8% in 1H 2018 of the DSIB loans and advances, accounting for the third highest share of the same.
0%
20%
40%
60%
80%
100%
BOC PB NSB COMB HNB SAMP SEYB NDB DFCC NTB HSBC SCB
Composition of gross loans & advances – 1H 2019
Term Loans Overdrafts Trade finance Housing loans Lease receivable Credit cards Pawning Staff loans Personal loans Other
26
Total gross loans and advances of the banking sector marginally declined by an annualized rate of 1.0% to LKR 7.7Tn over 1H 2019. Domestic currency loans and advances accounted for 80.4% of total loans and advances, indicating a marginal decline of 0.12%compared to end 2018.
However, we expect sector loans and advances to grow, albeit at a slower pace in the near future due to fluctuating economic and political conditions and low business confidence of the private sector.
Nevertheless, given the recent developments initiated by CBSL to reduce lending rates, the effects of the above are expected to be possibly reduced due to increased demand.
Though these initiatives are expected to boost lending, banks may not extend credit to potentially risky clients where the risk cannot be aligned to the pricing due to the rate cap imposed by CBSL.
Source: CBSL, Company reports
Loans and advances
-
400
800
1,200
1,600
Gross loans and advances (LKR Bn)
1H 2018 1H 2019
Source: CBSL, Company reports

27 | Sri Lanka Banking Report – Issue 04
© 2019 KPMG, a Sri Lankan partnership, and a member firm of the KPMG network of independent member firms affiliated with KPMG International Cooperative (“KPMG International”), a Swiss entity. All rights reserved.
Total deposits of the banking sector increased by an annualized rate of 6.2% in 1H 2019 to LKR 8.8Tn, reflecting a moderate growth compared to the annualized growth rate of 13.8% observed in 2H2018. LKR deposits grew by an annualized rate of 7.4.% compared to 9.7% annualized growth in 2H 2018.
Source: CBSL, Company reports
Foreign currency deposits marginally increased by an annualized rate of 0.6% in 1H 2019, up from 37.1% growth in 2H 2018 ; similar to LKR deposits, the main growth driver was time deposits.
LKR time deposits accounted for 67.1% of total LKR deposits, an increase from 66.2% in 2Q 2018, primarily driven by a surge in time deposits.
With increasing transfer of deposits to high cost brackets like time deposits, banking sector CASA ratio (Ratio of current and savings accounts to total deposits) declined to 31.1% in 1H 2019 from 32.3% in 2018.
Deposits
0%
20%
40%
60%
80%
100%
BOC PB NSB COMB HNB SAMP SEYB NDB DFCC NTB HSBC SCB
Composition of deposits
Demand Deposits Savings Deposits Fixed/ Time Deposits Other Deposits
-
500
1,000
1,500
2,000
Total deposits (LKR Bn)
1H 2018 1H 2019
0%
10%
20%
30%
40%
50%
60%
CASA
1H 2018 1H 2019
27
Source: CBSL, Company reports
28 | Sri Lanka Banking Report – Issue 04
© 2019 KPMG, a Sri Lankan partnership, and a member firm of the KPMG network of independent member firms affiliated with KPMG International Cooperative (“KPMG International”), a Swiss entity. All rights reserved.
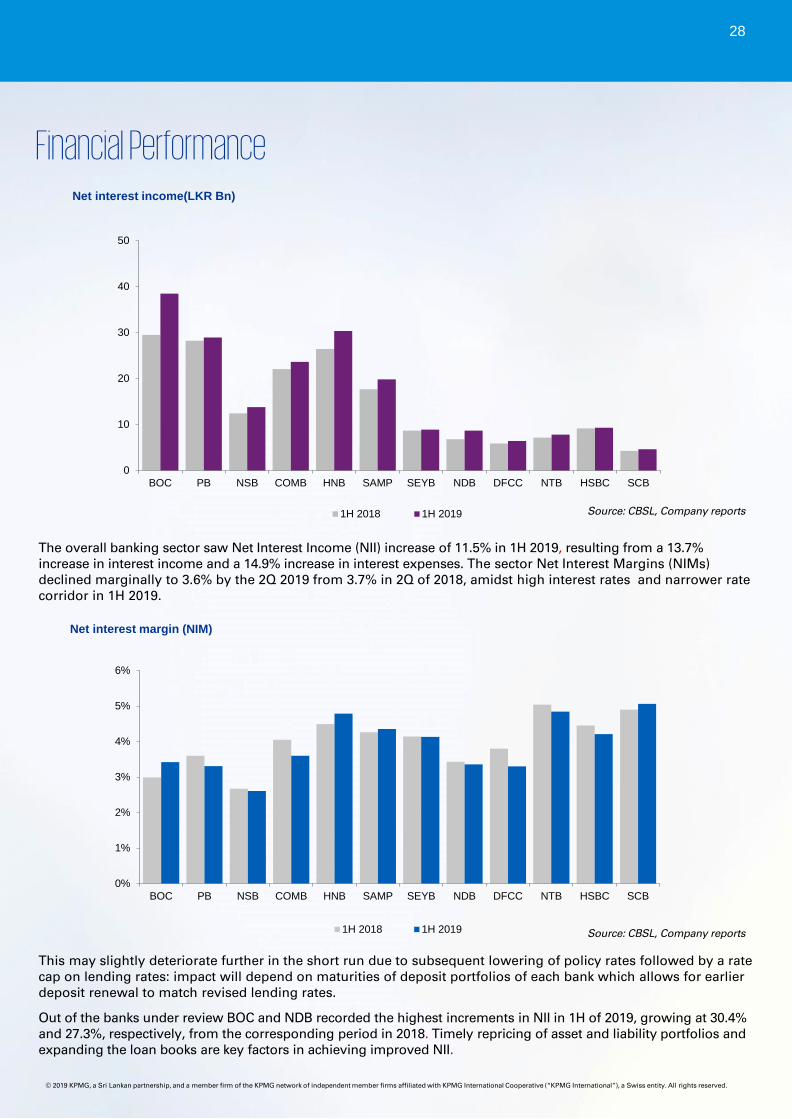
The overall banking sector saw Net Interest Income (NII) increase of 11.5% in 1H 2019, resulting from a 13.7% increase in interest income and a 14.9% increase in interest expenses. The sector Net Interest Margins (NIMs) declined marginally to 3.6% by the 2Q 2019 from 3.7% in 2Q of 2018, amidst high interest rates and narrower rate corridor in 1H 2019.
Source: CBSL, Company reports
This may slightly deteriorate further in the short run due to subsequent lowering of policy rates followed by a rate cap on lending rates: impact will depend on maturities of deposit portfolios of each bank which allows for earlier deposit renewal to match revised lending rates.
Out of the banks under review BOC and NDB recorded the highest increments in NII in 1H of 2019, growing at 30.4% and 27.3%, respectively, from the corresponding period in 2018. Timely repricing of asset and liability portfolios and expanding the loan books are key factors in achieving improved NII.
Financial Performance
0%
1%
2%
3%
4%
5%
6%
BOC PB NSB COMB HNB SAMP SEYB NDB DFCC NTB HSBC SCB
Net interest margin (NIM)
1H 2018 1H 2019
0
10
20
30
40
50
BOC PB NSB COMB HNB SAMP SEYB NDB DFCC NTB HSBC SCB
Net interest income(LKR Bn)
1H 2018 1H 2019
Source: CBSL, Company reports
28

29 | Sri Lanka Banking Report – Issue 04
© 2019 KPMG, a Sri Lankan partnership, and a member firm of the KPMG network of independent member firms affiliated with KPMG International Cooperative (“KPMG International”), a Swiss entity. All rights reserved.
Profit after taxation (PAT) of the sector fell by a significant 20.49% in 1H 2019 compared to the corresponding period in 2018, resultant from factors such as higher provisions for impairment and debt repayment levy. Other than BOC and NSB, the remaining DSIBs reported 20.0% lower PAT than the corresponding period in 2018.
The deterioration of asset quality during the period added on to higher impairments especially in the leading state bank BOC due to high NPLs experienced. It is further visible in the increase of impairment provisions that increased by 76% in 1H 2019 compared to 1H 2018. However, the CBSL initiatives to lower lending rates may likely reverse this situation, amidst the other negative macro economic conditions. Further, the interim measures introduced by CBSL on application of SLFRS 9 on SME segment may also trigger reversal of impairment provisions, thus indicating a temporary improvement in profitability.
The cost to income ratios showed an increase in most of banks of the industry.
0
2
4
6
8
10
Profit after tax (LKR Bn)
1H 2018 1H 2019
0%
20%
40%
60%
Cost to income ratio
1H 2018 1H 2019
(12.0)
(8.0)
(4.0)
-
LKR
Bn
Total Impairment
1H 2018 1H 2019
Source: CBSL, Company reports
Source: CBSL, Company reports
Regulatory Circular on SMEs
In April 2019, the CBSL introduced an interim measure for application of SLFRS 9 by licensed banks in relation to SME loans (Value less than LKR 25 Mn.) which is expected to be in place for a temporary period from January 2019 to June 2020. Accordingly, banks may rebut the 30 day rebuttal presumption for significant increase in credit risk to 60 days, thus relaxing the requirement to provide for life time expected credit loss, by extending Stage 1 to 60 days from last payment date.
This circular allows banks to extend the 12 Month Expected Credit Loss (12M ECL) requirement usually applied for the 0- 30 day overdue portfolios to the 30 - 60 day overdue loans as well. Given that the 12M ECL results in a lower impairment value compared to life time Expected Credit Loss requirement for 30-60 days overdue loans, the net effect of reversal of expected credit loss for loans identified under the above segment may result in a lower total impairment value in the income statement. The significance of the impact of these revisions may largely depend on the extent of SME portfolios retained by each bank.
During the first half of 2019, many banks have not applied the option permitted by CBSL as its only a temporary measure, however, we may see more banks applying this temporary relaxation during the second half of 2019.
29

30 | Sri Lanka Banking Report – Issue 04
© 2019 KPMG, a Sri Lankan partnership, and a member firm of the KPMG network of independent member firms affiliated with KPMG International Cooperative (“KPMG International”), a Swiss entity. All rights reserved.
The fall in sector earnings coupled with the increase in asset bases of banks resulted in overall banking sector RoA (before tax) falling to 1.4% in 1H2019 compared to 1.9% a year earlier. Local banks except for NDB and SCB indicated a drop in ROA compared to 1H 2018. SCB recorded the highest for the 1H 2019. The decrease in Asset Quality related to NPLs have had a significant impact on the ROA of the sector.
The statutory liquid Asset Ratio (SLAR) of domestic banking units increased to 31.3% in 1H 2019 from 27.6% in 2H 2018. The sector SLAR has continued to maintain its’ higher position than that of the regulatory minimum of 20.0%.
Source: CBSL, Company reports
On a similar note, the falling earnings coupled with increased equity bases (due to increased capital adequacy requirements) saw the sector RoE falling significantly to 10.1% in 1H 2019 from 14.8% a year earlier.
A significant decrease was noted in Sampath Bank’s ROE from 19.68% to 9.26% in 1H 2019, resulting from higher NPL and increase in equity base resultant from rights issue raised during the year.
The credit to deposit ratio of the sector was reported at a lower 87.4% in 1H 2019 compared to 90.6% in 2H 2018. Local banks excluding NDB and DFCC maintained credit to deposit ratios below 100%. DFCC bank has showed a decrease from 117.85% in 1H 2018 to 105.69% in 1H 2019 .
Profitability
Liquidity
0%
1%
2%
3%
4%
5%
6%
Return on Assets (ROA)
1H 2018 1H 2019
0%
20%
40%
60%
80%
100%
120%
Statutory liquid asset ratio (domestic banking units)
1H 2018 1H 2019
0%
25%
50%
75%
100%
125%
150%
Credit to deposit ratio
1H 2018 1H 2019
0%
5%
10%
15%
20%
25%
Return on Equity (ROE)
1H 2018 1H2019
30
Source: CBSL, Company reports
31 | Sri Lanka Banking Report – Issue 04
© 2019 KPMG, a Sri Lankan partnership, and a member firm of the KPMG network of independent member firms affiliated with KPMG International Cooperative (“KPMG International”), a Swiss entity. All rights reserved.
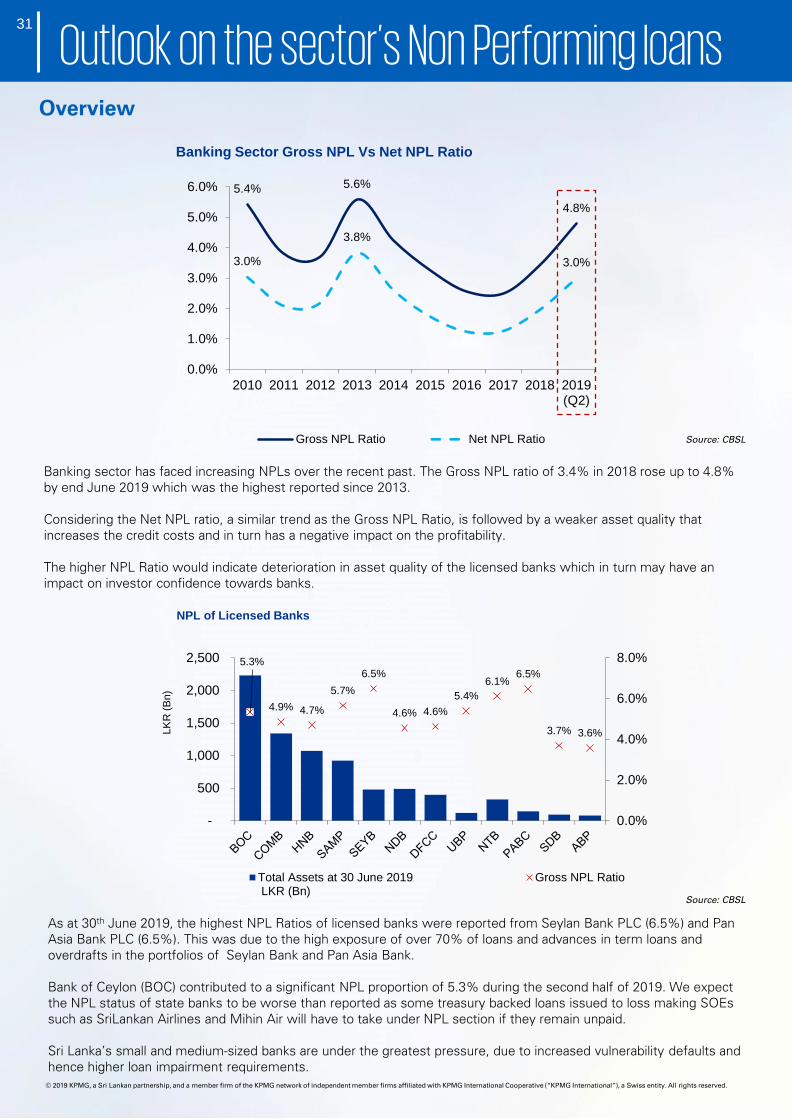
Banking sector has faced increasing NPLs over the recent past. The Gross NPL ratio of 3.4% in 2018 rose up to 4.8% by end June 2019 which was the highest reported since 2013.
Considering the Net NPL ratio, a similar trend as the Gross NPL Ratio, is followed by a weaker asset quality that increases the credit costs and in turn has a negative impact on the profitability.
The higher NPL Ratio would indicate deterioration in asset quality of the licensed banks which in turn may have an impact on investor confidence towards banks.
5.4% 5.6%
4.8%
3.0%
3.8%
3.0%
0.0%
1.0%
2.0%
3.0%
4.0%
5.0%
6.0%
2010 2011 2012 2013 2014 2015 2016 2017 2018 2019(Q2)
Banking Sector Gross NPL Vs Net NPL Ratio
Gross NPL Ratio Net NPL Ratio
Overview
As at 30th June 2019, the highest NPL Ratios of licensed banks were reported from Seylan Bank PLC (6.5%) and Pan Asia Bank PLC (6.5%). This was due to the high exposure of over 70% of loans and advances in term loans and overdrafts in the portfolios of Seylan Bank and Pan Asia Bank.
Bank of Ceylon (BOC) contributed to a significant NPL proportion of 5.3% during the second half of 2019. We expect the NPL status of state banks to be worse than reported as some treasury backed loans issued to loss making SOEs such as SriLankan Airlines and Mihin Air will have to take under NPL section if they remain unpaid.
Sri Lanka’s small and medium-sized banks are under the greatest pressure, due to increased vulnerability defaults and hence higher loan impairment requirements.
Source: CBSL
Outlook on the sector’s Non Performing loans
Source: CBSL
31
5.3%
4.9% 4.7%
5.7%6.5%
4.6% 4.6%5.4%
6.1%6.5%
3.7% 3.6%
0.0%
2.0%
4.0%
6.0%
8.0%
-
500
1,000
1,500
2,000
2,500
LKR
(Bn)
NPL of Licensed Banks
Total Assets at 30 June 2019 LKR (Bn)
Gross NPL Ratio

32 | Sri Lanka Banking Report – Issue 04
© 2019 KPMG, a Sri Lankan partnership, and a member firm of the KPMG network of independent member firms affiliated with KPMG International Cooperative (“KPMG International”), a Swiss entity. All rights reserved.
Loans categorized as Losses have shown an increasing trend since 2017. The significant increase in above 540 days NPLs, i.e. Loss category of NPLs indicate a higher risk associated as the loan installments have not been paid for over 540 days.
Consequently, Special Mentioned NPLs, i.e. 90-180 days, have started to show an increasing trend since 2018 and a sharp spike of 22% in June 2019, the highest recorded during the past 9 years. The spike in Special Mentioned loans may be a flash of red lights as many borrowers have started to delay its payments above 90 days.
Vulnerability of NPLs
107.04 99.30 116.64
191.03
165.47 152.81 142.35 160.67
263.15
323.87
0
100
200
300
400
2010 2011 2012 2013 2014 2015 2016 2017 2018 2019 (Q2)
LKR
Bn
Classification of NPLs
Special Mentioned Substrandard Doubtful Loss
58% 57% 53%40%
51%62%
72% 70%57%
49%
42% 43% 47%60%
49%38%
28% 30%43%
51%
0.0%
25.0%
50.0%
75.0%
100.0%
2010 2011 2012 2013 2014 2015 2016 2017 2018 2019(Q2)
Provision Coverage Ratio of the banking sector (%)
Provision Coverage Ratio Uncovered Proportion
Since 2017, the provision coverage has been at a decreasing trend, and at 2H2019, the ratio stands at 49%, the lowest since 2013.
The loans not covered indicate that the banking sector may take a sudden hit if loans continue to default.
Source: CBSL
Source: CBSL
32

33 | Sri Lanka Banking Report – Issue 04
© 2019 KPMG, a Sri Lankan partnership, and a member firm of the KPMG network of independent member firms affiliated with KPMG International Cooperative (“KPMG International”), a Swiss entity. All rights reserved.
Triggers of NPLs
The recent shocks to the economy and fiscal tightening policies have triggered the increase of NPLs. The hindered economic growth across the sectors have an impact on business, especially SMEs revenue, cash flows and profits that are key elements that determine loan repayments.
The downward slope of the economy causes a reduction in revenue and therefore adds pressure on the cash flow of businesses. A decrease in cash flows would in turn force businesses to delay the payment of existing loan installments, and once the delay exceeds 90 days, the loan is considered as an NPL.
The declined economic growth has led to decreased revenue generation and forced businesses to borrow for working capital requirements. The hindered economic growth continued in 2H 2019 thus businesses failed to generate excess cash to service loans.
The sectors with the highest NPLs continued to be Agriculture, Retail, Consumption, Construction and Industrial due to the higher government defaults and adverse weather conditions that affect agriculture.
3.9%3.2%
4.6% 4.7%
-3.8%
-0.8%
4.3%
5.5%
9.0%
4.1%4.7%
2.2%
5.8%
3.9%
0.9%
3.0%
11.2%
3.8%
4.8%6.0%
4.7%
3.2%
4.7%4.1%
-5.0%
-3.0%
-1.0%
1.0%
3.0%
5.0%
7.0%
9.0%
11.0%
13.0%
2012 2013 2014 2015 2016 2017 2018 2019 (Q1)
Gro
wth
rat
e (%
)
Sector-wise GDP Growth
Agriculture, Forestry & Fishing Industries Services Source: CBSL
33
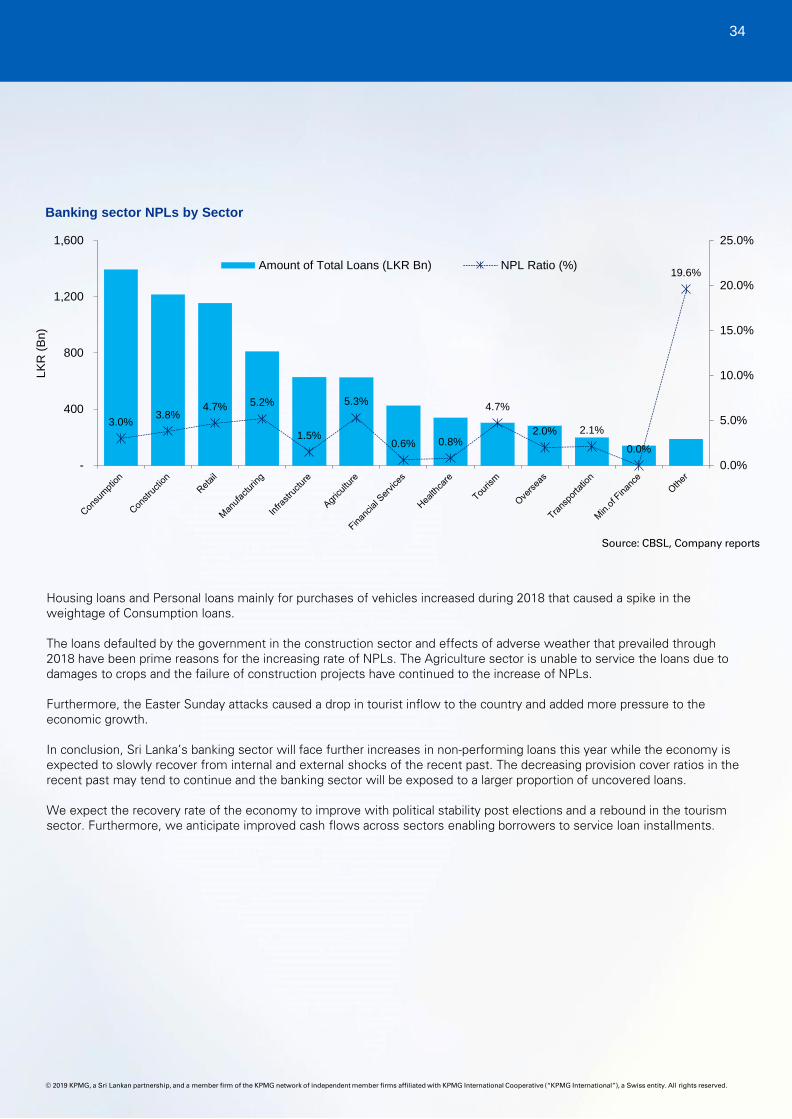
34 | Sri Lanka Banking Report – Issue 04
© 2019 KPMG, a Sri Lankan partnership, and a member firm of the KPMG network of independent member firms affiliated with KPMG International Cooperative (“KPMG International”), a Swiss entity. All rights reserved.
Housing loans and Personal loans mainly for purchases of vehicles increased during 2018 that caused a spike in the weightage of Consumption loans.
The loans defaulted by the government in the construction sector and effects of adverse weather that prevailed through 2018 have been prime reasons for the increasing rate of NPLs. The Agriculture sector is unable to service the loans due to damages to crops and the failure of construction projects have continued to the increase of NPLs.
Furthermore, the Easter Sunday attacks caused a drop in tourist inflow to the country and added more pressure to the economic growth.
In conclusion, Sri Lanka’s banking sector will face further increases in non-performing loans this year while the economy is expected to slowly recover from internal and external shocks of the recent past. The decreasing provision cover ratios in the recent past may tend to continue and the banking sector will be exposed to a larger proportion of uncovered loans.
We expect the recovery rate of the economy to improve with political stability post elections and a rebound in the tourism sector. Furthermore, we anticipate improved cash flows across sectors enabling borrowers to service loan installments.
3.0% 3.8%4.7% 5.2%
1.5%
5.3%
0.6% 0.8%
4.7%
2.0% 2.1%
0.0%
19.6%
0.0%
5.0%
10.0%
15.0%
20.0%
25.0%
-
400
800
1,200
1,600
LKR
(Bn)
Banking sector NPLs by Sector
Amount of Total Loans (LKR Bn) NPL Ratio (%)
34
Source: CBSL, Company reports

35 | Sri Lanka Banking Report – Issue 04
© 2019 KPMG, a Sri Lankan partnership, and a member firm of the KPMG network of independent member firms affiliated with KPMG International Cooperative (“KPMG International”), a Swiss entity. All rights reserved.
35

36 | Sri Lanka Banking Report – Issue 04
© 2019 KPMG, a Sri Lankan partnership, and a member firm of the KPMG network of independent member firms affiliated with KPMG International Cooperative (“KPMG International”), a Swiss entity. All rights reserved.
ACKNOWLEDGEMENTS
The following KPMG staff have made significant contribution towards the development of this publication.
Sashi DharmadasaDirector - Markets
Dhinali PeirisAssociate Director Corporate Finance;Deal Advisory
Kasun GunawardhanaAssistant Manager Corporate Finance;Deal Advisory
Chiranthaka RanatungaConsultantCorporate Finance;Deal Advisory
Azlan SourjahJunior ExecutiveMarkets
Nilhan MedagodaAssociate ConsultantCorporate Finance;Deal Advisory
Azeem SheriffExecutiveDigital Marketing
36

37 | Sri Lanka Banking Report – Issue 04
© 2019 KPMG, a Sri Lankan partnership, and a member firm of the KPMG network of independent member firms affiliated with KPMG International Cooperative (“KPMG International”), a Swiss entity. All rights reserved.
About KPMGKPMG Global KPMG Sri Lanka
KPMG is one of the world's top global networks of professional services firms. We provide, audit, tax and advisory services with quality, integrity and excellence as fundamental pillars that have marked our work over our more than 140 years of history.
Global Revenue
28,960 million USD19,8709,090
Revenue figures 2017/2018
985+Offices
207,050Professionals
153Countries
Financial sector services
Rest of services
KPMG is one of the largest professional services firms in Sri Lanka and is also the oldest Chartered Accountancy firm in the country spanning over a century since inception in 1897.
6 OfficesIncluding one in Maldives
Over 1,100 ProfessionalsOur clients value the breadth of skills and experience KPMG professionals bring to every client engagement
Audited 45% of Listed Entities in Sri LankaAs indicated in the LMD Auditors League 2016.
Recognition | KPMG in Sri Lanka
First in the Auditors League in Sri Lanka
LMD 100 - 2017
Highlighting the significance of KPMG’s impact in the marketplace, KPMG in Sri Lanka received a number of accolades including being the ‘Best Deal Advisory Firm in Sri Lanka’ by The Global Banking and Finance Review for its outstanding achievements in Deal Advisory, being ranked among the ‘Most Respected’ entities in the country for 2016 and being ranked first in the 2015/2016 Auditors League as indicated in the LMD 100. Recently the firm also won the Tax Firm of the Year at the Asia Tax Awards 2017.
Ranked First in Financial Services Category
LMD Most Respected 2019
Best Deal Advisory Firm in Sri Lanka
Global Banking and Finance Review 2015
Best Advisory Firm in Sri Lanka
The International Finance Magazine 2016
Sri Lanka Tax Firm of the Year
Asia Tax Awards 2017
772 85 342Professionals in
AuditProfessionals in
TaxProfessionals in
Advisory

38 | Sri Lanka Banking Report – Issue 04
© 2019 KPMG, a Sri Lankan partnership, and a member firm of the KPMG network of independent member firms affiliated with KPMG International Cooperative (“KPMG International”), a Swiss entity. All rights reserved.
KPMG Leadership - Banking
Audit Tax Advisory
Suren RajakarierPartner, Head of Audit
Shamila JayasekaraPartner, Head of Tax & Regulatory
Jagath PereraPartner, Internal Audit Risk & Compliance
Services & Forensic Services
Shiluka GoonewardenePrincipal - Head of Deal Advisory,
Deputy Head of Markets
Chamara AbeyrathnePartner, Audit
Suresh PereraPrincipal - Tax & Regulatory,
Deputy Head of Markets
Thamali RodrigoPartner, Audit
Priyanka JayatilakePartner, Head of Advisory
Markets
Partner, Head of Banking Services and Markets,
Deputy Head of Audit
Reyaz MihularManaging Partner
Ranjani Joseph
Upul KarunaratnePartner, Audit
38

The information contained herein is of a general nature and is not intended to address the circumstances of any particular individual or entity. Althoughwe endeavor to provide accurate and timely information, there can be no guarantee that such information is accurate as of the date it is received or thatit will continue to be accurate in the future. No one should act upon such information without appropriate professional advice after a thoroughexamination of the particular situation.
Social Media;
© 2019 KPMG, a Sri Lankan partnership and a member firm of the KPMG network of independent member firms affiliated with InternationalCooperative ("KPMG International"), a Swiss entity. All rights reserved. Printed in Sri Lanka.
The KPMG name and logo are registered trademarks or trademarks of KPMG International.
Reyaz MihularManaging Partner T: +94 11 5426500E: [email protected]
Ranjani JosephPartner – Head of Banking Services and Markets, Deputy Head of Audit T: +94 11 5426302E: [email protected]
Contact us
Shiluka GoonewardenePrincipal - Head of Deal Advisory, Deputy Head of Markets T: +94 11 5426271E: [email protected]
Suresh PereraPrincipal - Tax & Regulatory, Deputy Head of MarketsT: +94 11 5426502E: [email protected]
@kpmgsl
KPMG Sri Lanka