Sri Lanka 2018brandfinance.com/images/upload/brand_finance_sri_lanka_100_2018.pdf · 6. Brand...
12
Sri Lanka 100 2018 The annual report on Sri Lanka’s most valuable and strongest brands April 2018
-
Upload
nguyenphuc -
Category
Documents
-
view
244 -
download
0
Transcript of Sri Lanka 2018brandfinance.com/images/upload/brand_finance_sri_lanka_100_2018.pdf · 6. Brand...
Sri Lanka100 2018The annual report on Sri Lanka’s most valuable and strongest brandsApril 2018
Foreword - David Haigh 4
Foreword - Ruchi Gunewardene 5
About Brand Finance 6
Consulting Services 7
Definitions 8
Executive Summary 10
Consumer Brands Table 14
Understand Your Brand’s Value 16
Methodology 17
Our Clients 18
Our Services in Sri Lanka 19
Our People 20
Contents.
Brand Finance Report Sri Lanka 100 April 2018 5.Brand Finance Report Sri Lanka 100 April 2018 4.
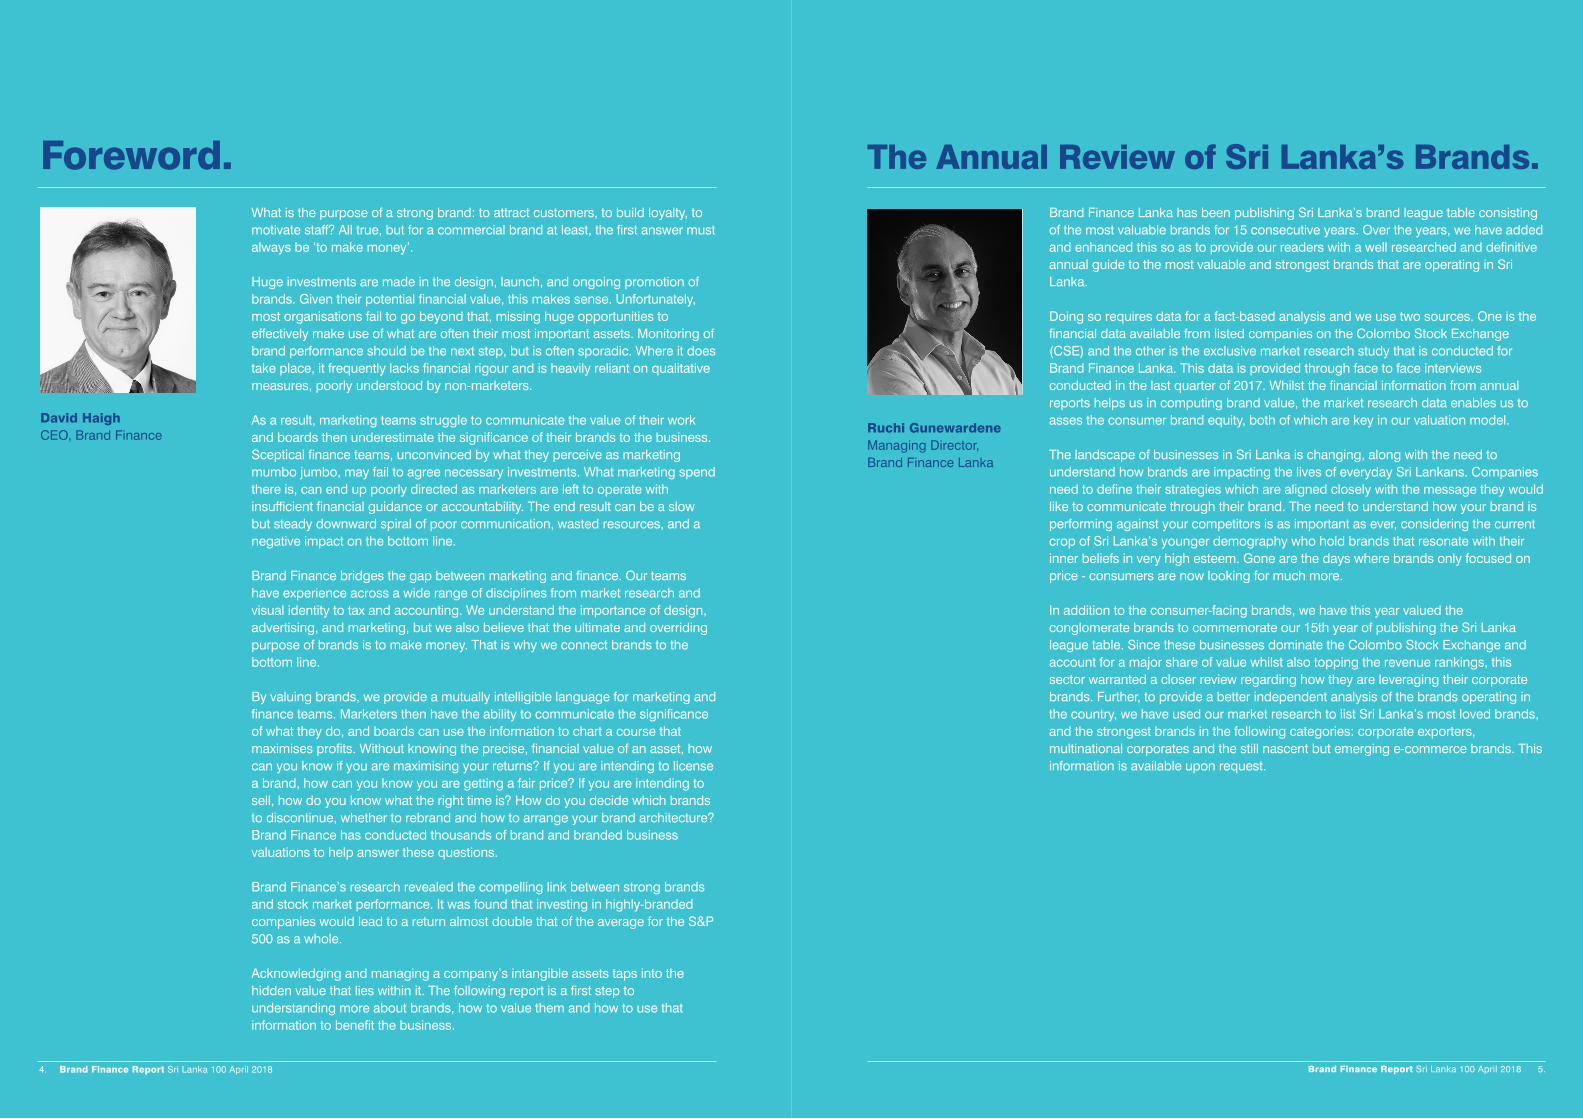
Foreword. The Annual Review of Sri Lanka’s Brands.What is the purpose of a strong brand: to attract customers, to build loyalty, to motivate staff? All true, but for a commercial brand at least, the first answer must always be ‘to make money’.
Huge investments are made in the design, launch, and ongoing promotion of brands. Given their potential financial value, this makes sense. Unfortunately, most organisations fail to go beyond that, missing huge opportunities to effectively make use of what are often their most important assets. Monitoring of brand performance should be the next step, but is often sporadic. Where it does take place, it frequently lacks financial rigour and is heavily reliant on qualitative measures, poorly understood by non-marketers.
As a result, marketing teams struggle to communicate the value of their work and boards then underestimate the significance of their brands to the business. Sceptical finance teams, unconvinced by what they perceive as marketing mumbo jumbo, may fail to agree necessary investments. What marketing spend there is, can end up poorly directed as marketers are left to operate with insufficient financial guidance or accountability. The end result can be a slow but steady downward spiral of poor communication, wasted resources, and a negative impact on the bottom line.
Brand Finance bridges the gap between marketing and finance. Our teams have experience across a wide range of disciplines from market research and visual identity to tax and accounting. We understand the importance of design, advertising, and marketing, but we also believe that the ultimate and overriding purpose of brands is to make money. That is why we connect brands to the bottom line.
By valuing brands, we provide a mutually intelligible language for marketing and finance teams. Marketers then have the ability to communicate the significance of what they do, and boards can use the information to chart a course that maximises profits. Without knowing the precise, financial value of an asset, how can you know if you are maximising your returns? If you are intending to license a brand, how can you know you are getting a fair price? If you are intending to sell, how do you know what the right time is? How do you decide which brands to discontinue, whether to rebrand and how to arrange your brand architecture? Brand Finance has conducted thousands of brand and branded business valuations to help answer these questions.
Brand Finance’s research revealed the compelling link between strong brands and stock market performance. It was found that investing in highly-branded companies would lead to a return almost double that of the average for the S&P 500 as a whole.
Acknowledging and managing a company’s intangible assets taps into the hidden value that lies within it. The following report is a first step to understanding more about brands, how to value them and how to use that information to benefit the business.
David Haigh CEO, Brand Finance
Brand Finance Lanka has been publishing Sri Lanka’s brand league table consisting of the most valuable brands for 15 consecutive years. Over the years, we have added and enhanced this so as to provide our readers with a well researched and definitive annual guide to the most valuable and strongest brands that are operating in Sri Lanka.
Doing so requires data for a fact-based analysis and we use two sources. One is the financial data available from listed companies on the Colombo Stock Exchange (CSE) and the other is the exclusive market research study that is conducted for Brand Finance Lanka. This data is provided through face to face interviews conducted in the last quarter of 2017. Whilst the financial information from annual reports helps us in computing brand value, the market research data enables us to asses the consumer brand equity, both of which are key in our valuation model.
The landscape of businesses in Sri Lanka is changing, along with the need to understand how brands are impacting the lives of everyday Sri Lankans. Companies need to define their strategies which are aligned closely with the message they would like to communicate through their brand. The need to understand how your brand is performing against your competitors is as important as ever, considering the current crop of Sri Lanka’s younger demography who hold brands that resonate with their inner beliefs in very high esteem. Gone are the days where brands only focused on price - consumers are now looking for much more.
In addition to the consumer-facing brands, we have this year valued the conglomerate brands to commemorate our 15th year of publishing the Sri Lanka league table. Since these businesses dominate the Colombo Stock Exchange and account for a major share of value whilst also topping the revenue rankings, this sector warranted a closer review regarding how they are leveraging their corporate brands. Further, to provide a better independent analysis of the brands operating in the country, we have used our market research to list Sri Lanka’s most loved brands, and the strongest brands in the following categories: corporate exporters, multinational corporates and the still nascent but emerging e-commerce brands. This information is available upon request.
Ruchi Gunewardene Managing Director, Brand Finance Lanka
Brand Finance Report Sri Lanka 100 April 2018 7.Brand Finance Report Sri Lanka 100 April 2018 6.
Consulting Services. About Brand Finance.
Contact Details.For business enquiries, please contact:
Ruchi GunewardeneManaging Director [email protected]
Mobile Phone : + 94 777 32 32 23Office Phone : + 94 114 94 16 70
18/185A – 1/1A M E D Dabare
Mawatha, Colombo 5
linkedin.com/company/ brand-finance facebook.com/brandfinance
twitter.com/brandfinance
For further information on Brand Finance’s services and valuation experience, please contact your local representative:
Country Contact Email addressAsia Pacific Samir Dixit [email protected] +65 906 98 651 Australia Mark Crowe [email protected] +61 282 498 320Brazil Geoffrey Hamilton-Jones [email protected] +55 1196 499 9963Canada Bill Ratcliffe [email protected] +1 647 3437 266Caribbean Nigel Cooper [email protected] +1 876 8256 598China Scott Chen [email protected] +86 1860 118 8821East Africa Jawad Jaffer [email protected] +254 204 440 053France Victoire Ruault [email protected] +44 0207 389 9427Germany Holger Mühlbauer [email protected] +49 1515 474 9834India Savio D’Souza [email protected] +44 0207 389 9400Indonesia Jimmy Halim [email protected] +62 215 3678 064Ireland Simon Haigh [email protected] +353 087 6695 881Italy Massimo Pizzo [email protected] +39 0230 312 5105Mexico & LatAm Laurence Newell [email protected] +52 1559 197 1925Middle East Andrew Campbell [email protected] +971 508 113 341Nigeria Babatunde Odumeru [email protected] +234 012 911 988Romania Mihai Bogdan [email protected] +40 728 702 705Spain Teresa de Lemus [email protected] +34 654 481 043 South Africa Jeremy Sampson [email protected] +27 828 857 300Sri Lanka Ruchi Gunewardene [email protected] +94 114 941 670Turkey Muhterem Ilgüner [email protected] +90 216 3526 729UK Richard Haigh [email protected] +44 0207 389 9400USA Amy Rand [email protected] +44 0207 389 9432Vietnam Lai Tien Manh [email protected] +84 473 004 468
Brand Finance is the world’s leading independent branded business valuation and strategy consultancy.
We are a specialist consultancy dedicated to the better understanding of marketing finances, offering a highly professional approach to marketing accountability and brand evaluation. Brand Finance has developed transparent and accessible brand evaluation methodologies grounded in marketing and investment practice. The work we do often enables both marketing and finance departments to come together to discuss issues, analyse opportunities and to envisage future scenarios together, at the same table. Hence, we help to bridge the gap between marketing and finance.
For more than 20 years we have helped companies to connect their brands to the bottom line, building robust business cases for brand decisions, strategies and investments. In so doing, we have helped finance people to evaluate marketing programmes and marketing people to present their case in the Board Room. We have worked with companies of all shapes and sizes, from blue-chip internationals such as Vodafone and Shell, to small iconic brands such as Asprey and Ministry of Sound. We also work with tax authorities, IP lawyers and private equity firms.
Every year Brand Finance values over 3,500 brands – across all sectors and geographies. The results are tabulated and published in the media, with partners such as The Banker, to raise awareness of brands as valuable business assets, which must be managed and invested in. Other Brand Finance studies include the Nation Brands 100, the Football 50 and the Global Intangible Finance Tracker (GIFT).
Sri Lanka’s most valuable brands are published in The Brands Annual through Media Services / LMD.
For more information, please visit our website:www.brandfinance.com
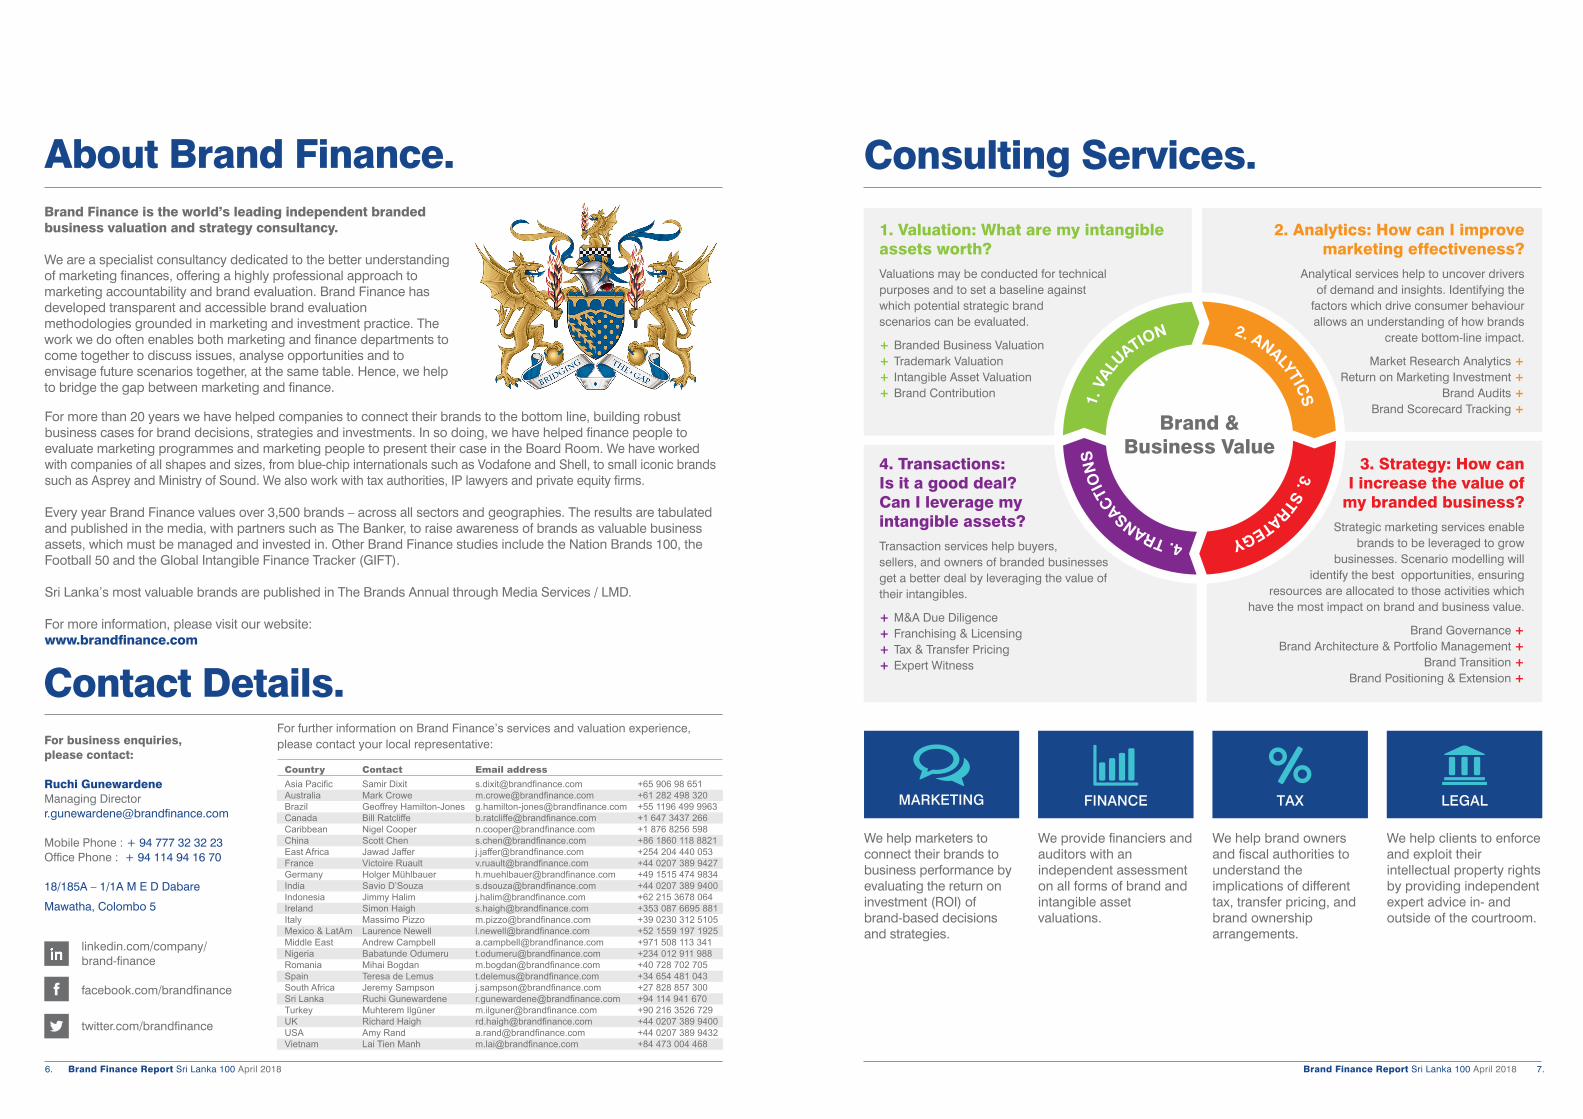
1. Valuation: What are my intangible assets worth?Valuations may be conducted for technical purposes and to set a baseline against which potential strategic brand scenarios can be evaluated.
+ Branded Business Valuation+ Trademark Valuation+ Intangible Asset Valuation+ Brand Contribution
2. Analytics: How can I improve marketing effectiveness?
Analytical services help to uncover drivers of demand and insights. Identifying the
factors which drive consumer behaviour allows an understanding of how brands
create bottom-line impact.
Market Research Analytics +Return on Marketing Investment +
Brand Audits +Brand Scorecard Tracking +
4. Transactions: Is it a good deal? Can I leverage my intangible assets?Transaction services help buyers, sellers, and owners of branded businesses get a better deal by leveraging the value of their intangibles.
+ M&A Due Diligence + Franchising & Licensing+ Tax & Transfer Pricing+ Expert Witness
3. Strategy: How can I increase the value of
my branded business?Strategic marketing services enable
brands to be leveraged to grow businesses. Scenario modelling will
identify the best opportunities, ensuring resources are allocated to those activities which
have the most impact on brand and business value.
Brand Governance + Brand Architecture & Portfolio Management +
Brand Transition + Brand Positioning & Extension +
MARKETING FINANCE TAX LEGAL
We help marketers to connect their brands to business performance by evaluating the return on investment (ROI) of brand-based decisions and strategies.
We provide financiers and auditors with an independent assessment on all forms of brand and intangible asset valuations.
We help brand owners and fiscal authorities to understand the implications of different tax, transfer pricing, and brand ownership arrangements.
We help clients to enforce and exploit their intellectual property rights by providing independent expert advice in- and outside of the courtroom.
2. ANALYTICS
3. STRATEGY 4. TRANSACTI
ON
S1.
VAL
UATION
Brand & Business Value
Brand Finance Report Sri Lanka 100 April 2018 8. Brand Finance Report Sri Lanka 100 April 2018 9.
Definitions.
Bra
nd
Str
eng
th I
nd
ex
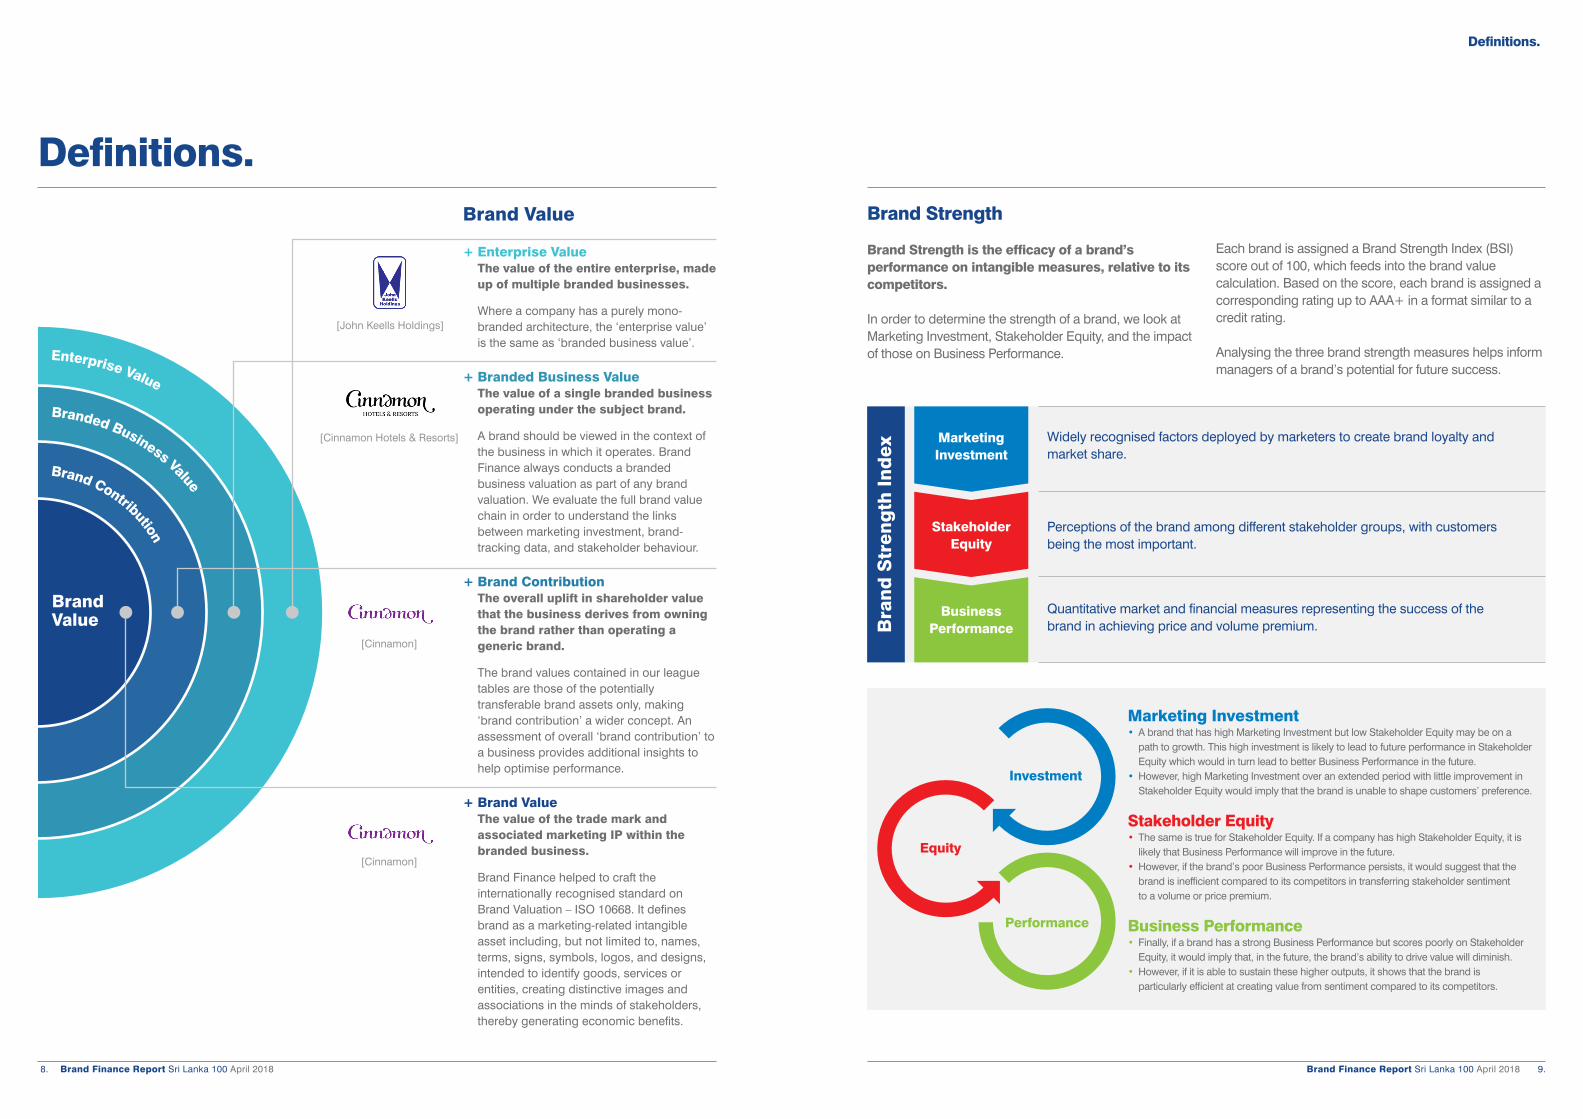
Widely recognised factors deployed by marketers to create brand loyalty and market share.
Marketing Investment• A brand that has high Marketing Investment but low Stakeholder Equity may be on a path to growth. This high investment is likely to lead to future performance in Stakeholder Equity which would in turn lead to better Business Performance in the future.• However, high Marketing Investment over an extended period with little improvement in Stakeholder Equity would imply that the brand is unable to shape customers’ preference.
Stakeholder Equity• The same is true for Stakeholder Equity. If a company has high Stakeholder Equity, it is likely that Business Performance will improve in the future.• However, if the brand’s poor Business Performance persists, it would suggest that the brand is inefficient compared to its competitors in transferring stakeholder sentiment to a volume or price premium.
Business Performance• Finally, if a brand has a strong Business Performance but scores poorly on Stakeholder Equity, it would imply that, in the future, the brand’s ability to drive value will diminish.• However, if it is able to sustain these higher outputs, it shows that the brand is particularly efficient at creating value from sentiment compared to its competitors.
MarketingInvestment
Perceptions of the brand among different stakeholder groups, with customers being the most important.
Quantitative market and financial measures representing the success of the brand in achieving price and volume premium.
StakeholderEquity
BusinessPerformance
Brand Strength
Brand Strength is the efficacy of a brand’s performance on intangible measures, relative to its competitors.
In order to determine the strength of a brand, we look at Marketing Investment, Stakeholder Equity, and the impact of those on Business Performance.
Each brand is assigned a Brand Strength Index (BSI) score out of 100, which feeds into the brand value calculation. Based on the score, each brand is assigned a corresponding rating up to AAA+ in a format similar to a credit rating.
Analysing the three brand strength measures helps inform managers of a brand’s potential for future success.
Investment
Equity
Performance
Definitions. Brand Value
+ Enterprise Value The value of the entire enterprise, made up of multiple branded businesses.
Where a company has a purely mono- branded architecture, the ‘enterprise value’ is the same as ‘branded business value’.
+ Branded Business Value The value of a single branded business operating under the subject brand.
A brand should be viewed in the context of the business in which it operates. Brand Finance always conducts a branded business valuation as part of any brand valuation. We evaluate the full brand value chain in order to understand the links between marketing investment, brand- tracking data, and stakeholder behaviour.
+ Brand Contribution The overall uplift in shareholder value that the business derives from owning the brand rather than operating a generic brand.
The brand values contained in our league tables are those of the potentially transferable brand assets only, making ‘brand contribution’ a wider concept. An assessment of overall ‘brand contribution’ to a business provides additional insights to help optimise performance.
+ Brand Value The value of the trade mark and associated marketing IP within the branded business.
Brand Finance helped to craft the internationally recognised standard on Brand Valuation – ISO 10668. It defines brand as a marketing-related intangible asset including, but not limited to, names, terms, signs, symbols, logos, and designs, intended to identify goods, services or entities, creating distinctive images and associations in the minds of stakeholders, thereby generating economic benefits.
Brand Value
Enterprise Value
Branded Business Value
Brand Contribution
[John Keells Holdings]
[Cinnamon Hotels & Resorts]
[Cinnamon]
[Cinnamon]
Brand Finance Report Sri Lanka 100 April 2018 10. Brand Finance Report Sri Lanka 100 April 2018 11.
Executive Summary.
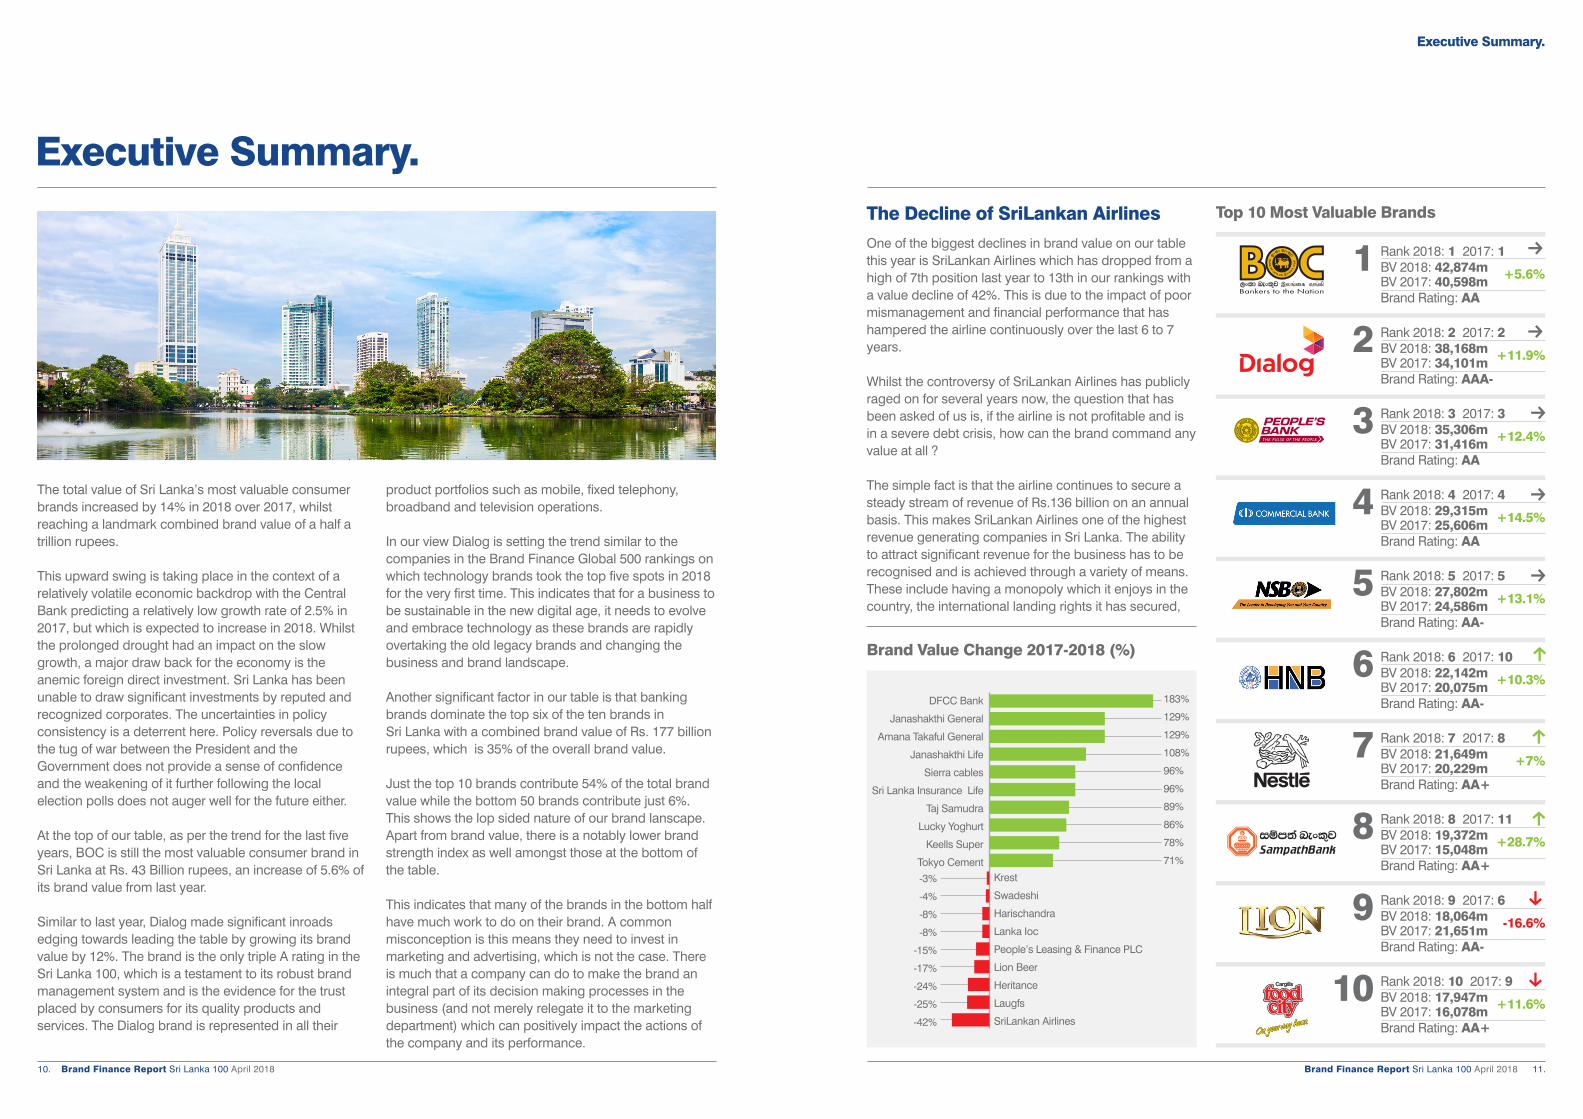
The total value of Sri Lanka’s most valuable consumer brands increased by 14% in 2018 over 2017, whilst reaching a landmark combined brand value of a half a trillion rupees.
This upward swing is taking place in the context of a relatively volatile economic backdrop with the Central Bank predicting a relatively low growth rate of 2.5% in 2017, but which is expected to increase in 2018. Whilst the prolonged drought had an impact on the slow growth, a major draw back for the economy is the anemic foreign direct investment. Sri Lanka has been unable to draw significant investments by reputed and recognized corporates. The uncertainties in policy consistency is a deterrent here. Policy reversals due to the tug of war between the President and the Government does not provide a sense of confidence and the weakening of it further following the local election polls does not auger well for the future either.
At the top of our table, as per the trend for the last five years, BOC is still the most valuable consumer brand in Sri Lanka at Rs. 43 Billion rupees, an increase of 5.6% of its brand value from last year.
Similar to last year, Dialog made significant inroads edging towards leading the table by growing its brand value by 12%. The brand is the only triple A rating in the Sri Lanka 100, which is a testament to its robust brand management system and is the evidence for the trust placed by consumers for its quality products and services. The Dialog brand is represented in all their
product portfolios such as mobile, fixed telephony, broadband and television operations.
In our view Dialog is setting the trend similar to the companies in the Brand Finance Global 500 rankings on which technology brands took the top five spots in 2018 for the very first time. This indicates that for a business to be sustainable in the new digital age, it needs to evolve and embrace technology as these brands are rapidly overtaking the old legacy brands and changing the business and brand landscape.
Another significant factor in our table is that banking brands dominate the top six of the ten brands in Sri Lanka with a combined brand value of Rs. 177 billion rupees, which is 35% of the overall brand value.
Just the top 10 brands contribute 54% of the total brand value while the bottom 50 brands contribute just 6%. This shows the lop sided nature of our brand lanscape. Apart from brand value, there is a notably lower brand strength index as well amongst those at the bottom of the table.
This indicates that many of the brands in the bottom half have much work to do on their brand. A common misconception is this means they need to invest in marketing and advertising, which is not the case. There is much that a company can do to make the brand an integral part of its decision making processes in the business (and not merely relegate it to the marketing department) which can positively impact the actions of the company and its performance.
Executive Summary.
The Decline of SriLankan AirlinesOne of the biggest declines in brand value on our table this year is SriLankan Airlines which has dropped from a high of 7th position last year to 13th in our rankings with a value decline of 42%. This is due to the impact of poor mismanagement and financial performance that has hampered the airline continuously over the last 6 to 7 years.
Whilst the controversy of SriLankan Airlines has publicly raged on for several years now, the question that has been asked of us is, if the airline is not profitable and is in a severe debt crisis, how can the brand command any value at all ?
The simple fact is that the airline continues to secure a steady stream of revenue of Rs.136 billion on an annual basis. This makes SriLankan Airlines one of the highest revenue generating companies in Sri Lanka. The ability to attract significant revenue for the business has to be recognised and is achieved through a variety of means. These include having a monopoly which it enjoys in the country, the international landing rights it has secured,
Top 10 Most Valuable Brands
Rank 2018: 1 2017: 1 BV 2018: 42,874m BV 2017: 40,598mBrand Rating: AA
1 +5.6%
Rank 2018: 9 2017: 6 BV 2018: 18,064m BV 2017: 21,651mBrand Rating: AA-
9 -16.6%
Rank 2018: 10 2017: 9 BV 2018: 17,947m BV 2017: 16,078mBrand Rating: AA+
10 +11.6%
Rank 2018: 7 2017: 8 BV 2018: 21,649m BV 2017: 20,229mBrand Rating: AA+
7 +7%
Rank 2018: 8 2017: 11 BV 2018: 19,372m BV 2017: 15,048mBrand Rating: AA+
8 +28.7%
Rank 2018: 6 2017: 10 BV 2018: 22,142m BV 2017: 20,075mBrand Rating: AA-
6 +10.3%
Rank 2018: 2 2017: 2 BV 2018: 38,168m BV 2017: 34,101mBrand Rating: AAA-
2 +11.9%
Rank 2018: 3 2017: 3 BV 2018: 35,306m BV 2017: 31,416mBrand Rating: AA
3 +12.4%
Rank 2018: 4 2017: 4 BV 2018: 29,315m BV 2017: 25,606mBrand Rating: AA
4 +14.5%
Rank 2018: 5 2017: 5 BV 2018: 27,802m BV 2017: 24,586mBrand Rating: AA-
5 +13.1%
Brand Value Change 2017-2018 (%)
DFCC Bank
Janashakthi General
Amana Takaful General
Janashakthi Life
Sierra cables
Sri Lanka Insurance Life
Taj Samudra
Lucky Yoghurt
Keells Super
Tokyo Cement
183%
129%
129%
108%
96%
96%
89%
86%
78%
71%
-3%
-4%
-8%
-8%
-15%
-17%
-24%
-25%
-42%
Krest
Swadeshi
Harischandra
Lanka Ioc
People’s Leasing & Finance PLC
Lion Beer
Heritance
Laugfs
SriLankan Airlines
Brand Finance Report Sri Lanka 100 April 2018 12. Brand Finance Report Sri Lanka 100 April 2018 13.
Executive Summary.
the strategic location of the country in relation to global travel, and the brand affinity that customers have and enjoy. For all these, a value can be assigned.
As investors look at SriLankan as a possible investment opportunity they will be determining the cost of restructuring the airline into being a profitable entity, so they can have the benefit of the revenue that it continues to generate through a much lower cost base. There is an intrinsic value within the business (one of which is brand, which we have estimated) which investors can leverage in the future. The questions are how much will it cost for the acquisition ( ie. the stake in the company), the cost of restructuring and finally will they have a free hand devoid of Government interference to do what has to be done to right size SriLankan?
Highest Movers
The biggest gainers in terms of performance on our table are Softlogic Life and DFCC bank. The Softlogic Group acquired Asian Alliance’s Life insurance business and has very quickly and successfully integrated it into their business portfolio whilst significantly growing the business.
DFCC Bank merged their consumer banking division Vardhana Bank with the parent company, thereby providing a seamless service for both their corporate and consumer businesses which has significantly increased the total value of the business and the brand.
Keells Super too has made a significant leap in this year’s table. The supermarket chain has experienced healthy growth, achieving revenue and bottom line growth of 32%, because of higher footfall and incremental revenue generated from newly opened outlets. The Nexus Mobile loyalty program membership reached a landmark of 650,000 customers, making it one of the most successful loyalty programmes in the country. As a significant proportion of the Keells Super customers are Nexus members, the sector continued to leverage on its data analytics to better understand consumption patterns and target promotions and offers which will specifically benefit its customer base. Keells Super is also primed to grow in the current year through a major rebranding initiative and we could expect them to begin to seriously challenge the market leader Cargills Food City in the near future.
Alcoholic Beverages Shuffle
DCSL saw a significant increase in their brand value primarily driven by the favourable excise taxes for hard liquor in comparison to soft liquor products. This resulted in a major shift in consumption patterns as customers sought products with the best value for money. In the 2018 budget, the Government reduced excise taxes on beer by 33% and raised that on hard liquor by 2% and barring further changes, Fitch expects the beer market share to report an increase to around 24%-25% in the medium term and expect hard liquor sales volumes to contract 2%, reversing some of the market share gains it made in 2017.
Brand Valuation Benefits
The primary use of our brand value table is to ascertain the performance of the brand over time and its future value-creating potential. The challenge for those in the top 50 is to ensure they maintain that single-minded focus on growth by strengthening the brand. This needs to happen through understanding how each stakeholder impacts its brand and by defining or redefining the brand where relevant, and through constant differentiation through innovation.
The bottom 50 brands, on the other hand, have much work to do to establish themselves in their respective markets and work towards a strategic approach to long-term brand building.
The process of identifying Sri Lanka’s most valuable brands begins by reviewing the consumer-facing companies which are listed on the Colombo Stock Exchange (CSE) and by companies that are interested to list their brands in our rankings to understand where they stand against their competitors. By analysing both the financial and marketing performances of these brands, we can determine which of them are generating the highest brand value.
The data we have enables us to provide Brand Valuation Reports which enable companies to understand how their brands are performing against its competitors locally and internationally. This provides insight as to how the brand is performing against its key competitors, set global benchmarks and identify the drivers of strength and brand value.
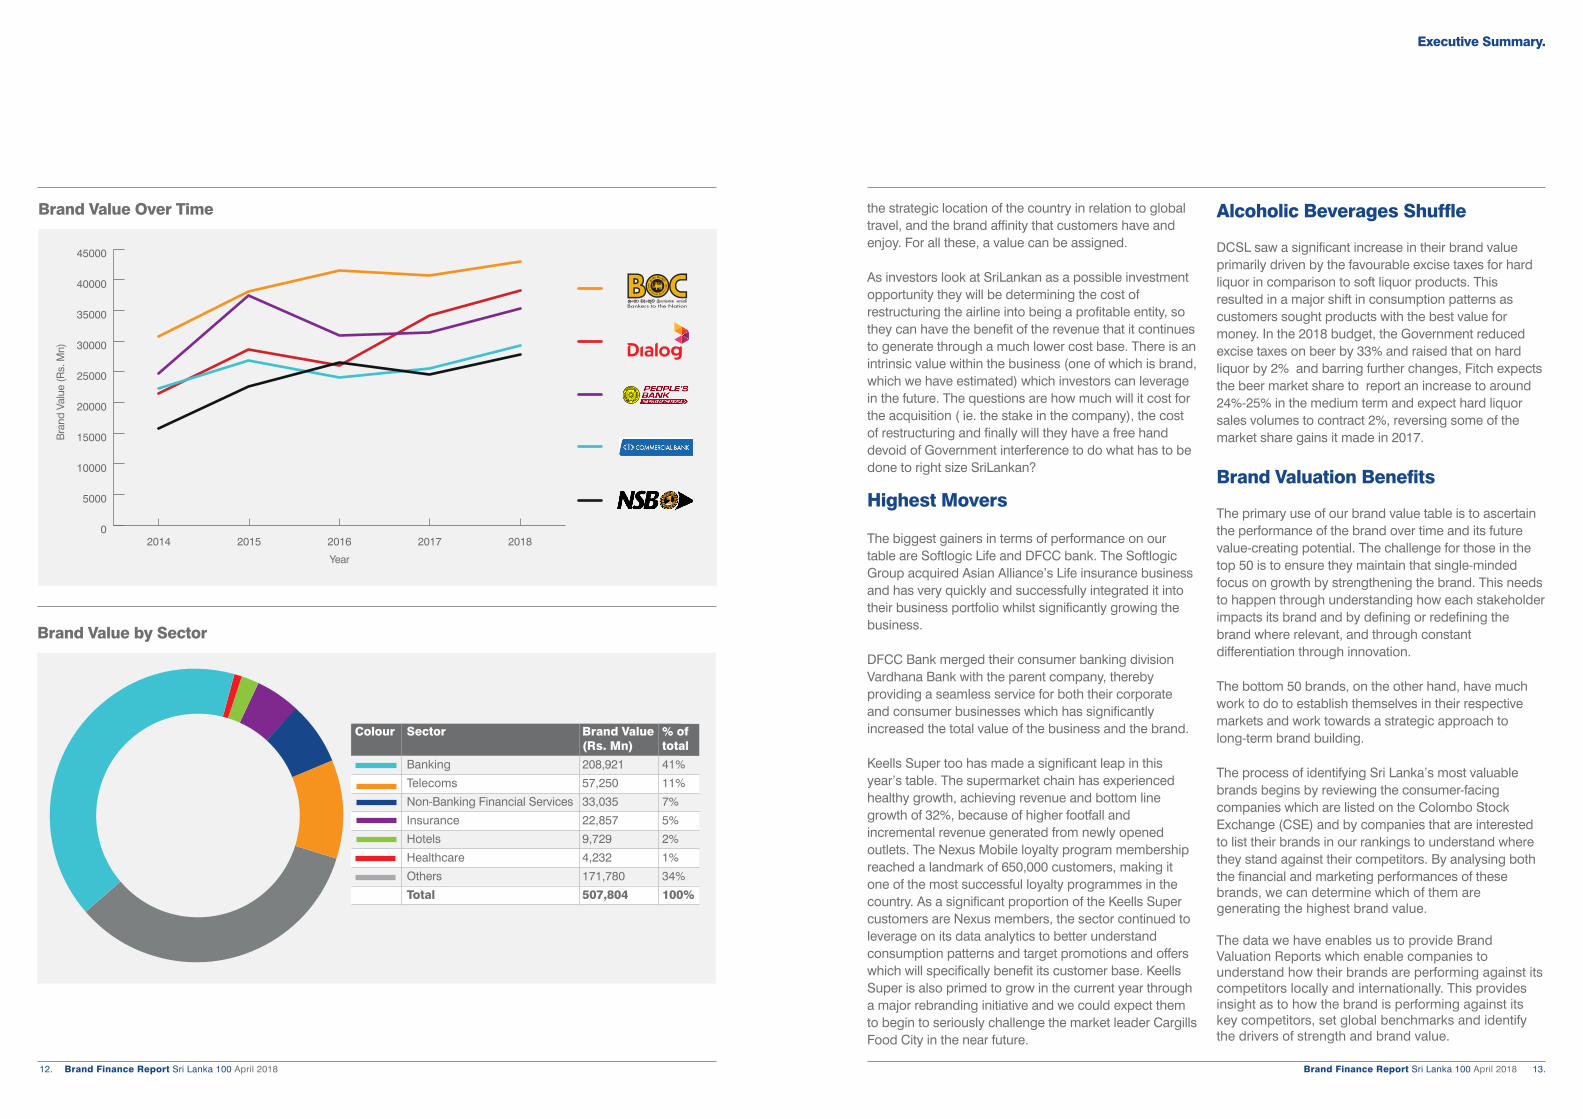
Brand Value Over Time
Bra
nd V
alue
(Rs.
Mn)
Year
0
5000
10000
15000
20000
25000
30000
35000
40000
45000
20182017201620152014
Brand Value by Sector
Colour Sector Brand Value % of (Rs. Mn) total
Banking 208,921 41%
Telecoms 57,250 11%
Non-Banking Financial Services 33,035 7%
Insurance 22,857 5%
Hotels 9,729 2%
Healthcare 4,232 1%
Others 171,780 34%
Total 507,804 100%
Brand Finance Report Sri Lanka 100 April 2018 15.Brand Finance Report Sri Lanka 100 April 2018 14.
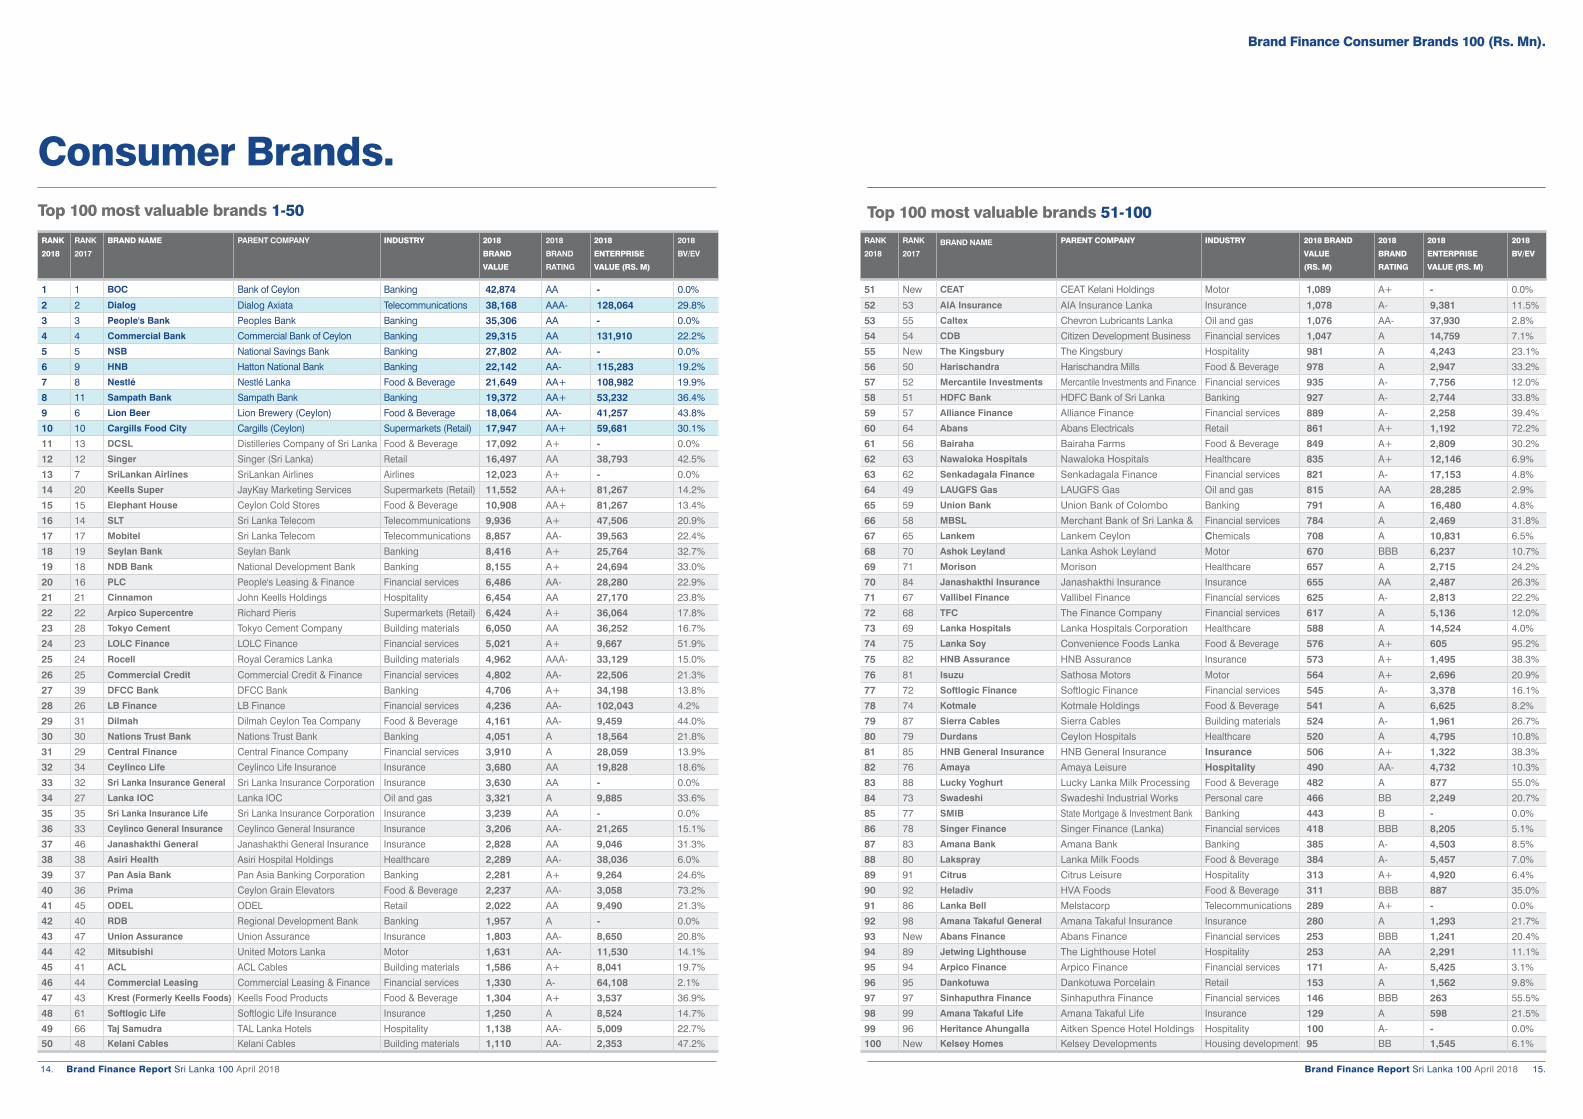
Consumer Brands.Top 100 most valuable brands 1-50
RANK
2018
RANK
2017
BRAND NAME PARENT COMPANY INDUSTRY 2018
BRAND
VALUE
2018
BRAND
RATING
2018
ENTERPRISE
VALUE (RS. M)
2018
BV/EV
1 1 BOC Bank of Ceylon Banking 42,874 AA - 0.0%
2 2 Dialog Dialog Axiata Telecommunications 38,168 AAA- 128,064 29.8%
3 3 People's Bank Peoples Bank Banking 35,306 AA - 0.0%
4 4 Commercial Bank Commercial Bank of Ceylon Banking 29,315 AA 131,910 22.2%
5 5 NSB National Savings Bank Banking 27,802 AA- - 0.0%
6 9 HNB Hatton National Bank Banking 22,142 AA- 115,283 19.2%
7 8 Nestlé Nestlé Lanka Food & Beverage 21,649 AA+ 108,982 19.9%
8 11 Sampath Bank Sampath Bank Banking 19,372 AA+ 53,232 36.4%
9 6 Lion Beer Lion Brewery (Ceylon) Food & Beverage 18,064 AA- 41,257 43.8%
10 10 Cargills Food City Cargills (Ceylon) Supermarkets (Retail) 17,947 AA+ 59,681 30.1%
11 13 DCSL Distilleries Company of Sri Lanka Food & Beverage 17,092 A+ - 0.0%
12 12 Singer Singer (Sri Lanka) Retail 16,497 AA 38,793 42.5%
13 7 SriLankan Airlines SriLankan Airlines Airlines 12,023 A+ - 0.0%
14 20 Keells Super JayKay Marketing Services Supermarkets (Retail) 11,552 AA+ 81,267 14.2%
15 15 Elephant House Ceylon Cold Stores Food & Beverage 10,908 AA+ 81,267 13.4%
16 14 SLT Sri Lanka Telecom Telecommunications 9,936 A+ 47,506 20.9%
17 17 Mobitel Sri Lanka Telecom Telecommunications 8,857 AA- 39,563 22.4%
18 19 Seylan Bank Seylan Bank Banking 8,416 A+ 25,764 32.7%
19 18 NDB Bank National Development Bank Banking 8,155 A+ 24,694 33.0%
20 16 PLC People's Leasing & Finance Financial services 6,486 AA- 28,280 22.9%
21 21 Cinnamon John Keells Holdings Hospitality 6,454 AA 27,170 23.8%
22 22 Arpico Supercentre Richard Pieris Supermarkets (Retail) 6,424 A+ 36,064 17.8%
23 28 Tokyo Cement Tokyo Cement Company Building materials 6,050 AA 36,252 16.7%
24 23 LOLC Finance LOLC Finance Financial services 5,021 A+ 9,667 51.9%
25 24 Rocell Royal Ceramics Lanka Building materials 4,962 AAA- 33,129 15.0%
26 25 Commercial Credit Commercial Credit & Finance Financial services 4,802 AA- 22,506 21.3%
27 39 DFCC Bank DFCC Bank Banking 4,706 A+ 34,198 13.8%
28 26 LB Finance LB Finance Financial services 4,236 AA- 102,043 4.2%
29 31 Dilmah Dilmah Ceylon Tea Company Food & Beverage 4,161 AA- 9,459 44.0%
30 30 Nations Trust Bank Nations Trust Bank Banking 4,051 A 18,564 21.8%
31 29 Central Finance Central Finance Company Financial services 3,910 A 28,059 13.9%
32 34 Ceylinco Life Ceylinco Life Insurance Insurance 3,680 AA 19,828 18.6%
33 32 Sri Lanka Insurance General Sri Lanka Insurance Corporation Insurance 3,630 AA - 0.0%
34 27 Lanka IOC Lanka IOC Oil and gas 3,321 A 9,885 33.6%
35 35 Sri Lanka Insurance Life Sri Lanka Insurance Corporation Insurance 3,239 AA - 0.0%
36 33 Ceylinco General Insurance Ceylinco General Insurance Insurance 3,206 AA- 21,265 15.1%
37 46 Janashakthi General Janashakthi General Insurance Insurance 2,828 AA 9,046 31.3%
38 38 Asiri Health Asiri Hospital Holdings Healthcare 2,289 AA- 38,036 6.0%
39 37 Pan Asia Bank Pan Asia Banking Corporation Banking 2,281 A+ 9,264 24.6%
40 36 Prima Ceylon Grain Elevators Food & Beverage 2,237 AA- 3,058 73.2%
41 45 ODEL ODEL Retail 2,022 AA 9,490 21.3%
42 40 RDB Regional Development Bank Banking 1,957 A - 0.0%
43 47 Union Assurance Union Assurance Insurance 1,803 AA- 8,650 20.8%
44 42 Mitsubishi United Motors Lanka Motor 1,631 AA- 11,530 14.1%
45 41 ACL ACL Cables Building materials 1,586 A+ 8,041 19.7%
46 44 Commercial Leasing Commercial Leasing & Finance Financial services 1,330 A- 64,108 2.1%
47 43 Krest (Formerly Keells Foods) Keells Food Products Food & Beverage 1,304 A+ 3,537 36.9%
48 61 Softlogic Life Softlogic Life Insurance Insurance 1,250 A 8,524 14.7%
49 66 Taj Samudra TAL Lanka Hotels Hospitality 1,138 AA- 5,009 22.7%50 48 Kelani Cables Kelani Cables Building materials 1,110 AA- 2,353 47.2%
Top 100 most valuable brands 51-100
Brand Finance Consumer Brands 100 (Rs. Mn).
RANK
2018
RANK
2017BRAND NAME PARENT COMPANY INDUSTRY 2018 BRAND
VALUE
(RS. M)
2018
BRAND
RATING
2018
ENTERPRISE
VALUE (RS. M)
2018
BV/EV
51 New CEAT CEAT Kelani Holdings Motor 1,089 A+ - 0.0%
52 53 AIA Insurance AIA Insurance Lanka Insurance 1,078 A- 9,381 11.5%
53 55 Caltex Chevron Lubricants Lanka Oil and gas 1,076 AA- 37,930 2.8%
54 54 CDB Citizen Development Business Financial services 1,047 A 14,759 7.1%
55 New The Kingsbury The Kingsbury Hospitality 981 A 4,243 23.1%
56 50 Harischandra Harischandra Mills Food & Beverage 978 A 2,947 33.2%
57 52 Mercantile Investments Mercantile Investments and Finance Financial services 935 A- 7,756 12.0%
58 51 HDFC Bank HDFC Bank of Sri Lanka Banking 927 A- 2,744 33.8%
59 57 Alliance Finance Alliance Finance Financial services 889 A- 2,258 39.4%
60 64 Abans Abans Electricals Retail 861 A+ 1,192 72.2%
61 56 Bairaha Bairaha Farms Food & Beverage 849 A+ 2,809 30.2%
62 63 Nawaloka Hospitals Nawaloka Hospitals Healthcare 835 A+ 12,146 6.9%
63 62 Senkadagala Finance Senkadagala Finance Financial services 821 A- 17,153 4.8%
64 49 LAUGFS Gas LAUGFS Gas Oil and gas 815 AA 28,285 2.9%
65 59 Union Bank Union Bank of Colombo Banking 791 A 16,480 4.8%
66 58 MBSL Merchant Bank of Sri Lanka & Financial services 784 A 2,469 31.8%
67 65 Lankem Lankem Ceylon Chemicals 708 A 10,831 6.5%
68 70 Ashok Leyland Lanka Ashok Leyland Motor 670 BBB 6,237 10.7%
69 71 Morison Morison Healthcare 657 A 2,715 24.2%
70 84 Janashakthi Insurance Janashakthi Insurance Insurance 655 AA 2,487 26.3%
71 67 Vallibel Finance Vallibel Finance Financial services 625 A- 2,813 22.2%
72 68 TFC The Finance Company Financial services 617 A 5,136 12.0%
73 69 Lanka Hospitals Lanka Hospitals Corporation Healthcare 588 A 14,524 4.0%
74 75 Lanka Soy Convenience Foods Lanka Food & Beverage 576 A+ 605 95.2%
75 82 HNB Assurance HNB Assurance Insurance 573 A+ 1,495 38.3%
76 81 Isuzu Sathosa Motors Motor 564 A+ 2,696 20.9%
77 72 Softlogic Finance Softlogic Finance Financial services 545 A- 3,378 16.1%
78 74 Kotmale Kotmale Holdings Food & Beverage 541 A 6,625 8.2%
79 87 Sierra Cables Sierra Cables Building materials 524 A- 1,961 26.7%
80 79 Durdans Ceylon Hospitals Healthcare 520 A 4,795 10.8%
81 85 HNB General Insurance HNB General Insurance Insurance 506 A+ 1,322 38.3%
82 76 Amaya Amaya Leisure Hospitality 490 AA- 4,732 10.3%
83 88 Lucky Yoghurt Lucky Lanka Milk Processing Food & Beverage 482 A 877 55.0%
84 73 Swadeshi Swadeshi Industrial Works Personal care 466 BB 2,249 20.7%
85 77 SMIB State Mortgage & Investment Bank Banking 443 B - 0.0%
86 78 Singer Finance Singer Finance (Lanka) Financial services 418 BBB 8,205 5.1%
87 83 Amana Bank Amana Bank Banking 385 A- 4,503 8.5%
88 80 Lakspray Lanka Milk Foods Food & Beverage 384 A- 5,457 7.0%
89 91 Citrus Citrus Leisure Hospitality 313 A+ 4,920 6.4%
90 92 Heladiv HVA Foods Food & Beverage 311 BBB 887 35.0%
91 86 Lanka Bell Melstacorp Telecommunications 289 A+ - 0.0%
92 98 Amana Takaful General Amana Takaful Insurance Insurance 280 A 1,293 21.7%
93 New Abans Finance Abans Finance Financial services 253 BBB 1,241 20.4%
94 89 Jetwing Lighthouse The Lighthouse Hotel Hospitality 253 AA 2,291 11.1%
95 94 Arpico Finance Arpico Finance Financial services 171 A- 5,425 3.1%
96 95 Dankotuwa Dankotuwa Porcelain Retail 153 A 1,562 9.8%
97 97 Sinhaputhra Finance Sinhaputhra Finance Financial services 146 BBB 263 55.5%
98 99 Amana Takaful Life Amana Takaful Life Insurance 129 A 598 21.5%
99 96 Heritance Ahungalla Aitken Spence Hotel Holdings Hospitality 100 A- - 0.0%100 New Kelsey Homes Kelsey Developments Housing development 95 BB 1,545 6.1%
Brand Finance Report Sri Lanka 100 April 2018 16. Brand Finance Report Sri Lanka 100 April 2018 17.
What is a Brand Value Report?
Brand Valuation Summary
+ Internal understanding of brand+ Brand value tracking+ Competitor benchmarking+ Historical brand value
Brand Strength Index
+ Brand strength tracking+ Brand strength analysis+ Management KPIs+ Competitor benchmarking
Royalty Rates
+ Transfer pricing+ Licensing/franchising negotiation+ International licensing+ Competitor benchmarking
Cost of Capital
+ Independent view of cost of capital for internal valuations and project appraisal exercises
Customer Research
+ Utilities + Insurance+ Banks+ Telecoms
For more information regarding our Brand Value Reports, please contact:
Ruchi GunewardeneManaging Director [email protected]
Mobile Phone : + 94 777 32 32 23Office Phone : + 94 114 94 16 70
18/185A – 1/1A M E D Dabare Mawatha, Colombo 5
What are the benefits of a Brand Value Report?
Insight
Provide insight as to how the brand is performing vs. key competitors on underlying measures and drivers of brand value and brand strength.
Strategy
Understand where brand value is being generated by region and channel in order to identify areas of opportunity that warrant further investigation.
Benchmarking
Track year-on-year changes to brand value and set long-term objectives against which high-level brand performance can be benchmarked.
Education
Provide a platform of understanding which the company can use to educate employees on the importance of the brand.
Communication
Communicate your brand’s success to shareholders, customers, and other strategically selected audiences.
Understanding
Understand and appreciate the value of your brand as an asset of the business.
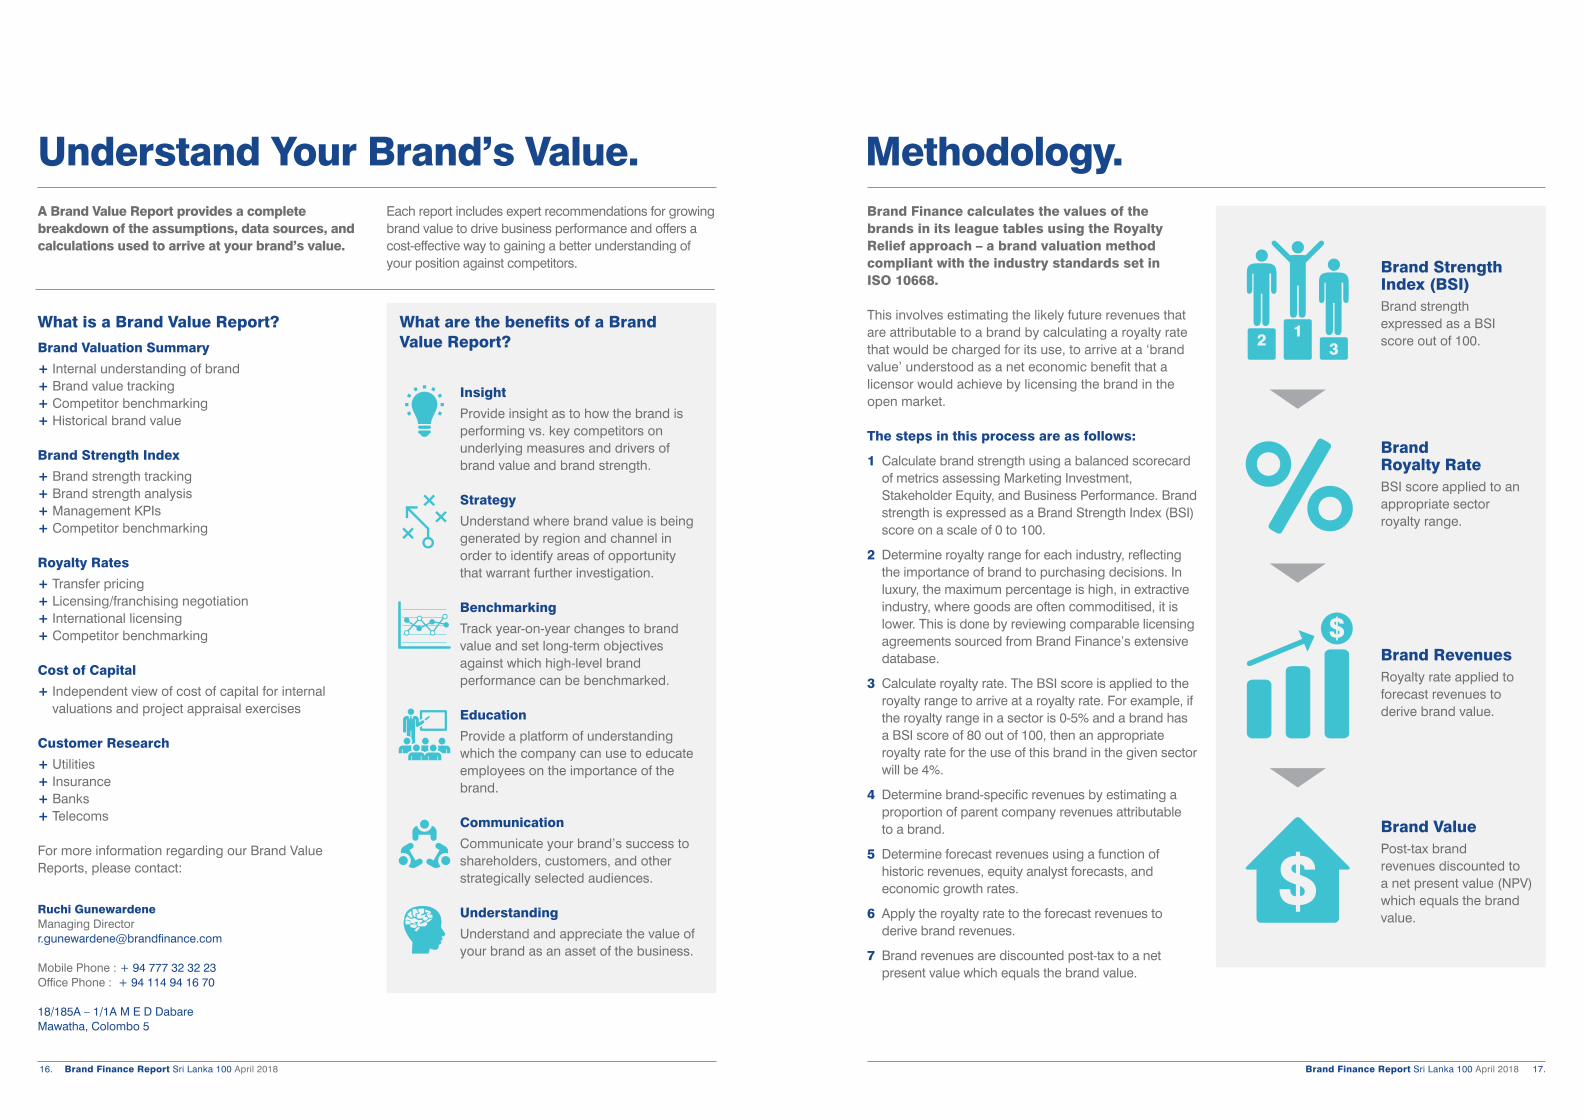
A Brand Value Report provides a complete breakdown of the assumptions, data sources, and calculations used to arrive at your brand’s value.
Each report includes expert recommendations for growing brand value to drive business performance and offers a cost-effective way to gaining a better understanding of your position against competitors.
Understand Your Brand’s Value. Methodology. Brand Finance calculates the values of the brands in its league tables using the Royalty Relief approach – a brand valuation method compliant with the industry standards set in ISO 10668.
This involves estimating the likely future revenues that are attributable to a brand by calculating a royalty rate that would be charged for its use, to arrive at a ‘brand value’ understood as a net economic benefit that a licensor would achieve by licensing the brand in the open market.
The steps in this process are as follows:
1 Calculate brand strength using a balanced scorecard of metrics assessing Marketing Investment, Stakeholder Equity, and Business Performance. Brand strength is expressed as a Brand Strength Index (BSI) score on a scale of 0 to 100.
2 Determine royalty range for each industry, reflecting the importance of brand to purchasing decisions. In luxury, the maximum percentage is high, in extractive industry, where goods are often commoditised, it is lower. This is done by reviewing comparable licensing agreements sourced from Brand Finance’s extensive database.
3 Calculate royalty rate. The BSI score is applied to the royalty range to arrive at a royalty rate. For example, if the royalty range in a sector is 0-5% and a brand has a BSI score of 80 out of 100, then an appropriate royalty rate for the use of this brand in the given sector will be 4%.
4 Determine brand-specific revenues by estimating a proportion of parent company revenues attributable to a brand.
5 Determine forecast revenues using a function of historic revenues, equity analyst forecasts, and economic growth rates.
6 Apply the royalty rate to the forecast revenues to derive brand revenues.
7 Brand revenues are discounted post-tax to a net present value which equals the brand value.
Brand Strength Index (BSI)Brand strengthexpressed as a BSIscore out of 100.
Brand Royalty RateBSI score applied to anappropriate sectorroyalty range.
Brand RevenuesRoyalty rate applied toforecast revenues toderive brand value.
Brand ValuePost-tax brandrevenues discounted to a net present value (NPV)which equals the brand value.
Brand Finance Report Sri Lanka 100 April 2018 18. Brand Finance Report Sri Lanka 100 April 2018 19.
+ Branded business valuations for the purpose of scenario analysis to evaluate strategic marketing options, which have enabled brands to determine the optimum route forward through greater efficiencies in resource allocation.
+ Building brand dashboards for performance tracking and monitoring purposes for Board and management meetings, which when used in conjunction with financial performance can be useful measures of management performance and accountability.
+ Brand valuations to reallocate the brand assets to other entities for business and marketing efficiencies.
+ Brand valuations for the purpose of setting up special purpose vehicles or entities (SPV/SPE) ensuring better brand management and marketing and budgeting efficiencies.
+ Brand valuations for the purpose of informing current shareholders and potential shareholders of the possible uplift in value that the brand can contribute to the business.
+ Strategic marketing analysis to explore and agree on brand positioning options in a competitive context to define the brand, leading to greater focus across future investments.
+ Through a clear and concise definition of the brand, enable long term strategic planning to ensure budget efficiencies and management accountability.
+ Internalizing the brand beliefs through relevant employee related initiatives to be able to optimize the brand experience for the customer.
+ Revamping the brand identity and design system to align the brand with the brand position so as to maximize the benefit of this valuable asset.
+ Brand league report (from the league table) so management understands the current standing and competitive threats to be able to take proactive action and also to be a source of information for future planning purposes.
+ Brand valuations for the purpose of negotiation and transaction purposes during the sale and acquisition of the business.
+ Brand valuations for post acquisition impairment purposes and balance sheet reporting.
+ Fact based market analysis to identify strategic brand entry options to maximize the chances of success and to ensure better utilization of resources.
+ Customer profiling and market segmentation to optimize the marketing strategies saving costs to the business.
Our Services in Sri Lanka.Our Clients.
e l q b i p = C = o b p l o qp
Brand Finance Report Sri Lanka 100 April 2018 20.
Our People.
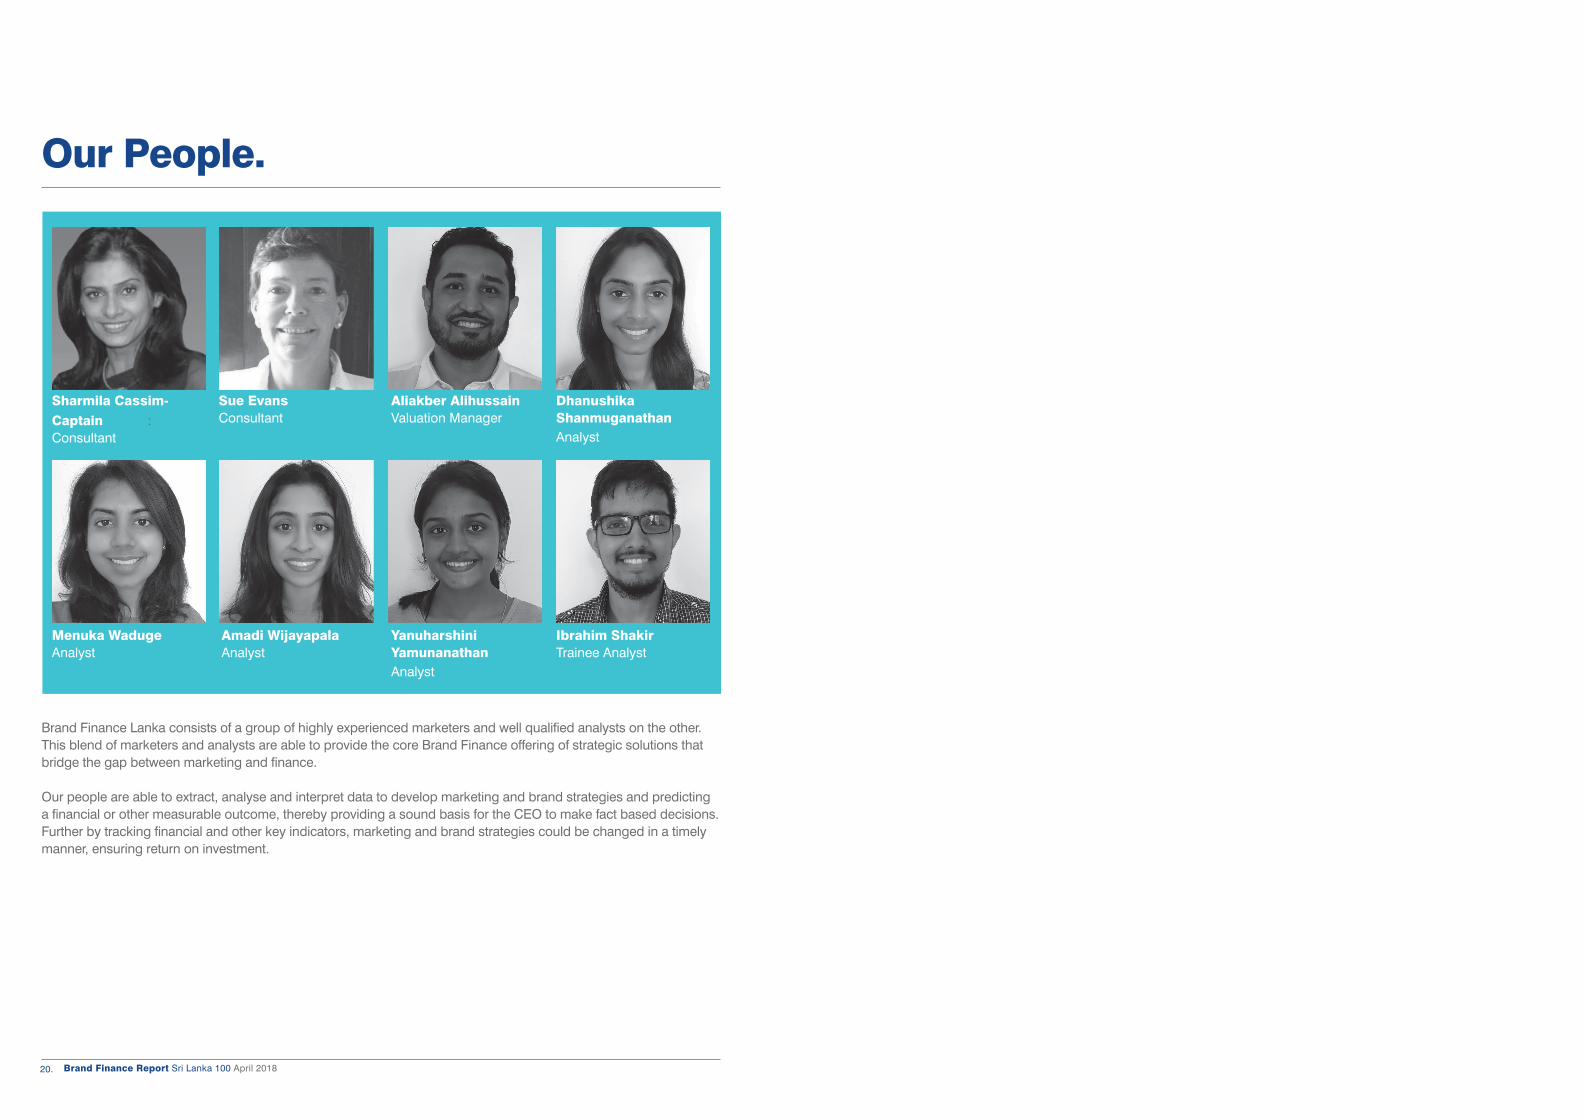
Brand Finance Lanka consists of a group of highly experienced marketers and well qualified analysts on the other. This blend of marketers and analysts are able to provide the core Brand Finance offering of strategic solutions that bridge the gap between marketing and finance.
Our people are able to extract, analyse and interpret data to develop marketing and brand strategies and predicting a financial or other measurable outcome, thereby providing a sound basis for the CEO to make fact based decisions. Further by tracking financial and other key indicators, marketing and brand strategies could be changed in a timely manner, ensuring return on investment.
Sharmila Cassim-Captain : Consultant
Dhanushika ShanmuganathanAnalyst
Sue Evans Consultant
Ibrahim Shakir Trainee Analyst
Amadi Wijayapala Analyst
Yanuharshini YamunanathanAnalyst
Aliakber Alihussain Valuation Manager
Menuka Waduge Analyst
Contact us.
The World’s Leading Independent Brand Valuation and Strategy ConsultancyT: + 94 114 94 16 70E: [email protected] www.brandfinance.com