SRC DOCUMENT 2 ATM CONTRIBUTION TO AIRCRAFT … · SRC Document 2 – ATM Contribution to Aircraft...
71
EUROPEAN ORGANISATION FOR THE SAFETY OF AIR NAVIGATION E U R O C O N T R O L SAFETY REGULATION COMMISSION SAFETY REGULATION COMMISSION DOCUMENT (SRC DOC) SRC DOCUMENT 2 ATM CONTRIBUTION TO AIRCRAFT ACCIDENTS / INCIDENTS Review and Analysis of Historical Data Edition : 4.0 Edition Date : 31 May 2005 Status : Released Issue Distribution : General Public Category : SRC Document
Transcript of SRC DOCUMENT 2 ATM CONTRIBUTION TO AIRCRAFT … · SRC Document 2 – ATM Contribution to Aircraft...

EUROPEAN ORGANISATION FOR THE SAFETY OF AIR NAVIGATION
EUROCONTROL
SAFETY REGULATION COMMISSION
SAFETY REGULATION COMMISSION DOCUMENT (SRC DOC)
SRC DOCUMENT 2
ATM CONTRIBUTION TO AIRCRAFT ACCIDENTS / INCIDENTS
Review and Analysis of Historical Data
Edition : 4.0Edition Date : 31 May 2005Status : Released IssueDistribution : General PublicCategory : SRC Document
SRC Document 2 – ATM Contribution to Aircraft Accidents / Incidents – Review and Analysis of Historical Data
Edition 4.0 Released Issue Page 2 of 71
F.2 DOCUMENT CHARACTERISTICS
TITLE
SRC Document 2 ATM Contribution to Aircraft Accidents / Incidents
Review and Analysis of Historical Data Document Identifier : Reference : SRC DOC 2
srcdoc2_e40_ri_web Edition Number : 4.0
Edition Date : 31-05-2005
Abstract :
The SRU has carried out a study to provide the SRC with an overview of the ATM-related safety data which exist across the aviation industry. The SRC does not however consider that all the existing safety data is true, complete or accurate and does not take responsibility for the results of studies carried out by third parties. The report only provides a review of identified levels of safety being achieved worldwide and in the ECAC region, as well as the number and categories of identified ATM contributions to aircraft accidents and incidents that have occurred in the European Civil Aviation Conference (ECAC) region in the last twenty years.
Keywords :
Safety Regulation Factor Taxonomy
Accident Cause ECAC
Incident ATM Contribution Worldwide
AIRPROX CFIT
Contact Person(s) : Tel : Unit :
Bogdan BRAGUTA +32 2 729 91 67 DGOF/SRU
DOCUMENT STATUS AND TYPE
Status : Distribution : Category : Working Draft General Public Safety Regulatory Requirement
Draft Issue Restricted EUROCONTROL Requirement Application Document
Proposed Issue Restricted SRC ESARR Advisory Material
Released Issue Restricted SRC Commissioners SRC Policy Document
Restricted SPG SRC Document
Restricted SRU Comment / Response Document
SOFTCOPIES OF SRC DELIVERABLES CAN BE DOWNLOADED FROM :
www.eurocontrol.int/src
SRC Document 2 – ATM Contribution to Aircraft Accidents / Incidents – Review and Analysis of Historical Data
Edition 4.0 Released Issue Page 3 of 71
F.3 DOCUMENT APPROVAL
The following table identifies all management authorities who have approved this document.
AUTHORITY NAME AND SIGNATURE DATE
Quality Control (SRU)
signed by Daniel Hartin
(Daniel HARTIN)
31-May-05
Head Safety Regulation Unit
(SRU)
signed by Peter Stastny
(Peter STASTNY)
31-May-05
Chairman Safety Regulation
Commission (SRC)
signed by Ron Elder
(Ron ELDER)
31-May-05
Note: For security reasons and to reduce the size of files placed on our website, this document does not contain signatures. However, all management authorities have signed the master copy of this document which is held by the SRU. Requests for copies of this document should be e-mailed to: [email protected].
(Space Left Intentionally Blank)
SRC Document 2 – ATM Contribution to Aircraft Accidents / Incidents – Review and Analysis of Historical Data
Edition 4.0 Released Issue Page 4 of 71
F.4 DOCUMENT CHANGE RECORD
The following table records the complete history of this document.
EDITION NUMBER
EDITION DATE REASON FOR CHANGE PAGES
AFFECTED
0.01 10-Nov-99 Working Draft Issue-Creation. All
0.02 25-Nov-99 Draft Issue incorporating SRU comments. Circulated to SRC for comments. All
0.03 21-Dec-99 Inclusion of editorial amendments. All
0.04 12-Oct-00
Draft Issue incorporating 1999 data as well as new information on identified ATM-related key risk areas and related safety recommendations. Submitted to SRC for comments. Submitted to EATMP SAF/SISG for its members to provide de-identified national data (known ATM-related key risk areas and related safety recommendations).
All
1.0 26-Feb-01 Released Issue addressing SRC Comments.
Executive Summary, Sections
2.1.1, 2.3.2, 3.3.2.1
1.1 10-Sep-01
Proposed Issue incorporating 2000 data as well as information on accidents/incidents from NLR and WARWICK database. SRU comments are also incorporated in the new edition.
All
2.0 19-Oct-01 Released Issue following approval at SRC12. Contents of document not modified.
All
2.1 10-Sep-02 Proposed issue incorporating 2001 data. All
3.0 12-Dec-02
Following request for comments (RFC 0239) document updated to ‘Released following SRC approval by correspondence. Additional changes to document layout (contents unchanged from version 2.1).
All
3.01 27-Dec-04 Proposed issue incorporating 2002 and 2003 data. Review of document contents and SRU quality check.
All
SRC Document 2 – ATM Contribution to Aircraft Accidents / Incidents – Review and Analysis of Historical Data
Edition 4.0 Released Issue Page 5 of 71
EDITION NUMBER
EDITION DATE REASON FOR CHANGE PAGES
AFFECTED
3.1 10-Mar-05 Document status amended to ‘Proposed Issue’ and sent to SRC for formal consultation/approval.
All
4.0 31-May-05 Document released following formal SRC consultation and approval (RFC No. 0505). All
(Space Left Intentionally Blank)

SRC Document 2 – ATM Contribution to Aircraft Accidents / Incidents – Review and Analysis of Historical Data
Edition 4.0 Released Issue Page 6 of 71
F.5 CONTENTS
Section Title Page
FOREWORD
F.1 Title Page ………………………………………………………………………. 1
F.2 Document Characteristics ………………………………………………….. 2
F.3 Document Approval ………………………………………………………….. 3
F.4 Document Change Record ………………………………………………….. 4
F.5 Contents ……………………………………………………………………….. 6
F.6 Executive Summary ………………………………………………………….. 8
CONTENTS
1. Introduction ……………………………………………………………………. 10
2. Collection and Assessment of Existing Documentation ……………… 2.1 Collection of Existing Reports ………………………………………………………….. 2.1.1 Method Used to Collect Material ………………………………………………….. 2.1.2 Method Used to Select the Relevant Documents ……………………………….. 2.2 Assessment of Public or Available Databases ………………………………………. 2.2.1 Scope/Characteristics of Available Databases ………………………………….. 2.2.2 Selection of Databases …………………………………………………………….. 2.2.3 Limitations of the Data Available ………………………………………………….. 2.3 Data Collection by EUROCONTROL ……………………………………………………. 2.3.1 Monitoring of Safety Levels ………………………………………………………… 2.3.2 Key Risk Areas and Data for Safety Cases ………………………………………
11 11 11 12 13 13 15 15 15 15 16
3. Statistical Results ……………………………………………………………. 3.1 Accident Statistics Worldwide and Within the ECAC Region ……………………... 3.1.1 Fatal Accidents Study Based on the WAAS ……………………………………... 3.1.2 ICAO ADREP Database ……………………………………………………………. 3.1.3 Aviation Safety Data ………………………………………………………………… 3.1.4 NLR Accident Database ……………………………………………………………. 3.1.5 Accident Data Collected by EUROCONTROL …………………………………… 3.1.6 Comparison of Available Sources …………………………………………………. 3.2 Incident Statistics …………………………………………………………………………. 3.2.1 ICAO ADREP ………………………………………………………………………... 3.2.2 IATA Incident Database ……………………………...…………………………….. 3.2.3 Incident Data Collected by EUROCONTROL ……………………………………. 3.2.4 Comparison of Available Sources …………………………………………………. 3.3 ATM Contribution to Past Accidents …………………………………………………… 3.3.1 Boeing Analysis ……………………………………………………………………... 3.3.2 UK CAA Analysis ……………………………………………………………………. 3.3.3 Flight Safety Foundation Analysis ………………………………………………… 3.3.4 Flight Safety Foundation and NLR Analysis ……………………………………... 3.3.5 IATA Analysis ………………………………………………………………………... 3.3.6 Establishment of Risk Ratios ……………………………………….……………... 3.4 ATM Contribution to Incidents ………………………………...………………………... 3.4.1 ECAC States Analysis ……………………………...………………………………. 3.4.2 IATA AIRPROX Report Analysis …………………………………………………..
17 17 17 19 22 24 27 29 30 30 32 33 37 37 37 38 41 42 42 43 44 44 46
SRC Document 2 – ATM Contribution to Aircraft Accidents / Incidents – Review and Analysis of Historical Data
Edition 4.0 Released Issue Page 7 of 71
Section Title Page
4. Main Causes Identified ………………………………………………………. 4.1 Accidents ……………………………………………………………………………………. 4.1.1 Through UK CAA and FSF Studies ……………………………………………….. 4.1.2 Through the JSSI Study ……………………………………………………………. 4.1.3 Through the ICAO Aircraft Accident Digest ………………………………………. 4.1.4 Aviation Safety Net ………………………………………………………………….. 4.1.5 Warwick Database ………………………………………………………………….. 4.1.6 NLR Analysis (from NLR Technical paper 2003-376) …………………………... 4.2 Incidents …………………………………………………………………………………….. 4.3 Drawing-up of Lists of ATM Causal Factors ….……………………………………….
47 47 47 49 50 53 56 56 58 58
5. Safety Recommendations / Remedial Actions ..………………………… 62
6. Conclusions ……………………………………………………………………. 63
APPENDICIES
Appendix 1 – List of Acronyms ………………………………………………………….. 66
Appendix 2 – Terms and Definitions …………………………………………………… 68
Appendix 3 – Scope of Sample Analysis ………………………………………………. 70
(Space Left Intentionally Blank)
SRC Document 2 – ATM Contribution to Aircraft Accidents / Incidents – Review and Analysis of Historical Data
Edition 4.0 Released Issue Page 8 of 71
F.6 EXECUTIVE SUMMARY
The Safety Regulation Commission (SRC) was established in 1998 and has since identified a number of priority tasks to be undertaken. Two of these are the “development of safety indicators” and the “identification of key risk areas where ATM has the potential to improve safety”.
The Safety Regulation Unit (SRU) carried out this study to provide the SRC with an overview of the type and contents of the ATM-related safety data which exists today across the aviation industry. The SRC does not however consider that all the existing safety data is necessarily true, complete or accurate and does not take responsibility for the results of the studies carried out by third parties.
The report only intends to compile existing results produced so far with regard to the;
identified levels of ATM safety being achieved worldwide and in the ECAC region; and
number and categories of identified ATM contributions to aircraft accidents and incidents that have occurred in the ECAC region in the last twenty years.
The task involved reviewing existing studies from third parties, as well as collecting and analysing public data describing aircraft accidents and incidents. The task also involved collating specific national safety data to complement the outcome of the assessment of the safety data that had been made publicly available by third parties.
This report explains which public studies and databases were selected and sets out the results of the review. It does, however, only provide the results of the assessment of the national safety data in a dis-identified manner, as these are subject to confidentiality protection.
The limitations of the study results must be stressed, as the information identified does not cover all categories of safety occurrences seen as necessary to determine reliable safety indicators for ATM. Indeed, due to a lack of reports in specific areas, not all categories of occurrences have been reported and analysed. For example, ‘AIRPROX’ is the most frequently identified and analysed incident, whereas information concerning ‘near CFIT’ or ‘runway incursions’, is often unavailable, let alone other events such as ‘violations of rules and procedures’, ‘inadequate procedures/airspace design’ or ‘human factor related occurrences’.
Comparison between sources of information is also not always relevant, as the collection of data has been based on different samples and criteria in terms of the type of occurrences or type of aircraft involved. In addition, the classification system, or taxonomy, used to analyse, categorise and describe the causes of such occurrences varies from one source to the next, thus preventing merging of data or meaningful comparison of statistical analysis.
This study demonstrates the limitations of existing reporting and investigation systems in ATM in Europe and has provided rationale for the development of the EUROCONTROL Safety Measurement and Improvement Programme, approved in November 1999. This programme, together with complementary safety activities such as the field of human factors, are often carried out in co-operation with other international bodies such as ICAO and JAA.

SRC Document 2 – ATM Contribution to Aircraft Accidents / Incidents – Review and Analysis of Historical Data
Edition 4.0 Released Issue Page 9 of 71
In order to more accurately assess the extent to which, and how, ATM may be contributing to accidents and incidents in aviation, and in order to develop more reliable safety indicators in ATM, new samples of accidents, incidents and other types of safety occurrences must be considered, based on harmonised reporting schemes in Europe. It is intended that safety trends, key risk areas and ATM-related safety occurrences be more consistently identified, when the EUROCONTROL Safety Regulatory Requirement ‘Reporting and Assessment of Safety Occurrences in ATM’’ (ESSAR 2) with related Agency standards and guidance material are consistently implemented across the ECAC region.
(Space Left Intentionally Blank)
SRC Document 2 – ATM Contribution to Aircraft Accidents / Incidents – Review and Analysis of Historical Data
Edition 4.0 Released Issue Page 10 of 71
1. INTRODUCTION
The SRC was set up to harmonise ATM safety regulations within Europe with the aim of maintaining, and where possible improving, safety standards. In order to develop safety improvements, strategies and regulations, the SRC needs to establish the current risks posed by ATM in the ECAC region. The SRU carried out this study with the objective of providing the SRC with an overview of the ATM related safety data, which currently exist, as produced by third parties. The SRC does not however take responsibility for the results provided by other parties. The report therefore only intends to compile existing results produced so far by third parties with regard to the;
identified levels of ATM safety being achieved worldwide and in the ECAC region; and
number and categories of identified ATM contributions to aircraft accidents and incidents that have occurred in the ECAC region in the last twenty years.
It also includes in a dis-identified form, the main results of the SRC surveys carried out since 1999, which confirm the limitations of existing ATM national reporting systems in Europe and the need for significant enhancement and harmonisation in this area across ECAC. The study was carried out using contractual work managed by SRU. This contractual work consisted of the;
review of existing studies carried out in the ECAC region; collection and analysis of public data describing aircraft accidents, incidents
and other safety related occurrences which have occurred during the last twenty years in Europe;
collection and analysis of new public data and update of previous public data describing aircraft accidents, incidents and other safety related occurrences which have occurred during the last twenty years in Europe.
The approach adopted was to identify and collect public information in order to develop, based on those specific sources, an indication of the identified safety levels in the European ATM system, and a classification of ATM identified contributions to aircraft accidents, incidents and other occurrences over the last twenty years. In so doing, it was intended to avoid any repetition of work previously done. More precisely, the focus was on the main causal1 and circumstantial2 ATM factors in aircraft accidents and incidents3 over the last twenty years, with associated identified proposed remedial actions, safety recommendations and safety interventions. Preliminary results of this study have been used in the development of the SRC input to the Performance Review Commission Reports, PRR1 and PRR3. The main outcome of this study have also demonstrated the limitations of existing safety data in ATM, hence of existing reporting and investigation systems in ATM across Europe. This report provided some key rationale for the development of the EUROCONTROL Safety Measurement and Improvement Programme, the initial measures of which were approved in November 1999.
1 Or Direct (Refer to ESARR 2), depending on specific definitions used by States and Organisations. 2 Or Indirect (Refer to ESARR 2), depending on specific definitions used by States and Organisations. 3 Previous work indeed did not consider other type of safety information, such as those related to human factors.

SRC Document 2 – ATM Contribution to Aircraft Accidents / Incidents – Review and Analysis of Historical Data
Edition 4.0 Released Issue Page 11 of 71
2. COLLECTION AND ASSESSMENT OF EXISTING DOCUMENTATION
2.1 Collection of Existing Reports 2.1.1 Method Used to Collect Material
Existing studies were selected using two methods: by questioning specialists or by interrogating specialised databases.
Several European or worldwide organisations dealing with aviation safety were considered as the basis for document investigation: EUROCONTROL, ECACT, Commission of the European UnionT, International Civil Aviation Organisation (ICAO), Joint Aviation Authorities (JAA), Federal Aviation Administration (FAA), Flight Safety Foundation, International Air Transport Association (IATA), Airbus IndustryT and Boeing. They were contacted by telephone or e-mail. National ATM regulators were contacted via the EUROCONTROL SRU to contribute to the drawing-up of a list of references. Private organisations such as Airclaims or professional bodies such as the International Federation of AirLine Pilot(s) Association (IFALPA) or International Federation of Air Traffic Controller Association (IFATCA) were also of interest.
Research was also conducted via the World-Wide-Web, which gives access to numerous bibliographical databases. The above organisations' sites were interrogated, together with private databases that collect theses, studies and conference proceedings, that manage these documents and that are able to provide them by e-mail or post.
The bibliographical sources interrogated include: BLAISE (United Kingdom), PASCAL (France), El COMPENDEX, the NATIONAL TECHNICAL INFORMATION SERVICE (United States), TRANSPORTATION RESEARCH (United States), DISSERTATION ABSTRACT, CONFERENCE PAPERS INDEX, APPLIED SCIENCE TECHNOLOGY INDEX, BOOK REVIEW DIGEST, BOOKS IN PRINT, CELEX (European Commission), and SPEARHEAD. All these services take either national or international sources into account.
The most frequently used keywords for this specific research were "aviation safety and ATC or ATM", as use of the words "accidents and ATC or ATM" automatically led to the establishment of a list of documents describing specific accidents that had occurred, rather than a list of documents providing an analysis of ATM as a contributory factor. Further research was conducted with more specific keywords such as “AIRPROX”, “Airmiss”, “Accident Rate”, “Runway Incursion” or more general terms such as “Incidents”. The latter produced a few, already known, results, such as Annex 13 of ICAO Convention, and the UK CAA studies on AIRPROX.
Generally speaking, the research appears more productive if only the words "aviation safety" are retained rather than "aviation safety and ATC or ATM", which produces few results. Each time the database does not propose any document under "aviation safety and ATC", the research was expanded to include all documents concerning aviation safety. The detailed results of the research can be provided by SRU on request (Document Reference: Web-Study-SRC DOC-002).
T No reply was received from ECAC, European Commission and Airbus Industry.
SRC Document 2 – ATM Contribution to Aircraft Accidents / Incidents – Review and Analysis of Historical Data
Edition 4.0 Released Issue Page 12 of 71
2.1.2 Method Used to Select the Relevant Documents The method used for the selection of documents of interest was to keep only data and documents that contain issues relevant to one or more of the following fields;
good ECAC geographical coverage,
lengthy time spans,
exhaustiveness of data sources used to present conclusions,
including very good information on a type of fleet or causes,
interest established in ATM issues (illustrating more specifically the ATS problem, identifying a specific new causal factor, or drawing up a list of causal factors),
interest established in human factors issues.
Most of the selected studies have been summarised. The detailed summaries can be provided by SRU on request (Document Reference: Summaries-Study-SRC DOC-002). Where a study reports on the same problem as a previous one, it has not been summarised. The Summary document mainly contains studies identified with the help of national aviation authority or EUROCONTROL representatives and articles written by the Flight Safety Foundation.
The selected documents focus on various topics, which can be classified under five categories;
accident/incident databases,
accident analysis,
ATM incidents analysis,
future exchange of data,
particular aspects of ATM causes/causal factors, with proposed remedial actions/recommendations.
The first category includes all the selected accident and incident databases that collate information under review related to events in the ECAC area or on a worldwide basis.
The second category refers to articles or studies reflecting the results of analysis conducted on a selected sample of accidents, in order to draw up significant trends over a long period, or a significant interpretation of accidents in a specific region or concerning a specific category of aircraft.
The third category reflects the conclusions drawn in some countries by systematic analysis of AIRPROX or other ATM incidents. Occurrences of events are analysed in terms of existing procedures and behaviour to identify key risk areas and make recommendations to improve safety. These documents are of particular interest in that they deal specifically with ATM and ATC matters (ATM organisation, ATC procedures and pilot/ATCO exchanges).
The fourth category relates to efforts made throughout the world to exchange information regarding aviation safety. The main conclusion here is that the creation of several databases, partly overlapping each other and using inconsistent taxonomies, is to be rationalised to avoid duplication and the addition of non-homogeneous data which cannot be combined to enlarge the basis of analysis.
The last category includes all documents dealing with particular aspects of ATM as a contributory factor to past accidents/incidents.
SRC Document 2 – ATM Contribution to Aircraft Accidents / Incidents – Review and Analysis of Historical Data
Edition 4.0 Released Issue Page 13 of 71
The complete bibliography with a related description of the scope and rationale for the selection of specific documents is to be found in Appendix 1 of this report.
The first and second categories of selected information are of interest in order to tentatively depict the existing situation and point out trends regarding the extent to which ATM is contributing to accidents/incidents (safety performance measurement). The last three categories provide information on the identified causes/causal factors, potential remedial actions (safety improvement) and the way they have been introduced in the existing databases.
To find out more about the existing sources of information and, more precisely, about the existing databases collating accident and incident reports and statistics, these databases have been assessed, inter alia, for the improvement of the knowledge of the safety situation within the ECAC area during the last twenty years. This activity is not exhaustive however, as some national databases have not been included in the list mostly for reasons of confidentiality.
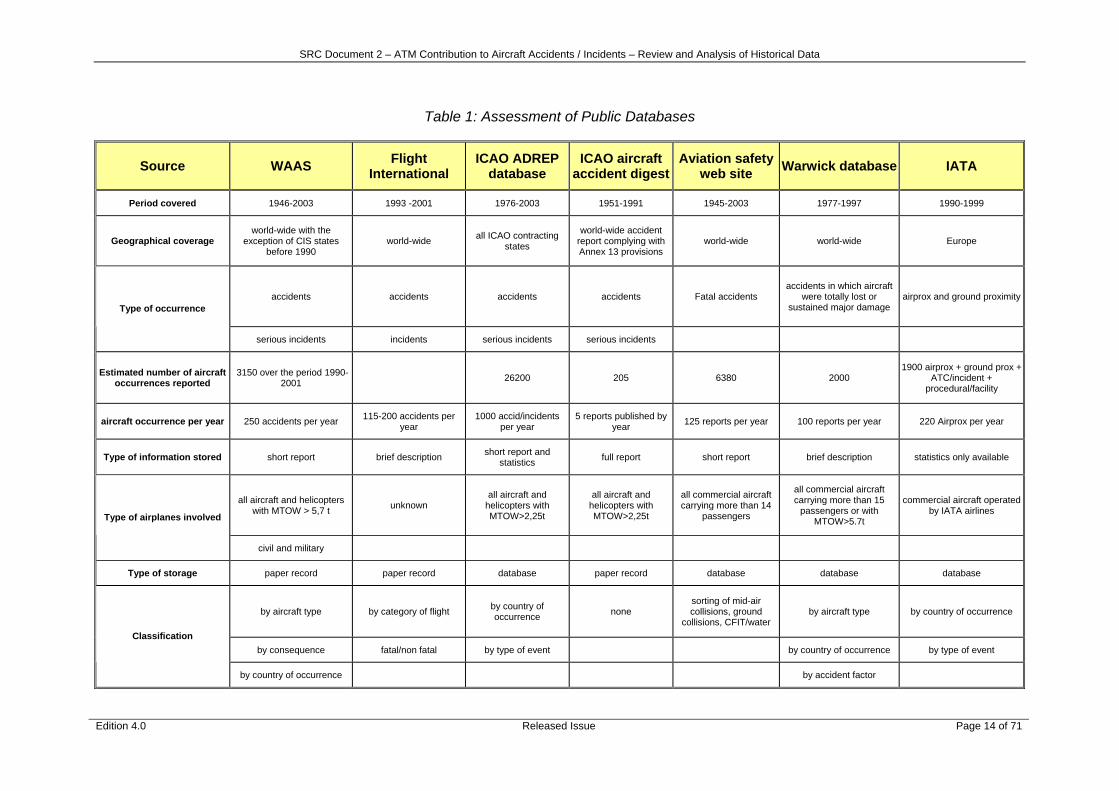
2.2. Assessment of Public or Available Databases There are seven main sources: the WAAS, information published by Flight International (monthly publication of Reed Business Information Group), ICAO ADREP database, ICAO Aircraft Accident Digest, the Aviation Safety site on the web, WARWICK database and the IATA database.
2.2.1 Scope/Characteristics of Available Databases For each of these sources, several characteristics were identified: the period covered, geographical coverage, type of occurrence considered, number of occurrences stored by year, type of aircraft involved, type of information provided, type of storage and possible type of classification. All these characteristics are important, as they reflect the content and quality of these databases. They are set out on the next page (table 1).
(Space Left Intentionally Blank)
SRC Document 2 – ATM Contribution to Aircraft Accidents / Incidents – Review and Analysis of Historical Data
Edition 4.0 Released Issue Page 14 of 71
Table 1: Assessment of Public Databases
Source WAAS Flight International
ICAO ADREP database
ICAO aircraft accident digest
Aviation safety web site Warwick database IATA
Period covered 1946-2003 1993 -2001 1976-2003 1951-1991 1945-2003 1977-1997 1990-1999
Geographical coverage world-wide with the
exception of CIS states before 1990
world-wide all ICAO contracting states
world-wide accident report complying with Annex 13 provisions
world-wide world-wide Europe
accidents accidents accidents accidents Fatal accidents accidents in which aircraft
were totally lost or sustained major damage
airprox and ground proximity Type of occurrence
serious incidents incidents serious incidents serious incidents
Estimated number of aircraft occurrences reported
3150 over the period 1990-2001 26200 205 6380 2000
1900 airprox + ground prox + ATC/incident +
procedural/facility
aircraft occurrence per year 250 accidents per year 115-200 accidents per year
1000 accid/incidents per year
5 reports published by year 125 reports per year 100 reports per year 220 Airprox per year
Type of information stored short report brief description short report and statistics full report short report brief description statistics only available
all aircraft and helicopters with MTOW > 5,7 t unknown
all aircraft and helicopters with MTOW>2,25t
all aircraft and helicopters with MTOW>2,25t
all commercial aircraft carrying more than 14
passengers
all commercial aircraft carrying more than 15
passengers or with MTOW>5.7t
commercial aircraft operated by IATA airlines
Type of airplanes involved
civil and military
Type of storage paper record paper record database paper record database database database
by aircraft type by category of flight by country of occurrence none
sorting of mid-air collisions, ground
collisions, CFIT/water by aircraft type by country of occurrence
by consequence fatal/non fatal by type of event by country of occurrence by type of event Classification
by country of occurrence by accident factor
SRC Document 2 – ATM Contribution to Aircraft Accidents / Incidents – Review and Analysis of Historical Data
Edition 4.0 Released Issue Page 15 of 71
2.2.2 Selection of Databases With the exception of information published by Flight International that was considered not to be exhaustive or detailed enough, all other databases were used to depict the existing situation and identify the extent to which ATM is a contributory factor to aircraft accidents and incidents.
2.2.3 Limitations of the Data Available The results of the surveys are set out in the following chapters. However, it should be noted firstly that the information provided by these databases and all the studies regarding accident and incident analysis do not cover all categories of occurrences and, secondly, that comparison between sources is not meaningful4.
The scope of aircraft accident analyses is occasionally limited to events involving only commercial aircraft, or aircraft with MTOW above 5.7 tonnes. It was sometimes voluntarily limited to a category of accident (e.g. fatal accidents for the UK CAA study) or to accidents during approach and landing phases (Flight Safety Foundation study).
ATM-related incident description is frequently limited to ‘AIRPROX’ analysis, with other events such as ‘near ground collisions’, ‘level busts’ and ‘runway incursions’ not being reported in general, and when reported, they are less frequently analysed. Therefore information collated and presented here cannot be considered as complete with regard to the extent to which ATM is a contributory factor to aircraft accidents and incidents.
Differences in scope make these sources difficult to compare;
fatal accidents compared with all types of accidents,
onboard fatalities compared with total fatalities including ground and other aircraft fatalities,
serious incidents reported by States to the ICAO Secretariat, or
AIRPROX reported by airlines, and members of IATA on the one hand, compared with AIRPROX filed within national reporting systems on the other hand.
Furthermore, the interpretation of these occurrences may differ.
2.3 Data Collection by EUROCONTROL
2.3.1 Monitoring of Safety Levels The first conclusion drawn from an earlier issue of this study demonstrated the limitations of existing safety data across the ECAC Member States.
ECAC’s ATM Strategy for 2000+ recommends that “safety performance shall be monitored”. Accordingly, the SRC has the task of assessing ATM safety across the ECAC area. In early 1999, SRC requested States to forward national safety information in a statistical form. The response was very limited, and showed that insufficient data existed to enable meaningful conclusions to be drawn about safety of ATM in the ECAC area.
4 The scope of sample analysed within each public database is shown in Appendix 4.

SRC Document 2 – ATM Contribution to Aircraft Accidents / Incidents – Review and Analysis of Historical Data
Edition 4.0 Released Issue Page 16 of 71
As a matter of extreme priority therefore, the EUROCONTROL Safety Measurement and Improvement Programme was initiated, and at its November 1999 meeting, the EUROCONTROL Commission approved the urgent and phased implementation of the Organisation’s first Safety Regulatory Requirement addressing "Safety Occurrence Reporting and Assessment in ATM” (Reference: ESARR 2).
Since 2000, the SRC has carried out annual collections of national safety information from States. This annual exercise initially confirmed the conclusions drawn in 1999, but over time it has proved that the system and the quality of data is improving from year to year.
ESARR 2 requires both the implementations of national reporting and analysis systems and the reporting of annual statistics to EUROCONTROL. The collection of national safety statistics by EUROCONTROL is an on-going process. States are indeed requested to provide at least an annual summary report to SRC for them to aggregate into ECAC-wide safety indicators.
2.3.2 Key risk Areas and Data for Safety Cases Additional safety data may be exchanged across the European ATM community, via a so-called “voluntary” exchange scheme between ATM service providers, safety regulators and EUROCONTROL.
European developments, co-ordinated by the EUROCONTROL Agency, require safety data to support their respective safety cases (pre-implementation data) as well as for the monitoring of the programme once implemented (post-implementation),
In order to support the exchange of information on how and why the ATM system may fail, a mechanism is being developed by which the whole ATM community can share information on key risk areas and ATM related remedial actions, for accident prevention purposes.
This information, when made available to EUROCONTROL, is dis-identified and is provided in this document.
(Space Left Intentionally Blank)
SRC Document 2 – ATM Contribution to Aircraft Accidents / Incidents – Review and Analysis of Historical Data
Edition 4.0 Released Issue Page 17 of 71
3. STATISTICAL RESULTS
Accident and incident time series will be presented before examining the ATM contribution to accidents and incidents and drawing the list of the main causal factors identified.
3.1 Accident Statistics Worldwide and Within the ECAC Region
The main existing sources are the Worldwide Aircraft Accident Summary (WAAS) established firstly by the UK CAA, then by Airclaims, the ICAO ADREP database and the Aviation Safety source, presented on the web by Mr. Harro Ranter. Related scope of sample analysis is provided in Appendix 4 to this report.
3.1.1 Fatal Accidents Study Based on the WAAS From the WAAS, a selection of fatal accidents were studied by the UK CAA.
Figures regarding the number of accidents and fatalities during the period have been extracted from this study and are shown below.
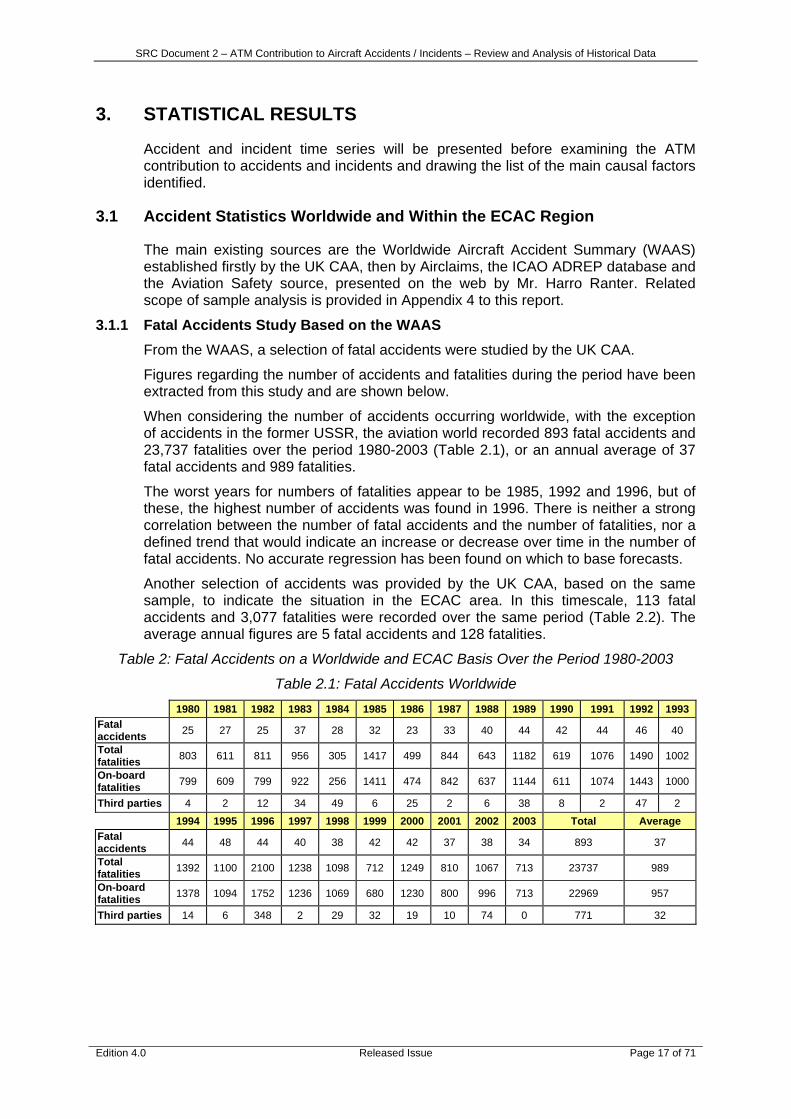
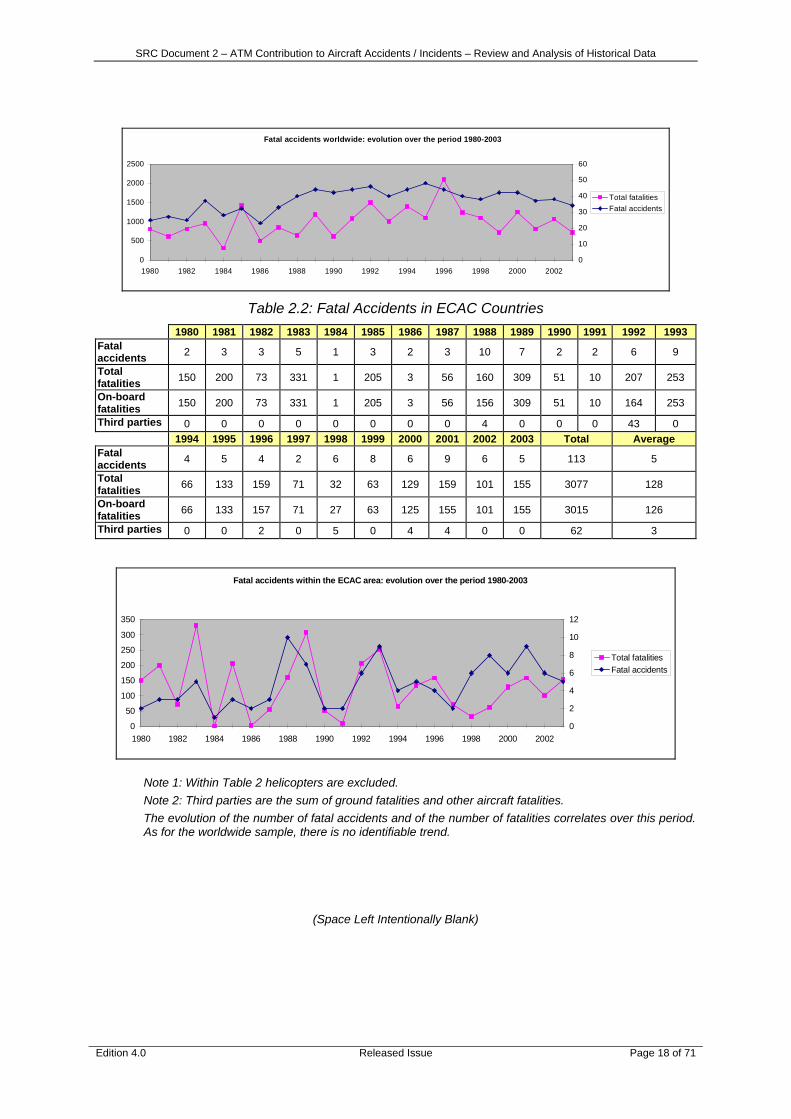
When considering the number of accidents occurring worldwide, with the exception of accidents in the former USSR, the aviation world recorded 893 fatal accidents and 23,737 fatalities over the period 1980-2003 (Table 2.1), or an annual average of 37 fatal accidents and 989 fatalities.
The worst years for numbers of fatalities appear to be 1985, 1992 and 1996, but of these, the highest number of accidents was found in 1996. There is neither a strong correlation between the number of fatal accidents and the number of fatalities, nor a defined trend that would indicate an increase or decrease over time in the number of fatal accidents. No accurate regression has been found on which to base forecasts.
Another selection of accidents was provided by the UK CAA, based on the same sample, to indicate the situation in the ECAC area. In this timescale, 113 fatal accidents and 3,077 fatalities were recorded over the same period (Table 2.2). The average annual figures are 5 fatal accidents and 128 fatalities.
Table 2: Fatal Accidents on a Worldwide and ECAC Basis Over the Period 1980-2003
Table 2.1: Fatal Accidents Worldwide 1980 1981 1982 1983 1984 1985 1986 1987 1988 1989 1990 1991 1992 1993 Fatal accidents 25 27 25 37 28 32 23 33 40 44 42 44 46 40
Total fatalities 803 611 811 956 305 1417 499 844 643 1182 619 1076 1490 1002
On-board fatalities 799 609 799 922 256 1411 474 842 637 1144 611 1074 1443 1000
Third parties 4 2 12 34 49 6 25 2 6 38 8 2 47 2
1994 1995 1996 1997 1998 1999 2000 2001 2002 2003 Total Average Fatal accidents 44 48 44 40 38 42 42 37 38 34 893 37
Total fatalities 1392 1100 2100 1238 1098 712 1249 810 1067 713 23737 989
On-board fatalities 1378 1094 1752 1236 1069 680 1230 800 996 713 22969 957
Third parties 14 6 348 2 29 32 19 10 74 0 771 32
SRC Document 2 – ATM Contribution to Aircraft Accidents / Incidents – Review and Analysis of Historical Data
Edition 4.0 Released Issue Page 18 of 71
Fatal accidents worldwide: evolution over the period 1980-2003
0
500
1000
1500
2000
2500
1980 1982 1984 1986 1988 1990 1992 1994 1996 1998 2000 20020
10
20
30
40
50
60
Total fatalitiesFatal accidents
Table 2.2: Fatal Accidents in ECAC Countries
1980 1981 1982 1983 1984 1985 1986 1987 1988 1989 1990 1991 1992 1993 Fatal accidents 2 3 3 5 1 3 2 3 10 7 2 2 6 9
Total fatalities 150 200 73 331 1 205 3 56 160 309 51 10 207 253
On-board fatalities 150 200 73 331 1 205 3 56 156 309 51 10 164 253
Third parties 0 0 0 0 0 0 0 0 4 0 0 0 43 0 1994 1995 1996 1997 1998 1999 2000 2001 2002 2003 Total Average
Fatal accidents 4 5 4 2 6 8 6 9 6 5 113 5
Total fatalities 66 133 159 71 32 63 129 159 101 155 3077 128
On-board fatalities 66 133 157 71 27 63 125 155 101 155 3015 126
Third parties 0 0 2 0 5 0 4 4 0 0 62 3
Fatal accidents within the ECAC area: evolution over the period 1980-2003
0
50
100
150
200
250
300
350
1980 1982 1984 1986 1988 1990 1992 1994 1996 1998 2000 20020
2
4
6
8
10
12
Total fatalitiesFatal accidents
Note 1: Within Table 2 helicopters are excluded. Note 2: Third parties are the sum of ground fatalities and other aircraft fatalities. The evolution of the number of fatal accidents and of the number of fatalities correlates over this period. As for the worldwide sample, there is no identifiable trend.
(Space Left Intentionally Blank)
SRC Document 2 – ATM Contribution to Aircraft Accidents / Incidents – Review and Analysis of Historical Data
Edition 4.0 Released Issue Page 19 of 71
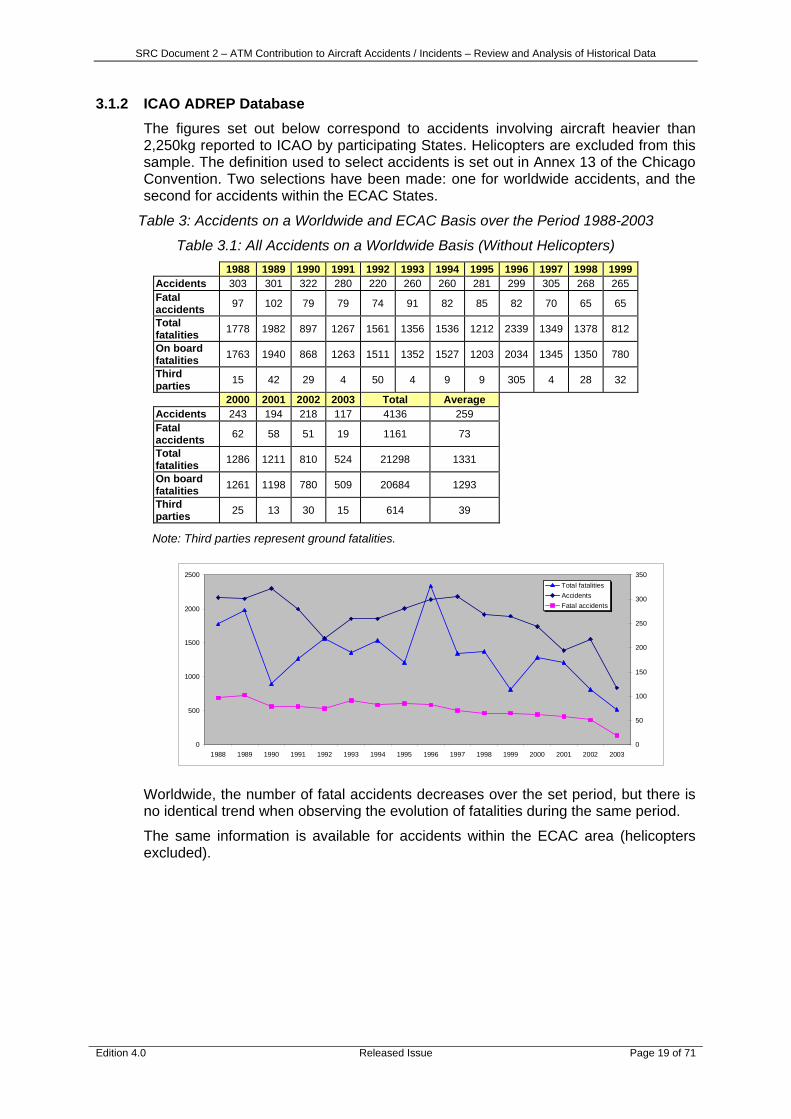
3.1.2 ICAO ADREP Database The figures set out below correspond to accidents involving aircraft heavier than 2,250kg reported to ICAO by participating States. Helicopters are excluded from this sample. The definition used to select accidents is set out in Annex 13 of the Chicago Convention. Two selections have been made: one for worldwide accidents, and the second for accidents within the ECAC States.
Table 3: Accidents on a Worldwide and ECAC Basis over the Period 1988-2003
Table 3.1: All Accidents on a Worldwide Basis (Without Helicopters) 1988 1989 1990 1991 1992 1993 1994 1995 1996 1997 1998 1999
Accidents 303 301 322 280 220 260 260 281 299 305 268 265 Fatal accidents 97 102 79 79 74 91 82 85 82 70 65 65
Total fatalities 1778 1982 897 1267 1561 1356 1536 1212 2339 1349 1378 812
On board fatalities 1763 1940 868 1263 1511 1352 1527 1203 2034 1345 1350 780
Third parties 15 42 29 4 50 4 9 9 305 4 28 32
2000 2001 2002 2003 Total Average Accidents 243 194 218 117 4136 259 Fatal accidents 62 58 51 19 1161 73
Total fatalities 1286 1211 810 524 21298 1331
On board fatalities 1261 1198 780 509 20684 1293
Third parties 25 13 30 15 614 39
Note: Third parties represent ground fatalities.
0
500
1000
1500
2000
2500
1988 1989 1990 1991 1992 1993 1994 1995 1996 1997 1998 1999 2000 2001 2002 20030
50
100
150
200
250
300
350Total fatalitiesAccidentsFatal accidents
Worldwide, the number of fatal accidents decreases over the set period, but there is no identical trend when observing the evolution of fatalities during the same period.
The same information is available for accidents within the ECAC area (helicopters excluded).

SRC Document 2 – ATM Contribution to Aircraft Accidents / Incidents – Review and Analysis of Historical Data
Edition 4.0 Released Issue Page 20 of 71
Table 3.2: All Accidents Within ECAC (Without Helicopters)
1988 1989 1990 1991 1992 1993 1994 1995 1996 1997 1998 1999 Accidents 40 42 32 33 25 33 30 25 20 27 33 38 Fatal accidents 15 11 3 4 5 11 7 4 5 4 5 8 Total fatalities 464 178 51 40 205 228 80 131 157 73 24 69 On board fatalities 453 178 51 40 162 226 80 131 154 72 20 69
Third parties 11 0 0 0 43 2 0 0 3 1 4 0 2000 2001 2002 2003 Total Average Accidents 30 28 30 19 485 30 Fatal accidents 5 7 7 4 105 7 Total fatalities 130 157 119 153 2259 141 On board fatalities 126 153 119 153 2187 136
Third parties 4 4 0 0 72 5
Note: Third parties represent ground fatalities.
0
50
100
150
200
250
300
350
400
450
500
1988 1989 1990 1991 1992 1993 1994 1995 1996 1997 1998 1999 2000 2001 2002 20030
5
10
15
20
25
30
35
40
45Total fatalitiesAccidentsFatal accidents
CFIT accidents and mid-air collisions were analysed from the ADREP data for both geographical areas (helicopters excluded).
Table 3.3: CFIT Accidents on a Worldwide Basis
1988 1989 1990 1991 1992 1993 1994 1995 1996 1997 1998 Accidents 41 40 38 34 40 43 42 50 40 32 27 Fatal accidents 30 36 27 27 29 32 31 37 29 21 20 Total fatalities 655 924 397 353 910 609 347 630 472 728 407 On board fatalities 655 901 397 353 910 609 347 630 470 728 406
Third parties 0 23 0 0 0 0 0 0 2 0 1 1999 2000 2001 2002 2003 Total Average Accidents 26 20 13 30 19 535 33 Fatal accidents 24 14 11 7 4 379 24 Total fatalities 246 221 65 119 153 7236 452 On board fatalities 246 221 65 119 153 7210 450
Third parties 0 0 0 0 0 26 2
SRC Document 2 – ATM Contribution to Aircraft Accidents / Incidents – Review and Analysis of Historical Data
Edition 4.0 Released Issue Page 21 of 71
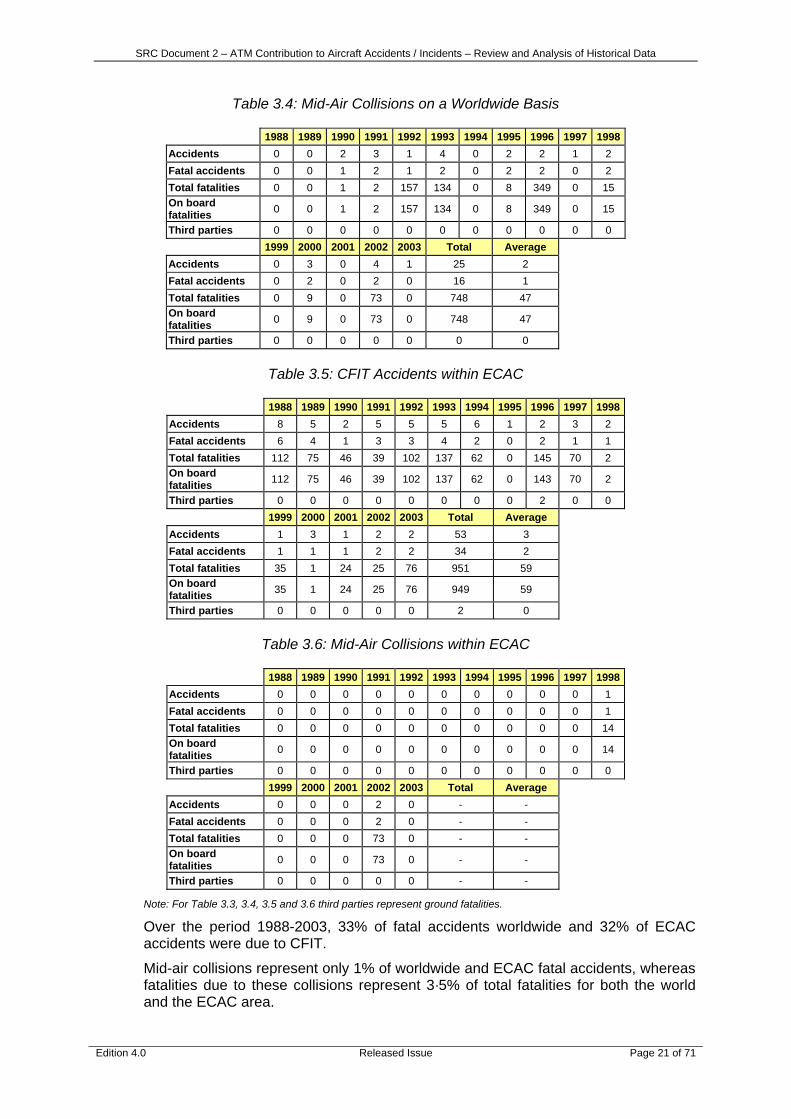
Table 3.4: Mid-Air Collisions on a Worldwide Basis
1988 1989 1990 1991 1992 1993 1994 1995 1996 1997 1998 Accidents 0 0 2 3 1 4 0 2 2 1 2 Fatal accidents 0 0 1 2 1 2 0 2 2 0 2 Total fatalities 0 0 1 2 157 134 0 8 349 0 15 On board fatalities 0 0 1 2 157 134 0 8 349 0 15
Third parties 0 0 0 0 0 0 0 0 0 0 0 1999 2000 2001 2002 2003 Total Average Accidents 0 3 0 4 1 25 2 Fatal accidents 0 2 0 2 0 16 1 Total fatalities 0 9 0 73 0 748 47 On board fatalities 0 9 0 73 0 748 47
Third parties 0 0 0 0 0 0 0
Table 3.5: CFIT Accidents within ECAC
1988 1989 1990 1991 1992 1993 1994 1995 1996 1997 1998 Accidents 8 5 2 5 5 5 6 1 2 3 2 Fatal accidents 6 4 1 3 3 4 2 0 2 1 1 Total fatalities 112 75 46 39 102 137 62 0 145 70 2 On board fatalities 112 75 46 39 102 137 62 0 143 70 2
Third parties 0 0 0 0 0 0 0 0 2 0 0 1999 2000 2001 2002 2003 Total Average Accidents 1 3 1 2 2 53 3 Fatal accidents 1 1 1 2 2 34 2 Total fatalities 35 1 24 25 76 951 59 On board fatalities 35 1 24 25 76 949 59
Third parties 0 0 0 0 0 2 0
Table 3.6: Mid-Air Collisions within ECAC
1988 1989 1990 1991 1992 1993 1994 1995 1996 1997 1998 Accidents 0 0 0 0 0 0 0 0 0 0 1 Fatal accidents 0 0 0 0 0 0 0 0 0 0 1 Total fatalities 0 0 0 0 0 0 0 0 0 0 14 On board fatalities 0 0 0 0 0 0 0 0 0 0 14
Third parties 0 0 0 0 0 0 0 0 0 0 0 1999 2000 2001 2002 2003 Total Average Accidents 0 0 0 2 0 - - Fatal accidents 0 0 0 2 0 - - Total fatalities 0 0 0 73 0 - - On board fatalities 0 0 0 73 0 - -
Third parties 0 0 0 0 0 - -
Note: For Table 3.3, 3.4, 3.5 and 3.6 third parties represent ground fatalities.
Over the period 1988-2003, 33% of fatal accidents worldwide and 32% of ECAC accidents were due to CFIT.
Mid-air collisions represent only 1% of worldwide and ECAC fatal accidents, whereas fatalities due to these collisions represent 3·5% of total fatalities for both the world and the ECAC area.
SRC Document 2 – ATM Contribution to Aircraft Accidents / Incidents – Review and Analysis of Historical Data
Edition 4.0 Released Issue Page 22 of 71
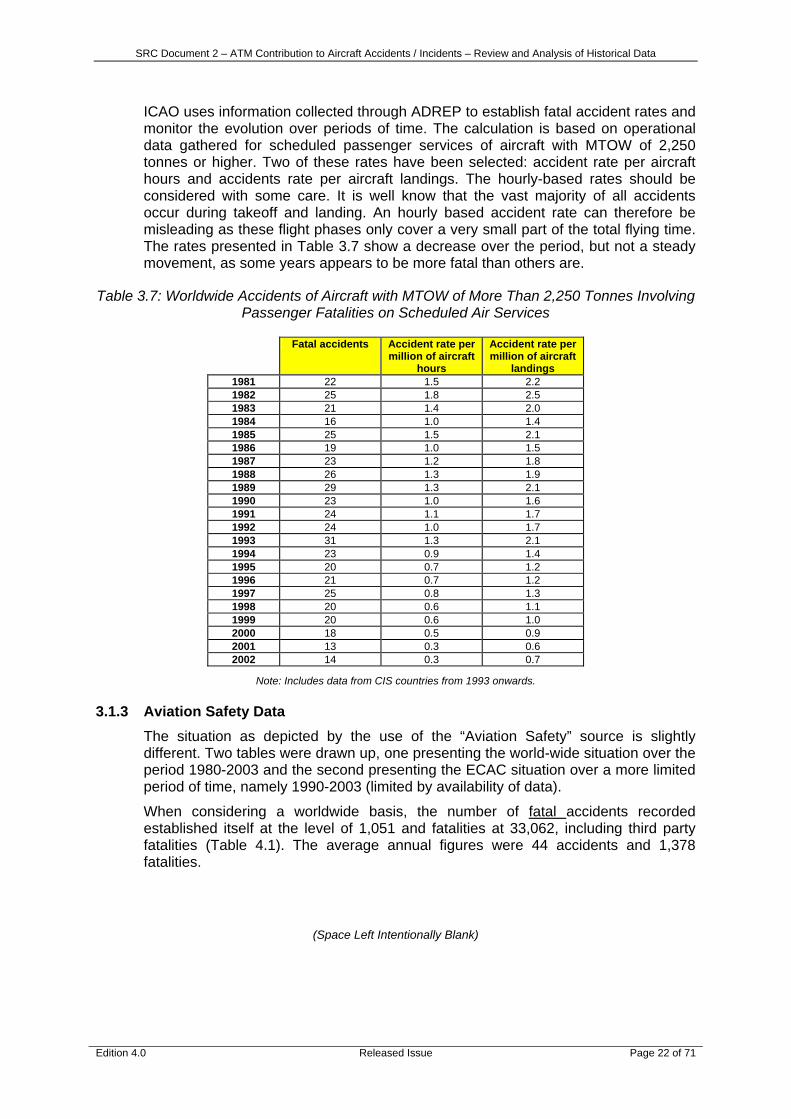
ICAO uses information collected through ADREP to establish fatal accident rates and monitor the evolution over periods of time. The calculation is based on operational data gathered for scheduled passenger services of aircraft with MTOW of 2,250 tonnes or higher. Two of these rates have been selected: accident rate per aircraft hours and accidents rate per aircraft landings. The hourly-based rates should be considered with some care. It is well know that the vast majority of all accidents occur during takeoff and landing. An hourly based accident rate can therefore be misleading as these flight phases only cover a very small part of the total flying time. The rates presented in Table 3.7 show a decrease over the period, but not a steady movement, as some years appears to be more fatal than others are.
Table 3.7: Worldwide Accidents of Aircraft with MTOW of More Than 2,250 Tonnes Involving Passenger Fatalities on Scheduled Air Services
Fatal accidents Accident rate per million of aircraft
hours
Accident rate per million of aircraft
landings 1981 22 1.5 2.2 1982 25 1.8 2.5 1983 21 1.4 2.0 1984 16 1.0 1.4 1985 25 1.5 2.1 1986 19 1.0 1.5 1987 23 1.2 1.8 1988 26 1.3 1.9 1989 29 1.3 2.1 1990 23 1.0 1.6 1991 24 1.1 1.7 1992 24 1.0 1.7 1993 31 1.3 2.1 1994 23 0.9 1.4 1995 20 0.7 1.2 1996 21 0.7 1.2 1997 25 0.8 1.3 1998 20 0.6 1.1 1999 20 0.6 1.0 2000 18 0.5 0.9 2001 13 0.3 0.6 2002 14 0.3 0.7
Note: Includes data from CIS countries from 1993 onwards.
3.1.3 Aviation Safety Data The situation as depicted by the use of the “Aviation Safety” source is slightly different. Two tables were drawn up, one presenting the world-wide situation over the period 1980-2003 and the second presenting the ECAC situation over a more limited period of time, namely 1990-2003 (limited by availability of data).
When considering a worldwide basis, the number of fatal accidents recorded established itself at the level of 1,051 and fatalities at 33,062, including third party fatalities (Table 4.1). The average annual figures were 44 accidents and 1,378 fatalities.
(Space Left Intentionally Blank)

SRC Document 2 – ATM Contribution to Aircraft Accidents / Incidents – Review and Analysis of Historical Data
Edition 4.0 Released Issue Page 23 of 71
Table 4.1: Accidents Worldwide Over the Period 1980-2003
1980 1981 1982 1983 1984 1985 1986 1987 1988 1989 1990 1991 1992 1993Accidents 44 40 35 35 34 39 42 42 63 62 38 54 57 53 Total Fatalities 1361 920 1177 1377 677 2369 942 1399 1746 1895 790 1166 1603 1282On-board fatalities 1361 920 1164 1355 624 2368 927 1351 1734 1821 770 1162 1552 1276
Third parties 0 0 13 22 53 1 15 48 12 74 20 4 51 6 1994 1995 1996 1997 1998 1999 2000 2001 2002 2003 Total Average Accidents 55 51 51 40 40 45 36 35 35 25 1051 44 Total Fatalities 1499 1171 1990 1236 1341 708 1152 3413 1171 677 33062 1378 On-board fatalities 1494 1171 1937 1235 1320 682 1131 1136 1093 677 30261 1261
Third parties 5 0 53 1 21 26 21 2277 78 0 2801 117
0500
1,0001,5002,0002,5003,0003,5004,000
1 980 1983 1986 1989 1992 1995 1998 200 1010203040506070
Tota l Fa ta litiesA ccidents
Accidents w orld -w ide: evo lu tion o ver th e period 1980-2003
For the ECAC area (Table 4.2), the total number of accidents amounts to 149 and total fatalities to 1,765 over a period of fourteen years, the average annual figures being 11 accidents and 126 fatalities (1990-2003)
Table 4.2: Accidents in the ECAC Area Over the Period 1990-2003
1990 1991 1992 1993 1994 1995 1996 1997 1998 1999 Accidents 10 8 16 17 11 9 11 7 12 15 Fatal accidents 4 2 8 10 7 6 5 2 7 7 Total fatalities 61 37 253 260 85 136 222 71 35 55 On-board fatalities 61 37 206 260 85 136 218 71 35 55 Ground fatalities 0 0 47 0 0 0 4 0 0 0 2000 2001 2002 2003 Total Average Accidents 7 13 6 7 149 11 Fatal accidents 4 7 5 1 75 5 Total fatalities 125 176 96 153 1765 126 On-board fatalities 121 171 96 153 1705 122 Ground fatalities 4 5 0 0 60 4
Accidents occurred within ECAC over the period 1990-2003
0
100
200
300
1990 1992 1994 1996 1998 2000 20020
5
10
15
20
TotalfatalitiesAccidents
Fatalaccidents
SRC Document 2 – ATM Contribution to Aircraft Accidents / Incidents – Review and Analysis of Historical Data
Edition 4.0 Released Issue Page 24 of 71
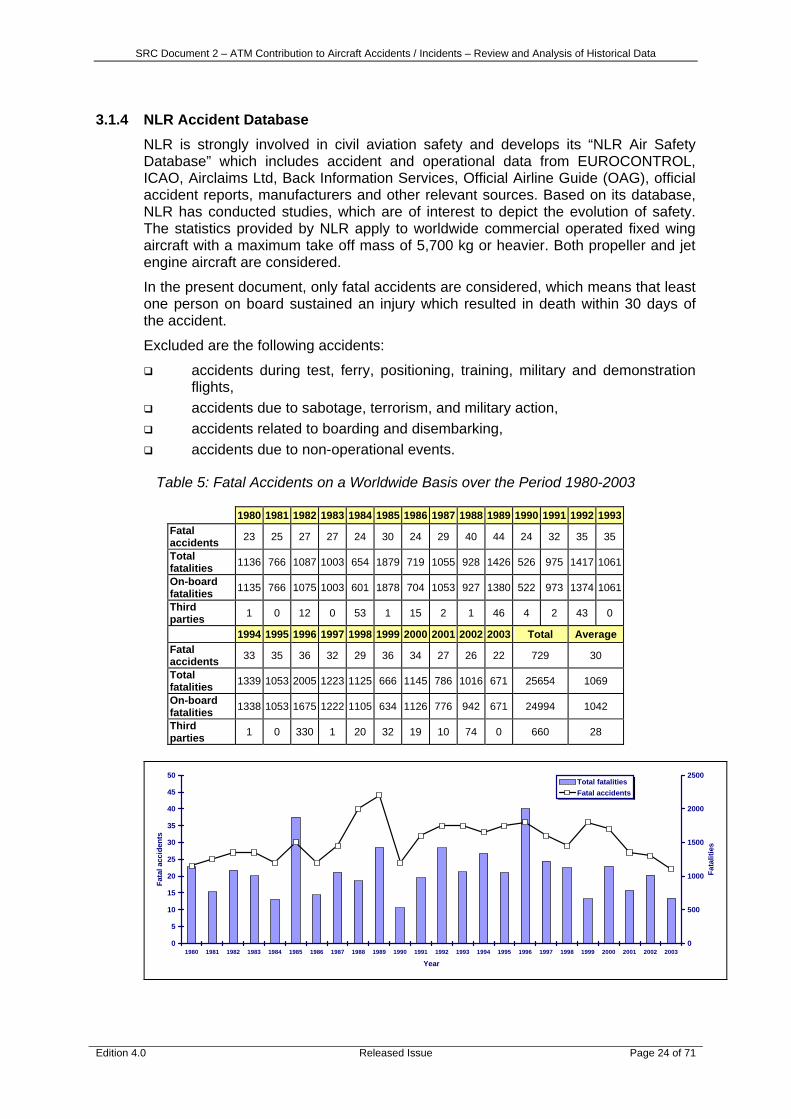
3.1.4 NLR Accident Database NLR is strongly involved in civil aviation safety and develops its “NLR Air Safety Database” which includes accident and operational data from EUROCONTROL, ICAO, Airclaims Ltd, Back Information Services, Official Airline Guide (OAG), official accident reports, manufacturers and other relevant sources. Based on its database, NLR has conducted studies, which are of interest to depict the evolution of safety. The statistics provided by NLR apply to worldwide commercial operated fixed wing aircraft with a maximum take off mass of 5,700 kg or heavier. Both propeller and jet engine aircraft are considered.
In the present document, only fatal accidents are considered, which means that least one person on board sustained an injury which resulted in death within 30 days of the accident.
Excluded are the following accidents:
accidents during test, ferry, positioning, training, military and demonstration flights,
accidents due to sabotage, terrorism, and military action, accidents related to boarding and disembarking, accidents due to non-operational events.
Table 5: Fatal Accidents on a Worldwide Basis over the Period 1980-2003
1980 1981 1982 1983 1984 1985 1986 1987 1988 1989 1990 1991 1992 1993 Fatal accidents 23 25 27 27 24 30 24 29 40 44 24 32 35 35
Total fatalities 1136 766 1087 1003 654 1879 719 1055 928 1426 526 975 1417 1061
On-board fatalities 1135 766 1075 1003 601 1878 704 1053 927 1380 522 973 1374 1061
Third parties 1 0 12 0 53 1 15 2 1 46 4 2 43 0
1994 1995 1996 1997 1998 1999 2000 2001 2002 2003 Total Average Fatal accidents 33 35 36 32 29 36 34 27 26 22 729 30
Total fatalities 1339 1053 2005 1223 1125 666 1145 786 1016 671 25654 1069
On-board fatalities 1338 1053 1675 1222 1105 634 1126 776 942 671 24994 1042
Third parties 1 0 330 1 20 32 19 10 74 0 660 28
0
5
10
15
20
25
30
35
40
45
50
1980 1981 1982 1983 1984 1985 1986 1987 1988 1989 1990 1991 1992 1993 1994 1995 1996 1997 1998 1999 2000 2001 2002 2003
Year
Fata
l acc
iden
ts
0
500
1000
1500
2000
2500
Fata
litie
s
Total fatalitiesFatal accidents

SRC Document 2 – ATM Contribution to Aircraft Accidents / Incidents – Review and Analysis of Historical Data
Edition 4.0 Released Issue Page 25 of 71
For the period 1980-2003, 729 fatal accidents were identified in the NLR sample, leading to 24,994 on-board fatalities and 660 third parties fatalities (shown in table 5). Average figures over the period amount to 30 annual fatal accidents and 1,042 total fatalities.
NLR use operational data from its database to estimate fatal accidents rate. This data includes OAG data as far as scheduled flights are concerned and aircraft manufacturers’ data to assess operational data for non-scheduled flights. The latter is based on information concerning individual aircraft cycles provided by individual operators to the manufacturers. As shown in Figure 1 below, the fatal accidents rate varies sharply from year to year and reaches 0·67 for the year 2003. Overall there appears to be a downward trend for the period considered on a worldwide basis.
0
0.2
0.4
0.6
0.8
1
1.2
1.4
1.6
1.8
1978 1980 1982 1984 1986 1988 1990 1992 1994 1996 1998 2000 2002 2004
Year
Rat
e pe
r mill
ion
fligh
ts
Figure 1 - Evolution of fatal accidents rate (per million flights) over 1980-2003
Contributing factors, as reported by the official investigators, were also analysed for the fatal accidents of the sample. The definition adopted for a contributing factor is an “event or item that was instrumental to the causal chain of events leading to the accident”. More than one factor by accident might have been attributed. No distinction has been made between primary and secondary causal events or items as such distinction has been considered as arbitrary by the authors.
Figure 2 shows the importance of identified contributing factors over the period 1980-2002. Relative importance has been estimated based on the number of factors allocated for each factor group divided by the total number of factors identified. In total 832 factors were identified in 639 fatal accidents with known factors. There were 33 factors related to ATC. ATC contributes, in this context, to 5% of fatal accidents.
46%
18%
16%
8%
6%
4%
2%
Cockpit Crew
Aircraft
Environment
Powerplant
Maintenance
Air Traffic Control
Airport
Based on 639 fatal accidents withknown contributing factors.
An accident can have morethan one contributing factor.
A contributing factor can be aprimary causal factor.
Figure 2 - Contributing factors to fatal accidents (1980-2002)
SRC Document 2 – ATM Contribution to Aircraft Accidents / Incidents – Review and Analysis of Historical Data
Edition 4.0 Released Issue Page 26 of 71
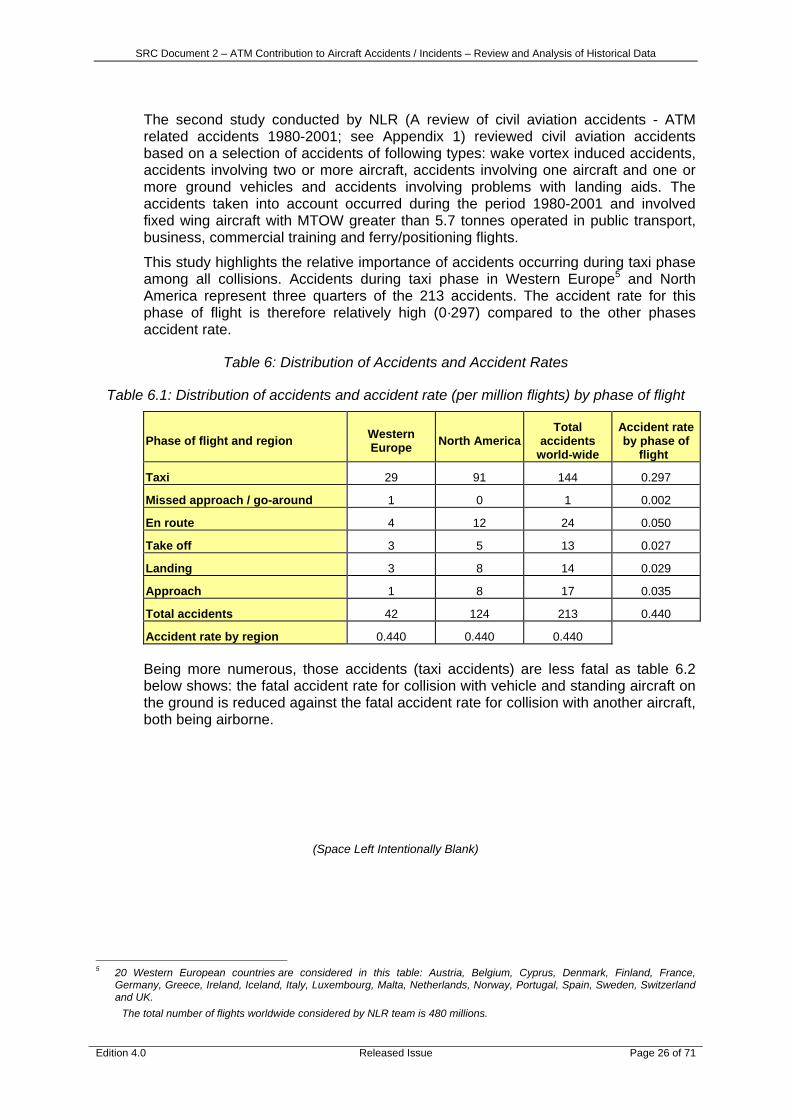
The second study conducted by NLR (A review of civil aviation accidents - ATM related accidents 1980-2001; see Appendix 1) reviewed civil aviation accidents based on a selection of accidents of following types: wake vortex induced accidents, accidents involving two or more aircraft, accidents involving one aircraft and one or more ground vehicles and accidents involving problems with landing aids. The accidents taken into account occurred during the period 1980-2001 and involved fixed wing aircraft with MTOW greater than 5.7 tonnes operated in public transport, business, commercial training and ferry/positioning flights.
This study highlights the relative importance of accidents occurring during taxi phase among all collisions. Accidents during taxi phase in Western Europe5 and North America represent three quarters of the 213 accidents. The accident rate for this phase of flight is therefore relatively high (0·297) compared to the other phases accident rate.
Table 6: Distribution of Accidents and Accident Rates
Table 6.1: Distribution of accidents and accident rate (per million flights) by phase of flight
Phase of flight and region Western Europe North America
Total accidents
world-wide
Accident rate by phase of
flightT
Taxi 29 91 144 0.297
Missed approach / go-around 1 0 1 0.002
En route 4 12 24 0.050
Take off 3 5 13 0.027
Landing 3 8 14 0.029
Approach 1 8 17 0.035
Total accidents 42 124 213 0.440
Accident rate by region 0.440 0.440 0.440
Being more numerous, those accidents (taxi accidents) are less fatal as table 6.2 below shows: the fatal accident rate for collision with vehicle and standing aircraft on the ground is reduced against the fatal accident rate for collision with another aircraft, both being airborne.
(Space Left Intentionally Blank)
5 20 Western European countries are considered in this table: Austria, Belgium, Cyprus, Denmark, Finland, France,
Germany, Greece, Ireland, Iceland, Italy, Luxembourg, Malta, Netherlands, Norway, Portugal, Spain, Sweden, Switzerland and UK.
T The total number of flights worldwide considered by NLR team is 480 millions.

SRC Document 2 – ATM Contribution to Aircraft Accidents / Incidents – Review and Analysis of Historical Data
Edition 4.0 Released Issue Page 27 of 71
Table 6.2: Distribution of accidents and accident rate (per million flights) by type of event
Type of Event Accidents Fatal accidents
On board fatalities
Accident rate
Fatal accident
rate Aircraft Encountered
Vortex/Wake Turbulence 9 0 0 0.019 0.000
Collision / Near Collision with Aircraft - both Airborne 27 14 620 0.056 0.029
Collision with Aircraft – One Airborne 7 1 11 0.014 0.002
Collision with Moving Aircraft on Ground 44 8 258 0.091 0.017
Collision with Standing Aircraft on ground 47 1 4 0.097 0.002
Collision with Vehicle 71 1 1 0.147 0.002
Landing Aids Related Accident 8 4 90 0.017 0.008
Total 213 29 984 0.440 0.060
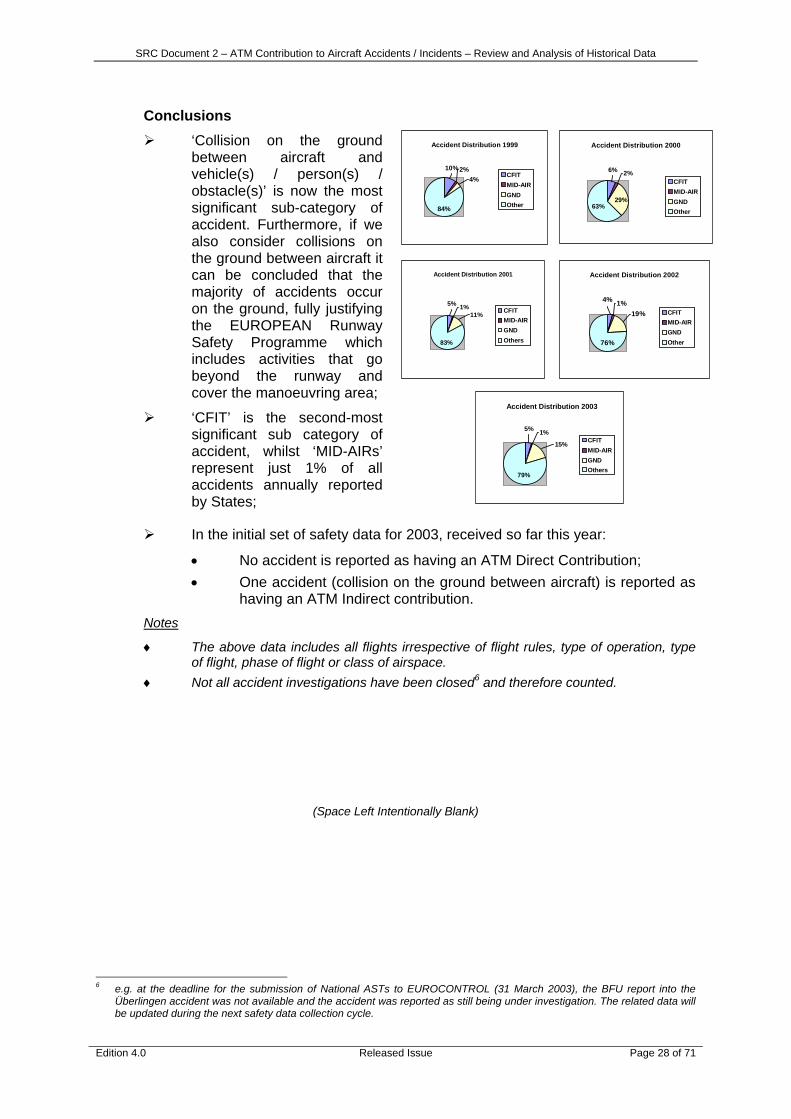
3.1.5 Accident Data Collected by EUROCONTROL The types of accident used for sub-classification of data for the years 1999 to 2003 are shown in Table 7 below. Of the reported MID-AIR Collisions in 2003, there is only VFR/VFR involvement indicated with no ATM contribution. Of the reported CFIT accidents in 2003 with IFR implications, only one was also classified as fatal, but again with no ATM INDIRECT or DIRECT contribution. The number of reported collisions on the ground between aircraft has slightly increased from last year (from 11 in 2002 to 15 in 2003). However, none were fatal and none had ATM contribution. The number of reported collisions on the ground between aircraft and vehicle(s)/person(s)/obstruction(s) is still significant, although it has decreased from last reported year (from 136 in 2002 to 115 in 2003).
Table 7: Accidents Collected via AST (1999 – 2003)
Type of Reported Accident 1999 2000 2001 2002 2003
Total number of accidents 735 (83) 365 (56) * 749 (122) 721 (92) 788 (94)
Total Number of MID-AIR Collisions 14 (7) 9 (3) 9 (5) 11 (2) 7 (3)
Total number of CFITs 71 (21) 23 (9) 39 (20) 30 (14) 38 (10)
Total Number of Collisions on the ground between aircraft 3 (0) 9 (0) 8 (1) 11 (0) 15 (0)
Total Number of Collisions on the ground between Aircraft and Vehicle /Persons/ Obstruction(s)
27 (1) 107 (0) 81 (1) 136 (5) 115 (2)
(Table 7: Accident Categorisation (includes IFR and VFR traffic)) (figures in (brackets) show the number of fatal accidents within the overall accident total) (*) Not all the States have contributed data in 2000 with respect to accidents and fatal accidents.
SRC Document 2 – ATM Contribution to Aircraft Accidents / Incidents – Review and Analysis of Historical Data
Edition 4.0 Released Issue Page 28 of 71
Conclusions ‘Collision on the ground
between aircraft and vehicle(s) / person(s) / obstacle(s)’ is now the most significant sub-category of accident. Furthermore, if we also consider collisions on the ground between aircraft it can be concluded that the majority of accidents occur on the ground, fully justifying the EUROPEAN Runway Safety Programme which includes activities that go beyond the runway and cover the manoeuvring area;
‘CFIT’ is the second-most significant sub category of accident, whilst ‘MID-AIRs’ represent just 1% of all accidents annually reported by States;
In the initial set of safety data for 2003, received so far this year:
• No accident is reported as having an ATM Direct Contribution; • One accident (collision on the ground between aircraft) is reported as
having an ATM Indirect contribution. Notes
♦ The above data includes all flights irrespective of flight rules, type of operation, type of flight, phase of flight or class of airspace.
♦ Not all accident investigations have been closed6 and therefore counted.
(Space Left Intentionally Blank)
6 e.g. at the deadline for the submission of National ASTs to EUROCONTROL (31 March 2003), the BFU report into the
Überlingen accident was not available and the accident was reported as still being under investigation. The related data will be updated during the next safety data collection cycle.
Accident Distribution 1999
4%10%2%
84%
CFITMID-AIRGNDOther
Accident Distribution 2000
6% 2%
29%63%
CFITMID-AIRGNDOther
Accident Distribution 2001
83%
1%5%
11% CFITMID-AIRGNDOthers
Accident Distribution 2002
19%
4% 1%
76%
CFITMID-AIRGNDOther
Accident Distribution 2003
79%
1%5%
15% CFITMID-AIRGNDOthers
SRC Document 2 – ATM Contribution to Aircraft Accidents / Incidents – Review and Analysis of Historical Data
Edition 4.0 Released Issue Page 29 of 71
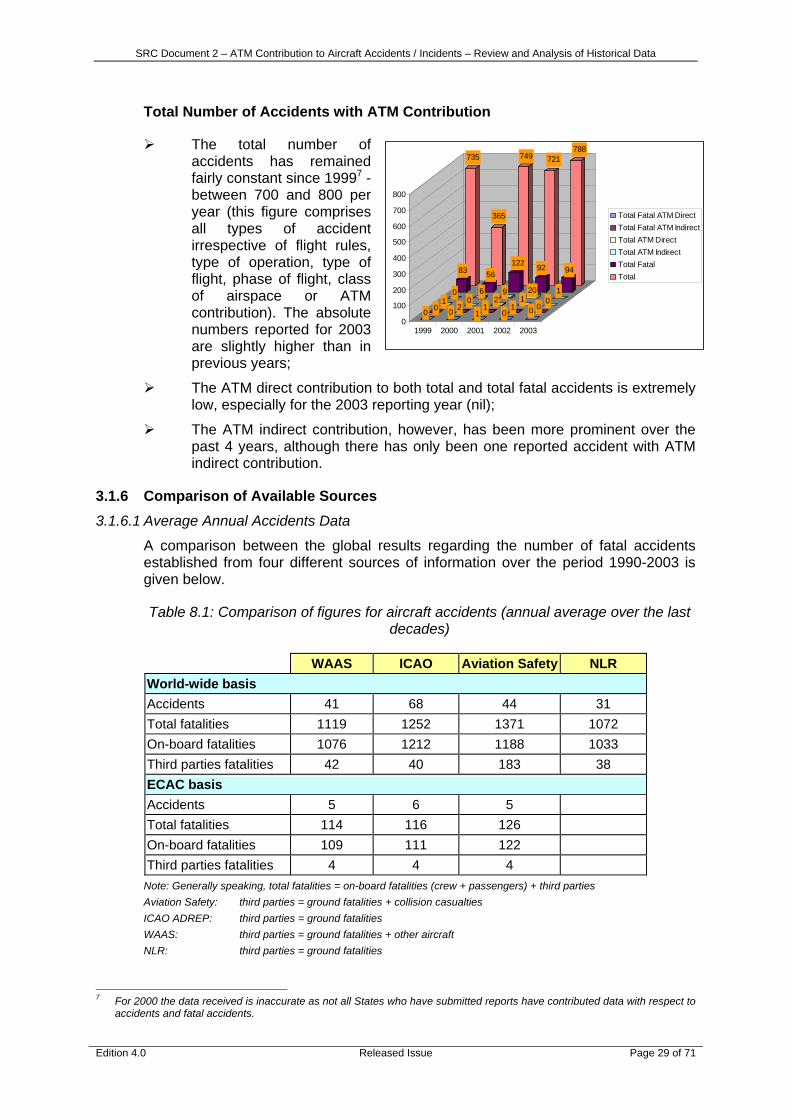
Total Number of Accidents with ATM Contribution
The total number of accidents has remained fairly constant since 19997 - between 700 and 800 per year (this figure comprises all types of accident irrespective of flight rules, type of operation, type of flight, phase of flight, class of airspace or ATM contribution). The absolute numbers reported for 2003 are slightly higher than in previous years;
The ATM direct contribution to both total and total fatal accidents is extremely low, especially for the 2003 reporting year (nil);
The ATM indirect contribution, however, has been more prominent over the past 4 years, although there has only been one reported accident with ATM indirect contribution.
3.1.6 Comparison of Available Sources 3.1.6.1 Average Annual Accidents Data
A comparison between the global results regarding the number of fatal accidents established from four different sources of information over the period 1990-2003 is given below.
Table 8.1: Comparison of figures for aircraft accidents (annual average over the last decades)
WAAS ICAO Aviation Safety NLR World-wide basis Accidents 41 68 44 31 Total fatalities 1119 1252 1371 1072 On-board fatalities 1076 1212 1188 1033 Third parties fatalities 42 40 183 38 ECAC basis Accidents 5 6 5 Total fatalities 114 116 126 On-board fatalities 109 111 122 Third parties fatalities 4 4 4
Note: Generally speaking, total fatalities = on-board fatalities (crew + passengers) + third parties Aviation Safety: third parties = ground fatalities + collision casualties ICAO ADREP: third parties = ground fatalities WAAS: third parties = ground fatalities + other aircraft NLR: third parties = ground fatalities
7 For 2000 the data received is inaccurate as not all States who have submitted reports have contributed data with respect to
accidents and fatal accidents.
735
365
749 721788
83 56122 92 94
0 6 9 20 11 0 2 1 0
0 2 1 1 00 0 1 0 0
0
100
200
300
400
500
600
700
800
1999 2000 2001 2002 2003
Total Fatal ATM DirectTotal Fatal ATM IndirectTotal ATM DirectTotal ATM IndirectTotal FatalTotal
SRC Document 2 – ATM Contribution to Aircraft Accidents / Incidents – Review and Analysis of Historical Data
Edition 4.0 Released Issue Page 30 of 71
In comparing all sources of information (Table 8.1 above), it should be noted that ADREP information contains far more fatal accidents and fatalities on a worldwide basis than the WAAS and NLR databases.
With regard to accidents within the ECAC area, the picture is a different one -accidents and fatalities identified being as numerous in the WAAS database as in ADREP.
The first reason for that is that the ADREP database includes all occurrences involving aircraft with a weight greater than 2.25 tonnes, whereas WAAS and NLR only count occurrences for aircraft with a MTOW heavier than 5.7 tonnes.
One should also note that the comparison is also distorted by a difference in the definition adopted for third parties fatalities. Generally speaking, total fatalities equal on-board fatalities (crew + passengers) and third parties fatalities. For the ASN (Aviation Safety Net), third parties fatalities correspond to ground fatalities plus collision casualties. For the WAAS, third parties fatalities are the sum of ground fatalities and other aircraft fatalities and for ADREP and NLR, third parties fatalities equal ground fatalities.
3.1.6.2 Accident Rates Data
The estimates based on several samples of accidents reveal wide differences as far as accident rates are concerned and do not allow for any conclusion to be drawn from this comparison. The comparison is for the year 2003.
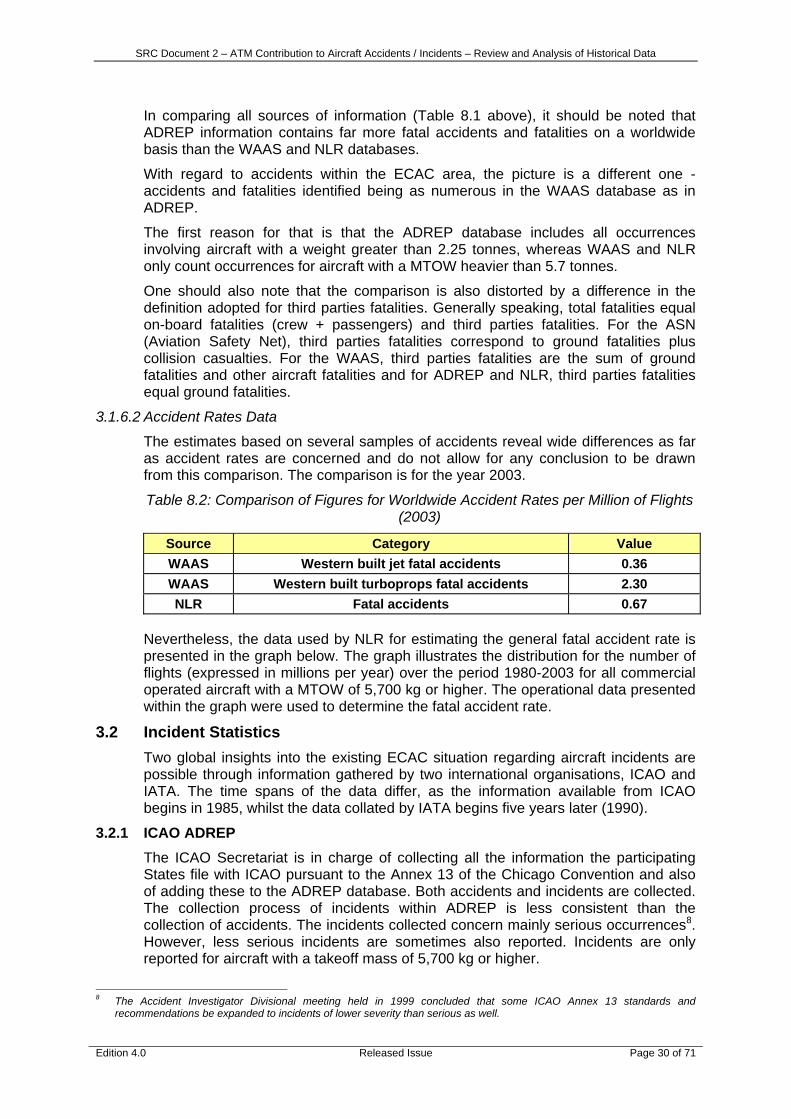
Table 8.2: Comparison of Figures for Worldwide Accident Rates per Million of Flights (2003)
Source Category Value WAAS Western built jet fatal accidents 0.36 WAAS Western built turboprops fatal accidents 2.30 NLR Fatal accidents 0.67
Nevertheless, the data used by NLR for estimating the general fatal accident rate is presented in the graph below. The graph illustrates the distribution for the number of flights (expressed in millions per year) over the period 1980-2003 for all commercial operated aircraft with a MTOW of 5,700 kg or higher. The operational data presented within the graph were used to determine the fatal accident rate.
3.2 Incident Statistics Two global insights into the existing ECAC situation regarding aircraft incidents are possible through information gathered by two international organisations, ICAO and IATA. The time spans of the data differ, as the information available from ICAO begins in 1985, whilst the data collated by IATA begins five years later (1990).
3.2.1 ICAO ADREP The ICAO Secretariat is in charge of collecting all the information the participating States file with ICAO pursuant to the Annex 13 of the Chicago Convention and also of adding these to the ADREP database. Both accidents and incidents are collected. The collection process of incidents within ADREP is less consistent than the collection of accidents. The incidents collected concern mainly serious occurrences8. However, less serious incidents are sometimes also reported. Incidents are only reported for aircraft with a takeoff mass of 5,700 kg or higher.
8 The Accident Investigator Divisional meeting held in 1999 concluded that some ICAO Annex 13 standards and
recommendations be expanded to incidents of lower severity than serious as well.

SRC Document 2 – ATM Contribution to Aircraft Accidents / Incidents – Review and Analysis of Historical Data
Edition 4.0 Released Issue Page 31 of 71
33 of the 41 ECAC States submitted incident data to ICAO. However, two ECAC States (Germany and the United Kingdom) alone filed 51% of the total number of incident reports over the period. The amount of reports from some countries was considered low compared to the number of flight operations conducted in these countries. As indicated earlier, this is mainly caused by the inconsistent reporting of incidents by the different ECAC countries. For this reason, a breakdown by country is not considered valid and is not shown in this report. Table 9.1 shows the annual breakdown of the 809 (serious) incidents that occurred in the ECAC states between 1989 and 2003. The change in the annual number of reported incidents tends to follow the same trend in the number of annual flight operations. Meaning that the change in the number of incidents can be related to the change in traffic. However this conclusion only holds true if the reporting bias is the same over the analysed period.
Table 9.1: Serious Incidents (ATS-related or not) Reported within ECAC Area over the Period 1989-2003
1989 1990 1991 1992 1993 1994 1995 1996 1997 1998 1999 2000 2001 2002 2003 TotalSerious Incidents 20 20 23 36 40 33 48 61 70 66 65 80 74 92 81 809
Note: fixed-wing aircraft, no military aircraft Source: ICAO ADREP accident/incident database
A selection of ATM-related events has been made in the 809 reported incidents. These are generally classified as ‘loss of separation’, near CFIT’, and ‘runway incursion’. The total number of ATM-related events over the period 1989-2003 amounts to 173 events (table 9.2). Care should be taken when analysing the numbers in table 9.2 due to the reporting bias already mentioned.
Table 9.2: Loss of Separation, Near CFIT, Runway Incursions Reported Within ECAC Area Over the Period 1989–2003
Incidents involving fixed wing aircraft 1989 1990 1991 1992 1993 1994 1995 1996 1997 1998 1999 2000 2001 2002 2003 TotalAIRCRAFT NEAR COLLISION-BOTH AIRBORNE 5 4 2 1 5 5 5 1 2 2 5 37 AIRCRAFT NEAR COLLISION-BOTH ON GROUND 1 3 2 2 8 AIRCRAFT NEAR COLLISION-ONE AIRBORNE 1 1 1 3
ALTITUDE BUST 1 3 1 5 ATC RELATED EVENT 2 1 1 4 CLEARANCE RELATED EVENT 1 1 1 3 LOSS OF SEPARATION-NO RISK OF COLLISION 2 1 1 4 LOSS OF SEPARATION-POSSIBLE RISK OF COLLISION 1 5 1 4 2 2 4 19
NAVIGATION ERROR - OTHER 1 1 1 3 NAVIGATION ERROR - TRACK ERROR 1 1
NEAR COLLISION 1 7 2 5 16 18 49 NEAR COLLISION WITH RUNWAY/TAXIWAY 1 1 RUNWAY INCURSION - BY AIRCRAFT 1 3 1 5 RUNWAY INCURSION - BY EQUIPMENT 1 1 RUNWAY INCURSION - BY VEHICLE 1 1 1 3
SYSTEM FAILURE-OTHER 1 1 TCAS/ACAS ADVISORY 7 2 3 1 13 TOO CLOSE TO GROUND 3 3 UNDERSHOOT 1 1 1 1 1 5 UNSTABILIZED APPROACH 1 1 1 1 1 5 Total 2 6 5 2 7 1 9 8 12 8 15 23 15 31 29 173
SRC Document 2 – ATM Contribution to Aircraft Accidents / Incidents – Review and Analysis of Historical Data
Edition 4.0 Released Issue Page 32 of 71
3.2.2 IATA Incident Database* The IATA data concern all incident reports filed on a voluntary basis by IATA member airlines. For the last 3 years, approximately 55 airlines have been reporting incidents that are mainly air proximity incidents12. All categories of these incidents (risk categories A, B, C and D) are included (table 10). The number of incidents reported is quite equivalent to the level reached in 1998, but the number of reporting airlines is slowing down (from 60 to 55 reporting airlines).
Table 10: AIRPROX Occurred Within ECAC Area Reported by IATA Members Over the Period 1990-1998
1990 1991 1992 1993 1994 1995 1996 1997 1998 1999 Total Airprox 239 185 179 184 215 219 202 217 327 310 2277 Number of reporting airlines 51 55 56 65 60 63 66 62 54 47
Number of IATA members 189 200 206 215 224 232 239 255 255 266
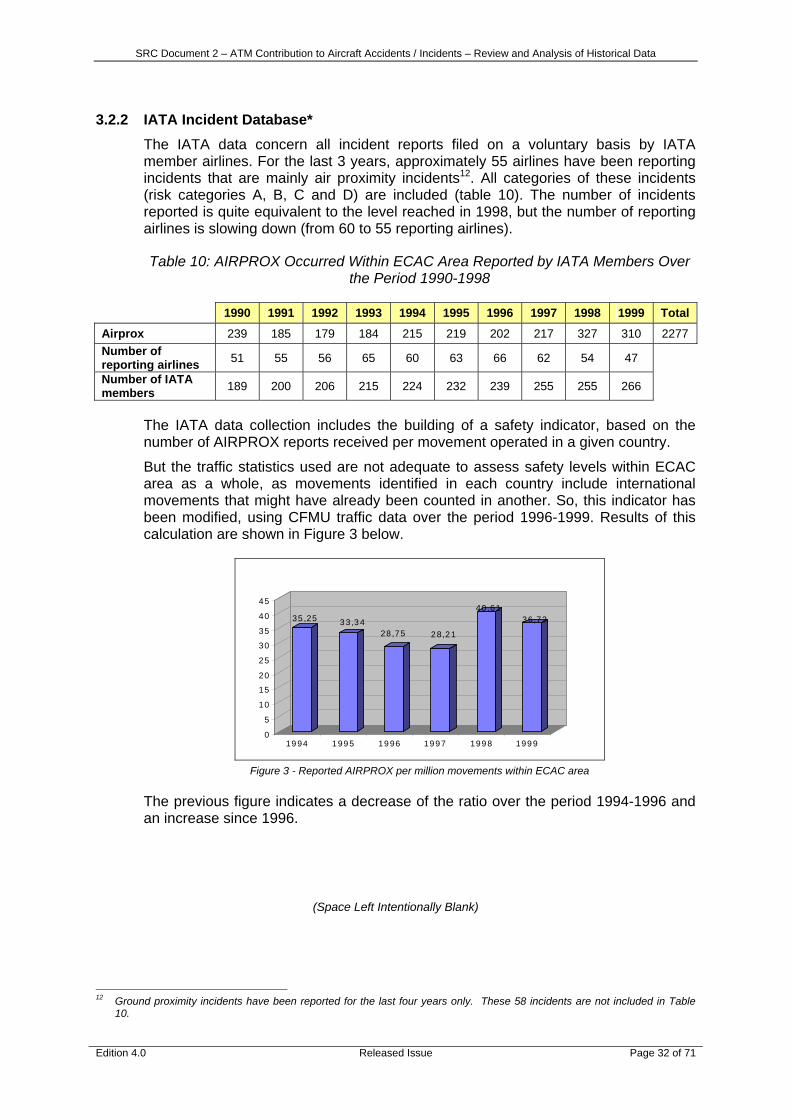
The IATA data collection includes the building of a safety indicator, based on the number of AIRPROX reports received per movement operated in a given country.
But the traffic statistics used are not adequate to assess safety levels within ECAC area as a whole, as movements identified in each country include international movements that might have already been counted in another. So, this indicator has been modified, using CFMU traffic data over the period 1996-1999. Results of this calculation are shown in Figure 3 below.
35 ,25 3 3,3 428,75 2 8,2 1
40 ,6136,72
0
5
10
15
20
25
30
35
40
45
19 94 1 99 5 19 96 1997 199 8 199 9
Figure 3 - Reported AIRPROX per million movements within ECAC area
The previous figure indicates a decrease of the ratio over the period 1994-1996 and an increase since 1996.
(Space Left Intentionally Blank)
12 Ground proximity incidents have been reported for the last four years only. These 58 incidents are not included in Table
10.
SRC Document 2 – ATM Contribution to Aircraft Accidents / Incidents – Review and Analysis of Historical Data
Edition 4.0 Released Issue Page 33 of 71
3.2.3 Incident Data Collected by EUROCONTROL 3.2.3.1 Reports
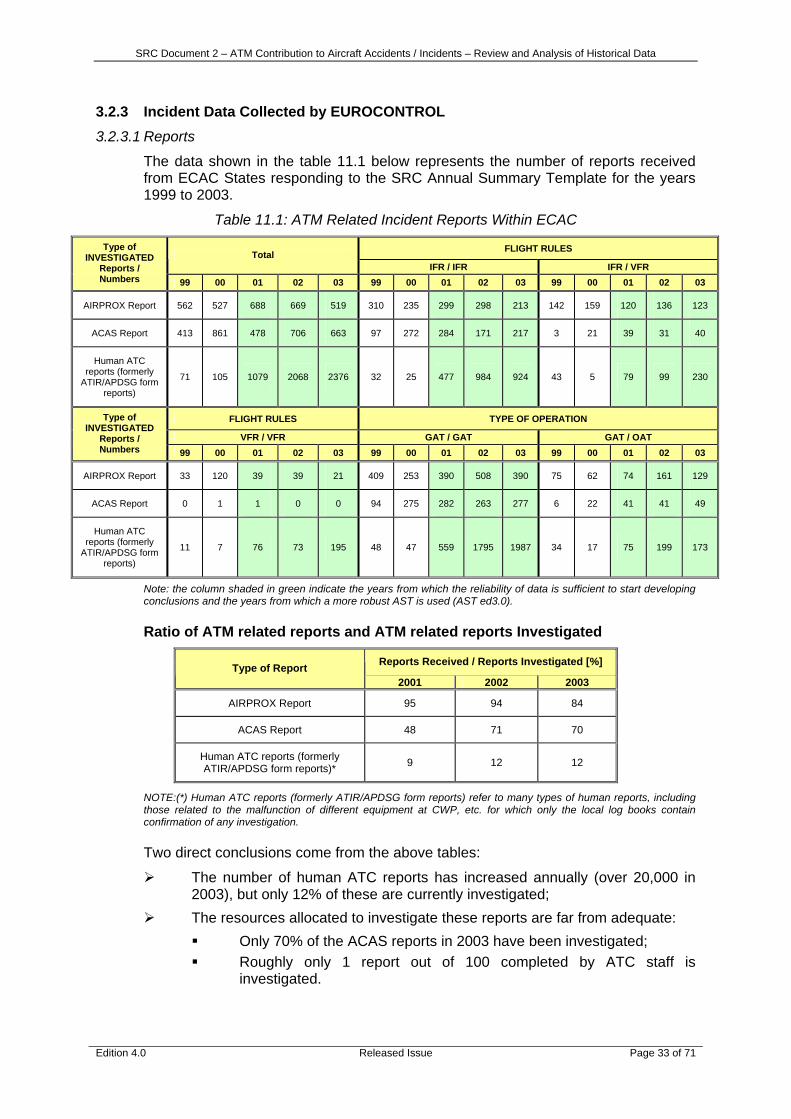
The data shown in the table 11.1 below represents the number of reports received from ECAC States responding to the SRC Annual Summary Template for the years 1999 to 2003.
Table 11.1: ATM Related Incident Reports Within ECAC
FLIGHT RULES Total IFR / IFR IFR / VFR
Type of INVESTIGATED
Reports / Numbers 99 00 01 02 03 99 00 01 02 03 99 00 01 02 03
AIRPROX Report 562 527 688 669 519 310 235 299 298 213 142 159 120 136 123
ACAS Report 413 861 478 706 663 97 272 284 171 217 3 21 39 31 40
Human ATC reports (formerly
ATIR/APDSG form reports)
71 105 1079 2068 2376 32 25 477 984 924 43 5 79 99 230
FLIGHT RULES TYPE OF OPERATION
VFR / VFR GAT / GAT GAT / OAT
Type of INVESTIGATED
Reports / Numbers 99 00 01 02 03 99 00 01 02 03 99 00 01 02 03
AIRPROX Report 33 120 39 39 21 409 253 390 508 390 75 62 74 161 129
ACAS Report 0 1 1 0 0 94 275 282 263 277 6 22 41 41 49
Human ATC reports (formerly
ATIR/APDSG form reports)
11 7 76 73 195 48 47 559 1795 1987 34 17 75 199 173
Note: the column shaded in green indicate the years from which the reliability of data is sufficient to start developing conclusions and the years from which a more robust AST is used (AST ed3.0).
Ratio of ATM related reports and ATM related reports Investigated
Reports Received / Reports Investigated [%] Type of Report 2001 2002 2003
AIRPROX Report 95 94 84
ACAS Report 48 71 70
Human ATC reports (formerly ATIR/APDSG form reports)* 9 12 12
NOTE:(*) Human ATC reports (formerly ATIR/APDSG form reports) refer to many types of human reports, including those related to the malfunction of different equipment at CWP, etc. for which only the local log books contain confirmation of any investigation.
Two direct conclusions come from the above tables:
The number of human ATC reports has increased annually (over 20,000 in 2003), but only 12% of these are currently investigated;
The resources allocated to investigate these reports are far from adequate: Only 70% of the ACAS reports in 2003 have been investigated; Roughly only 1 report out of 100 completed by ATC staff is
investigated.
SRC Document 2 – ATM Contribution to Aircraft Accidents / Incidents – Review and Analysis of Historical Data
Edition 4.0 Released Issue Page 34 of 71
3.2.3.2 Reported ATM-Related Incidents
A categorisation of incidents reported is available and presented in the table 11.2. The values in parenthesis represents the number of reports providing data: in the table heading 2001(25) indicated that in 2001 aggregated statistics have been built up from 25 reports, and Runway incursion 223(16) indicates that 16 reports out of 24 have mentioned this type of indicator and the total sum from 16 reports is 223 incidents.
Table 11.2: Categorisation of Incidents Reported
TOTAL INCIDENTS 1999
(24) 2000 (25)
2001 (25)
2002 (27)
2003 (29)
Separation minima infringement 975(17) 987(20) 970(21) 824(20) 780(20)
Inadequate separation 78(9) 95(12) 167(18) 174(14) 176(16) Near Controlled Flight Into Terrain(CFIT) 6(2) 1(1) 6(2) 23(5) 24(3)
Runway excursion by aircraft 2(2) 8(4) 10(6) 9(5) 9(6)
Aircraft deviations from applicable ATM regulations
7(2) 758(12) 1031(15) 1431(16) 1104(14)
Aircraft deviations from applicable published ATM procedures
30(6) 29(9) 104(13) 89(14) 219(10)
Aircraft deviations from ATM clearance 164(6) 623(16) 900(20) 1199(21) 979(19)
Unauthorised penetration of airspace 511(9) 488(13) 657(18) 1232(16) 1091(19)
Runway Incursion 56(13) 99(14) 223(16) 211(14) 351(14)
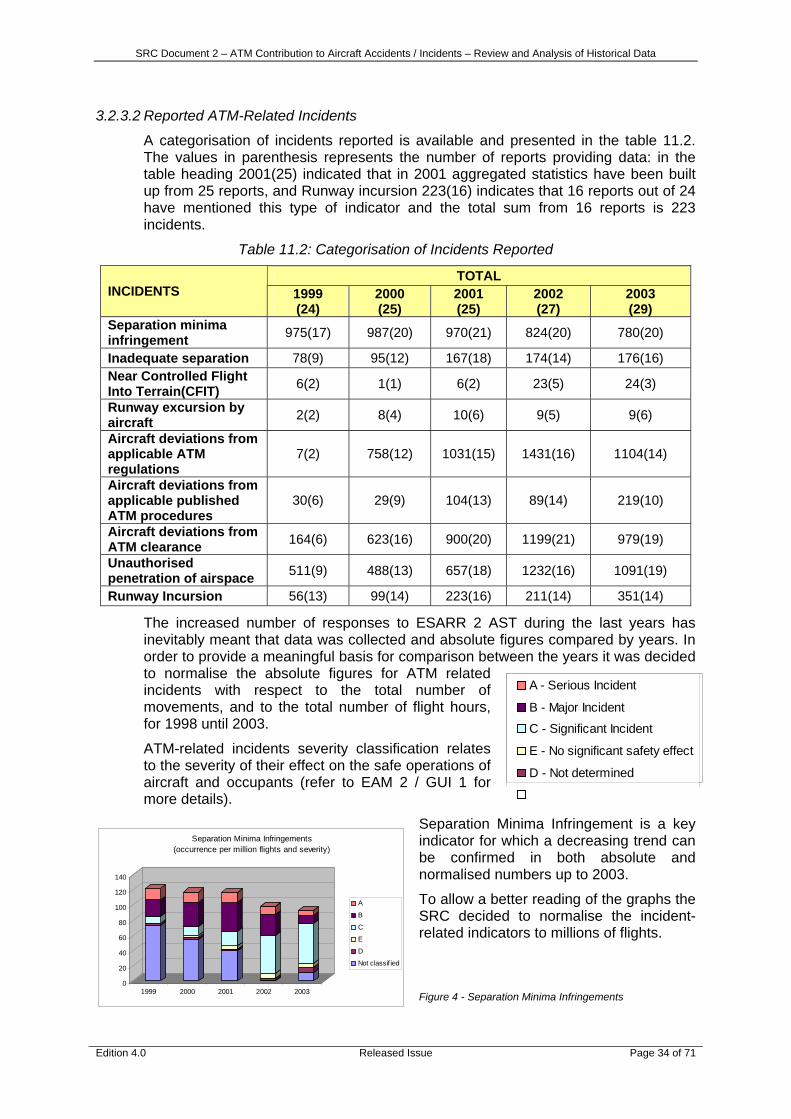
The increased number of responses to ESARR 2 AST during the last years has inevitably meant that data was collected and absolute figures compared by years. In order to provide a meaningful basis for comparison between the years it was decided to normalise the absolute figures for ATM related incidents with respect to the total number of movements, and to the total number of flight hours, for 1998 until 2003.
ATM-related incidents severity classification relates to the severity of their effect on the safe operations of aircraft and occupants (refer to EAM 2 / GUI 1 for more details).
Separation Minima Infringement is a key indicator for which a decreasing trend can be confirmed in both absolute and normalised numbers up to 2003.
To allow a better reading of the graphs the SRC decided to normalise the incident-related indicators to millions of flights.
Figure 4 - Separation Minima Infringements
A - Serious Incident
B - Major Incident
C - Significant Incident
E - No significant safety effect
D - Not determined
0
20
40
60
80
100
120
140
1999 2000 2001 2002 2003
Separation Minima Infringements(occurrence per million flights and severity)
A
B
C
E
D
Not classif ied
SRC Document 2 – ATM Contribution to Aircraft Accidents / Incidents – Review and Analysis of Historical Data
Edition 4.0 Released Issue Page 35 of 71
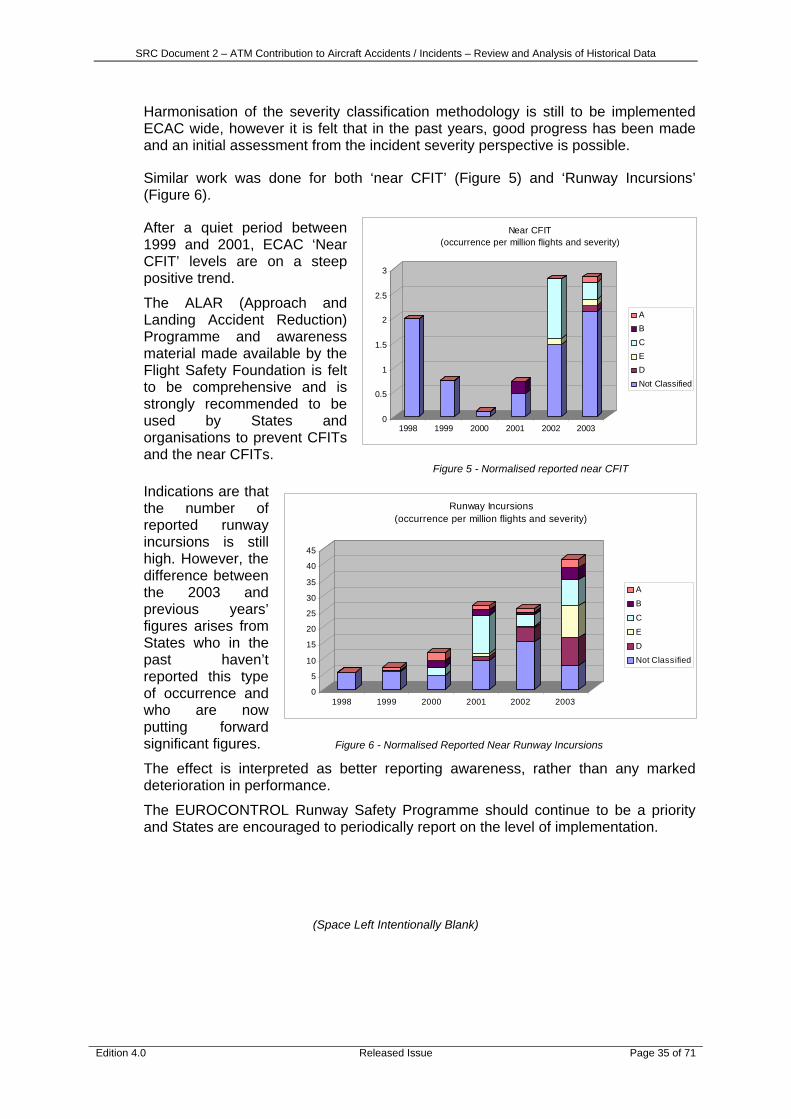
Harmonisation of the severity classification methodology is still to be implemented ECAC wide, however it is felt that in the past years, good progress has been made and an initial assessment from the incident severity perspective is possible.
Similar work was done for both ‘near CFIT’ (Figure 5) and ‘Runway Incursions’ (Figure 6).
After a quiet period between 1999 and 2001, ECAC ‘Near CFIT’ levels are on a steep positive trend.
The ALAR (Approach and Landing Accident Reduction) Programme and awareness material made available by the Flight Safety Foundation is felt to be comprehensive and is strongly recommended to be used by States and organisations to prevent CFITs and the near CFITs.
Figure 5 - Normalised reported near CFIT
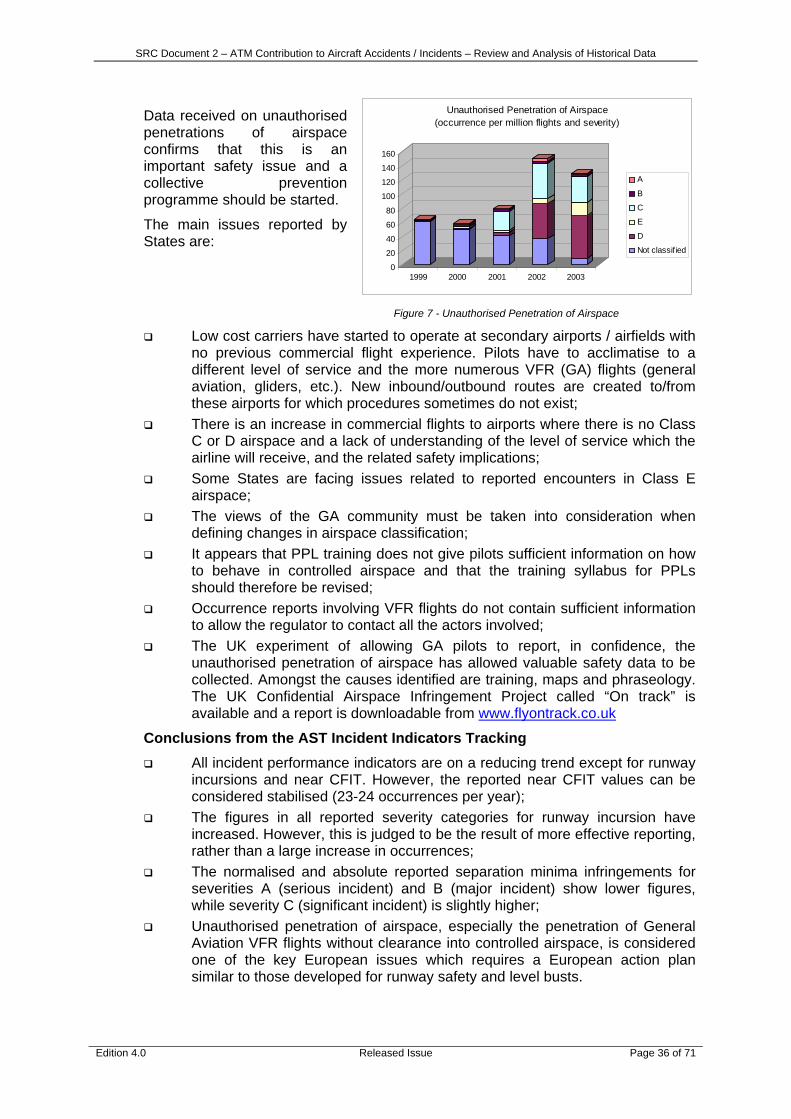
Indications are that the number of reported runway incursions is still high. However, the difference between the 2003 and previous years’ figures arises from States who in the past haven’t reported this type of occurrence and who are now putting forward significant figures. Figure 6 - Normalised Reported Near Runway Incursions The effect is interpreted as better reporting awareness, rather than any marked deterioration in performance.
The EUROCONTROL Runway Safety Programme should continue to be a priority and States are encouraged to periodically report on the level of implementation.
(Space Left Intentionally Blank)
0
5
10
15
20
25
30
35
40
45
1998 1999 2000 2001 2002 2003
Runway Incursions(occurrence per million flights and severity)
A
B
C
E
D
Not Classified
0
0.5
1
1.5
2
2.5
3
1998 1999 2000 2001 2002 2003
Near CFIT (occurrence per million flights and severity)
ABCEDNot Classified
SRC Document 2 – ATM Contribution to Aircraft Accidents / Incidents – Review and Analysis of Historical Data
Edition 4.0 Released Issue Page 36 of 71
Data received on unauthorised penetrations of airspace confirms that this is an important safety issue and a collective prevention programme should be started.
The main issues reported by States are:
Figure 7 - Unauthorised Penetration of Airspace
Low cost carriers have started to operate at secondary airports / airfields with no previous commercial flight experience. Pilots have to acclimatise to a different level of service and the more numerous VFR (GA) flights (general aviation, gliders, etc.). New inbound/outbound routes are created to/from these airports for which procedures sometimes do not exist;
There is an increase in commercial flights to airports where there is no Class C or D airspace and a lack of understanding of the level of service which the airline will receive, and the related safety implications;
Some States are facing issues related to reported encounters in Class E airspace;
The views of the GA community must be taken into consideration when defining changes in airspace classification;
It appears that PPL training does not give pilots sufficient information on how to behave in controlled airspace and that the training syllabus for PPLs should therefore be revised;
Occurrence reports involving VFR flights do not contain sufficient information to allow the regulator to contact all the actors involved;
The UK experiment of allowing GA pilots to report, in confidence, the unauthorised penetration of airspace has allowed valuable safety data to be collected. Amongst the causes identified are training, maps and phraseology. The UK Confidential Airspace Infringement Project called “On track” is available and a report is downloadable from www.flyontrack.co.uk
Conclusions from the AST Incident Indicators Tracking All incident performance indicators are on a reducing trend except for runway
incursions and near CFIT. However, the reported near CFIT values can be considered stabilised (23-24 occurrences per year);
The figures in all reported severity categories for runway incursion have increased. However, this is judged to be the result of more effective reporting, rather than a large increase in occurrences;
The normalised and absolute reported separation minima infringements for severities A (serious incident) and B (major incident) show lower figures, while severity C (significant incident) is slightly higher;
Unauthorised penetration of airspace, especially the penetration of General Aviation VFR flights without clearance into controlled airspace, is considered one of the key European issues which requires a European action plan similar to those developed for runway safety and level busts.
0
20
40
60
80
100
120
140
160
1999 2000 2001 2002 2003
Unauthorised Penetration of Airspace(occurrence per million flights and severity)
A
B
C
E
D
Not classified
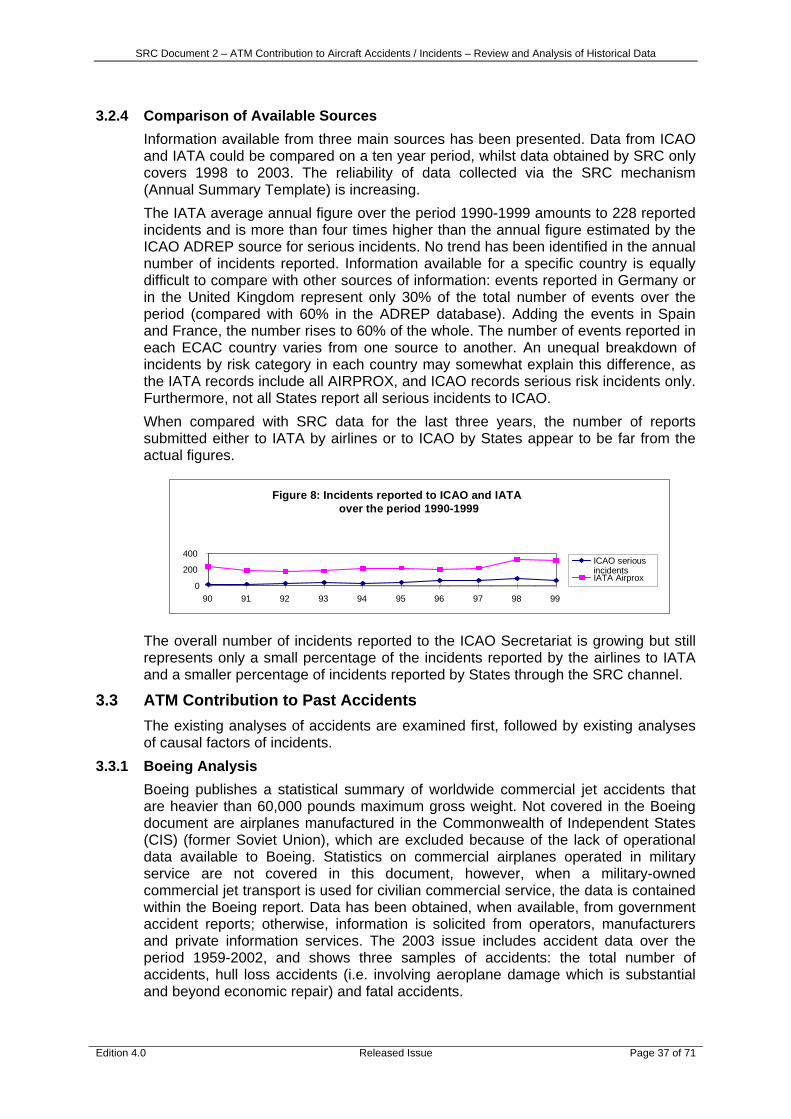
SRC Document 2 – ATM Contribution to Aircraft Accidents / Incidents – Review and Analysis of Historical Data
Edition 4.0 Released Issue Page 37 of 71
3.2.4 Comparison of Available Sources Information available from three main sources has been presented. Data from ICAO and IATA could be compared on a ten year period, whilst data obtained by SRC only covers 1998 to 2003. The reliability of data collected via the SRC mechanism (Annual Summary Template) is increasing. The IATA average annual figure over the period 1990-1999 amounts to 228 reported incidents and is more than four times higher than the annual figure estimated by the ICAO ADREP source for serious incidents. No trend has been identified in the annual number of incidents reported. Information available for a specific country is equally difficult to compare with other sources of information: events reported in Germany or in the United Kingdom represent only 30% of the total number of events over the period (compared with 60% in the ADREP database). Adding the events in Spain and France, the number rises to 60% of the whole. The number of events reported in each ECAC country varies from one source to another. An unequal breakdown of incidents by risk category in each country may somewhat explain this difference, as the IATA records include all AIRPROX, and ICAO records serious risk incidents only. Furthermore, not all States report all serious incidents to ICAO. When compared with SRC data for the last three years, the number of reports submitted either to IATA by airlines or to ICAO by States appear to be far from the actual figures.
Figure 8: Incidents reported to ICAO and IATA over the period 1990-1999
0 200 400
90 91 92 93 94 95 96 97 98 99
ICAO serious incidents IATA Airprox
The overall number of incidents reported to the ICAO Secretariat is growing but still represents only a small percentage of the incidents reported by the airlines to IATA and a smaller percentage of incidents reported by States through the SRC channel.
3.3 ATM Contribution to Past Accidents The existing analyses of accidents are examined first, followed by existing analyses of causal factors of incidents.
3.3.1 Boeing Analysis Boeing publishes a statistical summary of worldwide commercial jet accidents that are heavier than 60,000 pounds maximum gross weight. Not covered in the Boeing document are airplanes manufactured in the Commonwealth of Independent States (CIS) (former Soviet Union), which are excluded because of the lack of operational data available to Boeing. Statistics on commercial airplanes operated in military service are not covered in this document, however, when a military-owned commercial jet transport is used for civilian commercial service, the data is contained within the Boeing report. Data has been obtained, when available, from government accident reports; otherwise, information is solicited from operators, manufacturers and private information services. The 2003 issue includes accident data over the period 1959-2002, and shows three samples of accidents: the total number of accidents, hull loss accidents (i.e. involving aeroplane damage which is substantial and beyond economic repair) and fatal accidents.

SRC Document 2 – ATM Contribution to Aircraft Accidents / Incidents – Review and Analysis of Historical Data
Edition 4.0 Released Issue Page 38 of 71
The most significant information relates to the identified causal factors. Primary causal factors linked to "airport and ATC" are presented altogether as a percentage of all accidents (Table 12.1). Five other factors were allocated: flight crew, airplane, maintenance, weather and miscellaneous. An additional calculation estimates the contribution of accidents due to "airport and ATC" to accidents with all known causes to facilitate comparison with other samples where accidents with insufficient information were not included in the analysis of causal factors.
Table 12.1: Airport and ATC as Primary Cause to Aircraft Accidents
Hull losses 1959-1994 1985-1994 1993-2002
Airport/ATC 19 6 4 Total with known causes 446 132 139 Total 536 186 198 % of total with known causes 4.3% 4.5% 2.9% % of total accidents 3.5% 3.2% 2.0%
According to this analysis, accidents due to ‘Airport and ATC’ represent 4·3% of hull loss accidents over the period 1959-1994. For the period 1985-1994 this share is almost the same (4·5%). For a more recent period covering the years 1993 through 2002, accidents due to Airport and ATC represent 2·9% of all hull loss accidents. Since only a limited number of hull accidents were attributed to the 'Airport and ATC' causal factor, great care should be taken when considering these results
Table 12.2: Airport and ATC as Primary Causes to Aircraft Accidents at Different Phases of Flight over the Period 1959-1994
Take-off Initial climb Climb Cruise Descent Initial
approachFinal
approach Landing Taxi Load
All accidents 0.3% 3.9% 2.7% 8.6% 4.8% 1.5% 2.0% 5.2% 10.2%
Hull loss 6.7% 2.3% 5.7% 5.7% 4.8% 3.3% 2.1% 14.3% 4.5%
Fatal accidents 6.7% 2.3% 5.7% 5.7% 4.8% 1.7% 4.2% 17.1% 9.1%
Table 12.2 shows the key flight phases. It can be seen that landing is the most critical phase in the three samples. When all accidents are considered, however, the taxi, cruise and take-off phases are also significant. For fatal accidents on the other hand, final approach and take-off phases are the most prominent phases.
Similar information with regard to the ECAC area could not unfortunately possibly be obtained.
3.3.2 UK CAA Analysis 3.3.2.1 ATM Contribution
To highlight the causes of worldwide accidents over the period 1980-2001, the UK CAA has sorted data from the WAAS on fatal accidents. From the study made (820 events studied), ATM contribution can be evaluated. On average, 2·5 causal factors have been attributed to each accident. The same estimate was made for the ECAC sample of accidents (98 accident reports). The results of this study are shown below (Tables 13 and 14).
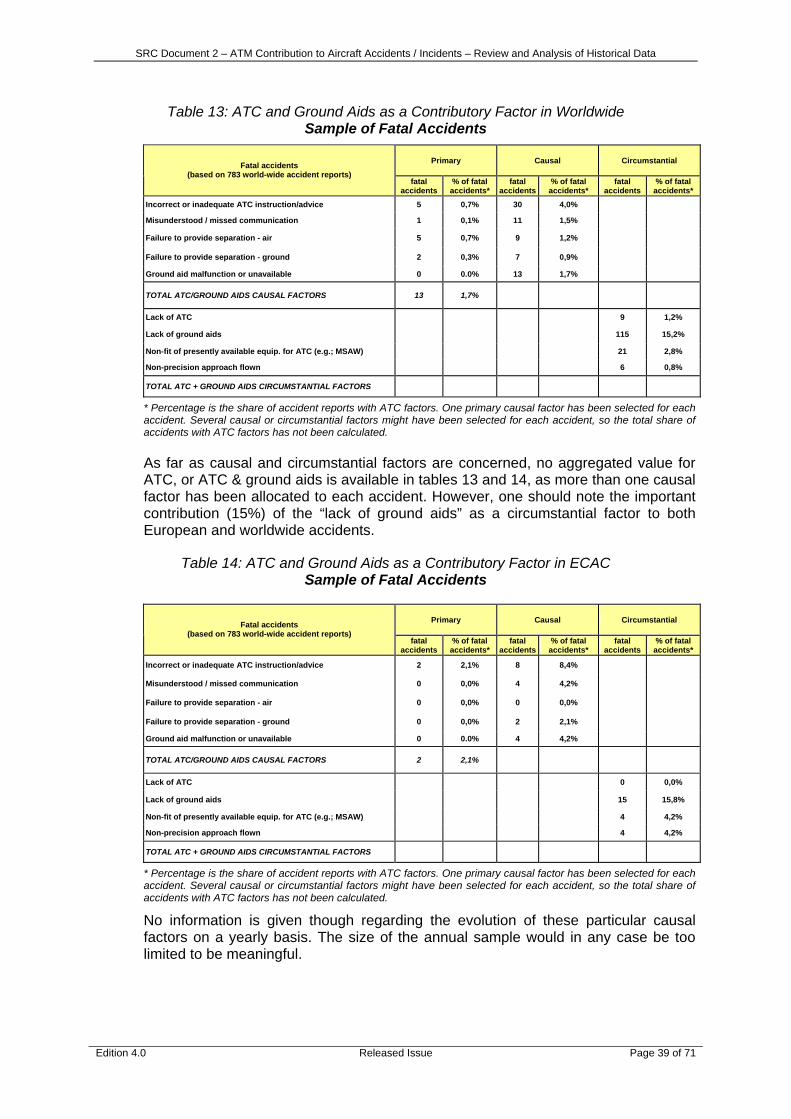
SRC Document 2 – ATM Contribution to Aircraft Accidents / Incidents – Review and Analysis of Historical Data
Edition 4.0 Released Issue Page 39 of 71
Table 13: ATC and Ground Aids as a Contributory Factor in Worldwide Sample of Fatal Accidents
Primary Causal Circumstantial Fatal accidents (based on 783 world-wide accident reports)
fatal accidents
% of fatal accidents*
fatal accidents
% of fatal accidents*
fatal accidents
% of fatal accidents*
Incorrect or inadequate ATC instruction/advice 5 0,7% 30 4,0%
Misunderstood / missed communication 1 0,1% 11 1,5%
Failure to provide separation - air 5 0,7% 9 1,2%
Failure to provide separation - ground 2 0,3% 7 0,9%
Ground aid malfunction or unavailable 0 0.0% 13 1,7%
TOTAL ATC/GROUND AIDS CAUSAL FACTORS 13 1,7%
Lack of ATC 9 1,2%
Lack of ground aids 115 15,2%
Non-fit of presently available equip. for ATC (e.g.; MSAW) 21 2,8%
Non-precision approach flown 6 0,8%
TOTAL ATC + GROUND AIDS CIRCUMSTANTIAL FACTORS
* Percentage is the share of accident reports with ATC factors. One primary causal factor has been selected for each accident. Several causal or circumstantial factors might have been selected for each accident, so the total share of accidents with ATC factors has not been calculated.
As far as causal and circumstantial factors are concerned, no aggregated value for ATC, or ATC & ground aids is available in tables 13 and 14, as more than one causal factor has been allocated to each accident. However, one should note the important contribution (15%) of the “lack of ground aids” as a circumstantial factor to both European and worldwide accidents.
Table 14: ATC and Ground Aids as a Contributory Factor in ECAC Sample of Fatal Accidents
Primary Causal Circumstantial Fatal accidents (based on 783 world-wide accident reports)
fatal accidents
% of fatal accidents*
fatal accidents
% of fatal accidents*
fatal accidents
% of fatal accidents*
Incorrect or inadequate ATC instruction/advice 2 2,1% 8 8,4%
Misunderstood / missed communication 0 0,0% 4 4,2%
Failure to provide separation - air 0 0,0% 0 0,0%
Failure to provide separation - ground 0 0,0% 2 2,1%
Ground aid malfunction or unavailable 0 0.0% 4 4,2%
TOTAL ATC/GROUND AIDS CAUSAL FACTORS 2 2,1%
Lack of ATC 0 0,0%
Lack of ground aids 15 15,8%
Non-fit of presently available equip. for ATC (e.g.; MSAW) 4 4,2%
Non-precision approach flown 4 4,2%
TOTAL ATC + GROUND AIDS CIRCUMSTANTIAL FACTORS
* Percentage is the share of accident reports with ATC factors. One primary causal factor has been selected for each accident. Several causal or circumstantial factors might have been selected for each accident, so the total share of accidents with ATC factors has not been calculated.
No information is given though regarding the evolution of these particular causal factors on a yearly basis. The size of the annual sample would in any case be too limited to be meaningful.
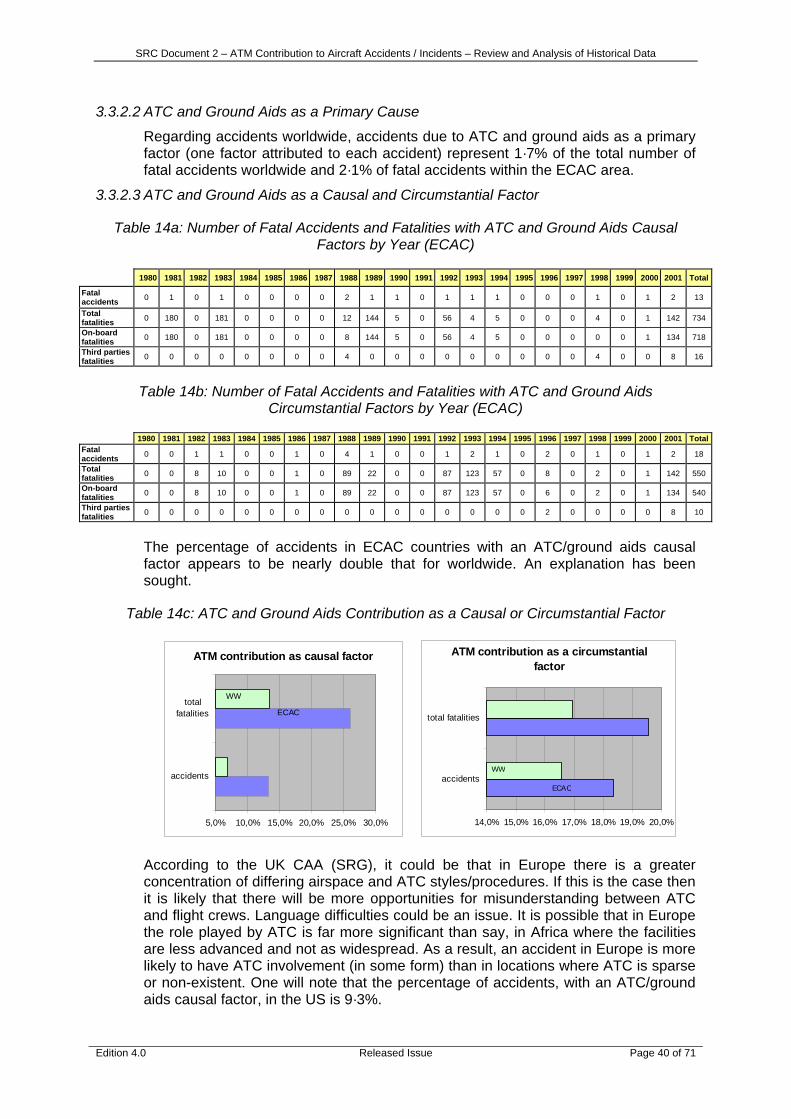
SRC Document 2 – ATM Contribution to Aircraft Accidents / Incidents – Review and Analysis of Historical Data
Edition 4.0 Released Issue Page 40 of 71
3.3.2.2 ATC and Ground Aids as a Primary Cause
Regarding accidents worldwide, accidents due to ATC and ground aids as a primary factor (one factor attributed to each accident) represent 1·7% of the total number of fatal accidents worldwide and 2·1% of fatal accidents within the ECAC area.
3.3.2.3 ATC and Ground Aids as a Causal and Circumstantial Factor
Table 14a: Number of Fatal Accidents and Fatalities with ATC and Ground Aids Causal Factors by Year (ECAC)
1980 1981 1982 1983 1984 1985 1986 1987 1988 1989 1990 1991 1992 1993 1994 1995 1996 1997 1998 1999 2000 2001 Total
Fatal accidents 0 1 0 1 0 0 0 0 2 1 1 0 1 1 1 0 0 0 1 0 1 2 13
Total fatalities 0 180 0 181 0 0 0 0 12 144 5 0 56 4 5 0 0 0 4 0 1 142 734
On-board fatalities 0 180 0 181 0 0 0 0 8 144 5 0 56 4 5 0 0 0 0 0 1 134 718
Third parties fatalities 0 0 0 0 0 0 0 0 4 0 0 0 0 0 0 0 0 0 4 0 0 8 16
Table 14b: Number of Fatal Accidents and Fatalities with ATC and Ground Aids Circumstantial Factors by Year (ECAC)
1980 1981 1982 1983 1984 1985 1986 1987 1988 1989 1990 1991 1992 1993 1994 1995 1996 1997 1998 1999 2000 2001 TotalFatal accidents 0 0 1 1 0 0 1 0 4 1 0 0 1 2 1 0 2 0 1 0 1 2 18
Total fatalities 0 0 8 10 0 0 1 0 89 22 0 0 87 123 57 0 8 0 2 0 1 142 550
On-board fatalities 0 0 8 10 0 0 1 0 89 22 0 0 87 123 57 0 6 0 2 0 1 134 540
Third parties fatalities 0 0 0 0 0 0 0 0 0 0 0 0 0 0 0 0 2 0 0 0 0 8 10
The percentage of accidents in ECAC countries with an ATC/ground aids causal factor appears to be nearly double that for worldwide. An explanation has been sought.
Table 14c: ATC and Ground Aids Contribution as a Causal or Circumstantial Factor
ATM contribution as causal factor
5,0% 10,0% 15,0% 20,0% 25,0% 30,0%
accidents
totalfatalities
WW
ECAC
ATM contribution as a circumstantial factor
14,0% 15,0% 16,0% 17,0% 18,0% 19,0% 20,0%
accidents
total fatalities
ECAC
WW
According to the UK CAA (SRG), it could be that in Europe there is a greater concentration of differing airspace and ATC styles/procedures. If this is the case then it is likely that there will be more opportunities for misunderstanding between ATC and flight crews. Language difficulties could be an issue. It is possible that in Europe the role played by ATC is far more significant than say, in Africa where the facilities are less advanced and not as widespread. As a result, an accident in Europe is more likely to have ATC involvement (in some form) than in locations where ATC is sparse or non-existent. One will note that the percentage of accidents, with an ATC/ground aids causal factor, in the US is 9·3%.

SRC Document 2 – ATM Contribution to Aircraft Accidents / Incidents – Review and Analysis of Historical Data
Edition 4.0 Released Issue Page 41 of 71
3.3.3 Flight Safety Foundation Analysis A worldwide sample similar to that analysed by the UK CAA was used once more by the Flight Safety Foundation to establish the results for approach and landing accidents (ALAs). In this context, and when considering Western built jets, ATC factors are identified as the primary causal factors in 2·2% of cases, which appears to be more significant.
Table 15.1: ATC and Ground Aids as a Contributory Factor in Fatal Accidents During Approach and Landing – Jets
Primary Causal Circumstantial ALAs (based on 92 accident reports on Western-built jets) Fatal
ALAs % of fatal
ALAs Fatal ALAs
% of fatal ALAs
Fatal ALAs
% of fatal ALAs
Incorrect or inadequate ATC instruction/advice 1 0.1% 10 10.9%
Misunderstood / missed communication 0 0.0% 4 4.3%
Failure to provide separation - air 0 0.0% 2 2.2%
Failure to provide separation - ground 1 1.1% 2 2.2%
TOTAL ATC 2 2.2%
Ground aid malfunction or unavailable 0 0.0% 2 2.2% 23 25.0%
TOTAL ATC + GROUND AIDS 2 2.2%
No ATC primary factor was found when considering ALAs involving Western turboprops.
On average, 3·1 causal factors per accident were allocated to the ALAs involving jets and 2.8 to the ALAs involving turboprops.
Table 15.2: ATC and Ground Aids as a Contributory Factor in Fatal Accidents During Approach and Landing - Turboprops
Primary Causal Circumstantial ALAs (based on 92 accident reports on Western-built turboprops) Fatal
ALAs % of fatal
ALAs Fatal ALAs
% of fatal ALAs
Fatal ALAs
% of fatal ALAs
Incorrect or inadequate ATC instruction/advice 0 0.0% 4 4.8%
Misunderstood / missed communication 0 0.0% 1 1.2%
Failure to provide separation - air 0 0.0% 1 1.2%
Failure to provide separation - ground 0 0.0% 1 1.2%
TOTAL ATC 0 0.0%
Ground aid malfunction or unavailable 0 0.0% 2 2.4% 22 26.2%
TOTAL ATC + GROUND AIDS 0 0.0%
(Space Left Intentionally Blank)
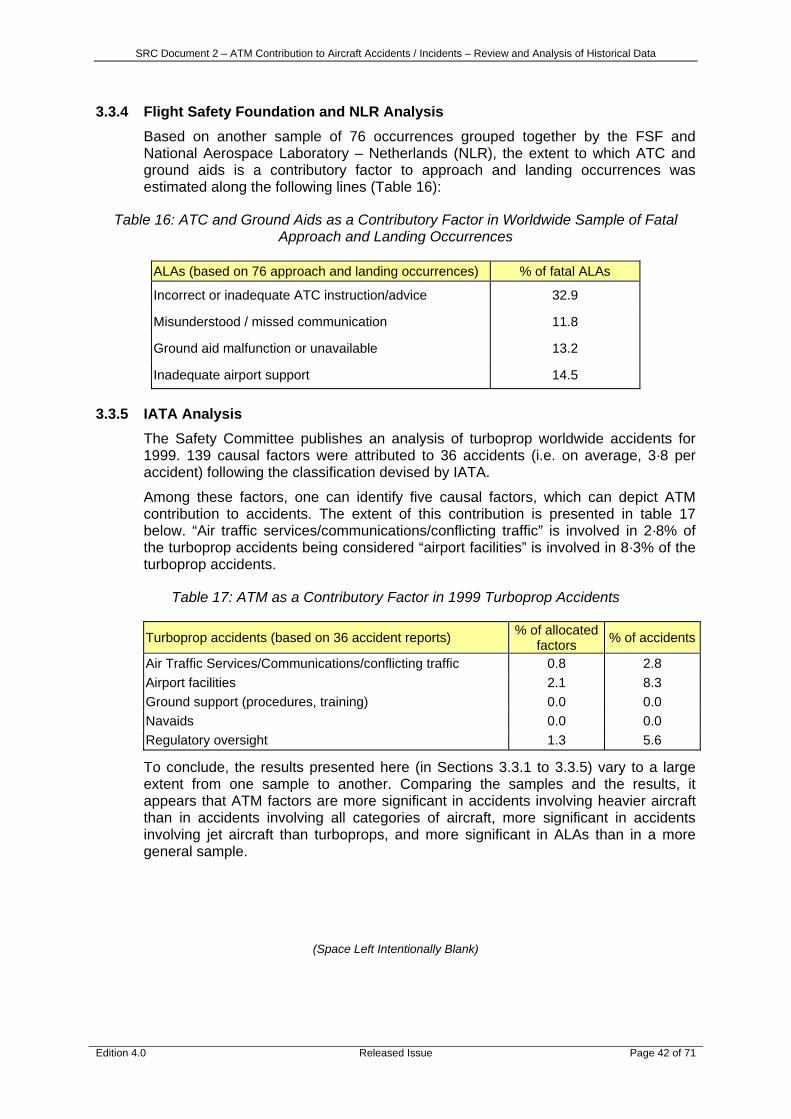
SRC Document 2 – ATM Contribution to Aircraft Accidents / Incidents – Review and Analysis of Historical Data
Edition 4.0 Released Issue Page 42 of 71
3.3.4 Flight Safety Foundation and NLR Analysis Based on another sample of 76 occurrences grouped together by the FSF and National Aerospace Laboratory – Netherlands (NLR), the extent to which ATC and ground aids is a contributory factor to approach and landing occurrences was estimated along the following lines (Table 16):
Table 16: ATC and Ground Aids as a Contributory Factor in Worldwide Sample of Fatal Approach and Landing Occurrences
ALAs (based on 76 approach and landing occurrences) % of fatal ALAs
Incorrect or inadequate ATC instruction/advice 32.9
Misunderstood / missed communication 11.8
Ground aid malfunction or unavailable 13.2
Inadequate airport support 14.5
3.3.5 IATA Analysis The Safety Committee publishes an analysis of turboprop worldwide accidents for 1999. 139 causal factors were attributed to 36 accidents (i.e. on average, 3·8 per accident) following the classification devised by IATA.
Among these factors, one can identify five causal factors, which can depict ATM contribution to accidents. The extent of this contribution is presented in table 17 below. “Air traffic services/communications/conflicting traffic” is involved in 2·8% of the turboprop accidents being considered “airport facilities” is involved in 8·3% of the turboprop accidents.
Table 17: ATM as a Contributory Factor in 1999 Turboprop Accidents
Turboprop accidents (based on 36 accident reports) % of allocated factors % of accidents
Air Traffic Services/Communications/conflicting traffic 0.8 2.8 Airport facilities 2.1 8.3 Ground support (procedures, training) 0.0 0.0 Navaids 0.0 0.0 Regulatory oversight 1.3 5.6
To conclude, the results presented here (in Sections 3.3.1 to 3.3.5) vary to a large extent from one sample to another. Comparing the samples and the results, it appears that ATM factors are more significant in accidents involving heavier aircraft than in accidents involving all categories of aircraft, more significant in accidents involving jet aircraft than turboprops, and more significant in ALAs than in a more general sample.
(Space Left Intentionally Blank)
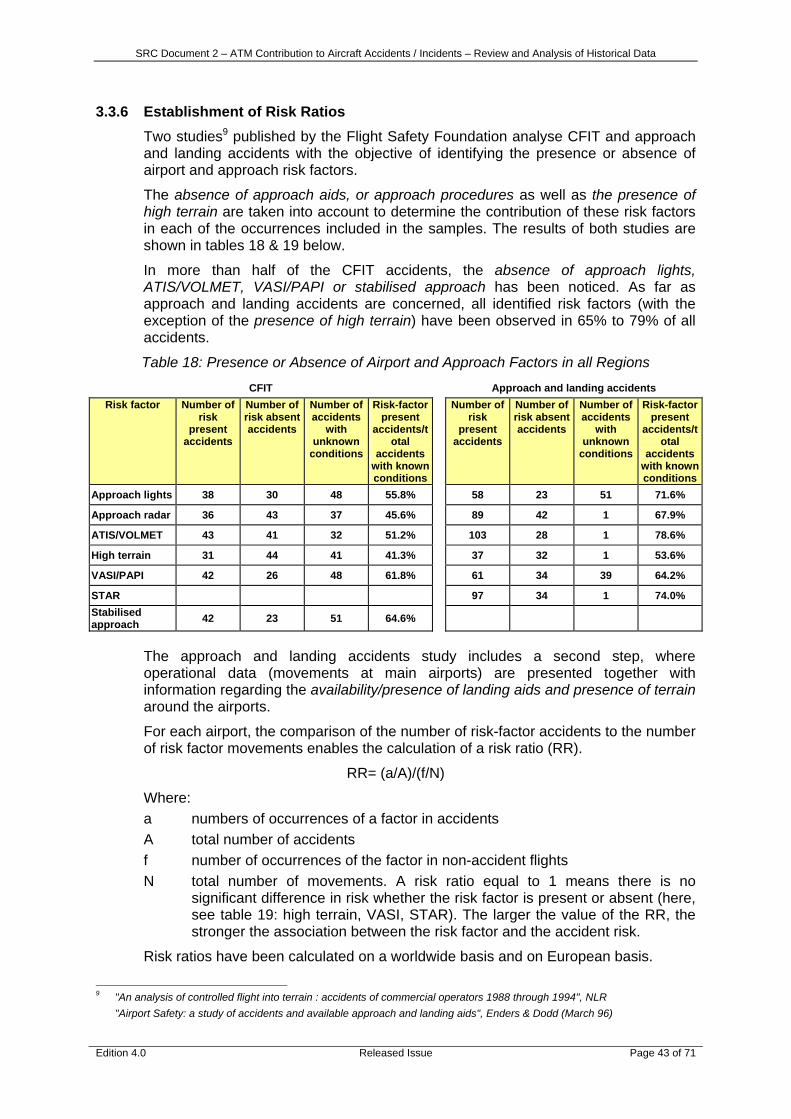
SRC Document 2 – ATM Contribution to Aircraft Accidents / Incidents – Review and Analysis of Historical Data
Edition 4.0 Released Issue Page 43 of 71
3.3.6 Establishment of Risk Ratios Two studies9 published by the Flight Safety Foundation analyse CFIT and approach and landing accidents with the objective of identifying the presence or absence of airport and approach risk factors.
The absence of approach aids, or approach procedures as well as the presence of high terrain are taken into account to determine the contribution of these risk factors in each of the occurrences included in the samples. The results of both studies are shown in tables 18 & 19 below.
In more than half of the CFIT accidents, the absence of approach lights, ATIS/VOLMET, VASI/PAPI or stabilised approach has been noticed. As far as approach and landing accidents are concerned, all identified risk factors (with the exception of the presence of high terrain) have been observed in 65% to 79% of all accidents.
Table 18: Presence or Absence of Airport and Approach Factors in all Regions
CFIT Approach and landing accidents Risk factor Number of
risk present
accidents
Number of risk absent accidents
Number of accidents
with unknown
conditions
Risk-factor present
accidents/total
accidents with known conditions
Number of risk
present accidents
Number of risk absent accidents
Number of accidents
with unknown
conditions
Risk-factor present
accidents/total
accidents with known conditions
Approach lights 38 30 48 55.8% 58 23 51 71.6%
Approach radar 36 43 37 45.6% 89 42 1 67.9%
ATIS/VOLMET 43 41 32 51.2% 103 28 1 78.6%
High terrain 31 44 41 41.3% 37 32 1 53.6%
VASI/PAPI 42 26 48 61.8% 61 34 39 64.2%
STAR 97 34 1 74.0% Stabilised approach 42 23 51 64.6%
The approach and landing accidents study includes a second step, where operational data (movements at main airports) are presented together with information regarding the availability/presence of landing aids and presence of terrain around the airports.
For each airport, the comparison of the number of risk-factor accidents to the number of risk factor movements enables the calculation of a risk ratio (RR).
RR= (a/A)/(f/N)
Where: a numbers of occurrences of a factor in accidents A total number of accidents f number of occurrences of the factor in non-accident flights N total number of movements. A risk ratio equal to 1 means there is no
significant difference in risk whether the risk factor is present or absent (here, see table 19: high terrain, VASI, STAR). The larger the value of the RR, the stronger the association between the risk factor and the accident risk.
Risk ratios have been calculated on a worldwide basis and on European basis.
9 "An analysis of controlled flight into terrain : accidents of commercial operators 1988 through 1994", NLR "Airport Safety: a study of accidents and available approach and landing aids", Enders & Dodd (March 96)
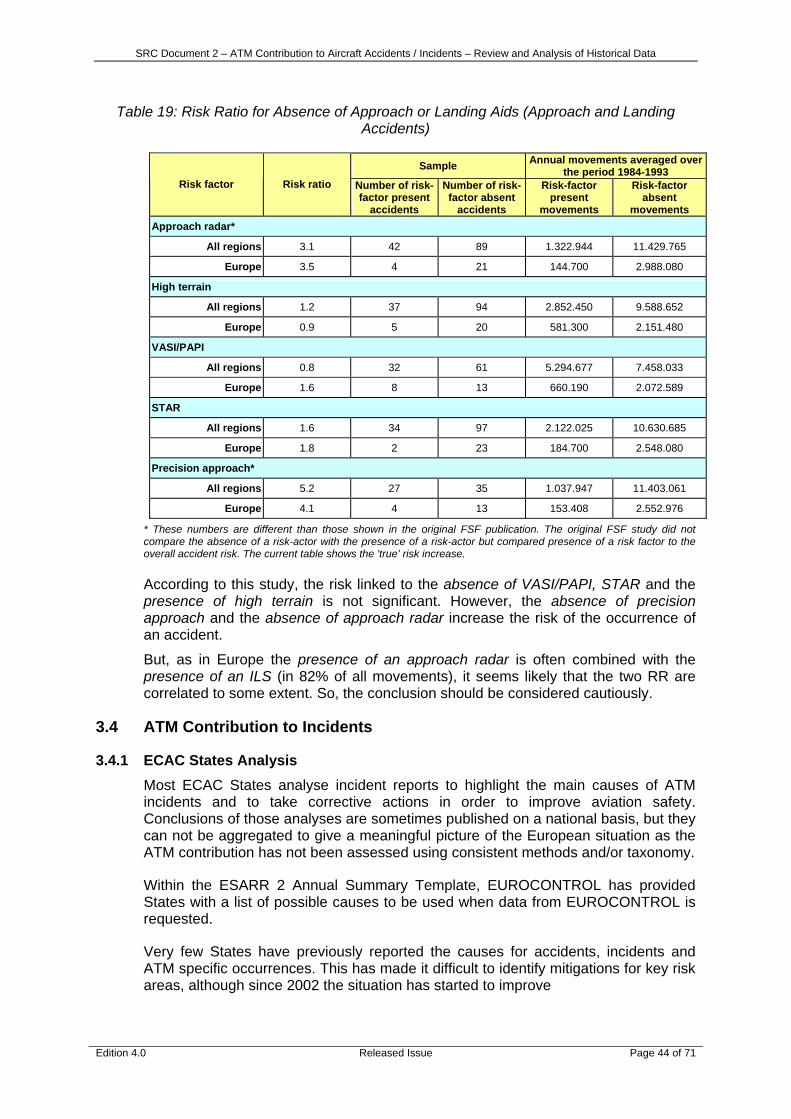
SRC Document 2 – ATM Contribution to Aircraft Accidents / Incidents – Review and Analysis of Historical Data
Edition 4.0 Released Issue Page 44 of 71
Table 19: Risk Ratio for Absence of Approach or Landing Aids (Approach and Landing Accidents)
Sample Annual movements averaged over the period 1984-1993
Risk factor Risk ratio Number of risk-factor present
accidents
Number of risk-factor absent
accidents
Risk-factor present
movements
Risk-factor absent
movements Approach radar*
All regions 3.1 42 89 1.322.944 11.429.765
Europe 3.5 4 21 144.700 2.988.080
High terrain
All regions 1.2 37 94 2.852.450 9.588.652
Europe 0.9 5 20 581.300 2.151.480
VASI/PAPI
All regions 0.8 32 61 5.294.677 7.458.033
Europe 1.6 8 13 660.190 2.072.589
STAR
All regions 1.6 34 97 2.122.025 10.630.685
Europe 1.8 2 23 184.700 2.548.080
Precision approach*
All regions 5.2 27 35 1.037.947 11.403.061
Europe 4.1 4 13 153.408 2.552.976
* These numbers are different than those shown in the original FSF publication. The original FSF study did not compare the absence of a risk-actor with the presence of a risk-actor but compared presence of a risk factor to the overall accident risk. The current table shows the 'true' risk increase.
According to this study, the risk linked to the absence of VASI/PAPI, STAR and the presence of high terrain is not significant. However, the absence of precision approach and the absence of approach radar increase the risk of the occurrence of an accident.
But, as in Europe the presence of an approach radar is often combined with the presence of an ILS (in 82% of all movements), it seems likely that the two RR are correlated to some extent. So, the conclusion should be considered cautiously.
3.4 ATM Contribution to Incidents
3.4.1 ECAC States Analysis Most ECAC States analyse incident reports to highlight the main causes of ATM incidents and to take corrective actions in order to improve aviation safety. Conclusions of those analyses are sometimes published on a national basis, but they can not be aggregated to give a meaningful picture of the European situation as the ATM contribution has not been assessed using consistent methods and/or taxonomy.
Within the ESARR 2 Annual Summary Template, EUROCONTROL has provided States with a list of possible causes to be used when data from EUROCONTROL is requested.
Very few States have previously reported the causes for accidents, incidents and ATM specific occurrences. This has made it difficult to identify mitigations for key risk areas, although since 2002 the situation has started to improve
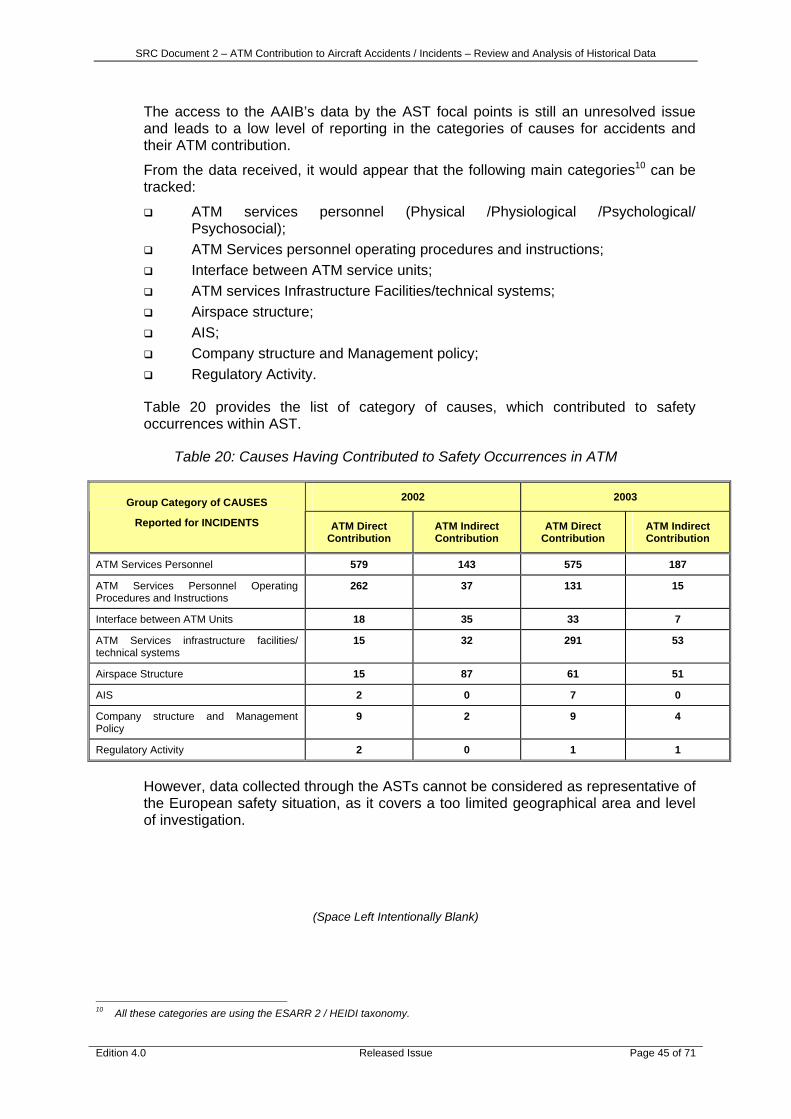
SRC Document 2 – ATM Contribution to Aircraft Accidents / Incidents – Review and Analysis of Historical Data
Edition 4.0 Released Issue Page 45 of 71
The access to the AAIB’s data by the AST focal points is still an unresolved issue and leads to a low level of reporting in the categories of causes for accidents and their ATM contribution.
From the data received, it would appear that the following main categories10 can be tracked:
ATM services personnel (Physical /Physiological /Psychological/ Psychosocial);
ATM Services personnel operating procedures and instructions; Interface between ATM service units; ATM services Infrastructure Facilities/technical systems; Airspace structure; AIS; Company structure and Management policy; Regulatory Activity.
Table 20 provides the list of category of causes, which contributed to safety occurrences within AST.
Table 20: Causes Having Contributed to Safety Occurrences in ATM
2002 2003 Group Category of CAUSES
Reported for INCIDENTS ATM Direct Contribution
ATM Indirect Contribution
ATM Direct Contribution
ATM Indirect Contribution
ATM Services Personnel 579 143 575 187
ATM Services Personnel Operating Procedures and Instructions
262 37 131 15
Interface between ATM Units 18 35 33 7
ATM Services infrastructure facilities/ technical systems
15 32 291 53
Airspace Structure 15 87 61 51
AIS 2 0 7 0
Company structure and Management Policy
9 2 9 4
Regulatory Activity 2 0 1 1
However, data collected through the ASTs cannot be considered as representative of the European safety situation, as it covers a too limited geographical area and level of investigation.
(Space Left Intentionally Blank)
10 All these categories are using the ESARR 2 / HEIDI taxonomy.

SRC Document 2 – ATM Contribution to Aircraft Accidents / Incidents – Review and Analysis of Historical Data
Edition 4.0 Released Issue Page 46 of 71
3.4.2 IATA AIRPROX Reports Analysis* Some 60 IATA member airlines submitted information on a regular basis about aircraft incidents occurred in 36 European countries. Reports for nine ECAC States have been assessed and causal factors attributed (one per accident). The breakdown of causes is shown in table 21 below.
Table 21: AIRPROX Assessment for Occurrences in Nine European Countries
Total 9 Countries 1994 1995 1996 1997 1998
TOTAL REPORTS RECEIVED 179 202 172 180 251
A/C INVOLVED
Military (All Types) 26 28 18 24 41
Civil (Commercial Air Transport) 85 87 83 82 100
Light (General Aviation) 53 52 47 56 67
Other/Unknown 15 34 24 18 43
AIRSPACE
Upper 57 56 53 55 69
Lower 51 67 32 38 72
TMA 68 64 78 80 103
Not Specified 3 15 9 6 4
CAUSE
1. Controller Error, Civil 66 56 50 52 70
2. Controller Error, Military 3 0 0 2 1
3. IFR/VFR Mix 19 12 8 14 29
4. Pilot Error, Civil 15 28 17 24 20
5. Pilot Error, Military 6 7 6 5 2
6. Pilot Error, General Aviation 30 27 26 28 18
7. ATC Co-ordination Mil/Civ 13 9 10 8 9
8. ATC Co-ordination, Civ/Civ 7 16 10 10 8
9. Other Causes 9 14 16 7 20
10. No Conclusion/Not specified 15 34 40 41 82
DEGREE OF RISK (1)
A - Actual Risk 51 50 56 43 38
B - Possible Risk 94 99 74 93 124
C - No Risk 26 38 24 25 56
D - Undetermined Risk/Not specified 8 15 16 20 33
ATM contribution (1 to 3, 7& 8) 59% 46% 43% 45% 45%
Source: IATA AIRPROX reports for France, Germany, Greece, Italy, the Netherlands, Spain, Switzerland, Turkey and the United Kingdom. (1) The figures given here for degree of risk are an amalgamation of State and airline assessments. State
assessments are used whenever possible, but if no such figures are available then airline assessments are used.
All ATM-related factors (causes 1 to 3, 7 and 8) have been aggregated, leading to the conclusion that ATM factors intervene in more than 43% to 59% of air proximity reported by flight crews (AIRPROX).

SRC Document 2 – ATM Contribution to Aircraft Accidents / Incidents – Review and Analysis of Historical Data
Edition 4.0 Released Issue Page 47 of 71
4. MAIN CAUSES IDENTIFIED
AIRPROX data analyses and all incident reports from different sources have been combined with accident reports to draw up the most extensive list of potential causal factors related to ATC or ATM problems, based on past experience. Before establishing a single list for accidents and a separate list for incidents, the factors identified in each selected source of information need review.
4. 1 Accidents 4.1.1 Through UK CAA & FSF Studies
The document produced by the Approach and Landing Accident Reduction (ALAR) Working Group of the Flight Safety Foundation lists some causal factors. These have been aggregated in accordance with the UK CAA classification system used to describe accidents.
Table 22: Flight Safety Foundation / UK CAA ALAs Analysis (FSF List)
Causal factor : ATC / ground aids / infrastructure
incorrect or inadequate instruction / advice
incorrect radar vectoring
incorrect / absence of essential traffic information
inadequate controller technique of dealing with a/c facing minor and serious difficulties
demanding clearance, i.e. with last minute runway change / late notification of runway
provoking high workload on the flight deck
unnecessary request for information from the ATCO in critical situations
misunderstood/missed communication
missed readback
call-sign confusion
simultaneous transmission
phraseology
poor knowledge in current English
no notice taken of urgent warnings in critical situation
failure to provide separation in the air
ATC awareness of aircraft position
failure to provide separation on the ground
inability to determine a/c position during IMC or darkness
radio frequency saturation
ground aid malfunction or unavailable
inadequate provision of facilities
DME
PAPI, VASI
runway markings
runway lighting
inadequate airport support
emergency services
runway condition and lighting
wind shear detection
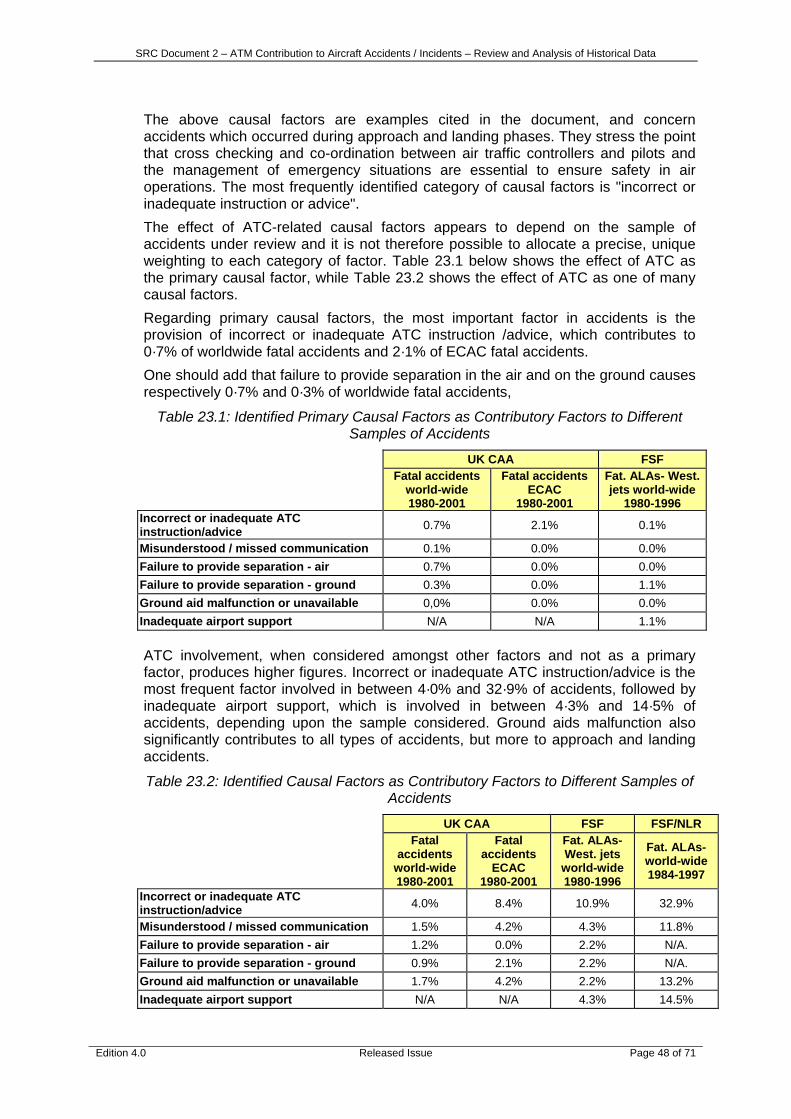
SRC Document 2 – ATM Contribution to Aircraft Accidents / Incidents – Review and Analysis of Historical Data
Edition 4.0 Released Issue Page 48 of 71
The above causal factors are examples cited in the document, and concern accidents which occurred during approach and landing phases. They stress the point that cross checking and co-ordination between air traffic controllers and pilots and the management of emergency situations are essential to ensure safety in air operations. The most frequently identified category of causal factors is "incorrect or inadequate instruction or advice". The effect of ATC-related causal factors appears to depend on the sample of accidents under review and it is not therefore possible to allocate a precise, unique weighting to each category of factor. Table 23.1 below shows the effect of ATC as the primary causal factor, while Table 23.2 shows the effect of ATC as one of many causal factors. Regarding primary causal factors, the most important factor in accidents is the provision of incorrect or inadequate ATC instruction /advice, which contributes to 0·7% of worldwide fatal accidents and 2·1% of ECAC fatal accidents. One should add that failure to provide separation in the air and on the ground causes respectively 0·7% and 0·3% of worldwide fatal accidents,
Table 23.1: Identified Primary Causal Factors as Contributory Factors to Different Samples of Accidents
UK CAA FSF
Fatal accidents
world-wide 1980-2001
Fatal accidents ECAC
1980-2001
Fat. ALAs- West. jets world-wide
1980-1996 Incorrect or inadequate ATC instruction/advice 0.7% 2.1% 0.1%
Misunderstood / missed communication 0.1% 0.0% 0.0% Failure to provide separation - air 0.7% 0.0% 0.0% Failure to provide separation - ground 0.3% 0.0% 1.1% Ground aid malfunction or unavailable 0,0% 0.0% 0.0% Inadequate airport support N/A N/A 1.1%
ATC involvement, when considered amongst other factors and not as a primary factor, produces higher figures. Incorrect or inadequate ATC instruction/advice is the most frequent factor involved in between 4·0% and 32·9% of accidents, followed by inadequate airport support, which is involved in between 4·3% and 14·5% of accidents, depending upon the sample considered. Ground aids malfunction also significantly contributes to all types of accidents, but more to approach and landing accidents.
Table 23.2: Identified Causal Factors as Contributory Factors to Different Samples of Accidents
UK CAA FSF FSF/NLR
Fatal
accidents world-wide1980-2001
Fatal accidents
ECAC 1980-2001
Fat. ALAs- West. jets
world-wide 1980-1996
Fat. ALAs- world-wide1984-1997
Incorrect or inadequate ATC instruction/advice 4.0% 8.4% 10.9% 32.9%
Misunderstood / missed communication 1.5% 4.2% 4.3% 11.8% Failure to provide separation - air 1.2% 0.0% 2.2% N/A. Failure to provide separation - ground 0.9% 2.1% 2.2% N/A. Ground aid malfunction or unavailable 1.7% 4.2% 2.2% 13.2% Inadequate airport support N/A N/A 4.3% 14.5%

SRC Document 2 – ATM Contribution to Aircraft Accidents / Incidents – Review and Analysis of Historical Data
Edition 4.0 Released Issue Page 49 of 71
0%
5%
10%
15%
20%
25%
30%
35%
ATCinstruction/advice
Missedcommunication
Separation - air Separation -ground
Ground aidmalfunction
Airport support
world-wide UK CAA ECAC UK CAA ALAs- West. jets FSF ALAs- FSF/NLR
Figure 11 - Importance of identified causal factors
In table 23.3 below, the lack of ground aids appears to be one important circumstantial factor, identified in about 15% of analysed fatal accident reports and 25% of analysed approach and landing accident reports. One should also note that in the UK CAA sample over the period 1980-1996, the non-fitment of currently available safety equipment (GPWS, TCAS, wind-shear warning, etc.) has been considered as a circumstantial factor in 42% of analysed accidents.
Table 23.3: Identified Circumstantial Factors as Contributory Factors to Different Samples of Accidents
UK CAA FSF Fatal accidents
world-wide 1980-2001
Fatal accidents ECAC
1980-2001
Fat. ALAs- West. jets world-wide
1980-1996 Lack of ATC 1.2% 0.0%
Lack of ground aids 15.2% 15.8% 25.0%
Lack of safety equipment for ATC (e.g. MSAW) 2.8% 4.2%
4.1.2 Through the JSSI Study Another accident analysis which must be added to the previously cited results, is the one made by the CFIT team of the US Initiative which was subsequently assessed within the JSSI (Joint Strategic Safety Initiative). However, it is not immediately comparable, as the taxonomy of causal factor used is not identical to the previous one used within the UK CAA.
12 CFIT accidents were analysed and 139 factors allocated (i.e. 11·6 factors per accident). It appears that ATM factors contribute to all but one CFIT accident. The most frequent contributory factors amongst the 36 ATM factors used are listed below, together with their assessed contribution to CFIT accidents.
(Space Left Intentionally Blank)

SRC Document 2 – ATM Contribution to Aircraft Accidents / Incidents – Review and Analysis of Historical Data
Edition 4.0 Released Issue Page 50 of 71
Table 24: ATM Involvement in 12 CFIT
% of factors % of CFIT ATC/flightcrew inadequate communications 3.6% 41.7% ATC failure to follow procedures (SOP) 3.6% 41.7% ATC failure to follow procedures (communications) 2.9% 33.3% ATS inadequate infrastructure (equipment/design) 2.9% 33.3% ATC inadequate situation awareness (horizontal) 2.2% 25.0% ATC lack of English skills 1.4% 16.7% ATC inadequate situation awareness (vertical) 1.4% 16.7% ATS lack of standardisation (approach plates) 1.4% 16.7% ATS inadequate information dissemination 1.4% 16.7% ATS limited navaids availability 0.7% 8.3% ATS inadequate infrastructure (training/supervision) 0.7% 8.3%
Given that the most complete accident and incident database is the WAAS, ATM as a contributory factor could first have been analysed using this tool. However, since the available information has already been scrutinised by both the UK CAA (SRG) and the FSF Working Group, it seemed more fruitful to complement the use of these studies by using three additional sources: the ICAO Aircraft Accident Digest, the Aviation Safety and the Warwick databases, when trying to estimate the extent to which ATM is a contributory factor to aircraft accidents.
4.1.3 Through the ICAO Aircraft Accident Digest The ICAO Aircraft Accident Digest presents accident reports selected by the ICAO Secretariat on the basis of their effect on accident prevention or the successful employment of useful investigative techniques and compliance with the provisions of Annex 13. The digest should not be seen as statistically representative of the breakdown of accidents throughout the world.
However, it was felt that these long and detailed reports would be of interest to identify and point out any event related to ATS management that would have been neglected in a shorter report and which would not have been revealed by a past classical analysis, which are most frequently aircraft-oriented.
Each annual issue of the Aircraft Accident Digest sets out 5 to 10 accident reports filed by the Contracting States. A review of the digest relating to the 1970-1991 period was carried out and the reports analysed for events within the ECAC area.
(Space Left Intentionally Blank)
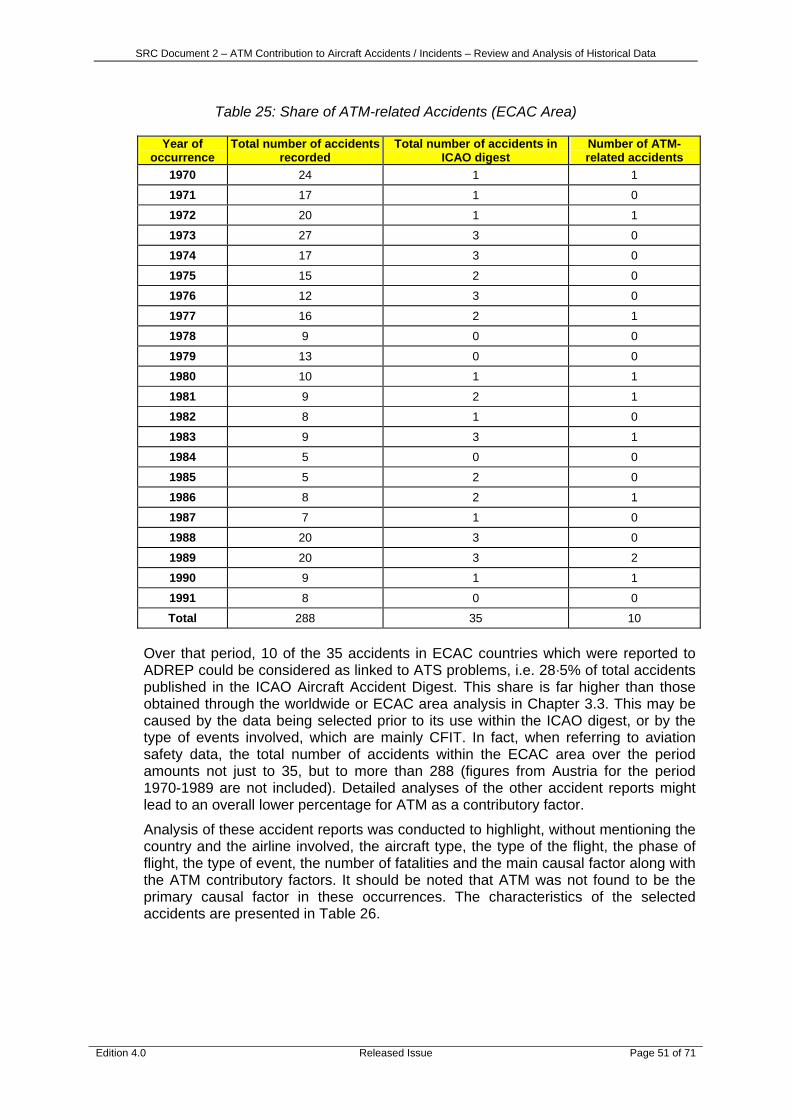
SRC Document 2 – ATM Contribution to Aircraft Accidents / Incidents – Review and Analysis of Historical Data
Edition 4.0 Released Issue Page 51 of 71
Table 25: Share of ATM-related Accidents (ECAC Area)
Year of occurrence
Total number of accidents recorded
Total number of accidents in ICAO digest
Number of ATM-related accidents
1970 24 1 1
1971 17 1 0
1972 20 1 1
1973 27 3 0
1974 17 3 0
1975 15 2 0
1976 12 3 0
1977 16 2 1
1978 9 0 0
1979 13 0 0
1980 10 1 1
1981 9 2 1
1982 8 1 0
1983 9 3 1
1984 5 0 0
1985 5 2 0
1986 8 2 1
1987 7 1 0
1988 20 3 0
1989 20 3 2
1990 9 1 1
1991 8 0 0
Total 288 35 10
Over that period, 10 of the 35 accidents in ECAC countries which were reported to ADREP could be considered as linked to ATS problems, i.e. 28·5% of total accidents published in the ICAO Aircraft Accident Digest. This share is far higher than those obtained through the worldwide or ECAC area analysis in Chapter 3.3. This may be caused by the data being selected prior to its use within the ICAO digest, or by the type of events involved, which are mainly CFIT. In fact, when referring to aviation safety data, the total number of accidents within the ECAC area over the period amounts not just to 35, but to more than 288 (figures from Austria for the period 1970-1989 are not included). Detailed analyses of the other accident reports might lead to an overall lower percentage for ATM as a contributory factor.
Analysis of these accident reports was conducted to highlight, without mentioning the country and the airline involved, the aircraft type, the type of the flight, the phase of flight, the type of event, the number of fatalities and the main causal factor along with the ATM contributory factors. It should be noted that ATM was not found to be the primary causal factor in these occurrences. The characteristics of the selected accidents are presented in Table 26.

SRC Document 2 – ATM Contribution to Aircraft Accidents / Incidents – Review and Analysis of Historical Data
Edition 4.0 Released Issue Page 52 of 71
Table 26: Analysis of ATM-related Accidents in the ICAO Aircraft Accident Digest
Year of occurrence Aircraft type Type of flight Phase of
flight Type of event Fatalities Causal factor ATM contributory factors Category of factors
aircraft navigation ATCO did not check the establishment of the aircraft on the glide, in fact aircraft was flown below the glide path HF
1990 DC-9-32 scheduled approach CFIT 46 systems no PAPI installed with ILS EQ. disfunctioning No MSAW EQ.
no lighting of neighbouring mountain EQ.
1989 B707 non-scheduled approach CFIT 144 non observance by the crew of established overlap of communications, incorrect readbacks, EQ./HF
operating procedure Phraseology HF 1989 FH 227 scheduled approach CFIT 22 error on VOR setting airspace organisation does not allow optimum use of existing radars APO.
No MSAW EQ.
1986 DHC-6 scheduled approach CFIT 1 VFR approach without visibility
minimum visibility required for IFR NDB procedure not compatible with point published for missed approach P
the ACC controller transferred the aircraft to APP at a time and place different from those agreed upon; HF
1983 B747 scheduled landing CFIT 181 non observance by the crew of
the APP controller, in handling off the aircraft, did not give any precise positional reference either to tower or to the aircraft; HF
established operating procedure
the APP controller transferred the aircraft to the tower controller without having received any confirmation from the crew that it had intercepted any approach aid or had any visual cue; HF
the APP controller did not maintain the required radar vigilance inasmuch as he did not inform the aircraft "radar service terminated"; HF
the communications phraseology and procedures employed both by the controllers and the crew did not conform to those recommended by ICAO HF
1981 Cessna 340 taxi approach CFIT 2 fuel starvation the controller did not give the pilot altitude information during the approach, as required by applicable regulations HF
non observance by the crew of correct the holding was not published; P
1980 B727 non-scheduled landing CFIT 146 safety distance the controller did not determine the aircraft's position correctly; HF above the ground the controller gave confused information regarding the holding. HF
take-off/ ground take-off without interferences in radio-transmissions, inappropriate phraseology resulting in misunderstandings; EQ./HF
1977 B747 (2) non-scheduled taxiing collision 583 take-off clearance the tower controller did not ask for a confirmation of his instructions; HF
no ground radar to control traffic during conditions of bad visibility. EQ.
1972 B720 scheduled landing overrun - non-compliance with IFR approach limits VOR awaiting calibration, ILS unreliable. EQ.
1970 CV990 ferry take-off CFIT 5 loss of control during a 3-engine take-off
the controller should not have instructed departing aircraft, before take-off, on the frequencies to be used after becoming airborne, in order not to disturb the crew during the climb-out; HF
no ground radar to control traffic during conditions of bad visibility. EQ.
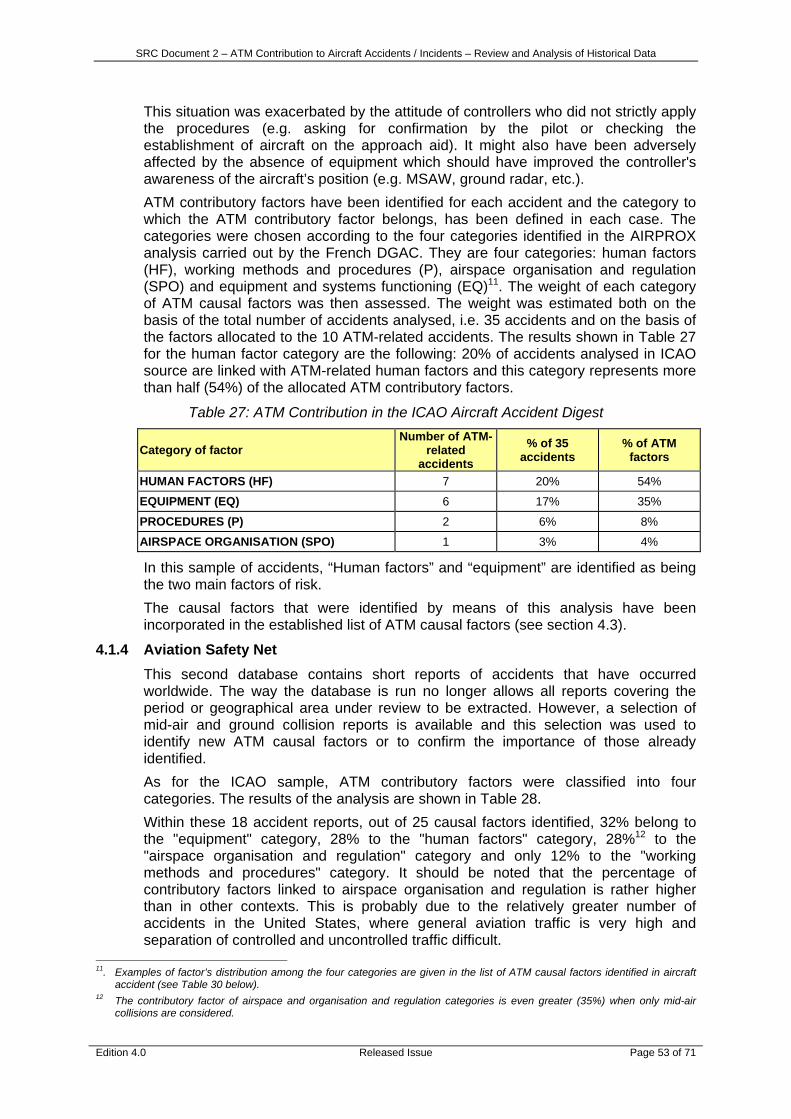
SRC Document 2 – ATM Contribution to Aircraft Accidents / Incidents – Review and Analysis of Historical Data
Edition 4.0 Released Issue Page 53 of 71
This situation was exacerbated by the attitude of controllers who did not strictly apply the procedures (e.g. asking for confirmation by the pilot or checking the establishment of aircraft on the approach aid). It might also have been adversely affected by the absence of equipment which should have improved the controller's awareness of the aircraft’s position (e.g. MSAW, ground radar, etc.). ATM contributory factors have been identified for each accident and the category to which the ATM contributory factor belongs, has been defined in each case. The categories were chosen according to the four categories identified in the AIRPROX analysis carried out by the French DGAC. They are four categories: human factors (HF), working methods and procedures (P), airspace organisation and regulation (SPO) and equipment and systems functioning (EQ)11. The weight of each category of ATM causal factors was then assessed. The weight was estimated both on the basis of the total number of accidents analysed, i.e. 35 accidents and on the basis of the factors allocated to the 10 ATM-related accidents. The results shown in Table 27 for the human factor category are the following: 20% of accidents analysed in ICAO source are linked with ATM-related human factors and this category represents more than half (54%) of the allocated ATM contributory factors.
Table 27: ATM Contribution in the ICAO Aircraft Accident Digest
Category of factor Number of ATM-
related accidents
% of 35 accidents
% of ATM factors
HUMAN FACTORS (HF) 7 20% 54%
EQUIPMENT (EQ) 6 17% 35%
PROCEDURES (P) 2 6% 8%
AIRSPACE ORGANISATION (SPO) 1 3% 4%
In this sample of accidents, “Human factors” and “equipment” are identified as being the two main factors of risk. The causal factors that were identified by means of this analysis have been incorporated in the established list of ATM causal factors (see section 4.3).
4.1.4 Aviation Safety Net This second database contains short reports of accidents that have occurred worldwide. The way the database is run no longer allows all reports covering the period or geographical area under review to be extracted. However, a selection of mid-air and ground collision reports is available and this selection was used to identify new ATM causal factors or to confirm the importance of those already identified. As for the ICAO sample, ATM contributory factors were classified into four categories. The results of the analysis are shown in Table 28. Within these 18 accident reports, out of 25 causal factors identified, 32% belong to the "equipment" category, 28% to the "human factors" category, 28%12 to the "airspace organisation and regulation" category and only 12% to the "working methods and procedures" category. It should be noted that the percentage of contributory factors linked to airspace organisation and regulation is rather higher than in other contexts. This is probably due to the relatively greater number of accidents in the United States, where general aviation traffic is very high and separation of controlled and uncontrolled traffic difficult.
11. Examples of factor’s distribution among the four categories are given in the list of ATM causal factors identified in aircraft
accident (see Table 30 below). 12 The contributory factor of airspace and organisation and regulation categories is even greater (35%) when only mid-air
collisions are considered.
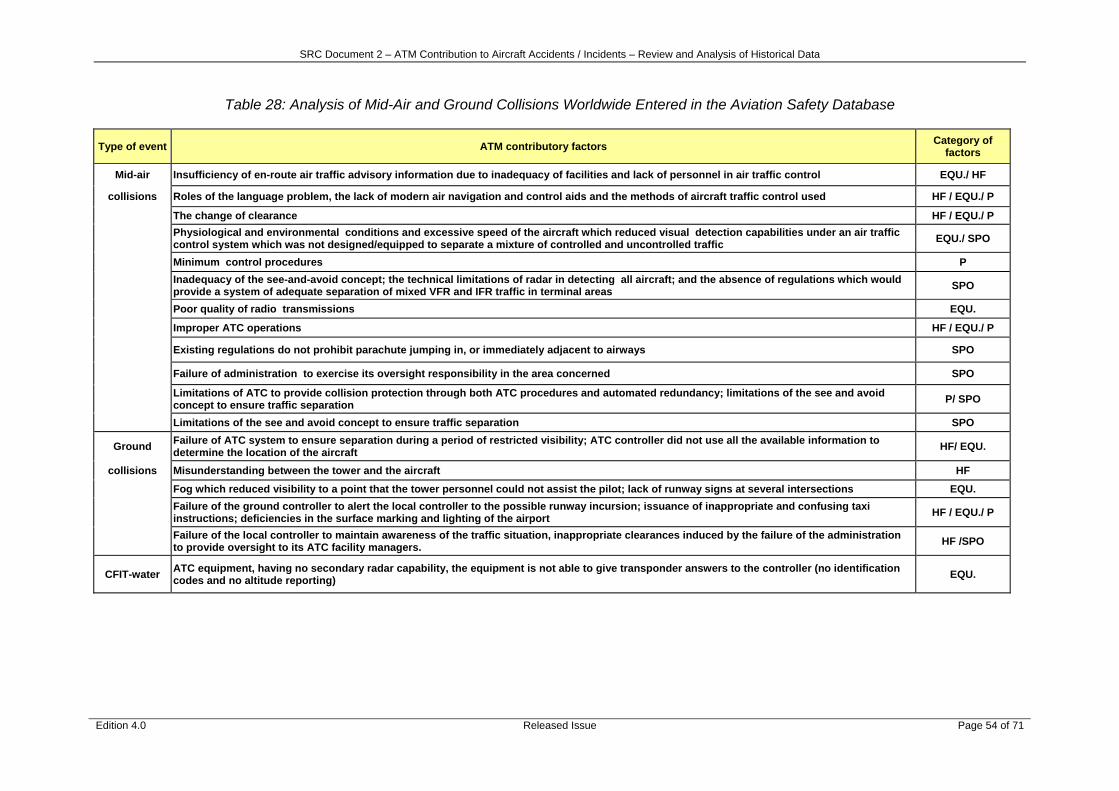
SRC Document 2 – ATM Contribution to Aircraft Accidents / Incidents – Review and Analysis of Historical Data
Edition 4.0 Released Issue Page 54 of 71
Table 28: Analysis of Mid-Air and Ground Collisions Worldwide Entered in the Aviation Safety Database
Type of event ATM contributory factors Category of factors
Mid-air Insufficiency of en-route air traffic advisory information due to inadequacy of facilities and lack of personnel in air traffic control EQU./ HF
collisions Roles of the language problem, the lack of modern air navigation and control aids and the methods of aircraft traffic control used HF / EQU./ P
The change of clearance HF / EQU./ P
Physiological and environmental conditions and excessive speed of the aircraft which reduced visual detection capabilities under an air traffic control system which was not designed/equipped to separate a mixture of controlled and uncontrolled traffic EQU./ SPO
Minimum control procedures P
Inadequacy of the see-and-avoid concept; the technical limitations of radar in detecting all aircraft; and the absence of regulations which would provide a system of adequate separation of mixed VFR and IFR traffic in terminal areas SPO
Poor quality of radio transmissions EQU.
Improper ATC operations HF / EQU./ P
Existing regulations do not prohibit parachute jumping in, or immediately adjacent to airways SPO
Failure of administration to exercise its oversight responsibility in the area concerned SPO
Limitations of ATC to provide collision protection through both ATC procedures and automated redundancy; limitations of the see and avoid concept to ensure traffic separation P/ SPO
Limitations of the see and avoid concept to ensure traffic separation SPO
Ground Failure of ATC system to ensure separation during a period of restricted visibility; ATC controller did not use all the available information to determine the location of the aircraft HF/ EQU.
collisions Misunderstanding between the tower and the aircraft HF
Fog which reduced visibility to a point that the tower personnel could not assist the pilot; lack of runway signs at several intersections EQU.
Failure of the ground controller to alert the local controller to the possible runway incursion; issuance of inappropriate and confusing taxi instructions; deficiencies in the surface marking and lighting of the airport HF / EQU./ P
Failure of the local controller to maintain awareness of the traffic situation, inappropriate clearances induced by the failure of the administration to provide oversight to its ATC facility managers. HF /SPO
CFIT-water ATC equipment, having no secondary radar capability, the equipment is not able to give transponder answers to the controller (no identification codes and no altitude reporting) EQU.
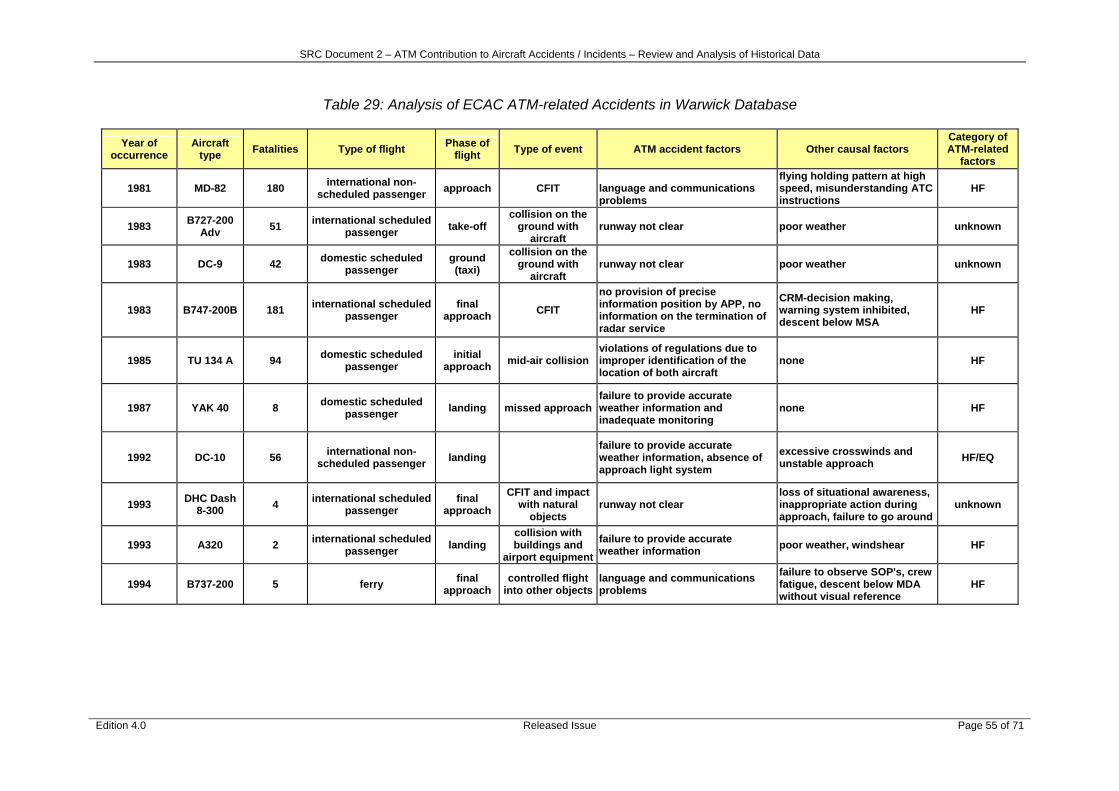
SRC Document 2 – ATM Contribution to Aircraft Accidents / Incidents – Review and Analysis of Historical Data
Edition 4.0 Released Issue Page 55 of 71
Table 29: Analysis of ECAC ATM-related Accidents in Warwick Database
Year of occurrence
Aircraft type Fatalities Type of flight Phase of
flight Type of event ATM accident factors Other causal factors Category of ATM-related
factors
1981 MD-82 180 international non-scheduled passenger approach CFIT
language and communications problems
flying holding pattern at high speed, misunderstanding ATC instructions
HF
1983 B727-200 Adv 51 international scheduled
passenger take-off collision on the
ground with aircraft
runway not clear poor weather unknown
1983 DC-9 42 domestic scheduled passenger
ground (taxi)
collision on the ground with
aircraft runway not clear poor weather unknown
1983 B747-200B 181 international scheduled passenger
final approach CFIT
no provision of precise information position by APP, no information on the termination of radar service
CRM-decision making, warning system inhibited, descent below MSA
HF
1985 TU 134 A 94 domestic scheduled passenger
initial approach mid-air collision
violations of regulations due to improper identification of the location of both aircraft
none HF
1987 YAK 40 8 domestic scheduled passenger landing missed approach
failure to provide accurate weather information and inadequate monitoring
none HF
1992 DC-10 56 international non-scheduled passenger landing
failure to provide accurate weather information, absence of approach light system
excessive crosswinds and unstable approach HF/EQ
1993 DHC Dash 8-300 4 international scheduled
passenger final
approach CFIT and impact
with natural objects
runway not clear loss of situational awareness, inappropriate action during approach, failure to go around
unknown
1993 A320 2 international scheduled passenger landing
collision with buildings and
airport equipmentfailure to provide accurate weather information poor weather, windshear HF
1994 B737-200 5 ferry final approach
controlled flight into other objects
language and communications problems
failure to observe SOP's, crew fatigue, descent below MDA without visual reference
HF

SRC Document 2 – ATM Contribution to Aircraft Accidents / Incidents – Review and Analysis of Historical Data
Edition 4.0 Released Issue Page 56 of 71
4.1.5 Warwick Database Table 29 above represents the analysis of ECAC ATM-related accidents available in the Warwick database. Amongst more than 2000 accidents which occurred over the period 1977 to 1997, 479 accidents occurred within Europe airspace, 10 of them involve ATM contribution. Albeit the information provided is not sufficiently detailed to identify causal and contributory factors for most of the retained accidents, two of them seem to be only due to ATM factors (1985 and 1987 accidents).
Nevertheless, it appears from the analysis conducted, those human factors are the most frequent allocated ATM factor category (in 7 of 10 accidents).
4.1.6 NLR Analysis (from NLR Technical Paper 2003-376) In a study into Air Traffic Management-related Accidents Worldwide: 1980–2001 conducted by NLR, causal factors in ATM related accidents were identified. A causal factor was defined as an item which was judged to be instrumental in the causal chain of events leading to the accident. The causal factors were listed in four groups; Flight Crew, ATC, Environmental, and Aircraft System and further divided into specific factors. An accident may have been allocated any number of causal factors from any one group, and any combination of groups. The causal factors were identified using the official findings of an accident investigation agency. Also the narrative was used to identify the causal factors. However for 70 accidents (33% of total sample of 213 identified accidents) there was insufficient information to identify the causal factors.
The ten most frequently identified causal factors in the ATM related accident sample are listed in Table 30. Low visibility is the most frequently identified causal factor followed by lack of positional awareness of the flight crew on ground and incorrect or inadequate instruction/advice given by ATC.
Table 30: Top Ten Most Frequently Identified Causal Factors
Causal Factor Number of accidents 1. Environmental - Low visibility 23 (16%)
2. Flight Crew - Lack of positional awareness - on ground 22 (15%)
3. ATC - Incorrect or inadequate instruction/advice 20 (14%)
4. Flight Crew - Failure in look-out 17 (12%)
5. Flight Crew - Non-adherence to procedures 17 (12%)
6. Flight Crew - Omission of action / inappropriate action 14 (10%)
7. ATC - Failure to provide separation - ground 12 (8%)
8. Aircraft System - System failure affecting controllability 9 (6%)
9. Flight Crew - Failure in CRM (cross-check / co-ordinate) 8 (6%)
10. ATC - Ground aid malfunction or unavailable 7 (5%)
The most frequently identified causal factors by event type are summarised in Table 31. For the wake vortex encounter events there was insufficient data to give the most frequently identified causal factors.
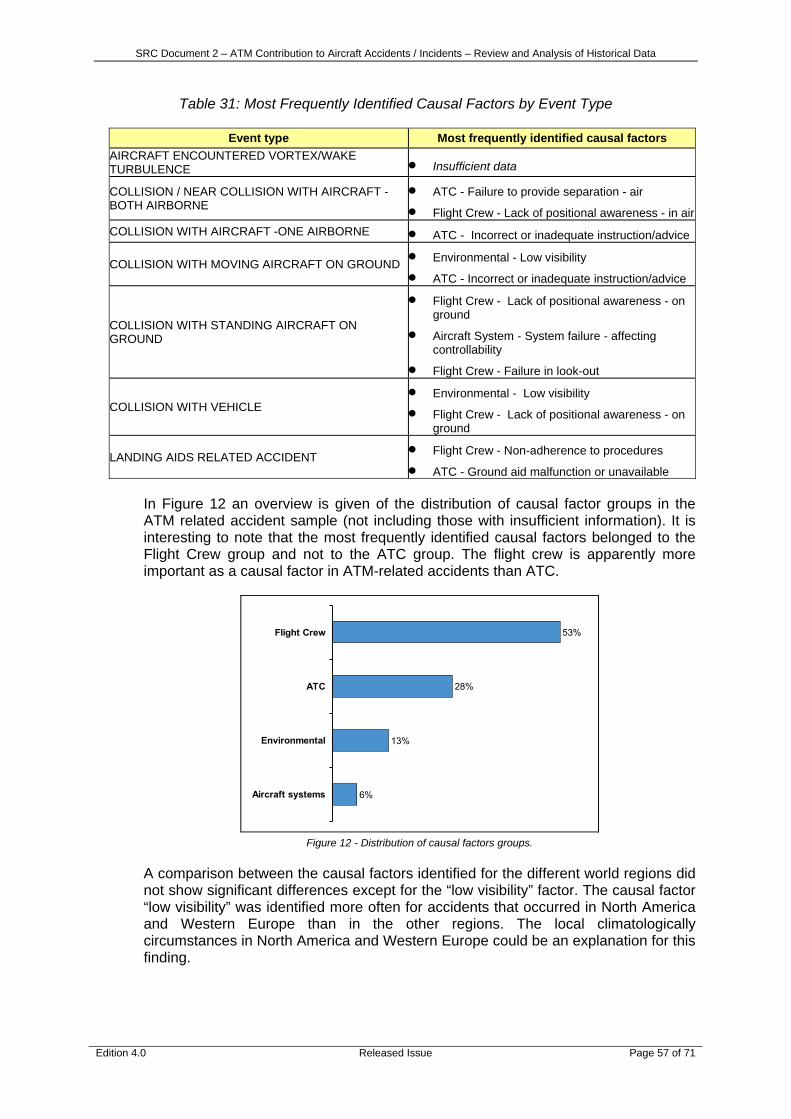
SRC Document 2 – ATM Contribution to Aircraft Accidents / Incidents – Review and Analysis of Historical Data
Edition 4.0 Released Issue Page 57 of 71
Table 31: Most Frequently Identified Causal Factors by Event Type
Event type Most frequently identified causal factors AIRCRAFT ENCOUNTERED VORTEX/WAKE TURBULENCE • Insufficient data
COLLISION / NEAR COLLISION WITH AIRCRAFT -BOTH AIRBORNE
• ATC - Failure to provide separation - air
• Flight Crew - Lack of positional awareness - in airCOLLISION WITH AIRCRAFT -ONE AIRBORNE • ATC - Incorrect or inadequate instruction/advice
COLLISION WITH MOVING AIRCRAFT ON GROUND • Environmental - Low visibility
• ATC - Incorrect or inadequate instruction/advice
COLLISION WITH STANDING AIRCRAFT ON GROUND
• Flight Crew - Lack of positional awareness - on ground
• Aircraft System - System failure - affecting controllability
• Flight Crew - Failure in look-out
COLLISION WITH VEHICLE • Environmental - Low visibility
• Flight Crew - Lack of positional awareness - on ground
LANDING AIDS RELATED ACCIDENT • Flight Crew - Non-adherence to procedures
• ATC - Ground aid malfunction or unavailable
In Figure 12 an overview is given of the distribution of causal factor groups in the ATM related accident sample (not including those with insufficient information). It is interesting to note that the most frequently identified causal factors belonged to the Flight Crew group and not to the ATC group. The flight crew is apparently more important as a causal factor in ATM-related accidents than ATC.
Figure 12 - Distribution of causal factors groups.
A comparison between the causal factors identified for the different world regions did not show significant differences except for the “low visibility” factor. The causal factor “low visibility” was identified more often for accidents that occurred in North America and Western Europe than in the other regions. The local climatologically circumstances in North America and Western Europe could be an explanation for this finding.
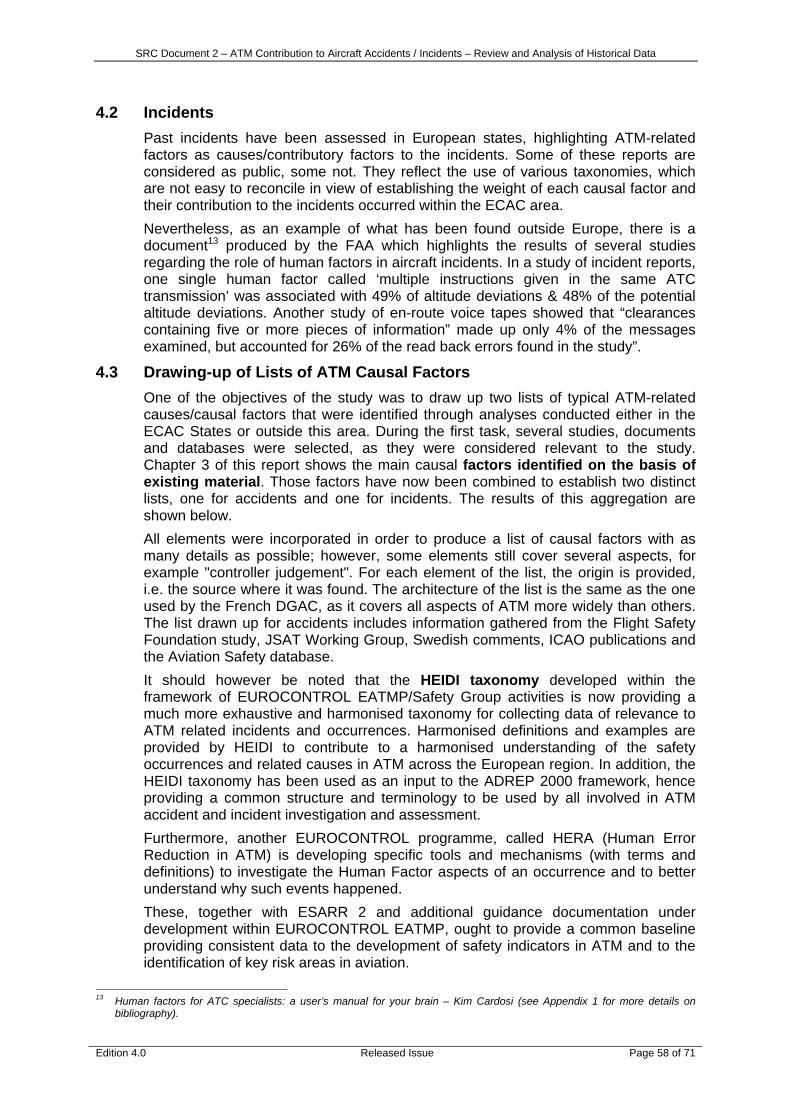
SRC Document 2 – ATM Contribution to Aircraft Accidents / Incidents – Review and Analysis of Historical Data
Edition 4.0 Released Issue Page 58 of 71
4.2 Incidents Past incidents have been assessed in European states, highlighting ATM-related factors as causes/contributory factors to the incidents. Some of these reports are considered as public, some not. They reflect the use of various taxonomies, which are not easy to reconcile in view of establishing the weight of each causal factor and their contribution to the incidents occurred within the ECAC area. Nevertheless, as an example of what has been found outside Europe, there is a document13 produced by the FAA which highlights the results of several studies regarding the role of human factors in aircraft incidents. In a study of incident reports, one single human factor called ‘multiple instructions given in the same ATC transmission’ was associated with 49% of altitude deviations & 48% of the potential altitude deviations. Another study of en-route voice tapes showed that “clearances containing five or more pieces of information” made up only 4% of the messages examined, but accounted for 26% of the read back errors found in the study”.
4.3 Drawing-up of Lists of ATM Causal Factors One of the objectives of the study was to draw up two lists of typical ATM-related causes/causal factors that were identified through analyses conducted either in the ECAC States or outside this area. During the first task, several studies, documents and databases were selected, as they were considered relevant to the study. Chapter 3 of this report shows the main causal factors identified on the basis of existing material. Those factors have now been combined to establish two distinct lists, one for accidents and one for incidents. The results of this aggregation are shown below. All elements were incorporated in order to produce a list of causal factors with as many details as possible; however, some elements still cover several aspects, for example "controller judgement". For each element of the list, the origin is provided, i.e. the source where it was found. The architecture of the list is the same as the one used by the French DGAC, as it covers all aspects of ATM more widely than others. The list drawn up for accidents includes information gathered from the Flight Safety Foundation study, JSAT Working Group, Swedish comments, ICAO publications and the Aviation Safety database. It should however be noted that the HEIDI taxonomy developed within the framework of EUROCONTROL EATMP/Safety Group activities is now providing a much more exhaustive and harmonised taxonomy for collecting data of relevance to ATM related incidents and occurrences. Harmonised definitions and examples are provided by HEIDI to contribute to a harmonised understanding of the safety occurrences and related causes in ATM across the European region. In addition, the HEIDI taxonomy has been used as an input to the ADREP 2000 framework, hence providing a common structure and terminology to be used by all involved in ATM accident and incident investigation and assessment. Furthermore, another EUROCONTROL programme, called HERA (Human Error Reduction in ATM) is developing specific tools and mechanisms (with terms and definitions) to investigate the Human Factor aspects of an occurrence and to better understand why such events happened. These, together with ESARR 2 and additional guidance documentation under development within EUROCONTROL EATMP, ought to provide a common baseline providing consistent data to the development of safety indicators in ATM and to the identification of key risk areas in aviation.
13 Human factors for ATC specialists: a user’s manual for your brain – Kim Cardosi (see Appendix 1 for more details on
bibliography).
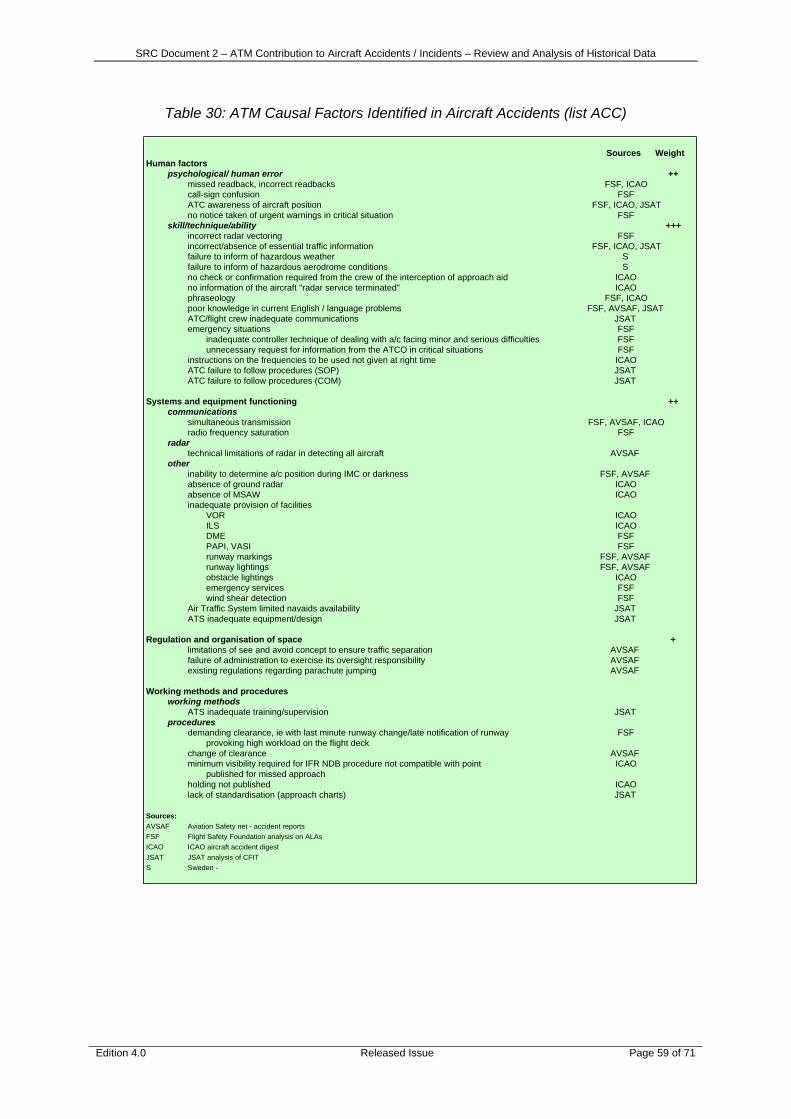
SRC Document 2 – ATM Contribution to Aircraft Accidents / Incidents – Review and Analysis of Historical Data
Edition 4.0 Released Issue Page 59 of 71
Table 30: ATM Causal Factors Identified in Aircraft Accidents (list ACC)
Sources WeightHuman factors
psychological/ human error ++missed readback, incorrect readbacks FSF, ICAOcall-sign confusion FSFATC awareness of aircraft position FSF, ICAO, JSATno notice taken of urgent warnings in critical situation FSF
skill/technique/ability +++incorrect radar vectoring FSFincorrect/absence of essential traffic information FSF, ICAO, JSATfailure to inform of hazardous weather Sfailure to inform of hazardous aerodrome conditions Sno check or confirmation required from the crew of the interception of approach aid ICAOno information of the aircraft "radar service terminated" ICAOphraseology FSF, ICAOpoor knowledge in current English / language problems FSF, AVSAF, JSATATC/flight crew inadequate communications JSATemergency situations FSF
inadequate controller technique of dealing with a/c facing minor and serious difficulties FSFunnecessary request for information from the ATCO in critical situations FSF
instructions on the frequencies to be used not given at right time ICAOATC failure to follow procedures (SOP) JSATATC failure to follow procedures (COM) JSAT
Systems and equipment functioning ++communications
simultaneous transmission FSF, AVSAF, ICAOradio frequency saturation FSF
radar technical limitations of radar in detecting all aircraft AVSAF
otherinability to determine a/c position during IMC or darkness FSF, AVSAFabsence of ground radar ICAOabsence of MSAW ICAOinadequate provision of facilities
VOR ICAOILS ICAODME FSFPAPI, VASI FSFrunway markings FSF, AVSAFrunway lightings FSF, AVSAFobstacle lightings ICAOemergency services FSFwind shear detection FSF
Air Traffic System limited navaids availability JSATATS inadequate equipment/design JSAT
Regulation and organisation of space +limitations of see and avoid concept to ensure traffic separation AVSAFfailure of administration to exercise its oversight responsibility AVSAFexisting regulations regarding parachute jumping AVSAF
Working methods and proceduresworking methods
ATS inadequate training/supervision JSATprocedures
demanding clearance, ie with last minute runway change/late notification of runway FSFprovoking high workload on the flight deck
change of clearance AVSAFminimum visibility required for IFR NDB procedure not compatible with point ICAO
published for missed approachholding not published ICAOlack of standardisation (approach charts) JSAT
Sources:AVSAF Aviation Safety net - accident reportsFSF Flight Safety Foundation analysis on ALAsICAO ICAO aircraft accident digestJSAT JSAT analysis of CFIT S Sweden -
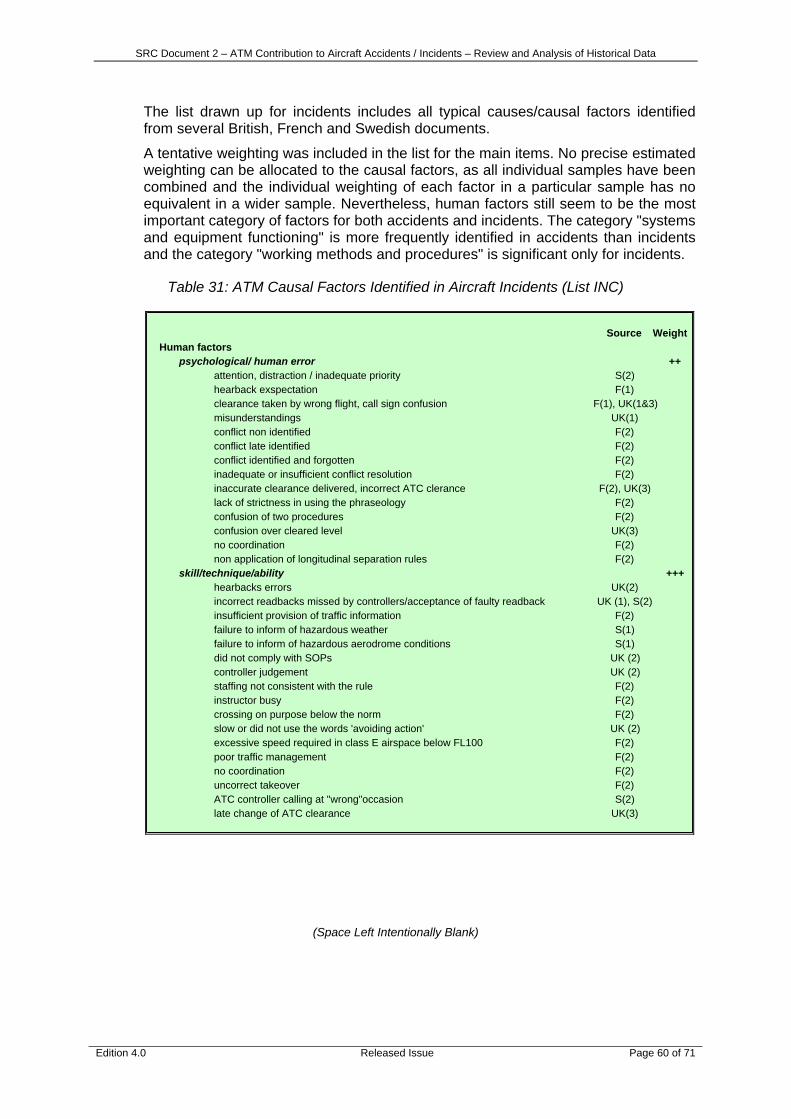
SRC Document 2 – ATM Contribution to Aircraft Accidents / Incidents – Review and Analysis of Historical Data
Edition 4.0 Released Issue Page 60 of 71
The list drawn up for incidents includes all typical causes/causal factors identified from several British, French and Swedish documents.
A tentative weighting was included in the list for the main items. No precise estimated weighting can be allocated to the causal factors, as all individual samples have been combined and the individual weighting of each factor in a particular sample has no equivalent in a wider sample. Nevertheless, human factors still seem to be the most important category of factors for both accidents and incidents. The category "systems and equipment functioning" is more frequently identified in accidents than incidents and the category "working methods and procedures" is significant only for incidents.
Table 31: ATM Causal Factors Identified in Aircraft Incidents (List INC)
Source WeightHuman factors
psychological/ human error ++attention, distraction / inadequate priority S(2)hearback exspectation F(1)clearance taken by wrong flight, call sign confusion F(1), UK(1&3)misunderstandings UK(1)conflict non identified F(2)conflict late identified F(2)conflict identified and forgotten F(2)inadequate or insufficient conflict resolution F(2)inaccurate clearance delivered, incorrect ATC clerance F(2), UK(3)lack of strictness in using the phraseology F(2)confusion of two procedures F(2)confusion over cleared level UK(3)no coordination F(2)non application of longitudinal separation rules F(2)
skill/technique/ability +++hearbacks errors UK(2)incorrect readbacks missed by controllers/acceptance of faulty readback UK (1), S(2)insufficient provision of traffic information F(2)failure to inform of hazardous weather S(1)failure to inform of hazardous aerodrome conditions S(1)did not comply with SOPs UK (2)controller judgement UK (2)staffing not consistent with the rule F(2)instructor busy F(2)crossing on purpose below the norm F(2)slow or did not use the words 'avoiding action' UK (2)excessive speed required in class E airspace below FL100 F(2)poor traffic management F(2)no coordination F(2)uncorrect takeover F(2)ATC controller calling at "wrong"occasion S(2)late change of ATC clearance UK(3)
(Space Left Intentionally Blank)
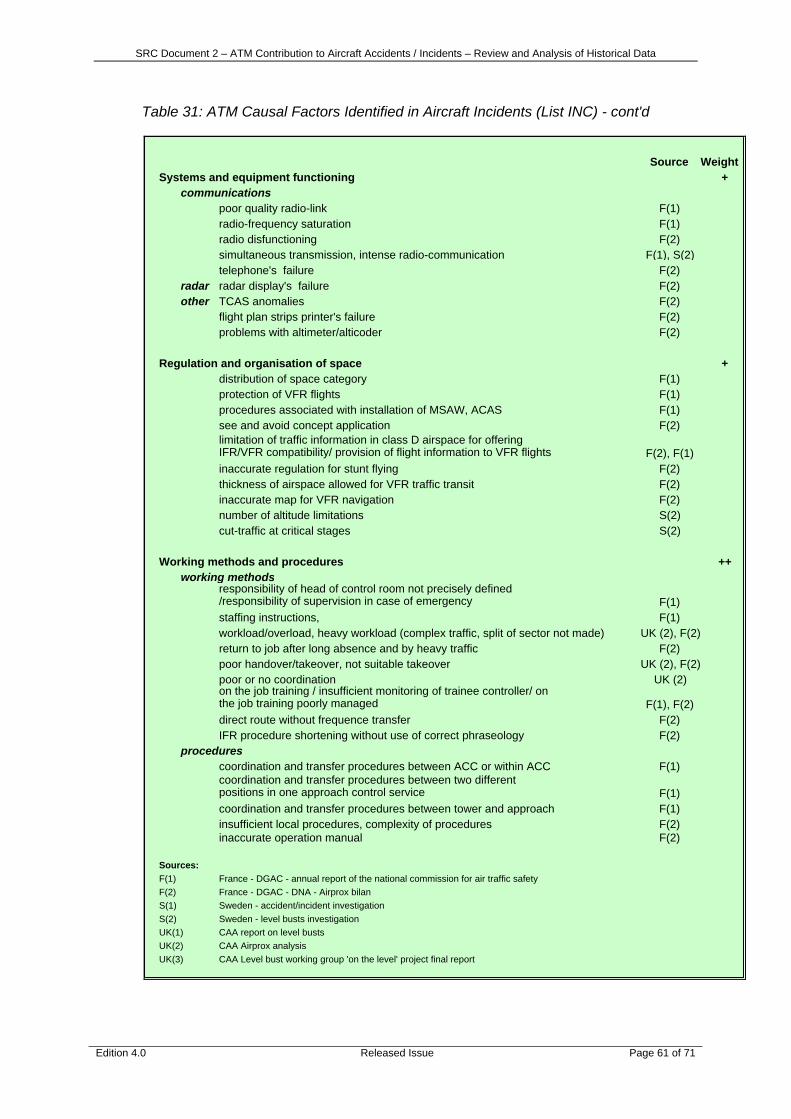
SRC Document 2 – ATM Contribution to Aircraft Accidents / Incidents – Review and Analysis of Historical Data
Edition 4.0 Released Issue Page 61 of 71
Table 31: ATM Causal Factors Identified in Aircraft Incidents (List INC) - cont'd
Source WeightSystems and equipment functioning +
communicationspoor quality radio-link F(1)radio-frequency saturation F(1)radio disfunctioning F(2)simultaneous transmission, intense radio-communication F(1), S(2)telephone's failure F(2)
radar radar display's failure F(2)other TCAS anomalies F(2)
flight plan strips printer's failure F(2)problems with altimeter/alticoder F(2)
Regulation and organisation of space +distribution of space category F(1)protection of VFR flights F(1)procedures associated with installation of MSAW, ACAS F(1)see and avoid concept application F(2)
F(2), F(1)inaccurate regulation for stunt flying F(2)thickness of airspace allowed for VFR traffic transit F(2)inaccurate map for VFR navigation F(2)number of altitude limitations S(2)cut-traffic at critical stages S(2)
Working methods and procedures ++working methods
F(1)staffing instructions, F(1)workload/overload, heavy workload (complex traffic, split of sector not made) UK (2), F(2)return to job after long absence and by heavy traffic F(2)poor handover/takeover, not suitable takeover UK (2), F(2)poor or no coordination UK (2)
F(1), F(2)direct route without frequence transfer F(2)IFR procedure shortening without use of correct phraseology F(2)
procedurescoordination and transfer procedures between ACC or within ACC F(1)
F(1)coordination and transfer procedures between tower and approach F(1)insufficient local procedures, complexity of procedures F(2)inaccurate operation manual F(2)
Sources:F(1) France - DGAC - annual report of the national commission for air traffic safetyF(2) France - DGAC - DNA - Airprox bilanS(1) Sweden - accident/incident investigationS(2) Sweden - level busts investigationUK(1) CAA report on level bustsUK(2) CAA Airprox analysisUK(3) CAA Level bust working group 'on the level' project final report
on the job training / insufficient monitoring of trainee controller/ on the job training poorly managed
coordination and transfer procedures between two different positions in one approach control service
limitation of traffic information in class D airspace for offering IFR/VFR compatibility/ provision of flight information to VFR flights
responsibility of head of control room not precisely defined /responsibility of supervision in case of emergency

SRC Document 2 – ATM Contribution to Aircraft Accidents / Incidents – Review and Analysis of Historical Data
Edition 4.0 Released Issue Page 62 of 71
Furthermore, the list of identified factors and the possible classification of these factors are linked to several issues:
the type of traffic handled by each State (amount of controlled and non-controlled traffic),
the organisation of areas of responsibility between air traffic control providers in the same State (aerodrome control handled together with en-route and approach control or handled by different organisations),
the geographical situation of each State considered, which can lead to numerous airspace organisation problems in areas adjacent to State boundaries.
The wider the responsibilities of the ATS provider, the longer the list of causal factors could be. In order to be comprehensive, this list needs to include airspace organisation issues and regulation issues that are, in many cases, dealt with by the regulatory organisation, not by the ATS provider. It will also be noted that causal factors based on working methods and procedures are not mentioned as frequently in accident reports as in incident reports. This might be explained by the fact that the ATM working context in which the accident took place is not always being fully understood by those investigating aircraft accidents.
5. SAFETY RECOMMENDATIONS / REMEDIAL ACTIONS
Assessment of accident and incident reports, at national level, is carried out in order to develop accident prevention techniques. They lead to the development of remedial actions and safety enhancement measures. The accident investigator and aviation safety communities cannot but agree on the necessity to encourage the international sharing of accident and incident data, and other related occurrences, to quickly address safety problems.
This exchange of information could be even more fruitful if accompanied with an exchange of views on the opportunity of the recommended actions in a specific context. In fact, the safety recommendations/remedial actions included in accident and incident reports may relate to ATM regulations, ATC procedures, equipment enhancement, ATCO training, etc. They may also be relevant to a specific geographical area and/or type of airspace organisation. For example, in the case of the JSSI report related to CFIT, APPROACH/LANDING, RUNWAY INCURSION, or LOSS OF CONTROL, European ATM experts are currently analysing further the ATM-related recommendations in order to check their relevance to the ECAC environment, their feasibility and to prioritise the interventions. Obviously, the result of that work should then lead to the development and implementation of European safety improvement measures, including recommended working practices and when necessary, regulatory requirements.
It should be noted that the JSSI have now launched their JSSI Action Plans Team (APT) as a follow up of the JSSI studies, to deal with the implementation of the safety interventions identified in the studies. EUROCONTROL participates in JSSI APT.
Additionally, EUROCONTROL, in co-operation with ICAO, JAA and GASR have developed the ‘European Action Plan for Prevention of Runway Incursions’ that presents a set of recommendations to be implemented by safety regulators, ATM service providers, aerodromes and airlines in order to avoid, or minimise at best, the number of runway incursion occurrences.

SRC Document 2 – ATM Contribution to Aircraft Accidents / Incidents – Review and Analysis of Historical Data
Edition 4.0 Released Issue Page 63 of 71
The safety recommendations proposed by the relevant material mentioned before can be found on the websites of EUROCONTROL, JAA, FSF, etc.
A list of those recommendations will not be inserted within this document because will not be completed and additionally cannot provide the necessary information on the level of implementation at national level or by the appropriate stakeholders. As such, only the sources of the recommendations are included for further reference to the reader. The sources used only reflect the views of experts working on behalf of the FSF, IATA or the JAA and do not reflect the views of national regulatory bodies or ATS providers.
Sources used to determine the analysis for the safety recommendations: JAA studies: «JSSI CFIT evaluation working group – Final report»,
«Approach and landing joint safety analysis team – Draft report», «JSAT Final Report-Loss of Control», «JSAT Final Report- Turbulence», «JSAT-Runway Incursion-Final report».
FSF ALAR task force: «Analysis of critical factors during approach and landing in accidents and normal flight».
FSF mid-air collisions study: «Mid-air collisions prompt recommendations for improvement of ATC radar systems».
FSF airport safety: «A study of accidents and available and available approach- and landing aids».
FSF search and detect study: «Collisions avoidance must go beyond see and avoid to search and detect».
FSF CFIT study: «Analysis of CFIT accidents of commercial operators». IATA Turboprop study; «IATA safety report (turboprop) 1999». NLR crosswind study: «Safety aspects of aircraft operations in crosswind». FAA runway collisions study: «Runway incursion prevention in Europe
surface movement technology and operations». European Action Plan for Prevention of Runway Incursions,
EUROCONTROL.
6. CONCLUSIONS
This study provides an exhaustive overview of past and existing ATM-related safety data in aviation which has been made available to the SRC and/or public use.
It has served to demonstrate the limitations of existing ATM safety data across the ECAC region, hence justifying a cautious approach to the drawing up of conclusions on the actual ATM safety levels achieved in the European region.
Preliminary results of this study were used to develop the SRC’s inputs to the Performance Review Commission reports, PRR1 and PRR3.
The study also provided key rationales for the SRC to develop its contribution to the EUROCONTROL “Safety Measurement and Improvement Programme”.
The main results of this study can be summarised as follows:
The extent of ATM as a contribution to accidents and incidents has only been assessed in this study by consideration of existing studies and data. These studies are often based on different samples of aircraft types or operations and are often leading to different results. The SRC does not take any responsibility for the results provided by third parties and does not necessarily equate the achieved ATM safety levels across ECAC to the set of safety data collated in this report.

SRC Document 2 – ATM Contribution to Aircraft Accidents / Incidents – Review and Analysis of Historical Data
Edition 4.0 Released Issue Page 64 of 71
ACCIDENTS By examining different periods of time in various sources of data, it was possible to track the evolution of the number of public transport accidents and related fatalities worldwide and within the ECAC region: no trend could be identified over the period 1980-2003;
NLR estimates based on another sample of accidents for the period 1980-2003 shows a downward trend for the period considered on a worldwide basis. The fatal accidents rate varies sharply from year to year and reaches 0·67 accidents aircraft per million flights for the year 2003,
According to Boeing, accidents with airport and ATC as primary causal factors represent 4·7% of all accidents with known causes, 4·5% of hull loss accidents and 5·9% of fatal accidents over the period 1985-1994. The figures for the period 1990-1999 are slightly lower (3·7% for hull loss accidents),
According to a UK CAA analysis of a WAAS fatal accidents sample, accidents with ATC and ground aids as a primary factor represent only 1·7% of fatal accidents worldwide and 2·1% of total accidents within the ECAC area,
According to a Flight Safety Foundation analysis of another sample limited to approach and landing fatal accidents, ATC and ground aids are primary factors identified in 2·2% of accident reports in western-built jets,
Two accident studies published by the FSF shows how frequent is the absence of approach aids or adapted procedure in CFIT or landing accidents. The absence of approach radar and precision approach increases the accident risk by a factor of 3 to 5.
Of the sample of 35 accidents in ECAC countries over the period 1970-1991, reports of which were published in the ICAO Aircraft Accident Digest, 10 accidents (i.e. 28·5% of total accidents) may be considered to be linked to ATS problems. This figure is smaller than the outcome of the JAA Joint Strategic Safety Initiative proceedings. In the analysis of 12 CFITs of large commercial aircraft, ATM as a causal or contributory factor contributes in all but one of the 12 accidents (92%).
The main ATM causal factors identified include "incorrect or inadequate instruction/advice" given by the Air Traffic Controller (ATCO), "ground aid malfunction or unavailable", "inadequate airport support”, “airport equipment”, “airspace organisation (including classification and type of ATS services provided) and regulation”, “human factors”, “inadequate communication between ATC and the flight crew” and “ATC failure to follow standard operating procedures (SOPs)”.
Information regarding general aviation has been compiled in the United States, and leads to the conclusion that a high percentage of fatal accidents are due to pilot-related causes (manoeuvring flight (29·4%), weather (12·4%) or approach (17%).
(Space Left Intentionally Blank)

SRC Document 2 – ATM Contribution to Aircraft Accidents / Incidents – Review and Analysis of Historical Data
Edition 4.0 Released Issue Page 65 of 71
INCIDENTS It has been found that limited safety data exists for types of ATM related
incidents other than AIRPROX. Not only are ASM14 and ATFM15 events often not reported and analysed, but also other types of ATC events are often left unreported,
Information gathered by EUROCONTROL from the ECAC States show a much higher number of ATM related incidents encountered during the last years than those identified via ICAO or IATA sources. On this basis, the number of AIRPROX per movement within ECAC area varied from 49·8 per million movements in 1998 to 80·9 per million movements in 1999 and to 63·7 per million movements in 2000;,
With regard to AIRPROX, “human factors” and “working methods” have been identified as responsible for the majority of incidents reported. In some accident and incident reports, a specific emphasis has been placed on the effect on safety of airspace organisation, which is also felt to be an important contributory factor. Other identified causes include "working methods and procedures", "regulation and organisation of airspace", “poor traffic management” and “poor judgement”, “misunderstandings”, “incorrect or inadequate phraseology”, “hearback errors”, “attention”, “distraction”, “inadequate priority”, and “equipment/communication”,
The analysis of incidents has most of the time been restricted to “WHAT happened” rather than “WHY it happened”, therefore reducing the number and quality of the remedial actions arising from the investigations,
The analysis of incidents has largely placed a focus on the elements of the ATM system which did not work and did not identify where, when and how the ATM system enabled the prevention or reduction of the risk of accidents.
The sample of ATM related incidents available ECAC-wide, shows the variations in existing national taxonomies and the lack of harmonised reporting of incidents, other than AIRPROX, prevents providing a valuable assessment of ATM causes/causal factors to incidents at European level.
Only limited data was found in the area of human factors.
This study provided preliminary draft ATM taxonomies for accidents and incidents based on what has been used so far in a limited number of ECAC States.
(Space Left Intentionally Blank)
14 Airspace Management. 15 Air Traffic Flow Management.
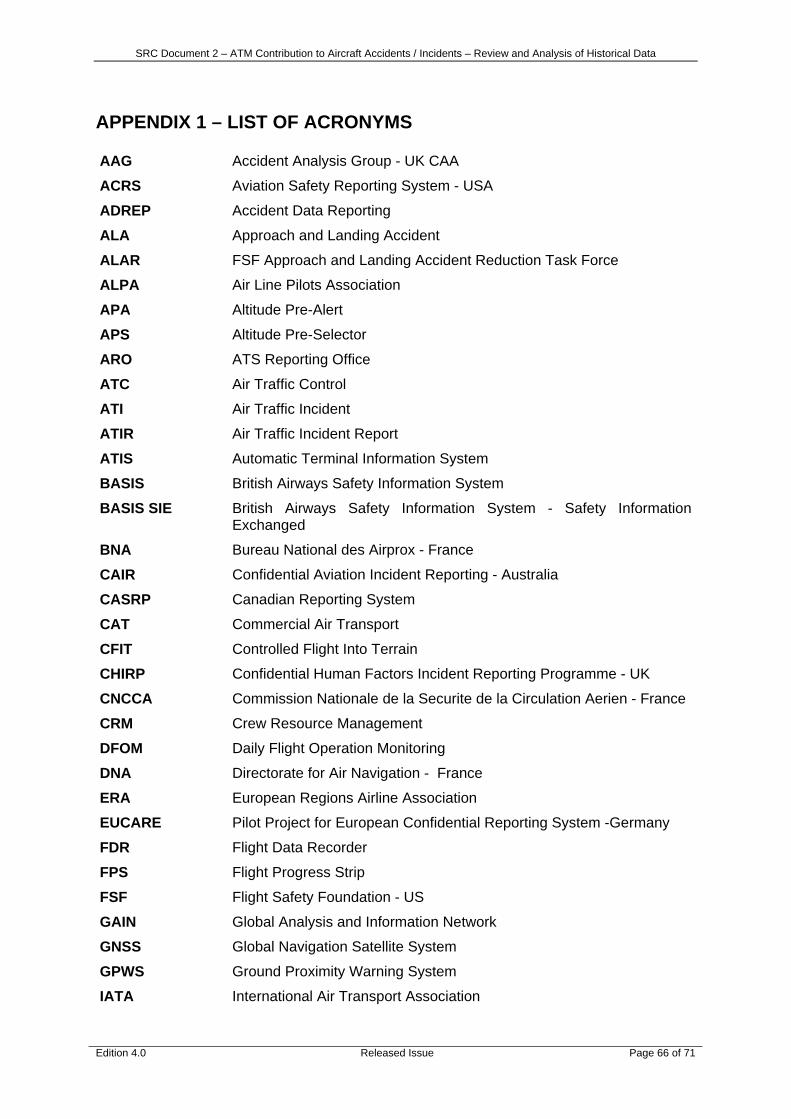
SRC Document 2 – ATM Contribution to Aircraft Accidents / Incidents – Review and Analysis of Historical Data
Edition 4.0 Released Issue Page 66 of 71
APPENDIX 1 – LIST OF ACRONYMS
AAG Accident Analysis Group - UK CAA
ACRS Aviation Safety Reporting System - USA
ADREP Accident Data Reporting
ALA Approach and Landing Accident
ALAR FSF Approach and Landing Accident Reduction Task Force
ALPA Air Line Pilots Association
APA Altitude Pre-Alert
APS Altitude Pre-Selector
ARO ATS Reporting Office
ATC Air Traffic Control
ATI Air Traffic Incident
ATIR Air Traffic Incident Report
ATIS Automatic Terminal Information System
BASIS British Airways Safety Information System
BASIS SIE British Airways Safety Information System - Safety Information Exchanged
BNA Bureau National des Airprox - France
CAIR Confidential Aviation Incident Reporting - Australia
CASRP Canadian Reporting System
CAT Commercial Air Transport
CFIT Controlled Flight Into Terrain
CHIRP Confidential Human Factors Incident Reporting Programme - UK
CNCCA Commission Nationale de la Securite de la Circulation Aerien - France
CRM Crew Resource Management
DFOM Daily Flight Operation Monitoring
DNA Directorate for Air Navigation - France
ERA European Regions Airline Association
EUCARE Pilot Project for European Confidential Reporting System -Germany
FDR Flight Data Recorder
FPS Flight Progress Strip
FSF Flight Safety Foundation - US
GAIN Global Analysis and Information Network
GNSS Global Navigation Satellite System
GPWS Ground Proximity Warning System
IATA International Air Transport Association
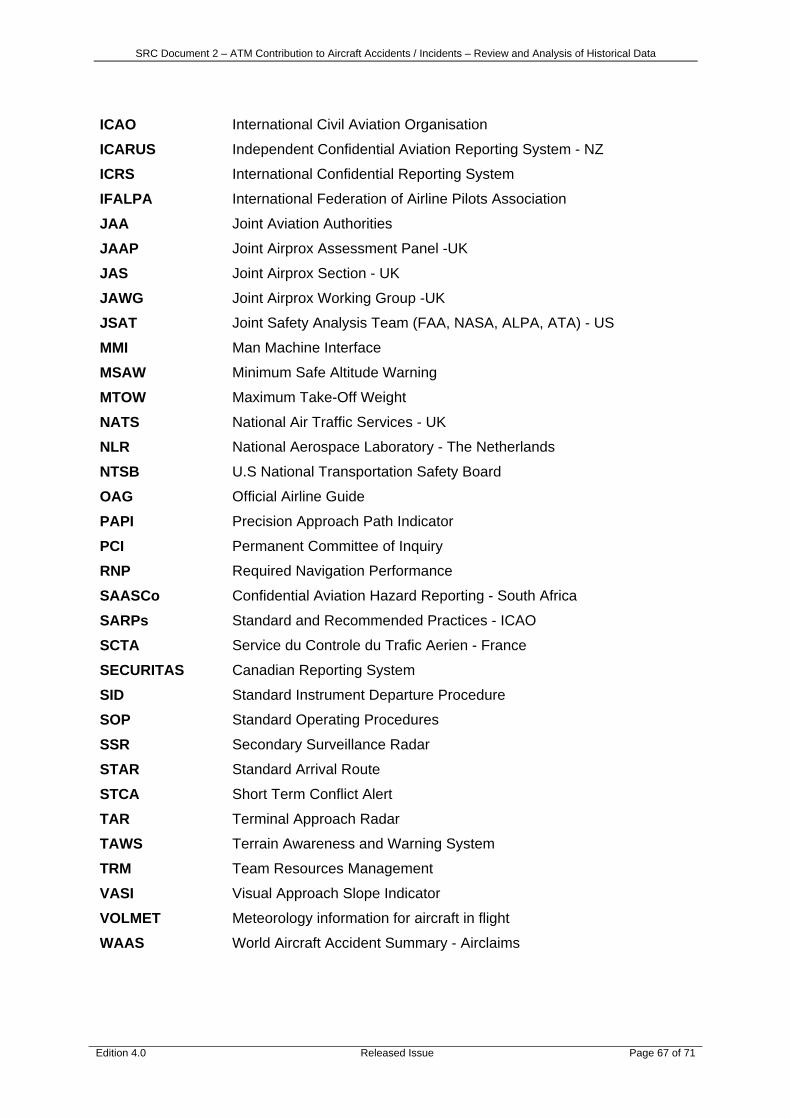
SRC Document 2 – ATM Contribution to Aircraft Accidents / Incidents – Review and Analysis of Historical Data
Edition 4.0 Released Issue Page 67 of 71
ICAO International Civil Aviation Organisation
ICARUS Independent Confidential Aviation Reporting System - NZ
ICRS International Confidential Reporting System
IFALPA International Federation of Airline Pilots Association
JAA Joint Aviation Authorities
JAAP Joint Airprox Assessment Panel -UK
JAS Joint Airprox Section - UK
JAWG Joint Airprox Working Group -UK
JSAT Joint Safety Analysis Team (FAA, NASA, ALPA, ATA) - US
MMI Man Machine Interface
MSAW Minimum Safe Altitude Warning
MTOW Maximum Take-Off Weight
NATS National Air Traffic Services - UK
NLR National Aerospace Laboratory - The Netherlands
NTSB U.S National Transportation Safety Board
OAG Official Airline Guide
PAPI Precision Approach Path Indicator
PCI Permanent Committee of Inquiry
RNP Required Navigation Performance
SAASCo Confidential Aviation Hazard Reporting - South Africa
SARPs Standard and Recommended Practices - ICAO
SCTA Service du Controle du Trafic Aerien - France
SECURITAS Canadian Reporting System
SID Standard Instrument Departure Procedure
SOP Standard Operating Procedures
SSR Secondary Surveillance Radar
STAR Standard Arrival Route
STCA Short Term Conflict Alert
TAR Terminal Approach Radar
TAWS Terrain Awareness and Warning System
TRM Team Resources Management
VASI Visual Approach Slope Indicator
VOLMET Meteorology information for aircraft in flight
WAAS World Aircraft Accident Summary - Airclaims

SRC Document 2 – ATM Contribution to Aircraft Accidents / Incidents – Review and Analysis of Historical Data
Edition 4.0 Released Issue Page 68 of 71
APPENDIX 2 – TERMS AND DEFINITIONS
Accident ICAO Annex 13 An occurrence associated with the operation of an aircraft which takes place between the time any person boards the aircraft with the intention of flight until such time as all such persons have disembarked, in which:
a) a person is fatally or seriously injured as a result of:
- being in the aircraft, or
- direct contact with any part of the aircraft, including parts which have become detached from the aircraft, or
- direct exposure to jet blast,
except when the injuries are from natural causes, self-inflicted or inflicted by other persons, or when the injuries are to stowaways hiding outside the areas normally available to the passengers and crew; or
b) the aircraft sustains damage or structural failure which:
- adversely affect the structural strength, performance or flight characteristics of the aircraft, and
- would normally require major repair or replacement of the affected component
except for engine failure or damage, when the damage is limited to the engine, its cowlings or accessories; or for damages limited to propellers, wing tips, antennas, tires, brakes, fairings, small dents or puncture holes in the aircraft skin; or
c) the aircraft is missing or is completely inaccessible.
Note 1.-For statistical uniformity only, an injury resulting in death within thirty days of the date of the accident is classified as a fatal injury by ICAO.
Note 2.- An aircraft is considered to be missing when the official search has been terminated and the wreckage has not been located.
Airprox ICAO (Doc 4444) The code word used in an air traffic incident report to designate aircraft proximity.
Ref.:- ICAO Doc 4444- Air proximity is “A situation in which, in the opinion of a pilot or an air traffic services personnel, the distance between aircraft as well as their relative positions and speed have been such that the safety of the aircraft involved may have been compromised. An aircraft proximity is classified as follows …“ (Four levels of severity are mentioned- refer to appropriate section of this document )
Causal factor UK CAA An event or item which was directly instrumental in the causal chain of events leading to the accident.
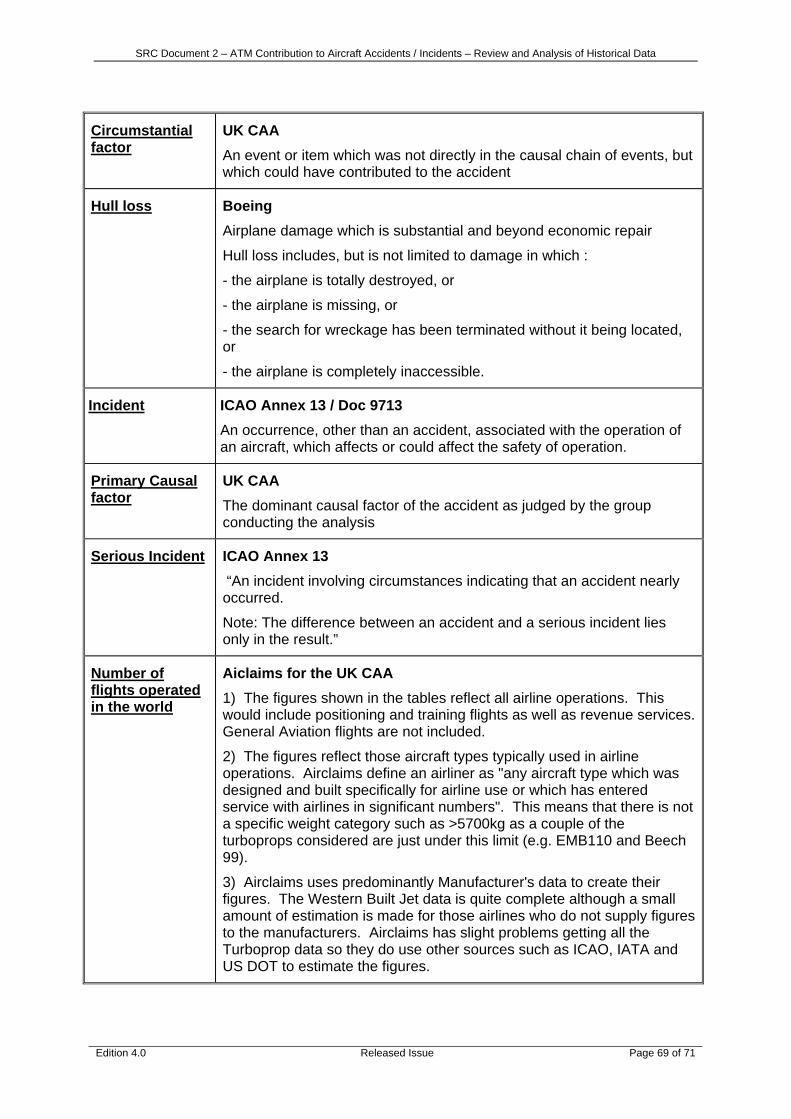
SRC Document 2 – ATM Contribution to Aircraft Accidents / Incidents – Review and Analysis of Historical Data
Edition 4.0 Released Issue Page 69 of 71
Circumstantial factor
UK CAA An event or item which was not directly in the causal chain of events, but which could have contributed to the accident
Hull loss Boeing Airplane damage which is substantial and beyond economic repair
Hull loss includes, but is not limited to damage in which :
- the airplane is totally destroyed, or
- the airplane is missing, or
- the search for wreckage has been terminated without it being located, or
- the airplane is completely inaccessible.
Incident ICAO Annex 13 / Doc 9713 An occurrence, other than an accident, associated with the operation of an aircraft, which affects or could affect the safety of operation.
Primary Causal factor
UK CAA The dominant causal factor of the accident as judged by the group conducting the analysis
Serious Incident ICAO Annex 13 “An incident involving circumstances indicating that an accident nearly occurred.
Note: The difference between an accident and a serious incident lies only in the result.”
Number of flights operated in the world
Aiclaims for the UK CAA
1) The figures shown in the tables reflect all airline operations. This would include positioning and training flights as well as revenue services. General Aviation flights are not included.
2) The figures reflect those aircraft types typically used in airline operations. Airclaims define an airliner as "any aircraft type which was designed and built specifically for airline use or which has entered service with airlines in significant numbers". This means that there is not a specific weight category such as >5700kg as a couple of the turboprops considered are just under this limit (e.g. EMB110 and Beech 99).
3) Airclaims uses predominantly Manufacturer's data to create their figures. The Western Built Jet data is quite complete although a small amount of estimation is made for those airlines who do not supply figures to the manufacturers. Airclaims has slight problems getting all the Turboprop data so they do use other sources such as ICAO, IATA and US DOT to estimate the figures.
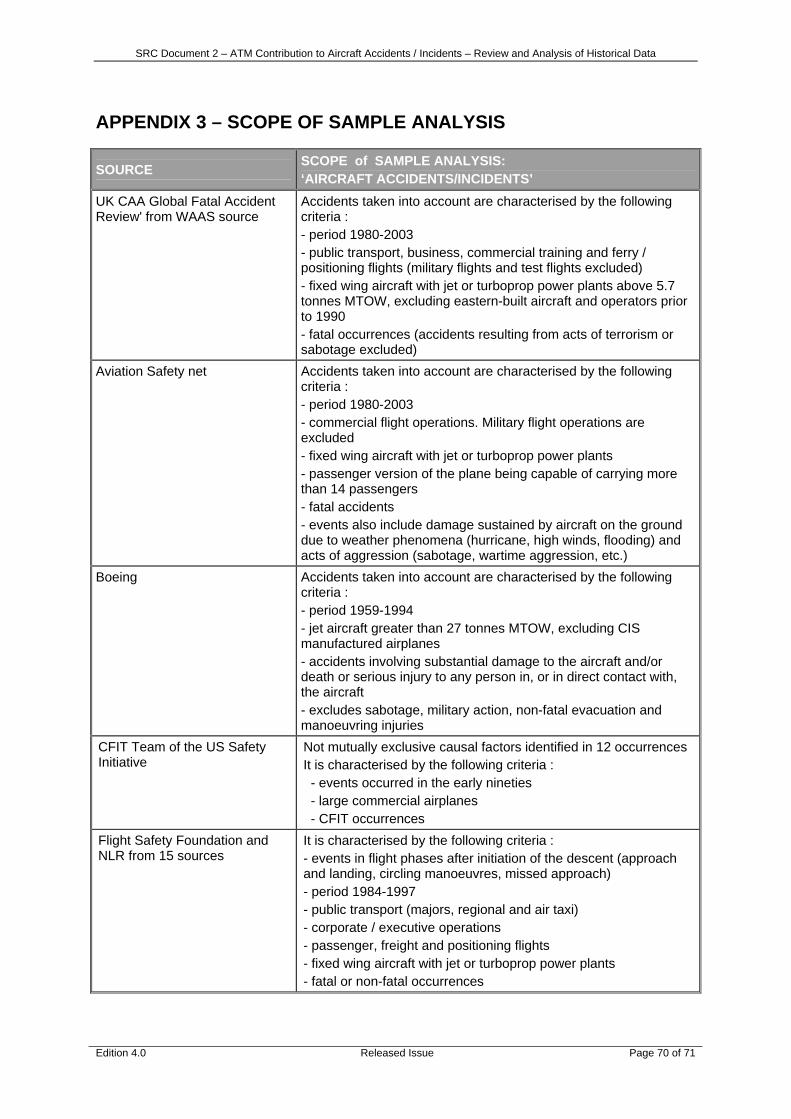
SRC Document 2 – ATM Contribution to Aircraft Accidents / Incidents – Review and Analysis of Historical Data
Edition 4.0 Released Issue Page 70 of 71
APPENDIX 3 – SCOPE OF SAMPLE ANALYSIS
SOURCE SCOPE of SAMPLE ANALYSIS: ‘AIRCRAFT ACCIDENTS/INCIDENTS’
UK CAA Global Fatal Accident Review' from WAAS source
Accidents taken into account are characterised by the following criteria : - period 1980-2003 - public transport, business, commercial training and ferry / positioning flights (military flights and test flights excluded) - fixed wing aircraft with jet or turboprop power plants above 5.7 tonnes MTOW, excluding eastern-built aircraft and operators prior to 1990 - fatal occurrences (accidents resulting from acts of terrorism or sabotage excluded)
Aviation Safety net Accidents taken into account are characterised by the following criteria : - period 1980-2003 - commercial flight operations. Military flight operations are excluded - fixed wing aircraft with jet or turboprop power plants - passenger version of the plane being capable of carrying more than 14 passengers - fatal accidents - events also include damage sustained by aircraft on the ground due to weather phenomena (hurricane, high winds, flooding) and acts of aggression (sabotage, wartime aggression, etc.)
Boeing Accidents taken into account are characterised by the following criteria : - period 1959-1994 - jet aircraft greater than 27 tonnes MTOW, excluding CIS manufactured airplanes - accidents involving substantial damage to the aircraft and/or death or serious injury to any person in, or in direct contact with, the aircraft - excludes sabotage, military action, non-fatal evacuation and manoeuvring injuries
CFIT Team of the US Safety Initiative
Not mutually exclusive causal factors identified in 12 occurrences It is characterised by the following criteria : - events occurred in the early nineties - large commercial airplanes - CFIT occurrences
Flight Safety Foundation and NLR from 15 sources
It is characterised by the following criteria : - events in flight phases after initiation of the descent (approach and landing, circling manoeuvres, missed approach) - period 1984-1997 - public transport (majors, regional and air taxi) - corporate / executive operations - passenger, freight and positioning flights - fixed wing aircraft with jet or turboprop power plants - fatal or non-fatal occurrences
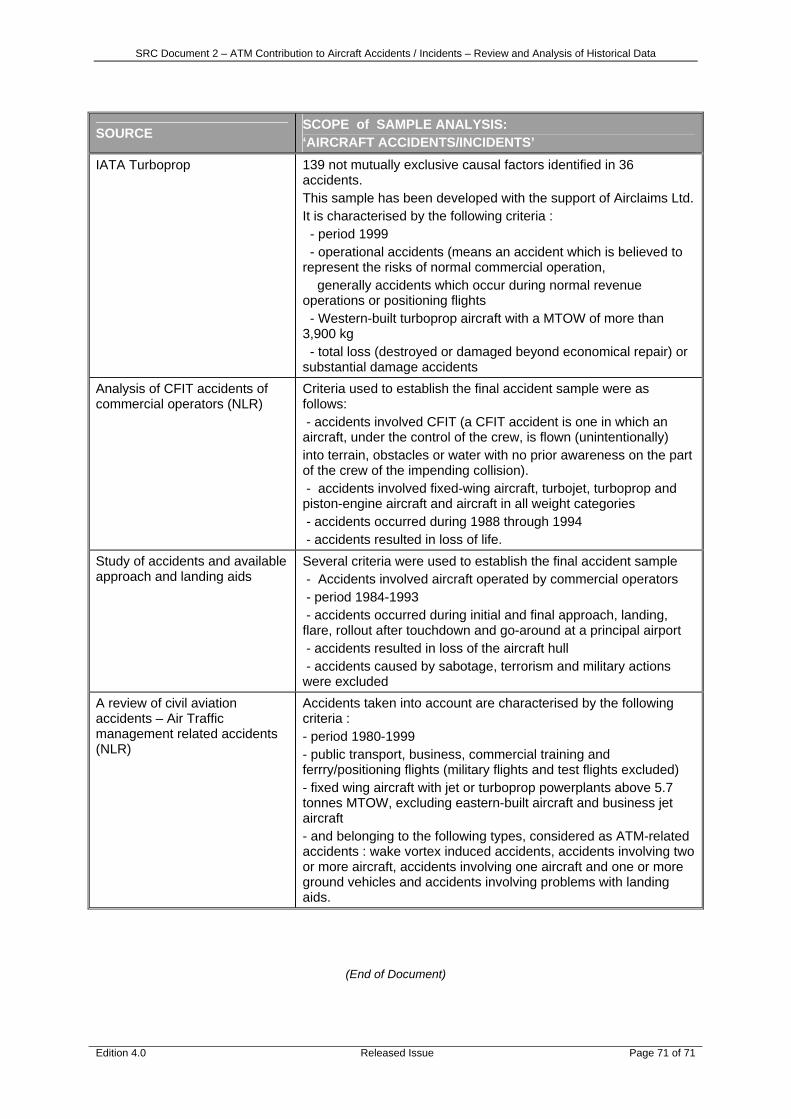
SRC Document 2 – ATM Contribution to Aircraft Accidents / Incidents – Review and Analysis of Historical Data
Edition 4.0 Released Issue Page 71 of 71
SOURCE SCOPE of SAMPLE ANALYSIS: ‘AIRCRAFT ACCIDENTS/INCIDENTS’
IATA Turboprop 139 not mutually exclusive causal factors identified in 36 accidents. This sample has been developed with the support of Airclaims Ltd. It is characterised by the following criteria : - period 1999 - operational accidents (means an accident which is believed to represent the risks of normal commercial operation, generally accidents which occur during normal revenue operations or positioning flights - Western-built turboprop aircraft with a MTOW of more than 3,900 kg - total loss (destroyed or damaged beyond economical repair) or substantial damage accidents
Analysis of CFIT accidents of commercial operators (NLR)
Criteria used to establish the final accident sample were as follows: - accidents involved CFIT (a CFIT accident is one in which an aircraft, under the control of the crew, is flown (unintentionally) into terrain, obstacles or water with no prior awareness on the part of the crew of the impending collision). - accidents involved fixed-wing aircraft, turbojet, turboprop and piston-engine aircraft and aircraft in all weight categories - accidents occurred during 1988 through 1994 - accidents resulted in loss of life.
Study of accidents and available approach and landing aids
Several criteria were used to establish the final accident sample - Accidents involved aircraft operated by commercial operators - period 1984-1993 - accidents occurred during initial and final approach, landing, flare, rollout after touchdown and go-around at a principal airport - accidents resulted in loss of the aircraft hull - accidents caused by sabotage, terrorism and military actions were excluded
A review of civil aviation accidents – Air Traffic management related accidents (NLR)
Accidents taken into account are characterised by the following criteria : - period 1980-1999 - public transport, business, commercial training and ferrry/positioning flights (military flights and test flights excluded) - fixed wing aircraft with jet or turboprop powerplants above 5.7 tonnes MTOW, excluding eastern-built aircraft and business jet aircraft - and belonging to the following types, considered as ATM-related accidents : wake vortex induced accidents, accidents involving two or more aircraft, accidents involving one aircraft and one or more ground vehicles and accidents involving problems with landing aids.
(End of Document)