SPWA SPMUD Evaluation TM FINAL 20050112
103
Technical Memorandum South Placer Regional Wastewater & Recycled Water Systems Evaluation Project Subject: Proposed 2005 Regional Service Area Boundary - FINAL Prepared For: Art O’Brien - City of Roseville Richard Stein - SPMUD Ed Wydra - Placer County Prepared By: Richard Hunn & Brian Grattidge – ESA Pete Bellows & Chris Peters – B&C Mai-Tram Le - RMC Reviewed By: Dave Richardson – RMC Date: January 13, 2005 Reference: 091-4.01 I. INTRODUCTION The 1996 Wastewater Master Plan (1996 Master Plan) Environmental Impact Report (EIR) Service Area (Regional Service Area) boundary was established with the adoption of the 1996 Master Plan and associated EIR. The Regional Service Area, shown in Figure 1 of Attachment A, includes the City of Roseville, the South Placer Municipal Utilities District (SPMUD), and three unincorporated areas of Placer County: Sunset, Granite Bay (i.e. SMD-2), and Dry Creek/West Placer. SPMUD includes the City of Rocklin, the Town of Loomis, and portions of unincorporated Placer County, including the community of Penryn. In all, the Regional Service Area covers approximately 54,550 acres. Since 1996, ten areas outside the service area have been annexed by the SPWA partner agencies. These areas are shown in Figure 1 as “House Keeping Areas.” Eight of these areas have been annexed by South Placer Municipal Utility District (SPMUD) and two, the West Roseville Specific Plan and Pleasant Grove Wastewater Treatment Plant, have been annexed by the City of Roseville. Three of the ten annexed areas are partially located within the Regional Service Area. These areas include portions of the West Roseville Specific Plan, Loomis Hills Estates, and the Sierra College annexations. Annexed areas, which are located outside the Regional Service Area, total approximately 3,277 acres as presented in Table 1. As part of this South Placer Regional Wastewater & Recycled Water Systems Evaluation Project (Project), the South Placer Wastewater Authority (SPWA) partner agencies would like to revise the Regional Service Area boundary to encompass all the annexed areas which are located outside Regional Service Area. With the proposed revisions, the Regional Service Area would then cover approximately 57,827 acres as shown in Figure 2 of Attachment A. This technical memorandum (TM) presents a summary of the California Environmental Quality Act (CEQA) compliance references and a regional treatment capacity assessment based on up to date estimated unit flow factors for the current service area. The existing CEQA documentation combined with information provided in this TM constitutes the necessary background documentation for revising the Regional Service Area boundary to include the ten annexation areas. This TM is organized as follows: I. Introduction II. Annexation Areas and CEQA Compliance III. Wastewater Treatment Capacity Assessment IV. Conclusions
Transcript of SPWA SPMUD Evaluation TM FINAL 20050112

Technical Memorandum South Placer Regional Wastewater & Recycled Water Systems Evaluation Project Subject: Proposed 2005 Regional Service Area Boundary - FINAL
Prepared For: Art O’Brien - City of Roseville Richard Stein - SPMUD Ed Wydra - Placer County
Prepared By: Richard Hunn & Brian Grattidge – ESA Pete Bellows & Chris Peters – B&C Mai-Tram Le - RMC
Reviewed By: Dave Richardson – RMC
Date: January 13, 2005
Reference: 091-4.01
I. INTRODUCTION The 1996 Wastewater Master Plan (1996 Master Plan) Environmental Impact Report (EIR) Service Area (Regional Service Area) boundary was established with the adoption of the 1996 Master Plan and associated EIR. The Regional Service Area, shown in Figure 1 of Attachment A, includes the City of Roseville, the South Placer Municipal Utilities District (SPMUD), and three unincorporated areas of Placer County: Sunset, Granite Bay (i.e. SMD-2), and Dry Creek/West Placer. SPMUD includes the City of Rocklin, the Town of Loomis, and portions of unincorporated Placer County, including the community of Penryn. In all, the Regional Service Area covers approximately 54,550 acres. Since 1996, ten areas outside the service area have been annexed by the SPWA partner agencies. These areas are shown in Figure 1 as “House Keeping Areas.” Eight of these areas have been annexed by South Placer Municipal Utility District (SPMUD) and two, the West Roseville Specific Plan and Pleasant Grove Wastewater Treatment Plant, have been annexed by the City of Roseville. Three of the ten annexed areas are partially located within the Regional Service Area. These areas include portions of the West Roseville Specific Plan, Loomis Hills Estates, and the Sierra College annexations. Annexed areas, which are located outside the Regional Service Area, total approximately 3,277 acres as presented in Table 1. As part of this South Placer Regional Wastewater & Recycled Water Systems Evaluation Project (Project), the South Placer Wastewater Authority (SPWA) partner agencies would like to revise the Regional Service Area boundary to encompass all the annexed areas which are located outside Regional Service Area. With the proposed revisions, the Regional Service Area would then cover approximately 57,827 acres as shown in Figure 2 of Attachment A. This technical memorandum (TM) presents a summary of the California Environmental Quality Act (CEQA) compliance references and a regional treatment capacity assessment based on up to date estimated unit flow factors for the current service area. The existing CEQA documentation combined with information provided in this TM constitutes the necessary background documentation for revising the Regional Service Area boundary to include the ten annexation areas. This TM is organized as follows:
I. Introduction II. Annexation Areas and CEQA Compliance III. Wastewater Treatment Capacity Assessment IV. Conclusions

Technical Memorandum Proposed 2005 SPWA Service Boundary South Placer Regional Wastewater & Recycled Water Systems Evaluation Project Page 2 of 3
SPWA SPMUD Evaluation TM FINAL 20050113.doc
II. ANNEXATION AREAS AND CEQA COMPLIANCE
The ten annexation areas to be included in the proposed Regional Service Area boundary revision are listed in Table 1. Table 1 also shows the effective date of the Local Agency Formation Commission (LAFCO) action for lead agency approval, the type of (CEQA) documentation prepared for each project, the total acreage of each project, and the acres outside of the existing Regional Service Area boundary. All of the annexations have been approved by their respective Lead Agencies. Loomis Hills Estates has been approved by the Town of Loomis, and is already within the town limits, but is in the process of having the entire project area annexed into the SPMUD’s service area. Table 1: Annexation Areas Considered for Inclusion in Regional Service Area
No. Project Name Service Provider
LAFCO Effective
Date
CEQA Compliance
Total Project Acres
Acres Outside of the Regional Service Area
Boundary
1 West Roseville Specific Plan Area
City of Roseville 8/18/2004 EIR 3,162 1,966
2 Pleasant Grove Wastewater Treatment Plant
City of Roseville 4/18/2001 EIR 180 180
3 Clover Valley Lakes SPMUD 2/26/1998 EIR 642 642
4 Loomis Hills Estates SPMUD Pending EIR 322 202
5 Sierra College SPMUD 5/1/2003 Negative Declaration 375 244
6 Poppy Ridge SPMUD 4/19/2004 Negative Declaration 20 20
7 Clark Powers Elem. School SPMUD 3/14/2003 Exemption 10 10
8 Miller Annexation SPMUD 9/24/2004 Exemption 10 10
9 Reyneveld Annexation SPMUD 2/27//2003 Exemption 3 3
10 Cook Annexation SPMUD 3/2/2004 Negative Declaration 0.1 0.1
Total 4,724 3,277
III. WASTEWATER TREATMENT CAPACITY ASSESSMENT
In the CEQA documentation prepared for each annexation area, the effects on the sewer service provider were considered. For the projects that received an exemption, no discernible effect was identified. For the other projects, it was determined that sewer service was available. However, only the West Roseville Specific Plan and Pleasant Grove Wastewater Treatment Plant EIRs considered in detail the possible cumulative impacts of the project with respect to all potential development projects on the ultimate planned treatment capacity of SPWA per the 1996 Master Plan. As such, a supplemental assessment was conducted for the SPMUD service area annexations as part of this Technical Memorandum. According to personal communication with Richard Stein of SPMUD on December 15, 2004, the eight annexation projects within SPMUD’s service area generate wastewater in the amount of approximately 1,100 Equivalent Dwelling Units (EDUs) in excess of those accounted for in the 1996 Master Plan. When annexed by the local jurisdiction with land use authority (e.g. City of Rocklin or Town of Loomis), and committed to service by SPMUD, CEQA documentation was provided. In order to verify the existing CEQA findings that these additional 1,100 EDUs will not rely on the capacity at the two

Technical Memorandum Proposed 2005 SPWA Service Boundary South Placer Regional Wastewater & Recycled Water Systems Evaluation Project Page 3 of 3
SPWA SPMUD Evaluation TM FINAL 20050112.doc
wastewater treatment plants (WWTPs) that were already effectively assigned to others under the 1996 Master Plan and EIR, an assessment of SPMUD’s service area was performed. The results of this assessment demonstrate that, even with the inclusion of these 1,100 EDUs, the total flows estimated from SPMUD under the “build out” scenario would be less than what was previously assumed in the 1996 Master Plan as discussed below. In Workshop #3 of this Project, the RMC team presented current data indicating that the unit flow rate of 260 gpd/du used in sizing treatment plant capacity in the 1996 Master Plan was higher than current monitored flows and water use records would indicate. The water use records and current monitored flows both indicated the unit flow rate to be approximately 230 gpd/du. The difference between these two unit flow rates provides an allowance for additional EDUs relative to the cumulative analysis of regional WWTP capacity (within the planning context of the 1996 Master Plan and EIR). The 1996 Master Plan allocated a total of 44,017 equivalent residential dwelling units (single and multi-family) within the SPMUD service area at buildout.1 With the 30 gpd/du difference between the two unit flow rates, this is equivalent to nearly 5,600 residential dwelling units that contribute 230 gpd/du. This far exceeds the 1,100 dwelling units in question. This data is presented in detail in Table 2.
Table 2: Unit Flow Factors, Estimated Flows and Associated EDUs at Buildout Conditions
Service Provider Estimated EDUs at
Buildout a
Estimated Flow per 1996 Master Plan b
(mgd)
Estimated Flow per 2004 Proposed
Unit Flow Factor c (mgd)
Excess Flow
Difference (mgd)
Excess EDUs per 2004
Proposed Unit Flow Factor d
SPMUD 44,017 11.4 10.1 1.3 5,600 a. Per 1996 Master Plan b. Estimated flow is calculated based on a unit flow factor of 260 gpd/edu used in the 1996 Master Plan for sizing
treatment facilities. c. 2004 estimated unit flow factor of 230 gpd/edu is based on 2004 temporary dry weather flow monitoring data for
the SPWA area. d. EDUs rounded downward to the nearest 100 to provide a conservative estimate. IV. CONCLUSIONS
The addition of the ten annexation areas, shown in Figure 1 of Attachment A, would revise the Regional Service Area beyond the boundary adopted with the 1996 Master Plan. However, the results of the analysis presented above indicated that, from the standpoint of regional wastewater treatment capacity designed for development planned under the 1996 Master Plan, a reduction in actual estimated unit flow factors has resulted in treatment capacity for additional EDUs that would more than adequately compensate for the increase of 1,100 proposed dwelling units in the SPMUD service area. The land use agencies for these ten projects have taken appropriate action, and have prepared documentation in accordance with CEQA. The projects have been annexed by the local sewer service provider, with the exception of Loomis Hills Estates, which is pending annexation into SPMUD. Lastly, the assessment discussed in this TM has shown that the inclusion of these annexed areas will not adversely impair the two treatment plants’ ability to serve estimated future “build out” conditions in the Regional Service Area. In the future, it is recommend that this planned regional treatment plant capacity evaluation/verification be conducted for individual annexations, as was done for the West Roseville Specific Plan, in order to verify that sufficient regional treatment plant capacity is planned for to meet these needs, or to allow for adequate time to plan for adjusting to these needs.
1 From Table 1B of TM I-4 Supplemental Update of the 1996 Master Plan.

Technical Memorandum Proposed 2005 SPWA Service Boundary South Placer Regional Wastewater & Recycled Water Systems Evaluation Project Attachment A
SPWA SPMUD Evaluation TM FINAL 20050112.doc
Attachment A
Existing and Proposed Regional Service Area
Boundary Maps

8065
80
Pleasant GroveWWTP
BASELINE RD
KING RD
PFE RD
FIDDY
MENT
RD
SUNSET BLVD
E CATLETT RD
BART
ON R
D
AUBU
RN FO
LSOM
RD
SIERR
A COL
LEGE
BLVD
LAIR
D RD
DOUGLAS BLVD
PACIFIC ST
ELVERTA RD
WATT
AVE
INDU
STRI
AL AV
E
EUREKA RD
CIRBY WAY
VINEYARD RD
S DOW
D AVE
VAL V
ERDE
RD
ATHENS AVE
FOOT
HILL
S BLV
D
MAIN ST
HORSESHOE BAR RD
WASH
INGT
ON BL
VD
PLEASANT GROVE BLVD
ROCKLIN RD
JUNCTION BLVD
WELLS AVE
HUMP
HREY
RD
ENGLISH COLONY WAY
SUNR
ISE AV
E
PENR
YN R
D
5TH S
T
DICK COOK RD
ROSEVILLE RD
E ROSEVILLE PKWY
RIEGO RD
VERNON ST
ATKIN
SON ST
PLEA
SANT
GRO
VE R
D
W ELVERTA RD
N HA
RDIN
G BL
VD
ATLANTIC ST
RIVE
RSID
E AVE
CATLETT RD
ROSEVILLE PKWY
CHURCH ST
HOWSLEY RD
6TH ST
HARD
ING
BLVD
OLD AUBURN RD
ROCK
Y RID
GE D
R
AUBU
RN BL
VD
SUNR
ISE BL
VD
WHITN
EY BL
VD
MIDAS AVE
CROWDER LN
3RD ST
ARGONAUT AVE
S CIRBY WAY
FIDDY
MENT
DR
FOOT
HILL
BLVD
BLUE OAKS BLVD
TAYLOR ST
CIRBY WAY
TAYLO
R RD
KING
RD
SUNSET BLVD
FOOTHILLS BLVD
SUNRISE BLVD
FOOT
HILL
S BLV
D
TAYLO
R RD
West Roseville
LoomisHills
Clover Valley
SierraCollege
Miller
Poppy Ridge
Clark PowersElementary
School
Reyneveld
Cook
SOURCE: SPWA, 1996; ESA, 1996, 2004South Placer Regional Wastewater / 204250
Figure 1.0Existing 1996 Service Area Boundary and "House Keeping Areas"
South Placer Regional Wastewaterand Recycled Water
Systems Evaluation ProjectExisting 1996 Service Area Boundary
and "House Keeping Areas"
House Keeping AreasClover ValleyCookSierra CollegeLoomis HillsMillerWest RosevillePoppy RidgeReyneveldClark Powers Elementary SchoolPleasant Grove WWTPExisting Service Area (1996)Not in Service AreaParcels
0 2
Miles

8065
80
BASELINE RD
KING RD
PFE RD
FIDDY
MENT
RD
SUNSET BLVD
E CATLETT RD
BART
ON R
D
AUBU
RN FO
LSOM
RD
SIERR
A COL
LEGE
BLVD
LAIR
D RD
DOUGLAS BLVD
PACIFIC ST
ELVERTA RD
WATT
AVE
INDU
STRI
AL AV
E
EUREKA RD
CIRBY WAY
VINEYARD RD
S DOW
D AVE
VAL V
ERDE
RD
ATHENS AVE
FOOT
HILL
S BLV
D
MAIN ST
HORSESHOE BAR RD
WASH
INGT
ON BL
VD
PLEASANT GROVE BLVD
ROCKLIN RD
JUNCTION BLVD
WELLS AVE
HUMP
HREY
RD
ENGLISH COLONY WAY
SUNR
ISE AV
E
PENR
YN R
D
5TH S
T
DICK COOK RD
ROSEVILLE RD
E ROSEVILLE PKWY
RIEGO RD
VERNON ST
ATKIN
SON ST
PLEA
SANT
GRO
VE R
D
W ELVERTA RD
N HA
RDIN
G BL
VD
ATLANTIC ST
RIVE
RSID
E AVE
CATLETT RD
ROSEVILLE PKWY
CHURCH ST
HOWSLEY RD
6TH ST
HARD
ING
BLVD
OLD AUBURN RD
ROCK
Y RID
GE D
R
AUBU
RN BL
VD
SUNR
ISE BL
VD
WHITN
EY BL
VD
MIDAS AVE
CROWDER LN
3RD ST
ARGONAUT AVE
S CIRBY WAY
FIDDY
MENT
DR
FOOT
HILL
BLVD
BLUE OAKS BLVD
TAYLOR ST
CIRBY WAY
TAYLO
R RD
KING
RD
SUNSET BLVD
FOOTHILLS BLVD
SUNRISE BLVD
FOOT
HILL
S BLV
D
TAYLO
R RD
SOURCE: SPWA, 1996; ESA, 1996, 2004South Placer Regional Wastewater / 204250
Figure 2.0Proposed Service Area (2005)
South Placer Regional Wastewaterand Recycled Water
Systems Evaluation ProjectProposed Service Area (2005)
Proposed Service AreaNot in Service AreaParcels
0 2
Miles

October 2005 1
Technical Memorandum Water andEnvironment
SOUTH PLACER WASTEWATER AUTHORITY (SPWA) WASTEWATER AND RECYCLED WATER SYSTEMS EVALUATION PROJECT
Subject: Dry Weather Flow Projection for the 2005 Proposed SPWA Service Area Technical Memorandum - FINAL
Prepared For: Art O’Brien – City of Roseville
Prepared by: Pete Bellows/Chris Peters – Brown and Caldwell
Reviewed by: Dave Richardson/Gisa Ju – RMC
Date: October 21, 2005
Reference: 0091-004 Task 2
1 Introduction This technical memorandum (TM) summarizes the dry weather wastewater flow (DWF) projections for existing and future conditions for the 2005 proposed SPWA service area boundary. DWF projections are used to:
1. Project flows for the analysis of the SPWA wastewater treatment plants
2. Identify changes in dry weather flow projections (within the 1996 Master Plan EIR Service Area) since the completion of the 1996 Wastewater Master Plan
2 Wastewater Flow Components Typically, wastewater consists of three components: base sanitary flow (BSF), groundwater infiltration (GWI), and rainfall dependent infiltration and inflow (RDI/I). These components are shown on Figure 1. BSF and GWI during dry weather constitute DWF. Base sanitary flow is generated from residential, commercial, industrial, and public sources that discharge into the wastewater collection system. Base sanitary flow varies during the day in a diurnal pattern with the lowest flow during early morning hours when most people are asleep and businesses are closed, and the highest flow in mid-morning after people get ready for their day’s activities. GWI occurs when groundwater levels are above the inverts of the collection system pipes and when the collection system has faulty joints or other defects that allow infiltration. RDI/I occurs during wet weather conditions and causes the wastewater flow to increase. RDI/I is discussed in a separate TM.

SOUTH PLACER WASTEWATER AUTHORITY (SPWA) WASTEWATER AND RECYCLED WATER SYSTEMS EVALUATION PROJECT
Dry Weather Flow Projection
October 2005 2
Figure 1 Wastewater Components
For this project, DWF is projected on a parcel-by-parcel basis using unit BSF and GWI factors. Land use information is summarized in the Land Use TM. Development of unit BSF and GWI factors is discussed below. Individual large or atypical dischargers (customers) were identified and their BSF was projected individually based on historical data.
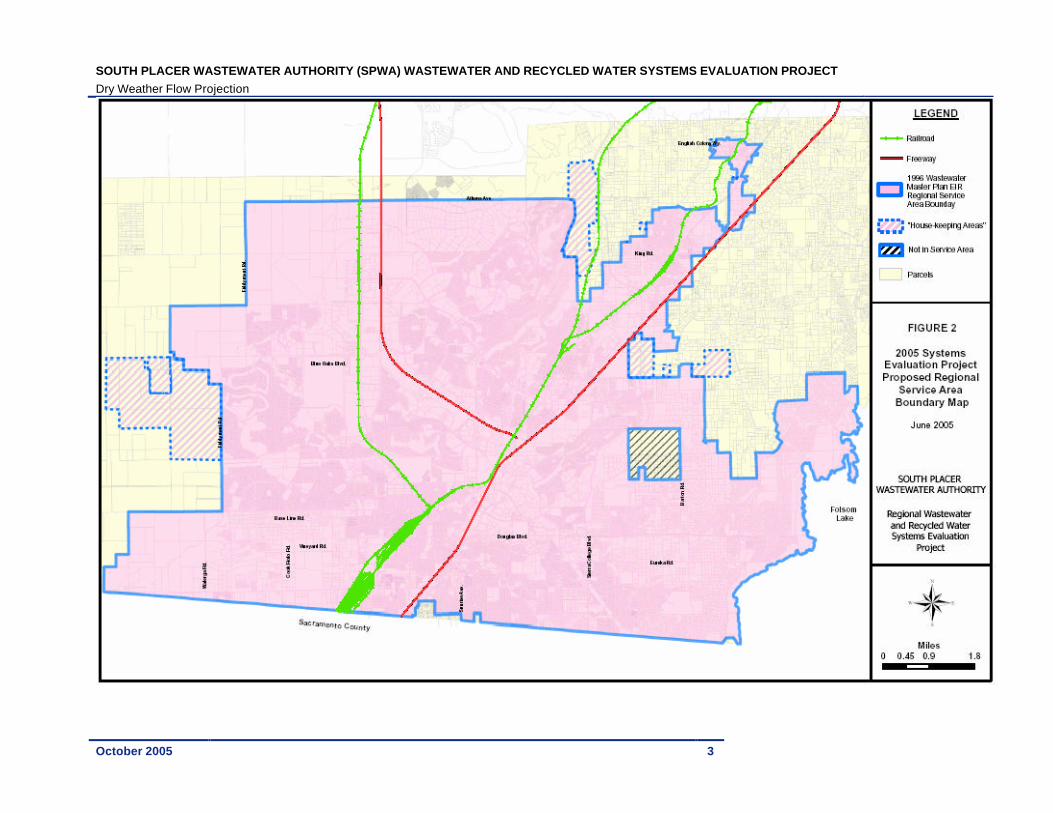
3 Land Use A parcel-based land use map of the proposed 2005 SPWA service area was developed for this project from specific plan and county assessor’s data provided by the City of Roseville and Placer County. The 1996 Wastewater Master Plan Environmental Impact Report service area boundary (Regional Service Area) was revised and existing land use information was assigned to each parcel within the revised Regional Service Area. The process used to revise the Regional Service Area is documented in the January 2005 TM (TM No. 1a) entitled “Proposed 2005 Regional Service Area Boundary”. A map of the Proposed 2005 Regional Service Area is included as Figure 2. Development of the land use map (current and future), land use code designations, and connected land use is documented in the forthcoming (October 2005) Land Use TM (TM No. 1b).
The land use map and associated database was developed for this project solely to project wastewater flows. This information should not be used for other purposes without consulting the City of Roseville and SPWA.
SOUTH PLACER WASTEWATER AUTHORITY (SPWA) WASTEWATER AND RECYCLED WATER SYSTEMS EVALUATION PROJECT Dry Weather Flow Projection
October 2005 3

SOUTH PLACER WASTEWATER AUTHORITY (SPWA) WASTEWATER AND RECYCLED WATER SYSTEMS EVALUATION PROJECT
Dry Weather Flow Projection
October 2005 4
3.1 Land Use Designations The team consolidated approximately 114 land use codes previously used by the City of Roseville and Placer County into 17 new land use codes. Those 17 land use codes were further consolidated into 11 land use codes to simplify the process of projecting current and future wastewater flows in the model. Part 2 of the consolidation process aggregated the non-flow producing land use types into one “Open Space” category and introduced three new land use codes (Mixed Use, Schools, and Parks > 10 Acres). Parks were consolidated into the Open Space category with the exception of those parks greater than 10 acres in size. This was done so that these larger parks (typically with restroom facilities) could be accounted for in the flow projections.
3.2 Current Land Use and Connected Parcels Parcels that are currently connected to the SPWA collection system were identified to project current wastewater flow and calibrate the sewer model for the existing system. Further discussion on the identification of connected parcels is presented in the Land Use TM.
3.3 Future Land Use The future land use is based on buildout within the proposed 2005 Regional Service Area as shown on the Land Use Map. For the future condition, all parcels are considered to be connected to the wastewater collection system even though some land uses in the “Open Space” category do not generate wastewater.
Current and future land use acreages for connected parcels within the proposed 2005 Regional Service Area are summarized by land use designation in Table 1 and Table 2.
There are currently 22,159 connected acres within the existing Regional Service Area. Approximately 67 percent of the developed land is currently classified as single or multi-family residential. Approximately 10 percent of the developed land is currently classified as open space.

SOUTH PLACER WASTEWATER AUTHORITY (SPWA) WASTEWATER AND RECYCLED WATER SYSTEMS EVALUATION PROJECT
Dry Weather Flow Projection
October 2005 5
Table 1 - Current Land Use Summary within the Propose d 2005 Regional Service Area
Current Connected Area (Acres)
Land Use Designation
Pleasant Grove
Watershed Dry Creek Watershed
Total Current
Connected Area
(Acres)
Commercial 495 1,622 2,117
Heavy Industrial 364 111 475
Light Industrial 616 316 932
Mixed Use 0 7 7
Open Space 1,398 737 2,135
Parks > 10 Acres 247 263 510
Public/Quasi-Public 154 467 621
Residential 1 DU 4,186 9,343 13,529
Residential 2 DU 0 280 280
Residential 3 DU 0 37 37
Residential Multiple DU 380 547 927
Schools 171 418 589
Total Acreage 8,011 14,148 22,159

SOUTH PLACER WASTEWATER AUTHORITY (SPWA) WASTEWATER AND RECYCLED WATER SYSTEMS EVALUATION PROJECT
Dry Weather Flow Projection
October 2005 6
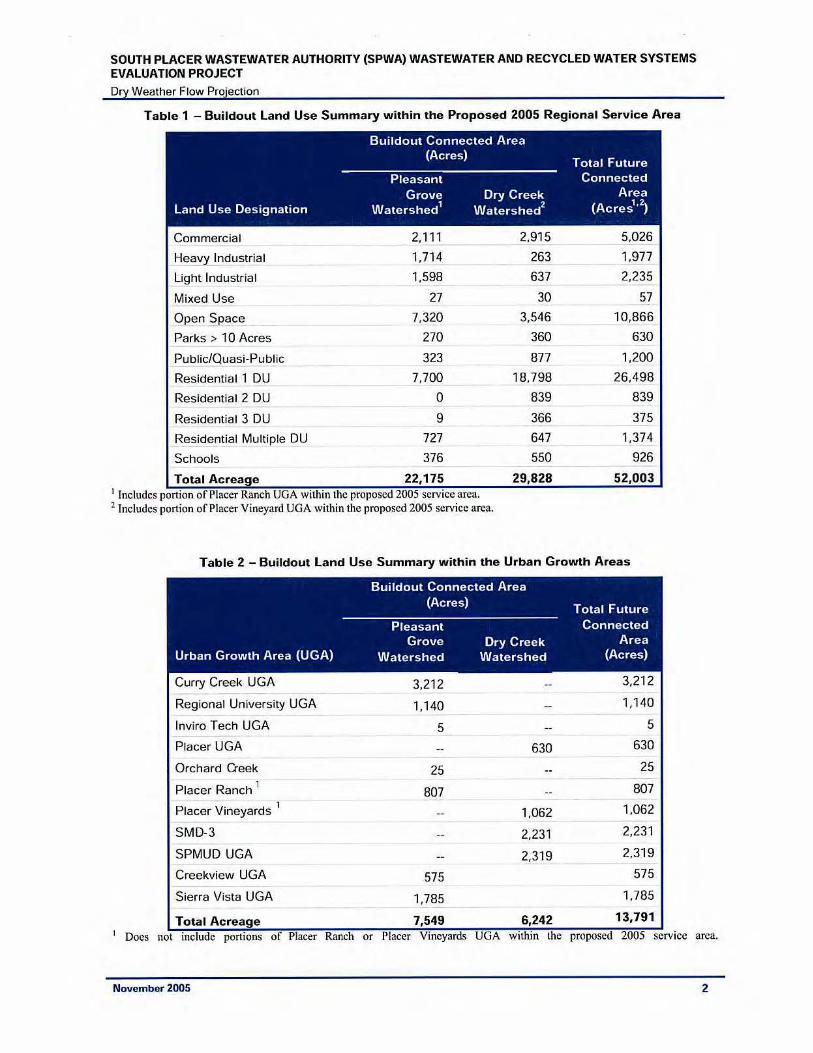
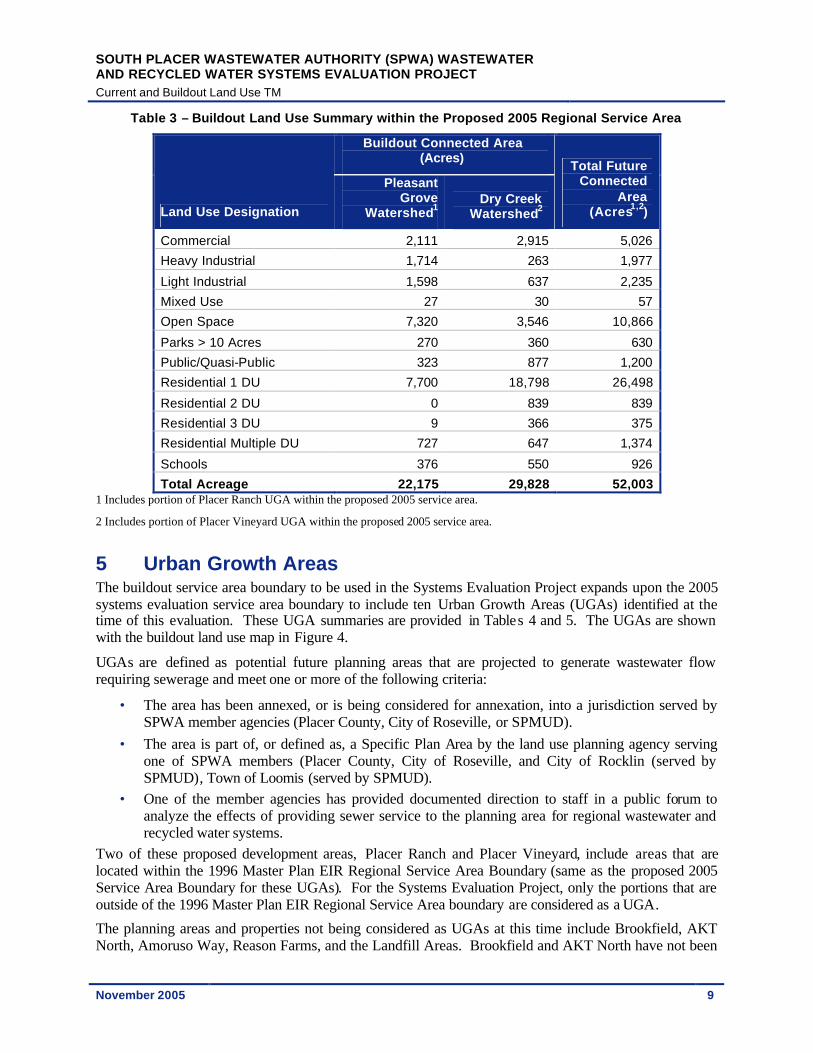
Table 2 – Buildout Land Use Summary within the Proposed 2005 Regional Service Area
Buildout Connected Area (Acres)
Land Use Designation
Pleasant Grove
Watershed1 Dry Creek
Watershed2
Total Future Connected
Area (Acres1,2)
Commercial 2,111 2,915 5,026
Heavy Industrial 1,714 263 1,977
Light Industrial 1,598 637 2,235
Mixed Use 27 30 57
Open Space 7,320 3,546 10,866
Parks > 10 Acres 270 360 630
Public/Quasi-Public 323 877 1,200
Residential 1 DU 7,700 18,798 26,498
Residential 2 DU 0 839 839
Residential 3 DU 9 366 375
Residential Multiple DU 727 647 1,374
Schools 376 550 926
Total Acreage 22,175 29,828 52,003 1 Includes portion of Placer Ranch UGA within the proposed 2005 service area.
2 Includes portion of Placer Vineyard UGA within the proposed 2005 service area.
The 2005 Regional Service Area includes portions of two Urban Growth Areas (UGAs), the remainder of which are outside both the 1996 Service Area and the 2005 Regional Service Area. Projected flows from UGA’s will be the subject of a future TM, Dry Weather Flow Projections for the 2005 Proposed SPWA Service Area and UGA’s. The 2005 Regional Service Area also includes “Housekeeping Areas”, areas discussed in TM No. 1a. The largest of those “housekeeping areas” is the West Roseville Specific Plan. Information about proposed development within the Placer Vineyard and Placer Ranch UGAs and West Roseville was obtained from Specific Plans and discussions with developers. The UGAs and West Roseville are currently comprised of several large parcels that have not been subdivided to reflect the proposed future developments. Flow projections from these areas are based on the proposed number of dwelling units, land use acreages, and unit BSF and GWI factors discussed below.
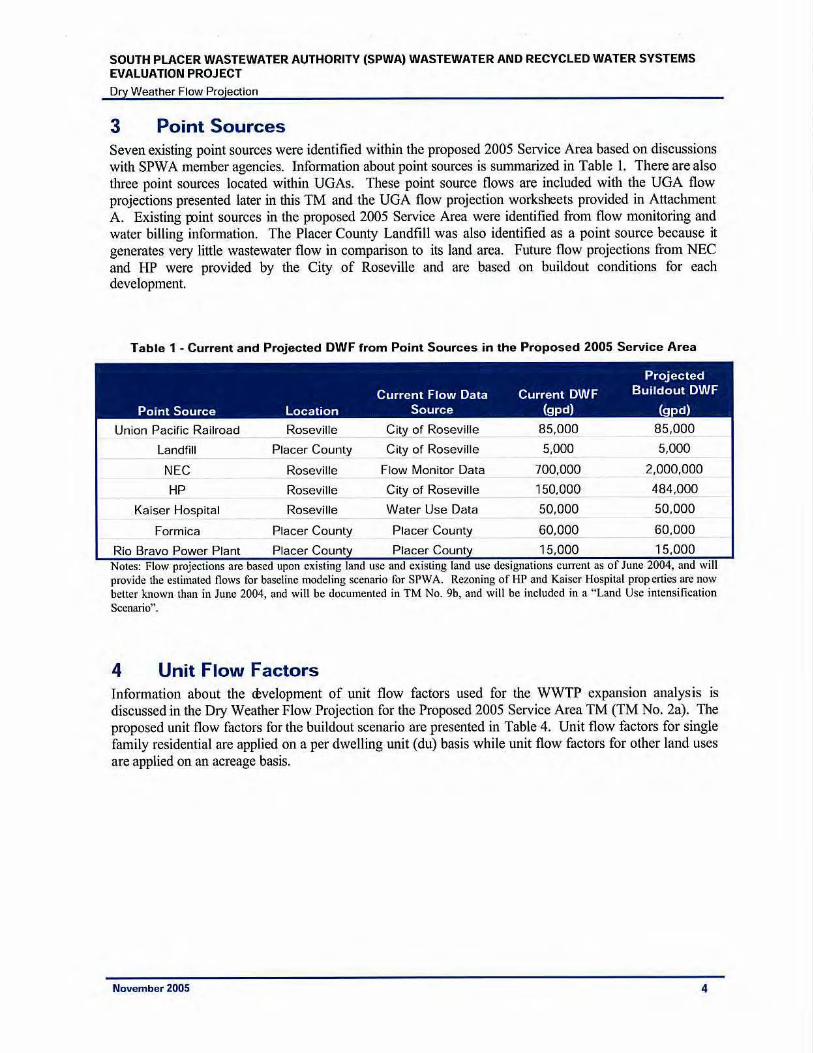
4 Point Sources Eight point sources were identified for the sewer evaluation based on discussions with SPWA member agencies. Information about point sources is summarized in Table 3. Point sources were identified from flow monitoring and water billing information. The Landfill was also identified as a point source because it generates very little wastewater flow in comparison to its land area. Future flow projections from NEC and HP were provided by the City of Roseville and are based on buildout conditions for each development.

SOUTH PLACER WASTEWATER AUTHORITY (SPWA) WASTEWATER AND RECYCLED WATER SYSTEMS EVALUATION PROJECT
Dry Weather Flow Projection
October 2005 7
Table 3 - Current and Projected DWF from Point Sources in the Proposed 2005 Service Area
Point Source Location Current Flow Data
Source Current DWF
(gpd)
Projected Buildout DWF
(gpd)
Union Pacific Railroad Roseville City of Roseville 85,000 85,000
Landfill Placer County City of Roseville 5,000 5,000
NEC Roseville Flow Monitor Data 700,000 2,000,000
HP Roseville City of Roseville 150,000 484,000
Kaiser Hospital Roseville Water Use Data 50,000 50,000
Formica Placer County Placer County 60,000 60,000
Rio Bravo Power Plant Placer County Placer County 15,000 15,000 Notes: Flow projections are based upon existing land use and existing land use designations current as of June, 2004, and will provide the estimated flows for baseline modeling scenario for SPWA. Rezoning of HP and Kaiser Hospital properties are now better known than in June 2004, and will be documented in TM No. 9b, and will be included in a “Land Use intensification Scenario”.
5 Base Sanitary Unit Flow Factors Unit BSF factors were developed using the following sources of data:
• City of Roseville Water Billing Data
• Temporary Dry Weather Flow Monitoring Data from selected locations in the SPWA Service Area
• Permanent Flow Monitoring Data from Pleasant Grove and Dry Creek WWTPs
• Permanent Flow Monitoring Data from collection system meters serving SPMUD and Placer County
The basic approach utilized to develop the unit flow factors included gathering and analyzing land use-specific water billing and flow monitoring data and then testing the resulting unit factors for the existing system in a mass balance.
5.1 Roseville Water Billing Data Unit flow factors were developed from City of Roseville water billing information from December 2003 – March 2004. Water billing data was available for approximately 50 percent of the parcels in Roseville. Water billing information was joined to the parcels in the land use database by Assessor Parcel Number (APN). The parcel database includes land use information that allowed water usage information to be grouped by land use designation. Winter water usage information was primarily evaluated since landscape irrigation is minimal during winter months and water usage is more closely related to wastewater flows. These water demand factors can be correlated to BSF unit flow factors. Historically, BSF is typically 80-90 percent of water demand. This process yielded the following results, presented in Table 4.

SOUTH PLACER WASTEWATER AUTHORITY (SPWA) WASTEWATER AND RECYCLED WATER SYSTEMS EVALUATION PROJECT
Dry Weather Flow Projection
October 2005 8
Table 4 - Water Demand Factors Derived from the Roseville Water Billing Data
Land Use Designation
Water Demand Factor
Typical Base Sanitary Flow Factor Range1
Commercial 1,000 gpd per acre 800-900 gpd per acre
Heavy Industrial 310 gpd per acre 250-280 gpd per acre
Light Industrial 1,000 gpd per acre 800-900 gpd per acre
Mixed Use 2,700 gpd per acre 2,160-2,430 gpd per acre
Public/Quasi-Public 780 gpd per acre 620-700 gpd per acre
Schools 200 gpd per acre 160-180 gpd per acre
Single Family Residential 220 gpd per du 180-200 gpd per du
Residential Multiple DU 1,500 gpd per acre 1,200-1,350 gpd per acre 1 80 to 90 percent of the Water Demand Factor
5.2 Temporary Dry Weather Flow Monitoring Temporary dry weather flow monitoring was conducted at 16 sites for 24 days in September and October 2004. These sites were located in Roseville, Placer County and SPMUD sewer service areas. The intent of this flow monitoring was to isolate single land use types so that unit flow factors could be determined for each monitored land use.
As would be expected in a collection system with diverse development ages and types, the unit flow factors varied widely within each land use category. The reason for this variation is due to the fact that the data is only representative of a very small sample of parcels within the service area. For example, the monitored residential parcels represent approximately 5 percent of the total residential parcels within the study area. These results were used in conjunction with the water use data presented in the previous section. Specific details and information about the temporary dry weather flow monitoring is presented in the October 2005 Flow Monitoring TM (No. 2d).
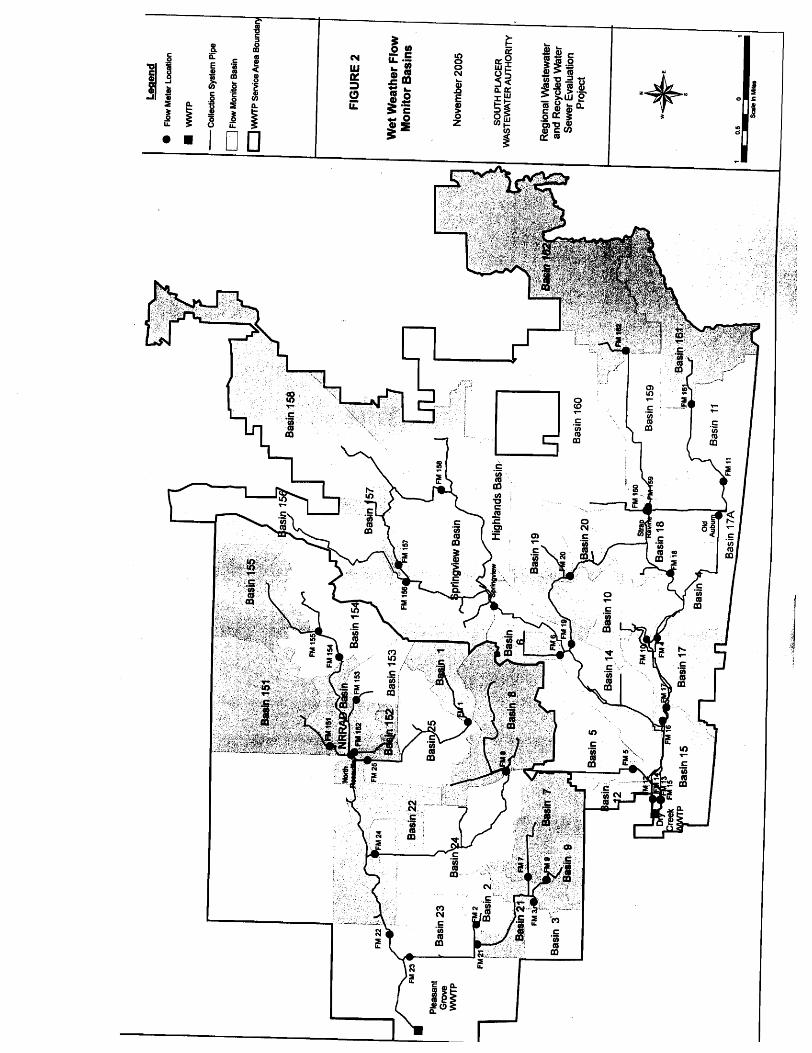
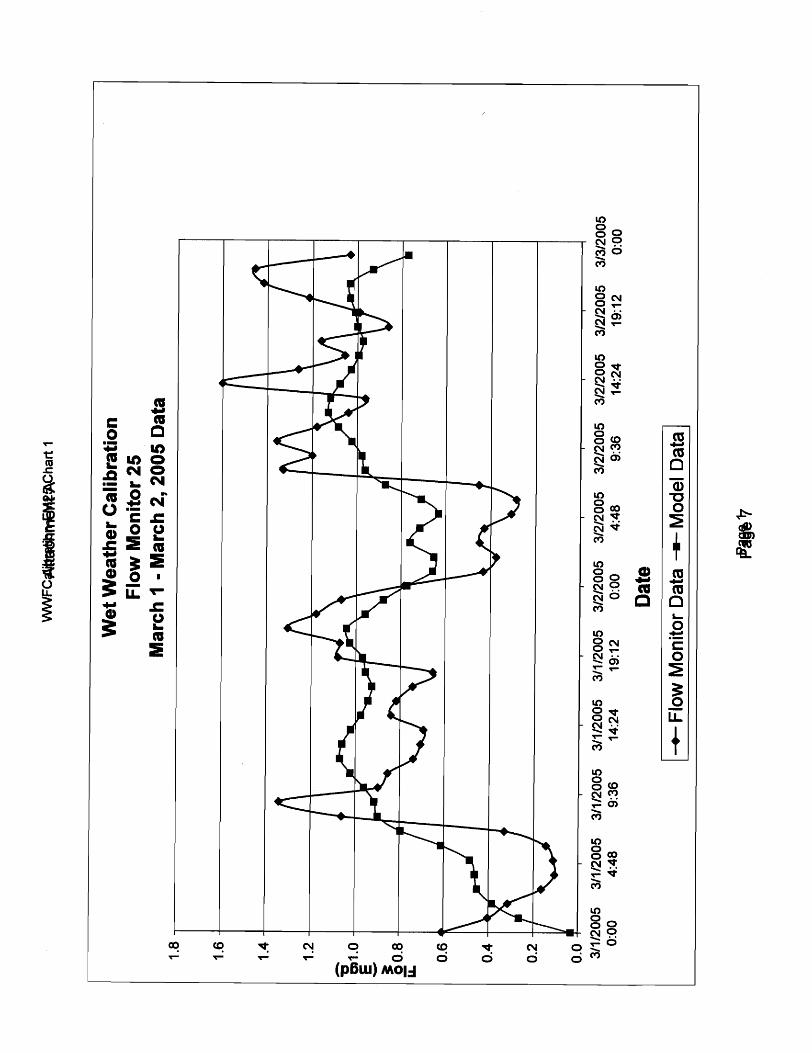
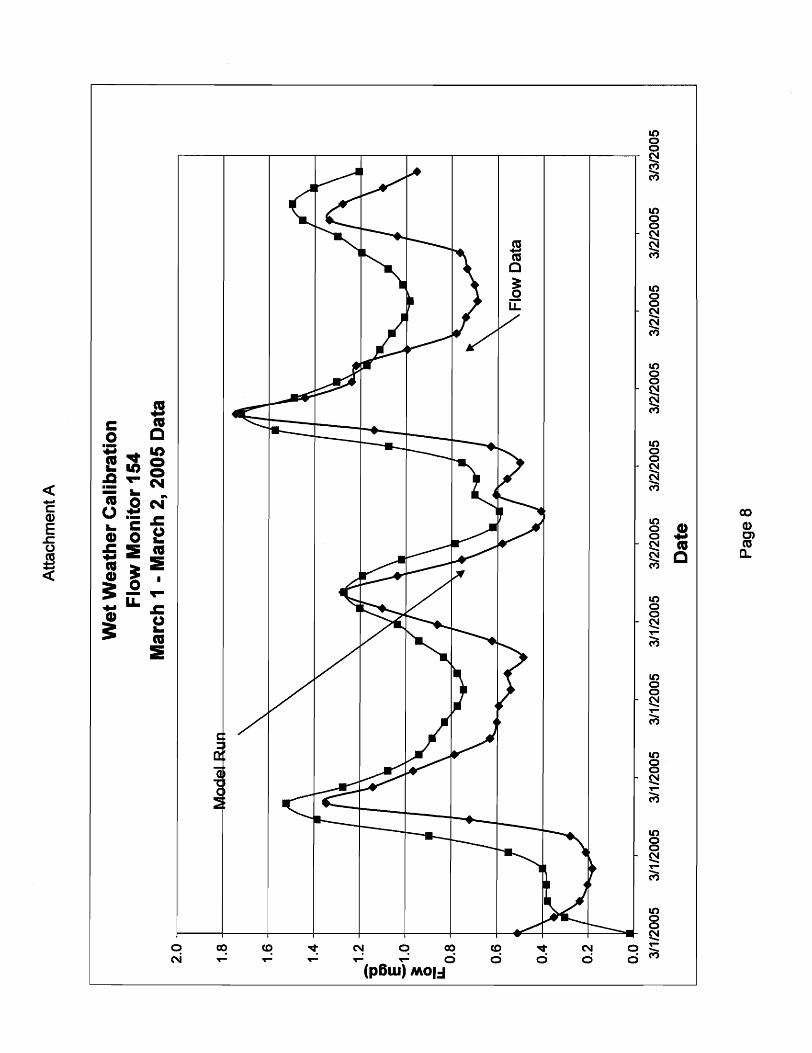
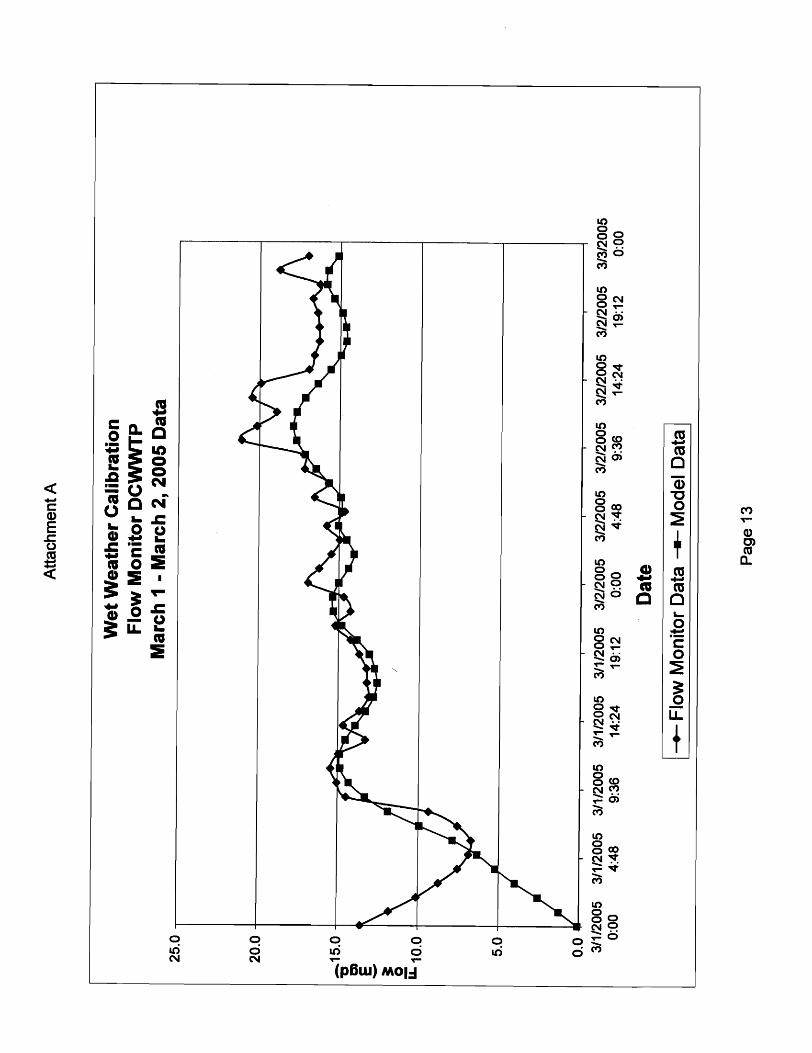
5.3 Permanent Dry Weather Flow Monitoring Dry weather flow monitoring data from seven permanent flow monitoring sites in Roseville, SPMUD and Placer County were reviewed to establish “target” flows for the unit flow factor mass balance. Flow data from September and October 2004 was provided by Roseville, SPMUD and Placer County. A flow data summary is presented in Table 5. The two sites in Roseville were located at each wastewater treatment plant (WWTP). The five remaining sites were located at flumes where SPMUD and Placer County trunk sewers enter Roseville. The flow monitors in the Dry Creek watershed are tributary to the Dry Creek WWTP. The flow monitors in the Pleasant Grove watershed are tributary to the Pleasant Grove WWTP. Hydrographs for the Springview, Strap Ravine and Old Auburn flow monitoring sites exhibited signs of GWI. This was confirmed during the unit flow factor mass balance procedure and a review of temporary wet weather flow monitoring data from Winter 2005.
6 Groundwater Infiltration (GWI) GWI occurs when groundwater levels are above the inverts of the collection system pipes and manholes and the pipes and manholes have leaky joints or other defects that allow groundwater to enter the collection system. Groundwater levels vary seasonally and are highest at the end of the wet season and

SOUTH PLACER WASTEWATER AUTHORITY (SPWA) WASTEWATER AND RECYCLED WATER SYSTEMS EVALUATION PROJECT
Dry Weather Flow Projection
October 2005 9
lowest at the end of the dry season, which is typically in September. Higher GWI levels that may occur during wet weather will be addressed in the Wet Weather Flow Projection TM (No. 2c).
Total GWI is estimated by subtracting total BSF projections from total DWF as measured at each WWTP flow monitoring site. The total calculated GWI rate for the service area is approximately 1.70 mgd. For purposes of WWTP expansion planning, the GWI will be distributed evenly across the entire service area. For purposes of collection system modeling, the GWI will be distributed spatially based on the results of the flow monitoring data analysis.
Table 5 - Measured Flow at 2004 Permanent Dry Weather Flow Monitoring Sites, and Estimated GWI from Watershed Lands Upstream of Meter
Site Name
Location
Watershed
BSF
(mgd) GWI
(mgd)
DWF
(mgd) Old Auburn Placer County Dry Creek 0.75 0.50 1.25
Strap Ravine Placer County Dry Creek 0.73 0.30 1.03
Highlands SPMUD Dry Creek 0.08 0.00 0.08
Springview SPMUD Dry Creek 2.19 0.80 2.99
Dry Creek WWTP Roseville Dry Creek 12.70 1.70 14.40
North Roseville SPMUD Pleasant Grove 1.84 0.00 1.84
Pleasant Grove WWTP Roseville Pleasant Grove 2.55 0.00 2.55
7 Unit Flow Factor Mass Balance Unit flow factors from the water data and temporary flow data analysis were used as a starting point to balance the wastewater flows with the permanent flow meter sites. Flow projections for the WWTP analysis are based on unit DWF factors which include BSF and GWI. This provides a uniform methodology for projecting flows throughout the service area.
Utilizing the total DWF observed at the Roseville WWTPs (without subtracting GWI), the most representative DWF unit flow factor set was approximately 85 percent of the winter water use, with the exception of Residential Multiple DU and Heavy Industrial, which are explained below.
The Residential Multiple DU unit flow rate of 2,040 gpd/acre is based on an estimated unit flow factor of 130 gpd per multi-family dwelling unit (which is approximately 70 percent of the wastewater flow of single-family dwelling units) with a development density of 16 units per acre. Multi-family dwelling units typically have fewer occupants than single-family dwelling units and therefore generate less wastewater. The development density of 16 units per acre is the average number of Residential Multiple DU dwelling units/acre in Roseville and SPMUD.
The Heavy Industrial unit flow factor of 250 gpd/acre appeared to be extremely low compared to the Light Industrial unit flow factor and typical Heavy Industrial unit flow factors seen in other cities. Because of this difference, the Heavy Industrial unit flow rate was modified to match the Light Industrial unit flow factor. In the future, any proposed Heavy Industrial land use will be evaluated on the basis of the type of proposed use (eg. Wet industry, or Dry Industry) and the site specific flow associated with any development or planning proposal.
The current DWF mass balance (including GWI) for the proposed 2005 SPWA service area is presented in Table 6. This projection is within 2 percent of the average total flow of 16.99 mgd measured at Dry Creek and Pleasant Grove WWTPs in September and October 2004.

SOUTH PLACER WASTEWATER AUTHORITY (SPWA) WASTEWATER AND RECYCLED WATER SYSTEMS EVALUATION PROJECT
Dry Weather Flow Projection
October 2005 10
Table 6 - Current Dry Weather Flow Mass Balance
Land Use Unit Flow Factor Current Units (Acres or DU)
Current DWF (mgd)
Commercial 850 gpd per acre 2,117 1.79
Heavy Industrial1 850 gpd per acre 475 0.40
Light Industrial1 850 gpd per acre 932 0.79
Mixed Use 2,300 gpd per acre 7 0.02
Public/Quasi-Public1 660 gpd per acre 621 0.41
Schools 170 gpd per acre 589 0.10
Residential 1 DU 190 gpd per du 51,285 9.74
Residential 2 DU 190 gpd per du 1,537 0.30
Residential 3 DU 190 gpd per du 306 0.06
Residential Multiple DU 2,040 gpd per acre 927 1.89
Open Space 0 gpd per acre 2,135 0.00
Parks > 10 Acres 10 gpd per acre 510 0.005
Point Sources varies 1,139 1.16
Total 16.67 1 Land use category does not include area of parcels associated with point sources identified in Table 1.
7.1 Unit Flow Factors The proposed unit flow factors for WWTP expansion analysis are presented in Table 7. Unit flow factors for single family residential are applied on a per dwelling unit (du) basis while unit flow factors for other land uses are on an acreage basis.
As explained previously, the temporary flow monitoring data identified wide variations in the unit flow factors for various land use types and was not representative of the entire service area. Water billing data from the City of Roseville and the permanent flow monitoring data from Roseville, SPMUD and Placer County presented a much broader picture which ultimately proved to be more representative of the entire service area.

SOUTH PLACER WASTEWATER AUTHORITY (SPWA) WASTEWATER AND RECYCLED WATER SYSTEMS EVALUATION PROJECT
Dry Weather Flow Projection
October 2005 11
Table 7 - Proposed Dry Weather Flow (DWF) Factors
Land Use Designation Units
Proposed Unit Flow Factors WWTP
Analysis1
1996 Master
Plan Unit Flow
Factor Commercial gpd per acre 850 1,040
Heavy Industrial gpd per acre 850 1,560
Light Industrial gpd per acre 850 1,040
Mixed Use gpd per acre 2,300 N/A
Public/Quasi-Public gpd per acre 660 1,040
Schools gpd per acre 170 N/A
Residential 1 DU gpd per du 190 260
Residential 2 DU gpd per du 190 260
Residential 3 DU gpd per du 190 260
Residential Mult. DU2 gpd per acre 2,040 4,160
Open Space gpd per acre 0 0
Parks > 10 Acres gpd per acre 10 N/A Vacant gpd per acre 0 0
1 Includes allowance for dry season GWI. 2 The proposed Residential Multiple DU unit flow factor can also be represented as 130 gpd per du
8 DWF Unit Flow Factors and Future (Buildout) Flow Projections
Future DWF projections within the proposed 2005 Regional Service Area are based on the unit DWF factors developed for the WWTP analysis above (includes dry season GWI). These flow projections do not include the results of proposed redevelopment/intensification within Roseville and Rocklin which will be analyzed as a separate scenario and presented in the Land Use Redevelopment/Intensification TM (No 9a). Buildout dry weather flow projections within the proposed 2005 Regional Service Area are presented in Table 8.

SOUTH PLACER WASTEWATER AUTHORITY (SPWA) WASTEWATER AND RECYCLED WATER SYSTEMS EVALUATION PROJECT
Dry Weather Flow Projection
October 2005 12
Table 8 - Buildout Dry Weather Flow Projections Within Proposed 2005 Regional Service Area
PG WWTP3 DC WWTP4 2005 Service Area
Land Use
Unit Flow
Factor
Buildout Units
(ac or du)
Buildout DWF
(mgd)
Buildout Units
(ac or du)
Buildout DWF
(mgd)
Buildout Units
(ac or du)
Buildout DWF
(mgd)
Commercial 850
gpd/ac 1,728 1.47 2,890 2.46 4,618 3.93
Heavy Industrial1
850 gpd/ac 1,680 1.43 263 0.22 1,943 1.65
Light
Industrial1 850
gpd/ac 1,221 1.04 637 0.54 1,858 1.58
Mixed Use 2,300
gpd/ac 0 0.00 7 0.02 7 0.02
Public/Quasi- Public1
660 gpd/ac 282 0.19 851 0.56 1,133 0.75
Schools 170
gpd/ac 258 0.04 540 0.09 798 0.14
Residential 1 DU
190 gpd/du 26,893 5.11 42,934 8.16 69,827 13.27
Residential 2 DU
190 gpd/du 2 0.0004 2,122 0.40 2,124 0.40
Residential
3 DU 190
gpd/du 12 0.002 720 0.14 732 0.14
Residential Multiple DU
2,040 gpd/ac 594 1.21 606 1.24 1,200 2.45
Open
Space 0
gpd/ac 6,034 0.00 3,304 0.00 9,338 0.00
Parks > 10 Acres
10 gpd/ac 270 0.003 360 0.004 630 0.01
Point Sources
Varies gpd/ac 1,043 2.56 91 0.14 1,134 2.70
Placer
Ranch2 Varies gpd/ac 1,027 0.90 0 0.00 1,027 0.90
West Roseville2
Varies gpd/ac 3,162 1.70 0 0.00 3,162 1.70
Placer Vineyards2
Varies gpd/ac 0 0.00 1,079 0.85 1,079 0.85
Total (mgd) 15.7 14.8 30.5 1 Land use category does not include area of parcels associated with point sources identified in Table 1. 2 Includes portion of development located within the Proposed 2005 Regional Service Area. 3 Pleasant Grove WWTP Service Area 4 Dry Creek WWTP Service Area

SOUTH PLACER WASTEWATER AUTHORITY (SPWA) WASTEWATER AND RECYCLED WATER SYSTEMS EVALUATION PROJECT
Dry Weather Flow Projection
October 2005 13
9 1996 Service Area DWF Projection Comparison A review of the flow projections for the 1996 Master Plan EIR Service Area boundary was completed. This review compares 1996 and 2005 flow projections within the 1996 Service Area boundary. The flow projection for the 1996 Service Area as calculated in the 1996 Master Plan is 45.6 mgd. This 1996 flow projection utilized the 1996 Master Plan unit flow factors (shown in Table 7) to project flows in the service area and different land use assumptions. Since 1996, land use within the service area has changed and the unit flow factors established in this Master Plan have caused the 2005 flow projection within the 1996 Service Area to decrease to 29.0 mgd (shown in Table 9). This decrease can be attributed to reductions in the residential unit flow factor and an approximately 20 percent reduction in the development densities. Note that the 29.0 mgd flow projection is less than the 30.5 mgd presented in Table 8 for the Proposed 2005 Regional Service Area. The Proposed 2005 Regional Service Area is inclusive of the 1996 Master Plan EIR Service Area, and also includes the “housekeeping areas” (West Roseville, Clover Valley Lakes, and others) documented in TM No. 1a.

SOUTH PLACER WASTEWATER AUTHORITY (SPWA) WASTEWATER AND RECYCLED WATER SYSTEMS EVALUATION PROJECT
Dry Weather Flow Projection
October 2005 14
Table 9 – Dry Weather Flow for the 1996 Service Area with new Unit Flow Factors
PG WWTP3 DC WWTP4 2005 Service Area
Land Use
Unit Flow
Factor
Buildout Units
(ac or du)
Buildout DWF
(mgd)
Buildout Units
(ac or du)
Buildout DWF
(mgd)
Buildout Units
(ac or du)
Buildout DWF
(mgd)
Commercial 850
gpd/ac 1,728 1.47 2,864 2.43 4,592 3.90
Heavy Industrial1
850 gpd/ac 1,680 1.43 263 0.22 1,943 1.65
Light
Industrial1 850
gpd/ac 1,221 1.04 637 0.51 1,858 1.58
Mixed Use 2,300
gpd/ac 0 0.00 7 0.02 7 0.02
Public/Quasi- Public1
660 gpd/ac 282 0.19 829 0.55 1,111 0.73
Schools 170
gpd/ac 258 0.04 394 0.07 652 0.11
Residential 1 DU
190 gpd/du 26,671 5.07 40,956 7.78 67,627 12.85
Residential 2 DU
190 gpd/du 2 0.0004 2,122 0.40 2,124 0.40
Residential
3 DU 190
gpd/du 12 0.002 720 0.14 732 0.14
Residential Multiple DU
2,040 gpd/ac 594 1.21 606 1.24 1,200 2.45
Open
Space 0
gpd/ac 4,004 0.00 3,290 0.00 7,294 0.00
Parks > 10 Acres
10 gpd/ac 270 0.003 360 0.004 630 0.01
Point Sources
Varies gpd/ac 1,043 2.56 91 0.14 1,134 2.70
Placer
Ranch2 Varies gpd/ac 1,027 0.90 0 0.00 1,027 0.90
West Roseville2
Varies gpd/ac 1,316 0.67 0 0.00 1,316 0.67
Placer Vineyards2
Varies gpd/ac 0 0.00 1,079 0.85 1,079 0.85
Total (mgd) 14.6 14.4 29.0 1 Land use category does not include area of parcels associated with point sources identified in Table 1. 2 Includes portion of development located within the Proposed 2005 Regional Service Area. 3 Pleasant Grove WWTP Service Area 4 Dry Creek WWTP Service Area
November 2005 1
Technical Memorandum Water andEnvironment
SOUTH PLACER WASTEWATER AUTHORITY (SPWA) WASTEWATER AND RECYCLED WATER SYSTEMS EVALUATION PROJECT
Subject: Current and Buildout Land Use – (TM No. 1b)
Prepared For: Art O’Brien – City of Roseville
Prepared by: Pete Bellows/Chris Peters – Brown and Caldwell
Reviewed by: Dave Richardson/Gisa Ju - RMC
Date: November 2, 2005
Reference: 0091-004 Task 1
1 Introduction This technical memorandum (TM) documents and provides a summary of the current (June 2004) and buildout land use estimates for the South Placer Wastewater Authority (SPWA) Wastewater and Recycled Water Systems Evaluation Project (Systems Evaluation Project). The identification of the service area boundary, development of the land use database, and evaluation of existing and future land use scenarios are critical tasks in order to understand existing and future wastewater production to properly plan for and design collection, conveyance, and treatment systems and facilities. The land use database developed for the 2005 Systems Evaluation Project and summarized in this TM will be used to:
• Project existing and future wastewater flows for the SPWA service area; • Identify existing deficiencies in the regional collection system and plan for future expansion; • Determine routing options for conveying wastewater flow from future urban growth areas
(UGAs) to SPWA Regional Treatment Plants; and • Plan for future expansion of wastewater treatment facilities.
The planned rezoning and intensification scenario in Roseville and Rocklin will be handled as a separate scenario for land use planning and are not included in this TM.
This TM is organized as follows:
1. Introduction 2. Land Use Information Sources 3. 1996 and 2005 Service Area Boundaries 4. Land Use within the 2005 Proposed Service Area Boundary 5. Buildout Land Use within Urban Growth Areas 6. Land Use Database Documentation
2 Land Use Information Sources The land use database for areas within the 2005 proposed service area boundary was developed by Environmental Science Associates, Inc. (ESA) based on the information sources presented below. In addition to these documented land use sources, ongoing discussions occurred with planners and developers for each of the Urban Growth Areas (UGAs) presented later in this TM. Final documentation and changes made to the land use database developed by ESA are discussed in Section 6 at the conclusion of this TM.

SOUTH PLACER WASTEWATER AUTHORITY (SPWA) WASTEWATER AND RECYCLED WATER SYSTEMS EVALUATION PROJECT
Current and Buildout Land Use TM
November 2005 2
Current General Plans • City of Roseville (February 2004) • City of Rocklin (April 1991) • Town of Loomis (July 2001) • Placer County (August 1994) • Granite Bay Community Plan (May 1989)
Geographic Information System (GIS) Data in ESRI Shapefile Format • City of Roseville GIS data (Roseville Land Inventory (RLI)) • Placer County GIS and County Assessor data • 1996 Service Area Boundary, digitized by ESA. • 2005 (Proposed) Service Area Boundary, digitized by ESA.
Specific Plans • Placer Vineyards (September 2004) • Placer Ranch (December 2004) • West Roseville (August 2003) • Regional University (March 2005)
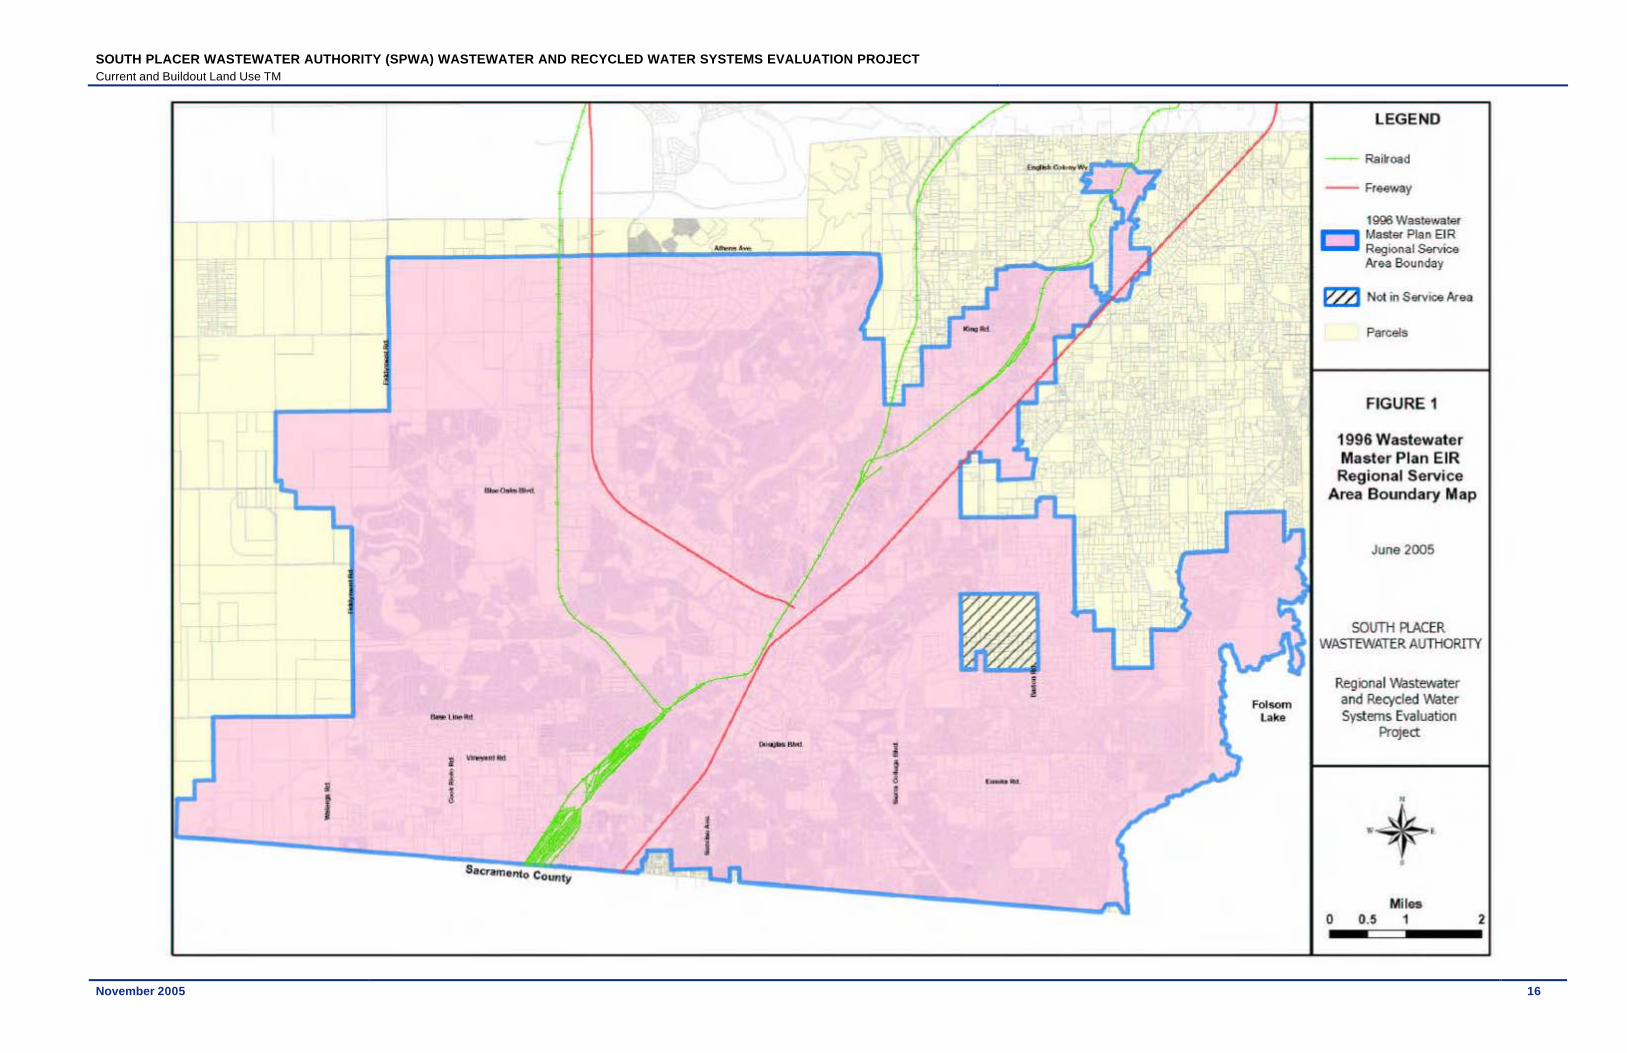
3 1996 and 2005 Service Area Boundaries The 1996 Wastewater Master Plan (1996 Master Plan) Environmental Impact Report (EIR) Service Area (Regional Service Area) boundary was established with the adoption of the 1996 Master Plan and associated EIR. The 2005 Systems Evaluation Project proposed service area boundary is an update of the 1996 Master Plan EIR Service Area boundary. The update includes ten areas outside of the 1996 Master Plan EIR Service Area (also known as “House-Keeping Areas”) that have been annexed by the SPWA partner agencies since 1996. Further discussion of these two service area boundaries and how they impact this evaluation is presented below.
3.1 1996 Master Plan Service Area Boundary This 1996 Master Plan EIR Regional Service Area, shown in Figure 1 at the end of this TM, will be used in the Systems Evaluation Project along with updated buildout land use projections and unit flow factors (developed as part of the Systems Evaluation Project) to generate revised buildout flow projections for the SPWA regional treatment facilities for comparative purposes. The revised buildout flow projections inside the 1996 Regional Service Area will be compared with the 1996 projected buildout flows to provide an update for the connection fee analysis to be performed by the SPWA financial advisor.
3.2 2005 Proposed Service Area Boundary The Systems Evaluation Project proposed service area boundary is shown in Figure 2 at the end of this TM and was presented to the SPWA board in January 2005. To date, this boundary has not been formally approved by the SPWA board. Further discussion on the development of the Systems Evaluation Project

SOUTH PLACER WASTEWATER AUTHORITY (SPWA) WASTEWATER AND RECYCLED WATER SYSTEMS EVALUATION PROJECT
Current and Buildout Land Use TM
November 2005 3
proposed service area boundary is documented in the Proposed 2005 Regional Service Area Boundary TM No. 1a dated January 13, 2005.
4 Land Use within the 2005 Service Area Land use information provides the basis for developing unit wastewater flows and wastewater flow projections. Understanding the nature and distribution of urban development is important for proper planning and staging of sewer collection infrastructure and treatment facilities. Additionally, identification of parcels that are currently “connected” to the collection system is required to balance wastewater unit flow factors and calibrate the sewer model for the existing system. The key result from the land use analysis was the development of the land use map and associated database. The land use map and database are each parcel-based.
Land use map development was a multi-step process that included consolidating the current land use codes into a manageable system; identifying parcels connected to the wastewater collection system for current and buildout conditions; plotting current and buildout land use maps for review by the SPWA member agencies; and checking the land use data against current general plans for Roseville, Rocklin, Loomis, Granite Bay and Placer County. A review of land use maps developed from the project team’s database identified some minor discrepancies with the current published General Plans. These discrepancies were corrected to match the current General Plan status and are documented in Section 6 at the end of this TM.
4.1 Land Use Code Consolidation The land use database developed by the project team (version no. 1) included approximately 114 land use codes previously used by the City of Roseville and Placer County. The project team consolidated these 114 codes into 17 general land use codes (version no. 2). The project team then further consolidated the 17 codes into 12 land use codes to simplify the process of projecting current and future wastewater flows in the hydraulic model (version no. 3). The version no. 3 consolidation process lumped all of the non-flow producing land use types into one “Open Space” category and introduced three new land use codes (Mixed Use, Schools and Parks > 10 Acres). The land use code consolidation is presented in Table 1.

SOUTH PLACER WASTEWATER AUTHORITY (SPWA) WASTEWATER AND RECYCLED WATER SYSTEMS EVALUATION PROJECT
Current and Buildout Land Use TM
November 2005 4
Table 1: Consolidated Land Use Codes
Final (Version No. 3) Land Use Code
Version No. 2 Land Use Code
Roseville/Placer County Land Use Code (Version No. 1)
Commercial Commercial Auto Sales, Repair Automotive Banks, S&L’s, Credit Union Commercial Commercial Recreation Commercial Store Condominium Office Fast Food Restaurant Financial Building Hotel Hotel, Motels, Resorts Mini-Market with Gas Mini-Market, no Gas Miscellaneous Commercial Office Building Office General Office Medical/Dental Residential and Hotel Restaurant Restaurants, Cocktail Lounges Retail Service Station Shopping Center Small Food Suburban Store Theater, Bowling Alley
Heavy Industrial Heavy Industrial Food Processing Heavy Industrial Miscellaneous Industrial
Light Industrial Light Industrial Storage
Business Industrial Park Condominium Industrial Industrial Condominium Light Industrial Light Manufacturing Mini-Storage, Covered Storage Self Storage Uncovered Storage, Wrecking Yard Warehouse
Mixed Use n/a Residential and Office Residential and Retail

SOUTH PLACER WASTEWATER AUTHORITY (SPWA) WASTEWATER AND RECYCLED WATER SYSTEMS EVALUATION PROJECT
Current and Buildout Land Use TM
November 2005 5
Final (Version No. 3)
Land Use Code Version No. 2
Land Use Code Roseville/Placer County
Land Use Code (Version No. 1) Open Space Agriculture
Open Space Parks (Area < 10 Acres) Mining Right of Way
CLCA Restriction, Non-Renewal CLCA Restriction, Under Contract Irrigated Farm Orchards, Vineyards Poultry & Small Animals Rice Crop Vacant, Dry Farm Mineral Rights Mining Claims Mining Quarry Backyard Area Cemetery Cemeteries Creek Area Fairgrounds Golf Course Greenbelt Landscape Easement Open Space Rivers, Lakes, Reservoir, Canal Wetlands, Vernal Pools Camps & Parks, General Non-Profit Camps/Parks Park (Area < 10 Acres) Tennis/Swimming Clubs Highways, Roads, Streets Pipeline R/W Right of Way Utility Easement Parking Lot Parking Lots
Parks > 10 Acres Parks (Area > 10 Acres) Park (Area > 10 Acres)

SOUTH PLACER WASTEWATER AUTHORITY (SPWA) WASTEWATER AND RECYCLED WATER SYSTEMS EVALUATION PROJECT
Current and Buildout Land Use TM
November 2005 6
Final (Version No. 3) Land Use Code
Version No. 2 Land Use Code
Roseville/Placer County Land Use Code (Version No. 1)
Public/Quasi Public
Public/Quasi-Public Church Churches Club Convalescent Hospital Day Care Centers Hospital Hospitals Convalescent Lodges, Halls Misc. Public Buildings Miscellaneous Institutional Preschool Public Building Utilities, Public & Private Utility
Residential 1 DU Residential 1 DU Residential Large Lot Mobile Home (Individual)
Condominium Residence on Commercial Land Single Fam Res, Condominium Single Fam Res, Half Plex Single Family Residence Timeshares Mobile Home Outside of Park
Residential 2 DU Residential 2 DU 2 Single Fam Res, Duplex Duplex
Residential 3 DU Residential 3 DU 3 Single Fam Res, Triplex Triplex
Residential Multiple DU Residential Multiple DU Mobile Home (Park)
Apartment Apartments, 4 Units or More Mobile Home in M H Park Mobile Home Park
Schools n/a School Schools
Vacant 1 Vacant Business Potential Commercial Potential Common Area Industrial Potential Institutional Potential Residential Potential Residential, Auxiliary Imp Vacant Vacant Industrial Vacant, Commercial Vacant, Subdivided Residential
1 The vacant land use code is only used for the current land use scenario. For the buildout land use scenario, vacant parcels are assigned the land use category as specified in the ir respective General Plan.

SOUTH PLACER WASTEWATER AUTHORITY (SPWA) WASTEWATER AND RECYCLED WATER SYSTEMS EVALUATION PROJECT
Current and Buildout Land Use TM
November 2005 7
4.2 Current Land Use within the 2005 Service Area Currently developed parcels were identified in the original (version no. 1) land use database based on their current land use code. The original land use database identified parcels that are not currently developed as “vacant”. However, not all of the developed parcels within the proposed 2005 service contribute flow to the wastewater collection system. These developed parcels that do not contribute flow most likely have onsite septic wastewater treatment systems. To project current wastewater flow and calibrate the sewer model for the existing system, parcels that are currently connected to the SPWA collection system were identified. The process used to identify connected parcels is documented in the January 26, 2005 TM No 1c entitled “Identification of Parcels Connected or Not Connected to Sewers in the SPWA Project Area”.
Generally, parcels within the City of Roseville were identified as connected based on their development status and the understanding that there are no septic tanks within the City of Roseville. Parcels within SPMUD were identified as connected based on their development status and whether or not they were located in an area designated as septic tank service by SPMUD. Parcels within Placer County were identified as connected if they currently receive a sewer bill from the County. Placer County provided sewer billing information that was linked to the parcel database provided by ESA. Parcels that linked to a sewer bill were designated as connected.
A summary of the current connected land use within the 2005 Service Area is presented in Table 2. The current connected land use map is shown in Figure 3 at the end of this TM. There are 22,159 current connected acres within the proposed 2005 Regional Service Area. Approximately 67 percent of the current connected land is classified as single or multi-family residential. Approximately 10 percent of the current connected land is currently classified as open space. Approximately 29,844 acres within the 2005 Service Area is vacant or not connected.
4.3 Buildout Land Use within the 2005 Service Area Buildout land use in the 2005 Service Area was identified in the original land use database according to General Plan data from the City of Roseville and Placer County. The buildout land use scenario includes all currently developed parcels (currently developed parcels that are not connected are assumed to be connected to the collection system); new developments in vacant areas; and the residential redevelopment of currently developed parcels greater that ½ acre that have not been subdivided where the General Plan or Specific Plan allows denser development. This ½ acre residential redevelopment should not be confused with the redevelopment/intensification scenarios in Roseville and Rocklin that will be presented in the Land Use Intensification TM 9c. Future residential redevelopment in Roseville was calculated based development densities allowed by specific plans. In areas outside of Roseville, future residential development was calculated based on the historical average development densities for the specific residential land use types. These redevelopment densities are documented in the land use database that will be provided at the end of this project. For the buildout condition, all parcels are considered to be connected to the wastewater collection system even though some land uses in the “Open Space” category do not generate wastewater.
A summary of the buildout land use within the proposed 2005 Regional Service Area is provided in Table 3. The buildout land use map is shown in Figure 4 at the end of this TM.
The buildout 2005 Regional Service Area includes portions of two Urban Growth Areas (UGAs), the remainder of which are outside both the 1996 Service Area and the 2005 Regional Service Area. Further explanation of the UGAs is provided in the next section of this TM. The 2005 Regional Service Area also includes “House-Keeping Areas”, discussed in TM No. 1a. The largest of those “House-Keeping areas” is

SOUTH PLACER WASTEWATER AUTHORITY (SPWA) WASTEWATER AND RECYCLED WATER SYSTEMS EVALUATION PROJECT
Current and Buildout Land Use TM
November 2005 8
the West Roseville Specific Plan. The UGAs and West Roseville are currently comprised of several large parcels that have not been subdivided to reflect the proposed future developments.
Table 2: Current Land Use Summary within the Proposed 2005 Regional Service Area
Current Connected Area (Acres)
Land Use Designation
Pleasant Grove
Watershed Dry Creek
Watershed
Total Current
Connected Area
(Acres)
Commercial 495 1,622 2,117
Heavy Industrial 364 111 475
Light Industrial 616 316 932
Mixed Use 0 7 7
Open Space 1,398 737 2,135
Parks > 10 Acres 247 263 510
Public/Quasi-Public 154 467 621
Residential 1 DU 4,186 9,343 13,529
Residential 2 DU 0 280 280
Residential 3 DU 0 37 37
Residential Multiple DU 380 547 927
Schools 171 418 589
Total Acreage 8,011 14,148 22,159
SOUTH PLACER WASTEWATER AUTHORITY (SPWA) WASTEWATER AND RECYCLED WATER SYSTEMS EVALUATION PROJECT
Current and Buildout Land Use TM
November 2005 9
Table 3 – Buildout Land Use Summary within the Proposed 2005 Regional Service Area
Buildout Connected Area (Acres)
Land Use Designation
Pleasant Grove
Watershed1 Dry Creek
Watershed2
Total Future Connected
Area (Acres1,2)
Commercial 2,111 2,915 5,026
Heavy Industrial 1,714 263 1,977
Light Industrial 1,598 637 2,235
Mixed Use 27 30 57
Open Space 7,320 3,546 10,866
Parks > 10 Acres 270 360 630
Public/Quasi-Public 323 877 1,200
Residential 1 DU 7,700 18,798 26,498
Residential 2 DU 0 839 839
Residential 3 DU 9 366 375
Residential Multiple DU 727 647 1,374
Schools 376 550 926
Total Acreage 22,175 29,828 52,003 1 Includes portion of Placer Ranch UGA within the proposed 2005 service area.
2 Includes portion of Placer Vineyard UGA within the proposed 2005 service area.
5 Urban Growth Areas The buildout service area boundary to be used in the Systems Evaluation Project expands upon the 2005 systems evaluation service area boundary to include ten Urban Growth Areas (UGAs) identified at the time of this evaluation. These UGA summaries are provided in Tables 4 and 5. The UGAs are shown with the buildout land use map in Figure 4.
UGAs are defined as potential future planning areas that are projected to generate wastewater flow requiring sewerage and meet one or more of the following criteria:
• The area has been annexed, or is being considered for annexation, into a jurisdiction served by SPWA member agencies (Placer County, City of Roseville, or SPMUD).
• The area is part of, or defined as, a Specific Plan Area by the land use planning agency serving one of SPWA members (Placer County, City of Roseville, and City of Rocklin (served by SPMUD), Town of Loomis (served by SPMUD).
• One of the member agencies has provided documented direction to staff in a public forum to analyze the effects of providing sewer service to the planning area for regional wastewater and recycled water systems.
Two of these proposed development areas, Placer Ranch and Placer Vineyard, include areas that are located within the 1996 Master Plan EIR Regional Service Area Boundary (same as the proposed 2005 Service Area Boundary for these UGAs). For the Systems Evaluation Project, only the portions that are outside of the 1996 Master Plan EIR Regional Service Area boundary are considered as a UGA.
The planning areas and properties not being considered as UGAs at this time include Brookfield, AKT North, Amoruso Way, Reason Farms, and the Landfill Areas. Brookfield and AKT North have not been

SOUTH PLACER WASTEWATER AUTHORITY (SPWA) WASTEWATER AND RECYCLED WATER SYSTEMS EVALUATION PROJECT
Current and Buildout Land Use TM
November 2005 10
included due to the lack of planning information for these areas at this time and they do not meet the criteria above. Reason Farms is a detention basin and is not expected to generate any wastewater. Amoruso Way has not been included because it is expected that flow projections for future sewerage will be addressed in the Placer Ranch specific plan. The “Landfill Outside” and “Future Landfill Expansion” planning areas not expected to generate wastewater requiring sewerage.
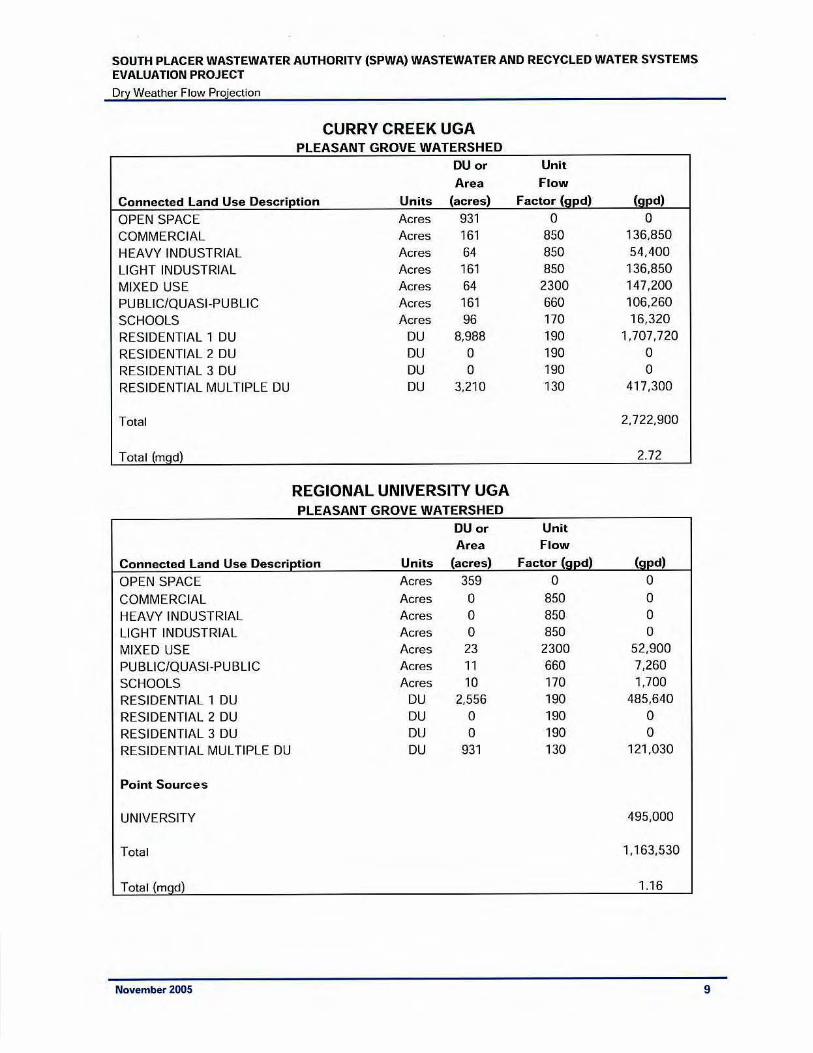
Table 4: Urban Growth Areas
Urban Growth Area (UGA) Land Use Source Total Acres Curry Creek UGA Placer County (b) 3,212
Regional University UGA MacKay & Somps Civil Engineers Inc. 1,140
Inviro Tech UGA (c) Placer County 5
Placer UGA(d) Placer County 630
Orchard Creek (e) Placer County 25
Placer Ranch ( f) Terrance E. Lowell & Associates, Inc. 807
Placer Vineyards (g) MacKay & Somps Civil Engineers Inc. 1,062
SMD-3 Placer County 2,231
SPMUD UGA City of Rocklin & Town of Loomis (h) 2,319
Creekview UGA MacKay & Somps Civil Engineers Inc. 575
Sierra Vista UGA MacKay & Somps Civi l Engineers Inc. 1,785
TOTAL 13,791a (a) Total acres outside of the 1996 Master Plan EIR Regional Service Area boundary (b) Preliminary land use estimates for Curry Creek was developed by RMC and approved by Placer County based on land use
ratios developed by the West Roseville Specific Plan. (c) This parcel is currently served by the County. (d) This square “island” area is not expected to be sewered at buildout due to topography and low development density. (e) Placer County plans to sewer this area north of Athens Road via the SPWA collection system due to the natural topography of
the area. (f) The Placer Ranch project comprised of a total of 2,213 acres with 1,027 acres located inside the 1996 Master Plan EIR
Regional Service Area boundary, 807 acres located outside of this boundary and 379 acres designated as ROW. The 807 acres located outside of the 1996 Master Plan EIR Regional Service Area boundary will be considered as a UGA as part of the Systems Evaluation Project.
(g) The Placer Vineyards project comprised of a total of approximately 5,148 acres with approximately 1,062 acres located inside the 1996 Master Plan EIR Regional Service Area boundary and 4,806 acres (including ROW) located outside of this boundary. The 4,806 acres located outside of the 1996 Master Plan EIR Regional Service Area boundary will be considered as a UGA as part of the Systems Evaluation Project.
(h) SPMUD UGA land use information developed by RMC based on General Plan information for the City of Rocklin and Town of Loomis.

SOUTH PLACER WASTEWATER AUTHORITY (SPWA) WASTEWATER AND RECYCLED WATER SYSTEMS EVALUATION PROJECT
Current and Buildout Land Use TM
November 2005 11
Table 5: Urban Growth Land Use Summary
Urban Growth Area Land Use Category Area
(acres) Dwelling
Units
Curry Creek UGA
Open Space Park > 10 Acres Commercial Heavy Industrial Light Industrial Mixed Use Public/Quasi-Public Schools Residential 1 DU Residential Multiple DU Sub-Total
931 289 161 64
161 64
161 96
1,124 161
3,212
-- -- -- -- --
385 -- --
8,998 3,210
12,583
Regional University UGA
Open Space Commercial Heavy Industrial Light Industrial Mixed Use Public/Quasi-Public Schools Residential 1 DU Residential Multiple DU University (Point Source) Sub-Total
359 0 0 0 23 11 10
327 46
364 1,140
-- -- -- -- 75 -- --
2,556 931 825
4,387
Inviro Tech UGA
Open Space Commercial Heavy Industrial Light Industrial Mixed Use Public/Quasi-Public Schools Residential 1 DU Residential Multiple DU Sub-Total
-- -- -- 5 -- -- -- -- -- 5
-- -- -- -- -- -- -- -- -- 0
Placer UGA
Open Space Commercial Heavy Industrial Light Industrial Mixed Use Public/Quasi-Public Schools Residential 1 DU Residential Multiple DU Sub-Total
-- -- -- -- -- -- --
630 --
630
-- -- -- -- -- -- -- 27 -- 27

SOUTH PLACER WASTEWATER AUTHORITY (SPWA) WASTEWATER AND RECYCLED WATER SYSTEMS EVALUATION PROJECT
Current and Buildout Land Use TM
November 2005 12
Urban Growth Area Land Use Category Area
(acres) Dwelling
Units
Orchard Creek UGA
Open Space Commercial Heavy Industrial Light Industrial Mixed Use Public/Quasi-Public Schools Residential 1 DU Residential Multiple DU Sub-Total
-- -- -- 25 -- -- -- -- -- 25
-- -- -- -- -- -- -- -- -- 0
Placer Ranch (Outside 2005 Service Area)
Open Space Commercial Heavy Industrial Light Industrial Mixed Use Public/Quasi-Public Schools Residential 1 DU Residential Multiple DU University (Point Source) Sub-Total
148 79 0 32 21 0 30
251 78
168 807
-- -- -- --
250 -- --
2,038 2,453
-- 4,741
Placer Vineyard (Outside 2005 Service Area)
Open Space Commercial Heavy Industrial Light Industrial Mixed Use Public/Quasi-Public Schools Residential 1 DU Residential Multiple DU Sub-Total
729 225 0 0 87
137 204 NA NA NA
-- -- -- --
NA -- --
9,843 5,013 NA
SMD-3
Open Space Commercial Heavy Industrial Light Industrial Mixed Use Public/Quasi-Public Schools Residential 1 DU Residential 2 DU Residential Multiple DU Sub-Total
0 3 0 0 0 11 0
2,169 23 25
2,231
-- -- -- -- -- -- --
1,268 14 250
1,532

SOUTH PLACER WASTEWATER AUTHORITY (SPWA) WASTEWATER AND RECYCLED WATER SYSTEMS EVALUATION PROJECT
Current and Buildout Land Use TM
November 2005 13
Urban Growth Area Land Use Category Area
(acres) Dwelling
Units
SPMUD UGA
Open Space Commercial Heavy Industrial Light Industrial Mixed Use Public/Quasi-Public Schools Residential 1 DU Residential Multiple DU Sub-Total
97 99 0 0 0 0 0
2,123 0
2,319
-- -- -- -- -- -- --
5,300 0
5,300
Creekview
Open Space Commercial Heavy Industrial Light Industrial Mixed Use Public/Quasi-Public Schools Residential 1 DU Residential Multiple DU Sub-Total
219 29 11 19 11 19 17 NA NA NA
-- -- -- --
NA -- --
1,610 575 NA
Sierra Vista
Open Space Commercial Heavy Industrial Light Industrial Mixed Use Public/Quasi-Public Schools Residential 1 DU Residential Multiple DU Sub-Total
412 125 0 0 56 28 60
944 160
1,785
-- -- -- --
562 -- --
7,167 3,200
10,929
6 Land Use Database Documentation The final land use database developed by the project team will be provided to SPWA at the conclusion of this project. A definition table for each field name in the database is provided in Table 7. This table also identifies source of data used in each field. During the development of the database, visual map checks were performed comparing maps generated from the database to maps provided in the individual General Plans. During this process, a number of corrections were made to the land use database assuming that the General Plan was the final data source. A summary of each change that was made to the database is provided in Table 8.

SOUTH PLACER WASTEWATER AUTHORITY (SPWA) WASTEWATER AND RECYCLED WATER SYSTEMS EVALUATION PROJECT
Current and Buildout Land Use TM
November 2005 14
Table 7: Land Use Database Field Definition
Field Name Field Definition Data Source
FID INTERNAL FEATURE NUMBER ESRI
SHAPE FEATURE GEOMETRY ESRI
APN ASSESSORS PARCEL NUMBER PLACER COUNTY, ROSEVILLE
ACRES PARCEL ACREAGE ESA
ELUC EXIS TING LAND USE CLASSIFICATION PLACER COUNTY, ROSEVILLE
ELUC_DESC EXISTING LAND USE CLASSIFICATION DESCRIPTION
PLACER COUNTY, ROSEVILLE
SOURCE SOURCE OF EXISTING LAND USE DATA ESA
GPCLASS FUTURE LAND USE CLASSIFICATION PER GENERAL PLAN
PLACER COUNTY, ROSEVILLE, ROCKLIN
BC_CURRENT CURRENT LAND USE USING CONSOLIDATED LAND USE CODES
BC
BC_FUTURE BUILDOUT LAND USE USING CONSOLIDATED LAND USE CODES
BC
MANHOLE_ID
MANHOLE WHERE FLOW IS LOADED IN THE SPWA REGIONAL TRUNK SEWER MODEL (MAY BE DIFFERENT THAN THE ROSEVILLE MODEL MANHOLE_ID)
BC
POINT_X X-COORDINATE OF THE PARCEL CENTROID TO LOAD FLOW IN THE MODEL
BC
POINT_Y Y-COORDINATE OF THE PARCEL CENTROID TO LOAD FLOW IN THE MODEL
BC
DU_DENSITY RESIDENTIAL DEVELOPMENT DENSITY USED TO CALCULATE FUTURE DU ON PARCELS GREATER THAN ½ ACRE
ESA
BC_UNIT CURRENT PARCEL ACRES OR DWELLING UNITS TO CALCULATE FLOW LOAD IN THE MODEL
BC
FUT_BCUNIT BUILDOUT PARCEL ACRES OR DWELLING UNITS TO CALCULATE FLOW LOAD IN THE MODEL
BC
POINT_SOURCE IDENTIFICATION OF PARCELS THAT ARE LOADED INTO THE MODEL AS POINT SOURCES
BC
WWTP WWTP TO WHICH PARCEL IS TRIBUTARY BC
COMMENTS MISCELLANEOUS COMMENTS FOR SPECIFIC PARCEL BC

SOUTH PLACER WASTEWATER AUTHORITY (SPWA) WASTEWATER AND RECYCLED WATER SYSTEMS EVALUATION PROJECT
Current and Buildout Land Use TM
November 2005 15
Table 8: Land Use Database Changes
FID_1 APN Land Use Database Change 202 032-070-066-000 OPEN SPACE TO LDR FROM ROCKLIN GENERAL PLAN
206 030-030-059-000 OPEN SPACE TO LDR FROM ROCKLIN GENERAL PLAN
1760 044-290-034-000 PQP TO LDR FROM LOOMIS GENERAL PLAN
2027 376-010-008-000 LDR TO PARKS FROM ROCKLIN GENERAL PLAN
4288 044-072-020-000 PQP TO LDR FROM LOOMIS GENERAL PLAN
6830 368-080-021-000 LDR TO PARKS FROM ROCKLIN GENERAL PLAN
7181 044-121-052-000 LI TO COMMERCIAL FROM LOOMIS GENERAL PLAN
7184 044-123-065-000 PARKS TO COMMERCIAL FROM LOOMIS GENERAL PLAN
8168 017-350-057-000 LDR TO PARKS FROM ROCKLIN GENERAL PLAN
15137 016-030-018-000 LDR TO PARKS FROM ROCKLIN GENERAL PLAN
15617 016-240-030-000 LDR TO PARKS FROM ROCKLIN GENERAL PLAN
32428 017-116-006-000 OPEN SPACE TO PARK PER ESA MAP
33530 479-170-006-000 OPEN SPACE TO PARKS PER ESA MAP
34470 017-116-019-000 OPEN SPACE TO PARKS PER ESA MAP
38422 017-370-020-000 COMMERCIAL TO OPEN SPACE PER MAP
40423 017-370-019-000 COMMERCIAL TO LDR6.8 PER ESA MAP
49981 017-116-014-000 OPEN SPACE TO PARKS PER ESA MAP
55999 482-130-008-000 OPEN SPACE TO PARKS PER ESA MAP
56502 017-162-033-000 LDR TO PARKS PER ESA MAP
56958 477-080-004-000 RESIDENTIAL TO OPEN SPACE PER ESA MAP
57003 477-100-016-000 OPEN SPACE TO PARKS PER ESA MAP
60443 468-010-033-000 COMMERCIAL TO PARKS PER ROSEVILLE GENERAL PLAN
60483 048-171-005-000 PQP TO OPEN SPACE PER ESA MAP
63887 NA OPEN SPACE TO PARKS PER ESA MAP
64468 NA LDR TO PARKS PER ESA MAP
SOUTH PLACER WASTEWATER AUTHORITY (SPWA) WASTEWATER AND RECYCLED WATER SYSTEMS EVALUATION PROJECT
Current and Buildout Land Use TM
November 2005 16

SOUTH PLACER WASTEWATER AUTHORITY (SPWA) WASTEWATER AND RECYCLED WATER SYSTEMS EVALUATION PROJECT
Current and Buildout Land Use TM
November 2005 17

SOUTH PLACER WASTEWATER AUTHORITY (SPWA) WASTEWATER AND RECYCLED WATER SYSTEMS EVALUATION PROJECT
Current and Buildout Land Use TM
November 2005 18

SOUTH PLACER WASTEWATER AUTHORITY (SPWA) WASTEWATER AND RECYCLED WATER SYSTEMS EVALUATION PROJECT
Current and Buildout Land Use TM
November 2005 19