SPSD II - Belgian Federal Science Policy Office · SPSD II - Part I - Sustainable production and...
141
SPSD II RENEWABLE ENERGY EVOLUTION IN BELGIUM 1974-2025 G. PALMERS, G. DOOMS, S. SHAW, C. SHEUREN, P. ANDRÉ, J. NEYENS, F. DE STEXHE, J. MARTIN PART 1 SUSTAINABLE PRODUCTION AND CONSUMPTION PATTERNS GENERAL ISSUES AGRO-FOOD ENERGY TRANSPORT SCIENTIFIC SUPPORT PLAN FOR A SUSTAINABLE DEVELOPMENT POLICY BELGIAN SCIENCE POLICY
Transcript of SPSD II - Belgian Federal Science Policy Office · SPSD II - Part I - Sustainable production and...

S P S D I I
SP
SD
I
IR
EN
EW
AB
LE
EN
ER
GY
EV
OL
UT
ION
IN
BE
LG
IUM
19
74
-2
02
5
BELGIAN SCIENCE POLICY
HEAD OF THE DEPARTMENT ‘RESEARCH PROGRAMMES’: NICOLE HENRY
CONTACT PERSONS: ANNE FIERENS
SPSD II (2000-2005)
FOR MORE GENERAL INFORMATION:
SECRETARIAT: AURORE DELIS
WETENSCHAPSSTRAAT 8, RUE DE LA SCIENCE
B-1000 BRUSSELS
TEL : +32 (0)2 238 37 61
FAX : +32 (0)2 230 59 12
EMAIL : [email protected]
R E N E W A B L E E N E R G YE V O L U T I O N I N B E L G I U M1 9 7 4 - 2 0 2 5G. PALMERS, G. DOOMS, S. SHAW, C. SHEUREN, P. ANDRÉ, J. NEYENS, F. DE STEXHE, J. MARTIN
PART 1
SUSTAINABLE PRODUCTION AND CONSUMPTION PATTERNS
CP-2
3
GENERAL ISSUES
AGRO-FOOD
ENERGY
TRANSPORT
S C I E N T I F I C S U P P O R T P L A N F O R A S U S T A I N A B L E D E V E L O P M E N T P O L I C Y
BELGIAN SCIENCE POLICY


D/2004/1191/18 Published in 2004 by the Belgian Science Policy Rue de la Science 8 Wetenschapsstraat 8 B-1000 Brussels Belgium Tel: +32 (0)2 238 34 11 – Fax: +32 (0)2 230 59 12 http://www.belspo.be Contact person: Mrs. Anne Fierens Secretariat: +32 (0)2 238 37 61 Neither the Belgian Science Policy nor any person acting on behalf of the Belgian Science Policy is responsible for the use, which might be made of the following information. The authors are responsible for the content. No part of this publication may be reproduced, stored in a retrieval system, or transmitted in any form or by any means, electronic, mechanical, photocopying, recording, or otherwise, without indicating the reference.

Project CP/23 - “Renewable Energy Evolution in Belgium 1974 - 2025”
SPSD II - Part I - Sustainable production and consumption patterns – Energy 3/140
Acknowledgements
The study was made possible thanks to a grant from Belgian Science Policy and has been carried out in good co-ordination with the responsible officer Mrs. Anne Fierens who is gratefully acknowledged.
The following persons are gratefully acknowledged for their contribution to this study:
§ All colleagues in the partner institutes UCL-TERM, IMEC, FUL and 3E.
§ Users group members: M. Draeck (Ministerie van de Vlaamse Gemeenschap - Administratie Economie - Afdeling Natuurlijke Rijkdommen en Energie), K. Derveaux (EUREC Agency), Eddy Janssen (BELSOLAR), G. Michaux (Ministerie Economische Zaken, Bestuur Energie), S. Switten (Ministère de la Region Wallonne Direction Générale des Technologies, de la Recherche et de l’Energie Division de l’Energie), J. Degand (BIM-IBGE)
The authors would like to acknowledge J. Vereecke and W. Bieseman (Ministerie van de Vlaamse Gemeenschap – Administratie Natuurlijke Rijkdommen en Energie) M. Grégoire (formally at Minsterie Economische Zaken, Bestuur Energie) , G. Verbunt (IZEN), G. Descy (ESE), J.P. Vantomme (ESE), F. van Hulle (3E), M. Voogt (Ecofys), Luc Dewilde (3E), Achim Woyte (3E),Werner Coppye (3E), J. De Ruyck (VUB) and J. t'Serstevens (APERe) for their valuable comme nts and contributions.

Project CP/23 - “Renewable Energy Evolution in Belgium 1974 - 2025”
SPSD II - Part I - Sustainable production and consumption patterns – Energy 4/140
Glossary
BAU Business as usual
PROA Pro-active
EC European Commission
EU-15 European Union with its 15 Member States as of April 2004
RES Renewable non-fossil fuels (wind, solar, geothermal, wave, tidal, hydroelectric installations with a capacity below 10 MW and biomass which means products from agriculture and forestry, vegetable waste from agriculture, forestry and from the food production industry, untreated wood waste and cork waste) [EC 2001/77/EC]
RES-E Electricity produced from renewable energy sources
RES-H Heat produced from renewable energy sources
RES-T Transport fuels produced from renewable energy sources
RUE Rational use of energy
MSW Municipal Solid Waste
RD&D Research, development and demonstration
TSO Transmission System Operator

Project CP/23 - “Renewable Energy Evolution in Belgium 1974 - 2025”
SPSD II - Part I - Sustainable production and consumption patterns – Energy 5/140
Table of contents
Acknowledgements............................................................................................................ 3
Glossary........................................................................................................................... 4
Table of contents............................................................................................................... 5
1 Introduction................................................................................................................. 7
2 Renewable Energy Policy Evolution................................................................................... 9 2.1 International policy evolution................................................................................... 9
2.1.1 International policy milestones.......................................................................... 9 2.1.2 RD&D policy.................................................................................................16
2.2 European renewable energy policy ...........................................................................17 2.2.1 European policy milestones.............................................................................17 2.2.2 RD&D policy.................................................................................................21
2.3 Belgian renewable energy policy..............................................................................23 2.3.1 Belgian policy milestones................................................................................23 2.3.2 Operational support .......................................................................................24 2.3.3 Investment subsidies and fiscal incentives..........................................................29 2.3.4 RD&D policy.................................................................................................31
2.4 Other National policies...........................................................................................34
3 Renewable Energy Production Evolution ...........................................................................35 3.1 Renewable energy production in the EU-15................................................................35
3.1.1 Evolution of electricity production from renewables in EU-15..................................35 3.1.2 Current penetration of renewable heat and bio-fuels in EU-15................................39
3.2 Renewable energy production in Belgium ..................................................................40 3.2.1 Evolution of electricity production from renewables in Belgium ...............................40 3.2.2 Current penetration of renewable heat and bio-fuels in Belgium .............................44
4 Renewable Energy Technology Evolution ..........................................................................47 4.1 Overview ............................................................................................................47 4.2 Biomass conversion technologies.............................................................................47 4.3 Wind energy........................................................................................................51 4.4 Photovoltaics.......................................................................................................55 4.5 Solar thermal systems ...........................................................................................59 4.6 Conclusion ..........................................................................................................60
5 Renewable Energy Business evolution ..............................................................................61
6 Renewable Energy Outlook 2000 - 2025 ...........................................................................63 6.1 Introduction ........................................................................................................63
6.1.1 Methodology................................................................................................63 6.1.2 Assumptions ................................................................................................64
6.2 Scenario definition................................................................................................66 6.2.1 Wind energy ................................................................................................66 6.2.2 Hydro power................................................................................................69 6.2.3 PV..............................................................................................................69 6.2.4 Solar thermal ...............................................................................................70 6.2.5 Energy from biomass .....................................................................................70
6.3 Characterisation of scenarios...................................................................................81 6.3.1 Energy production.........................................................................................81 6.3.2 Economic characteristics.................................................................................82 6.3.3 Distributed generation characteristics................................................................83 6.3.4 Visual impact and social acceptance..................................................................83 6.3.5 Indigenous versus imported renewable energy fuels ............................................84

Project CP/23 - “Renewable Energy Evolution in Belgium 1974 - 2025”
SPSD II - Part I - Sustainable production and consumption patterns – Energy 6/140
7 Conclusions.................................................................................................................95 7.1 Renewable energy policy 1974 - 2000.......................................................................95 7.2 Renewable Energy Production 1974 – 2000................................................................96
7.2.1 EU-15.........................................................................................................96 7.2.2 Belgium.......................................................................................................96
7.3 Renewable energy technologies 1974 - 2000..............................................................96 7.4 Future scenarios 2004 - 2025..................................................................................97
8 Recommendations........................................................................................................99 8.1 Long term oriented renewable energy policy ..............................................................99 8.2 Optimisation of support schemes and short to medium term policy.................................99 8.3 Specific sectoral priorities.....................................................................................100 8.4 Quality and performance oriented implementation and monitoring...............................100 8.5 Sustainability including social acceptance.................................................................101 8.6 International market orientation of Belgian industry...................................................101
9 References................................................................................................................103
Annex A : Fiscal deductions in 1983 – 1989 for the energy sector.............................................113
Annex B : Selection of regional R&D, investment subsidies and related programmes ....................115
Annex C : European and Belgian RD&D programmes 1974 – 2000............................................119
Annex D : National policies of interest in the EU-15 and IEA member states ...............................121 D1. Austria: Biomass district heating deployment (BMDH) ..................................................121 D2. France: Wood-based heating systems in the region Rhône-Alpes....................................123 D3. Germany: PV market deployment programme ............................................................125 D4. Germany: SolarBau – energy efficiency & solar energy in commercial building sector.........128 D5. Germany: Solar Na Klar Campagne for solar thermal....................................................129 D6. Germany: Wind power for grid connection : the 250 MW wind programme.......................131 D7. Japan PV: PV power generation systems – from R&D to deployment...............................134 D8. Spain: Solar Ordinance Barcelona ............................................................................135 D9. Sweden: Market transformation – heat pumps............................................................137 D10. United Kingdom: Tradable green certificates market mechanism for green electricity........138

Project CP/23 - “Renewable Energy Evolution in Belgium 1974 - 2025”
SPSD II - Part I - Sustainable production and consumption patterns – Energy 7/140
1 Introduction
Renewable energy in its modern form has been considered as an energy supply option since the early 1970s. Early policies for the development of renewable energy were motivated by concerns over security of supply and price stability. The driving force for the large scale deployment of renewable energy has grown over the course of the last decades as a result of their contribution to global environmental protection, the socio-economic benefits linked to the usage of indigenous energy sources, and their geo-political neutrality.
Energy systems have a high inertia, i.e. require important investments over several decades to make significant changes. Effective energy policies therefore require stability and long term vision, based on a broad consensus of involved stakeholders with respect to costs for consumers and tax payers on short and long term, societal acceptance, risks and macro-economic impacts of the different options.
This report gives a factual overview of the policy evolution, technological progress and energy contribution of renewable energy on European and Belgian level since 1974. It presents scenarios for future development with an economic and energetic characterisation, including aspects of social acceptance. The study limits itself to direct use of solar energy, wind energy, small hydro and energy from biomass.
This report provides a basis for decision-makers to prepare future renewable energy policies.

Project CP/23 - “Renewable Energy Evolution in Belgium 1974 - 2025”
SPSD II - Part I - Sustainable production and consumption patterns – Energy 8/140

Project CP/23 - “Renewable Energy Evolution in Belgium 1974 - 2025”
SPSD II - Part I - Sustainable production and consumption patterns – Energy 9/140
2 Renewable Energy Policy Evolution
2.1 International policy evolution
2.1.1 International policy milestones
The international policy scene is dominated by the UN initiatives, in particular the United Nations Framework Convention on Climate Change and its complementary Kyoto protocol. It is the first world-wide framework for greenhouse gas emissions reduction, and has served as a basis for increased efforts in research on, and the promotion, development and increased use of new and renewable forms of energy. Moreover, in the framework of the project -based mechanisms, Joint Implementation and Clean Development Mechanism, renewable energy is indirectly implicated, since it represents one of the options within the scope of these mechanisms.
The World Solar Summit Process, initiated by UNESCO, has the merit of actively involving the heads of state of developing countries, but did not possess the financial leverage necessary for programme implementation.
The following section gives a factual overview of the major international policy milestones having a direct or indirect impact on the renewable energy policies at European, national and regional levels.
1972 UN Conference on the Human Environment1973
…19861987 Our Common Future - Brundtland Report1988198919901991
1992UN Conference on Environment and Development (Rio Convention, Earth Summit) UNFramework Convention on Climate Change (UNFCCC)
1993 UNESCO World Solar Summit Process1994199519961997 Kyoto Protocol199819992000 G8 Summit - Renewable Energy Task Force2001 Marrakech Accords2002 World Summit on Sustainable Development - Johannesburg Renewable Energy Coalition20032004
Figure 1 : Overview of the main international policy milestones having an impact on renewable energy policies.
The subsequent sub-sections give an overview of the major policy milestones mentioned above.
United Nations Conference on the Human Environment
Type of action: International Conference Date: 5-16 June 1972 Place: Stockholm, Sweden Initiating institution: UN General Assembly Attendance: UN specialised agencies, heads of State or government

Project CP/23 - “Renewable Energy Evolution in Belgium 1974 - 2025”
SPSD II - Part I - Sustainable production and consumption patterns – Energy 10/140
Background, Objective & Outcome:
The 1972 United Nations Conference on the Human Environment was the first major modern international gathering on human activities in relationship to the environment. The conference produced a set of principles in the Declaration[UNCHE 72a], and an Action Plan [UNCHE 72b] covering 3 broad types of act ion: (a) The global environmental assessment programme (Earthwatch); (b) Environmental management activities; (c) International measures to support the national and international actions of assessment and management. The conference also led to the foundation of the United Nations Environment Programme.
Implications for Renewable Energy:
The Action Plan also contained a number of “Recommendations” [UNCHE 72c] regarding energy production and usage and related environmental effects, including the emissions of carbon dioxide and other gases/substances and their effects on weather, human health, plant and animal life etc. and amenity values. The recommendations also incited the provision of mechanism for information exchange on energy and environmental consequences, as well as the conducting of a study to help provide a basis effective development of the world-wide energy resources, taking into consideration the environmental effects of energy production and use.
Brundtland Report
Type of action: Report
Date: 1987 Initiating institution: United Nations
Background, Objective & Outcome:
In 1983 the United Nations set up the World Commission on Environment and Development. The Commission, chaired by Norwegian Prime-Minister Gro Harlem Brundtland, put forward the concept of sustainable development as an alternative approach to one simply based on economic growth. The Commission produced a report Our Common Future [WCED87], published in 1987, widely known as "The Brundtland Report", which analysed the state of the global environment and identified priority areas for an institutional and legal response.
Implications for Renewable Energy:
The report helped trigger a number of actions, including the 1992 UN "Earth Summit”, the International Climate Change Convention, and worldwide Agenda 21 programmes, all of which would have implications on the renewable energy sector (see also later sections).
In direct reference to energy, the Brundtland report highlighted, amongst other things, the environmental risks and uncertainties of high energy future, making particular reference to: climate change, atmospheric pollution and acidification from fossil fuel combustion, and the risk of nuclear reactor accidents. The report called, amongst other things, for international negotiations for a climate treaty, research into the origins and effects of climate change, and international policies for reducing emissions of greenhouse gases.
United Nations Conference on Environment and Development (UNCED) (Also known as Rio Convention, Earth Summit), Rio +10 and the Renewable Energy Coalition
Rio Convention
Type of action: International Conference Date: 3-14 June 1992 Place: Rio de Janeiro, Brazil Organising institution: UNCED Secretariat Attendance: 178 governments (108 at level of heads of State or government), 2400 NGO representatives
Project CP/23 - “Renewable Energy Evolution in Belgium 1974 - 2025”
SPSD II - Part I - Sustainable production and consumption patterns – Energy 11/140
Background, Objective & Outcome:
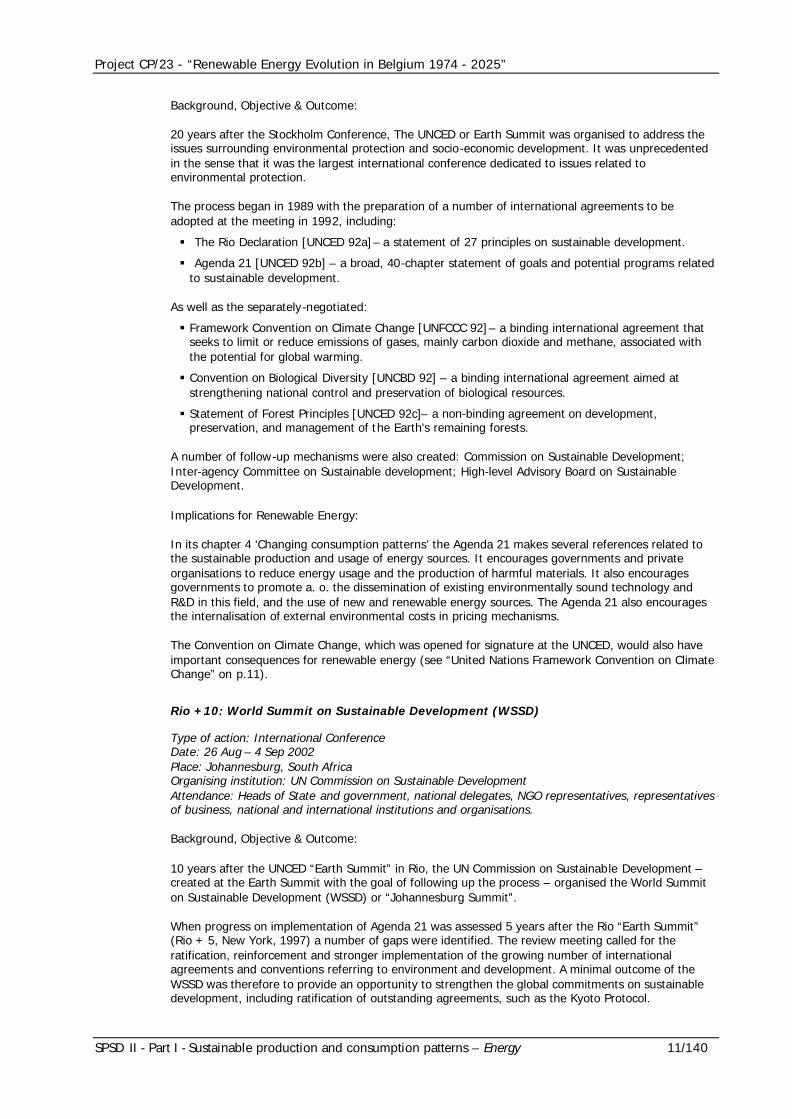
20 years after the Stockholm Conference, The UNCED or Earth Summit was organised to address the issues surrounding environmental protection and socio-economic development. It was unprecedented in the sense that it was the largest international conference dedicated to issues related to environmental protection.
The process began in 1989 with the preparation of a number of international agreements to be adopted at the meeting in 1992, including:
§ The Rio Declaration [UNCED 92a]– a statement of 27 principles on sustainable development.
§ Agenda 21 [UNCED 92b] – a broad, 40-chapter statement of goals and potential programs related to sustainable development.
As well as the separately-negotiated:
§ Framework Convention on Climate Change [UNFCCC 92]– a binding international agreement that seeks to limit or reduce emissions of gases, mainly carbon dioxide and methane, associated with the potential for global warming.
§ Convention on Biological Diversity [UNCBD 92] – a binding international agreement aimed at strengthening national control and preservation of biological resources.
§ Statement of Forest Principles [UNCED 92c]– a non-binding agreement on development, preservation, and management of the Earth's remaining forests.
A number of follow-up mechanisms were also created: Commission on Sustainable Development; Inter-agency Committee on Sustainable development; High-level Advisory Board on Sustainable Development.
Implications for Renewable Energy:
In its chapter 4 ‘Changing consumption patterns’ the Agenda 21 makes several references related to the sustainable production and usage of energy sources. It encourages governments and private organisations to reduce energy usage and the production of harmful materials. It also encourages governments to promote a. o. the dissemination of existing environmentally sound technology and R&D in this field, and the use of new and renewable energy sources. The Agenda 21 also encourages the internalisation of external environmental costs in pricing mechanisms.
The Convention on Climate Change, which was opened for signature at the UNCED, would also have important consequences for renewable energy (see “United Nations Framework Convention on Climate Change” on p.11).
Rio +10: World Summit on Sustainable Development (WSSD)
Type of action: International Conference Date: 26 Aug – 4 Sep 2002 Place: Johannesburg, South Africa Organising institution: UN Commission on Sustainable Development Attendance: Heads of State and government, national delegates, NGO representatives, representatives of business, national and international institutions and organisations.
Background, Objective & Outcome:
10 years after the UNCED “Earth Summit” in Rio, the UN Commission on Sustainable Development –created at the Earth Summit with the goal of following up the process – organised the World Summit on Sustainable Development (WSSD) or “Johannesburg Summit”.
When progress on implementation of Agenda 21 was assessed 5 years after the Rio “Earth Summit” (Rio + 5, New York, 1997) a number of gaps were identified. The review meeting called for the ratification, reinforcement and stronger implementation of the growing number of international agreements and conventions referring to environment and development. A minimal outcome of the WSSD was therefore to provide an opportunity to strengthen the global commitments on sustainable development, including ratification of outstanding agreements, such as the Kyoto Protocol.

Project CP/23 - “Renewable Energy Evolution in Belgium 1974 - 2025”
SPSD II - Part I - Sustainable production and consumption patterns – Energy 12/140
The outcome of the Summit was a Declaration [UN Econ 02a] of main challenges to be tackled, as well as a statement of commitment for achieving the goals of sustainable development, including the undertaking of the WSSD Plan of Implementation [UN Econ 02b].
Implications for Renewable Energy:
The WSSD Plan of Implementation outlines a number of sustainable development goals and the means for achieving these. The Plan identifies access to energy services as critical to poverty eradication. It also calls on governments to diversify energy supply via a.o. renewable sources and to “substantially” increase the global share of renewables. Countries are also urged to develop and implement actions in the field of a. o. renewable energy.
With a view to establishing more specific plans than those outlined in the Summit’s draft action plan for encouraging renewable energy sources, the European Union announced the launching of an initiative “Coalition of the willing” (or Renewable Energy Coalition) for European and developing countries that are keen on setting specific targets for encouraging renewable energy. The goal of the initiative is to encourage setting timetables and other goals for boosting the share of renewables in poorer countries.
Johannesburg Renewable Energy Coalition
At the World Summit on Sustainable Development (Rio +10), the European Union announced the initiative for the formation of a coalition of countries committed to increasing use of renewable energy through “clear…time-bound targets”. Twenty-four countries as well as the European Union supported a joint declaration in this direction ‘the way forward on renewable energy’ [JREC 02]. The coalition adopted the following strategic priorities:
§ Commitment to the setting of targets which assure the accountability of policies for t he promotion of renewable energy.
§ Initiation of actions to stimulate the exchange of experience, adoption and implementation of accompanying policies such as trade-based systems for renewable energy certificates, carbon credits and feed-in systems.
§ Stimulation of regulatory frameworks conducive to the development of renewable energies.
§ Importance of internalising the external benefits related to the use of renewable energy.
§ The responsibility of industrialised countries to further develop markets for renewable energy technologies in order to reduce costs.
§ The importance of looking at the broad portfolio of renewable energy, including wind, solar, biomass, geothermal, hydro power and other technologies.
The Coalition gives special attention to financial instruments. It stresses the importance of market-based solutions, while recognising the particular circumstances of developing countries and the role of public funds, and proposes the establishment of equity fund constructions with the participation of public and private sector.
United Nations Framework Convention on Climate Change (UNFCCC), the Kyoto Protocol and the Marrakech Accords
UNFCCC
Type of action: Legislation Date: Adopted at UNCED, 3-14 June 1992 Place: Signed at UNCED in Rio de Janeiro, Brazil Institutions involved in formulation: Intergovernmental negotiation committee for a Framework Convention on Climate Change (INC/FCCC) State of ratification: As of 17 February 2003, the Convention has received 188 instruments of ratification.
Background, Objective & Outcome:
The United Nations Framework Convention on Climate Change (UNFCCC) was opened for signature at the 1992 Rio Earth Summit. Its ultimate objective is the “stabilization of greenhouse gas

Project CP/23 - “Renewable Energy Evolution in Belgium 1974 - 2025”
SPSD II - Part I - Sustainable production and consumption patterns – Energy 13/140
concentrations in the atmosphere at a level that would prevent dangerous anthropogenic interference with the climate system”.
The Convention [UNFCCC 92] stipulates a general commitment for all Parties to address climate change, adapt to its effects, and report on the action they are taking to implement the Convention. Parties are categorised according to various groups: Annex I Parties (industrialised countries (OECD members) and so-called economies in transition (EITs)), Annex II Parties (industrialised countries (OECD members) only (not EITs) and non-Annex I Parties (developing countries – not listed in Annex I or II).
Implications for Renewable Energy:
Although the Convention does not set out specific legally binding, quantified targets, nor make direct reference to renewable energy itself, it represents an important step in the climate change process in general, and in implicated economic sectors such as energy more specifically. The Convention lays the groundwork for further work and stronger commitments in the future (refer also to subsequent sections). Already one important element of the UNFCCC is its provisions relating technology transfer: The commitments (Art. 4) to “promote and co-operate in the development, application and diffusion, including transfer, of technologies, of…processes that reduce or prevent anthropogenic emissions of greenhouse gases…including the energy…sector[s]”. The Convention also establishes (Art. 11) a financial mechanism, including for the transfer of technology.
Kyoto Protocol
Type of action: Legislation Date: Adopted 11 December 1997 Place: Kyoto, Japan Initiating institution: UNFCCC Conference of Parties (COP) State of ratification: As at 5 September 2003, 84 Parties have signed and 117 Parties have ratified or acceded to the Kyoto Protocol.
Background, Objective & Outcome :
The Kyoto Protocol [UNFCCC 97] supplements and strengthens the Convention. In addition to a set of general commitments for all Parties, the Protocol lays out legally -binding emission targets for Annex I Parties. To meet these targets Annex I Parties are required to implement domestic policies and measures to cut GHG emissions, and may also offset emissions through the use of sinks. In addition to domestic action, Parties may also use the three mechanisms Joint Implementation, Clean Development Mechanism, and Emissions Trading to gain credit for emissions reduced at lower cost abroad than at home. The integrity of the Protocol is ensured by rigorous monitoring procedures.
Implications for Renewable Energy:
The protocol targets 6 major greenhouse gases and specifically identifies (in its Annex A) various sectors or source categories for emission reductions, including fossil-based energy and energy-intensive sectors. Furthermore, the Kyoto Protocol (Art. 2) requires all Annex I Parties, in achieving its emission limitation and reduction commitments, to implement policies and measures, including “research on, and promotion, development and increased use of new and renewable forms of energy…”. Moreover, in the framework of the project -based mechanisms, Joint Implementation and Clean Development Mechanism, renewable energy is indirectly implicated, since it represents one of the options within the scope of these mechanisms.
Marrakech Accords
Type of action: UNFCCC Decisions Date: 29 Oct – 9 Nov 2001 Place: Marrakech, Morocco Initiating institution: UNFCCC Conference of Parties (COP), 7th Session
Background, Objective & Outcome:
The Marrakech Accords [UNFCCC 01] is a comprehensive package of decisions containing a detailed rulebook for the Kyoto Protocol, as well as significant advances in the implementation of the Convention and its rulebook. It elaborates the broad principles of the agreement reached in the
Project CP/23 - “Renewable Energy Evolution in Belgium 1974 - 2025”
SPSD II - Part I - Sustainable production and consumption patterns – Energy 14/140
previous session of the COP and translates them into “legal text”. The adoption of the Marrakech Accords marked the close a major negotiating cycle for detailed commitments for industrialised countries with respect to tackling climate change. The major areas and new issues covered in the Marrakech Accords include :
§ Operating rules of the flexible mechanisms of t he Kyoto protocol: Joint Implementation (JI), the Clean Development Mechanism (CDM) and International Emissions Trading (IET).
§ Rules defining a party's eligibility to participate in the mechanisms.
§ Procedures that provide for full fungibility of units generated under all three mechanisms. Guidelines for the accreditation of Operating Entities (for CDM) and Independent Entities (for JI).
§ Modalities for the accounting of assigned amounts under Art. 7.4 of the Kyoto Protocol.
§ Procedures and mechanisms relating to compliance.
§ Creation of a new type of emissions unit for sinks credits (Removal unit, RMU) generated in Annex I countries.
Implications for Renewable Energy:
An important aspect of the Marrakech Accords (Decision 17/CP.7) is the elaboration of the modalities and procedures for the clean development mechanism (CDM), which is anticipated to encourage the implementation of among others renewable energy projects in developing countries. These procedures also sets out a Decision to develop simplified modalities and procedures for small-scale CDM, including renewable energy project activities of maximum capacity 15 MW.
In its section on technology transfer (Decision 4/CP.7) the Marrakech Accords also defines the scope of capacity building requirements to include among others renewable energy. It also urges Annex II countries, in implementing their commitments, to undertake research into the development and use of renewable energy (Decision 5/CP.7).
G8 head of Government Summit: Renewable Energy Task Force
Type of action: International Task Force Date: 21-23 July 2000 Place: Nago City, Okinawa, Japan Organising institution: G8 Attendance: Heads of state of France, United States, Britain, Germany, Japan, Italy, Canada, European Community, Russia
Background, Objective & Outcome:
Since 1975 the heads of state of the major industrial have met on an annual basis to discuss and provide solutions for dealing with the major economic and political issues facing their individual countries and the international communit y as a whole.
The G7/8 Summit provides a forum for G8 leaders to discuss major international issues and to develop personal contacts needed for collective action on major issues. The Summit has consistently dealt with issues of macroeconomic management, international trade and relations with developing countries, and has broadened its scope over the years to include issues of importance at microeconomic and trans-national levels. The summit gives direction to the international community by setting priorities, defining new issues and providing guidance to international organisations. Summit decisions frequently create and build international regimes to deal with new international challenges.
The leaders personal representatives meet regularly throughout the year to determine the agenda and monitor progress. Occasionally the leaders create task forces or special working groups to focus in-depth on particular issues of concern.
Implications for Renewable Energy:
Energy has been a recurrent issue of concern on t he G8 agenda. An important step for renewable energy was made at the G8 Summit in Okinawa Japan in 2000, where a call was made for the formation of a Task Force to assess the barriers and recommend actions for better encouraging the use of renewables in developing countries. To this end, a G8 renewable Energy Task Force was created, consisting of members from the private and public sectors of developing and developed countries, as well as multilateral and non-governmental organisations.

Project CP/23 - “Renewable Energy Evolution in Belgium 1974 - 2025”
SPSD II - Part I - Sustainable production and consumption patterns – Energy 15/140
In its final report to the G8 [G8 01], the Task Force urged the G8 to give priority to efforts to trigger a step change in renewable energy markets and invited G8 leaders to make a political commitment to this end. A number of recommendations were made relating to:
§ Reducing technology costs by expanding markets
§ Building a strong market environment
§ Mobilising financing
§ Encouraging market-based mechanisms
The World Solar Summit process (WSSP)
Type of action: International Conference Date: Formally initiated 1993 Leading institution: UNESCO Participation: UN specialised agencies, European Commission, International Energy Agency, national governments, international institutions, NGO’s.
Background, Objective & Outcome:
The World Solar Summit Process (WSSP) initiative is a partnership and joint venture involving certain UN specialised agencies and national governments and concerned NGO’s. The initiative was formally launched in 1993 following a High-level Expert meeting organised by UNESCO in 1993 (post UNCED), entitled “The Sun in t he Service of Mankind”. However several preceding events had a role in laying the groundwork for the WSSP. These include the UNESCO Arid Zone Program (1952-1969), the 1973 international congress “The Sun in the Service of Mankind”, the 1981 UN Conference on New and Renewable Source of Energy as well as a number of national and international programs .
The objective of the 1993 high-level meeting was to investigate how to increase the use of solar energy and other renewable energies in the interest of economic and social development and environmental protection. The outcome was a recommendation for a “World Solar Summit Process” – a 3-year campaign (1993-1996) leading to the organisation of a World Solar Summit, with the purpose of providing a political stimulation from Heads of State and Government to enhance renewable energy dissemination. A World Solar Commission (WSC) was created in 1994 to prepare and carry out the World Solar Summit. The WSSP culminated in the World Solar Summit, 16-17 Sep. 1996 in Zimbabwe, attended by 18 Heads of State and government, ministers and high-ranking officials representing 104 countries, 27 regional and international institutions and NGO’s. The Summit approved a Declaration on Solar Energy and Sustainable Development [WSS 96] and initiated the preparation of the World Solar Programme (WSP) 1996-2005 to be headed by the WSC, which was approved in 1997.
Implications for Renewable Energy:
The 3 main results of the World Solar Summit may be summarised as follows :
§ Renewable energies are recognised as being an important component of the energy sector of the 21st century.
§ Agreement to launch a World Solar Programme 1996-2005 (WSP) as a collective effort of the UN and specialised agencies and programmes of the UN and of national governments, inter-governmental and non-governmental organisations, university and research institutions and the private sector.
§ Approval of a WSP outline with agreement for full WSP to be elaborated by July 1997.
The WSP is a broad partnership and co-operation of governments and organisations to promote the adoption and wider use of renewables through the setting of agreed targets, appropriate standards, co-operative mechanisms, incentives and pooling of resources . The WSP covers over 300 renewable energy projects in 73 countries and island states to be implemented over a 10-year period .
The World Solar Summit Process has the merit of the active involvement of heads of state of developing countries, but missed the financial leverage to implement its programme.

Project CP/23 - “Renewable Energy Evolution in Belgium 1974 - 2025”
SPSD II - Part I - Sustainable production and consumption patterns – Energy 16/140
2.1.2 RD&D policy
The International Energy Agency (IEA) was established in November 1974 in response to the oil crisis, as an autonomous intergovernmental entity within the Organisation for Economic Co-operation and Development (OECD), to ensure the energy security of industrialised nations.
Under the Agreement on an International Energy Program (IEP), IEA Member countries commit to hold emergency oil stocks equivalent to 90 days of net oil imports and to take effective co-operative measures to meet any oil supply emergency. Over the long term, Members strive to reduce their vulnerability to a supply disruption. Measures to attain this objective include increased energy efficiency, conservation, and the development of coal, natural gas, nuclear power and renewable energy sources, with a strong emphasis on technology development.
The technological focus is illustrated by its implementing agreements covering a series of energy technologies, the agreements acting as the bases for multi-lateral co-operation in RD&D. The following implementing agreements were signed in relation to renewable energy technologies:
Table 1 : IEA Implementing Agreements related to renewable energy
Name Reference Start date
Bioenergy http://www.ieabioenergy.com 1978
Geothermal http://spider.iea.org/tech/gia 1997
Hydro power http://www.ieahydro.org 1995
Photovoltaic Power Systems http://www.iea-pvps.org 1992
Solar Heating and Cooling http://www.iea-shc.org 1977
Solarpaces http://www.solarpaces.org 1977
Wind Turbine Systems http://www.ieawind.org 1977
The national RD&D programmes provided the RD&D budgets. The IEA umbrella contributed without a doubt to the dissemination of results, the introduction of best practices and t o the basis of many multi-lateral norms and standards.
Belgium is a member of 2 ‘Implementing Agreements’ related to renewable energy:
IEA Bioenergy Started: 1978 Partners: 20 members (19 countries + European Commission) Australia, Austria, Belgium, Brazil, Canada, Croatia, Denmark, European Commission, Finland, France, Ireland, Italy, Japan, New Zealand, Norway, Sweden, Switzerland, The Netherlands, United Kingdom, United States of America
Contact : Y. SCHENKEL, Département Génie rural, CRA Gembloux
IEA Solar Thermal and Heating programme Started: 1977 Partners : 21 members (20 countries + European Commission) Australia, Austria, Belgium, Canada, Denmark, European Commission, Finland, France, Germany, Italy, Japan, Mexico, Netherlands, New Zealand, Norway, Portugal, Spain, Sweden, Switzerland, United Kingdom, United States
Contact : A. De Herde, Architecture et Climat UCL
The first collection of statistics on renewable energy and waste was carried out in 2000. The statistics on renewable energy from IEA go back to 1990.

Project CP/23 - “Renewable Energy Evolution in Belgium 1974 - 2025”
SPSD II - Part I - Sustainable production and consumption patterns – Energy 17/140
2.2 European renewable energy policy
2.2.1 European policy milestones
The early origins of EU energy policy are founded in the Treaties establishing 1. the European Coal and Steel Community (ECSC) (signed April 1951, entered into force July 1952, expired July 2002), and 2. the European Atomic Energy Community (EURATOM) (signed, together with the Treaty establishing the European Economic Community (EEC), March 1957, entered into force January 1958). These Treaties are based on supply-directed energy policies.
When the 3 Treaties were merged (the Merger Treaty, signed April 1965 and in force since July 1967), there was a provision for a Single Commission and a Single Council of the then three European Communities. With the creation of these institutions, new Directorates-General were formed, including a new Directorate-General ‘Energy’ (DG XVII). The paradigm of a centralised, supply-based energy policy was not questioned. This DG Energy was later integrated with the DG Transport.
The founding treaties have been amended on several occasions, in particular when new Member States acceded. When Denmark joined the Community in 1973 (together with the United Kingdom and Ireland), discussions on the strategic axes of the EC’s energy policy started at ministerial level. Denmark had (and still has) an energy policy based on the combination of both supply and demand measures. The entrance of Denmark and Ireland and the growing anti-nuclear movement (mainly in Germany) and its associated supply based energy policy diversified the energy policy debate. The first enlargement reduced the political weight of supply-oriented member states such as France, resulting in a gradual increase in attention towards energy conservation and renewable energy programmes in the EC energy policy.
The European Union officially started its renewable energy policy through the launching of RD&D programmes from 1974 onwards. The first steps in implementation-directed policy started in 1994, where the Madrid Conference laid the basis for the first targeted objectives for renewable energy on EU level, later formalised in the White Paper ‘Energy for the future - renewable sources of energy’. The first European directive on renewable energy was adopted in 2001 and introduced indicative targets for electricity produced from renewable sources of energy. Other implementation-oriented directives followed it: energy performance of buildings, use of bio-fuels, and combined heat and power.
19741975 European R&D programmes on renewable energy197619771978 Demonstration programmes on renewable energy technologies1979
…199119921993 Start of Altener programme (non-technical topics)1994 Preparatory Conference on EU renewable energy targets (Madrid Declaration)1995 Integration of R&D and demonstration in Framework Programmes1996 Directive Liberalisation of Energy Markets 19/12/961997 White Paper Renewable Sources of Energy1998199920002001 Directive Green Electricity 2002 Directive Energy Performance of Buildings - Green Paper on Security of Supply2003 Directive on the promotion of biofuel use - Directive on reduced biofuel taxation2004 Directive on the promotion of cogeneration
Figure 2 : Overview of the main European renewable energy policy milestones

Project CP/23 - “Renewable Energy Evolution in Belgium 1974 - 2025”
SPSD II - Part I - Sustainable production and consumption patterns – Energy 18/140
The Green Paper "Towards a European strategy for the security of energy supply" [EC COMM(2002)321 final] was developed with a view to achieving a number of goals:
It seeks to curb the EU’s increasing dependence on imported energy sources (projected to reach 70% by 2030 in base case) – particularly in light of elevated oil prices – and aims to develop an energy policy to meet goals associated with climate change and energy market deregulation.
The Commission has since put forward a number of proposals for legislative measures directed at achieving the aims of the White Paper on renewables and the Green Paper on security of energy supply. These included proposals for Directives in relation to the following individual areas:
§ Promotion of the electricity produced from renewable energy sources.
§ Energy performance in buildings.
§ Promotion and use of bio-fuels in transport, and an amending directive for applying reduced excise duty on bio-fuels.
§ Co-generation of heat and power (CHP) including CHP based on biomass.
Following these proposals, a directive on electricity from renewable energy sources has been adopted, as well as a directive on the energy performance of buildings. These were followed by a directive on the promotion of the use of bio-fuels or other renewable fuels for transport, and a directive restructuring the Community framework for the taxation of energy products and electricity.
In addition, direct support measures in the way of EC-funded RD&D is being continued under the 6th Framework programme and the programme ‘Intelligent Energy for Europe’.
The next sections give a factual review of these policy initiatives. The main objectives of the directives are summarised in Table 2 and explained thereafter.
Table 2 : Main objectives of the European directives related to renewable energy
Green Electricity
• 22.1% of gross domestic consumption by 2010
• Indicative national targets and evaluation
Energy performance of buildings
• Inclusion of passive solar systems, natural lighting and ventilation, and positive influence of active solar systems
• Feasibility of renewable energy integration for buildings > 1000 m2
Bio-fuels
• Required min. % of bio-fuels & other renewable fuels on the market
• Setting of national indicative targets for bio-fuels proportion. Reference values for target: 2% (2005) & 5.75% (2010) of all gasoline and diesel for transport purposes placed on market
• Framework for application of reduced taxation levels for bio-fuels
Co-generation
• Facilitate grid access for renewable energy-based co-generation
• Preferential efficiency reference values
Directive on green electricity [EC 2001/77/EC]
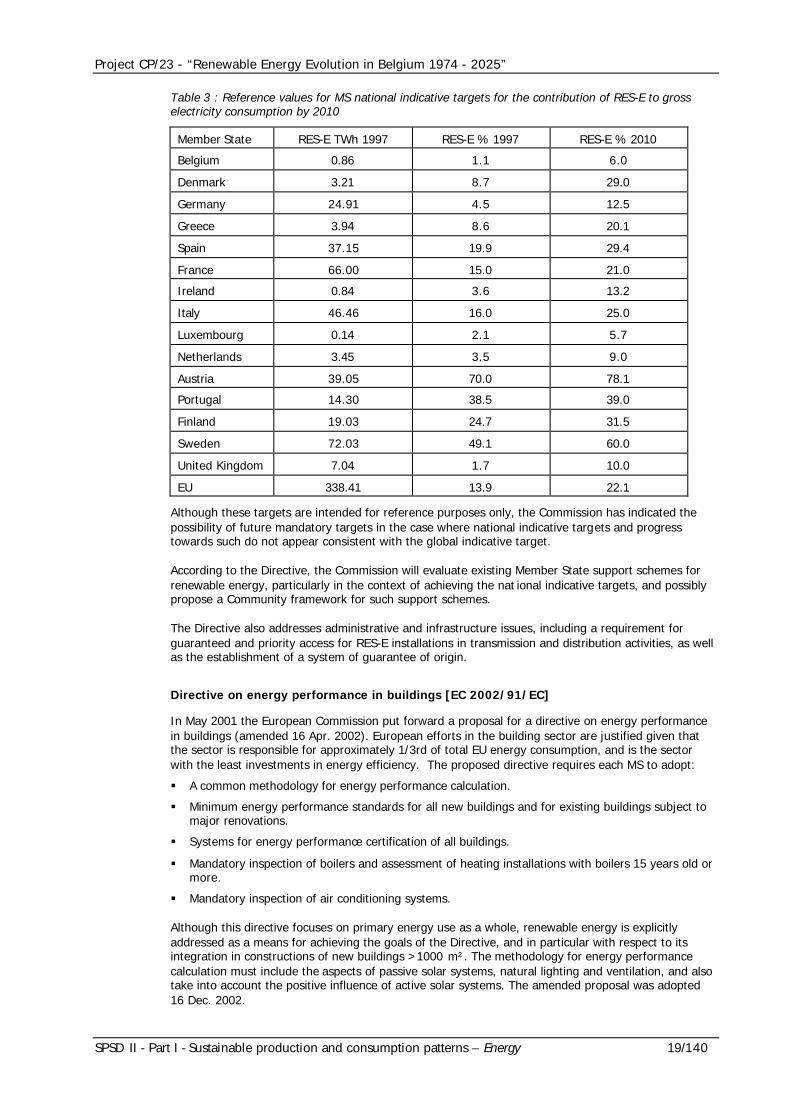
In September 2001, the first European directive on renewable energy was adopted by the European Parliament. The purpose of the Directive is to establish a basis for a future Community framework for promoting an increase in the share of electricity produced from renewable sources (RES-E) in the internal electricity market. To this end, the Commission proposed a global indicative target of 22.1% share of RES-E in total Community electricity consumption by 2010, compared to the 14% observed in 1997. Each Member State (MS) is responsible for setting national indicative targets to enable the overall objective to be obtained. The Commission has however established a set of reference values for national indicative targets for each MS – given in the Annex of the Directive. These are outlined in Table 3.
Project CP/23 - “Renewable Energy Evolution in Belgium 1974 - 2025”
SPSD II - Part I - Sustainable production and consumption patterns – Energy 19/140
Table 3 : Reference values for MS national indicative targets for the contribution of RES-E to gross electricity consumption by 2010
Member State RES-E TWh 1997 RES-E % 1997 RES-E % 2010
Belgium 0.86 1.1 6.0
Denmark 3.21 8.7 29.0
Germany 24.91 4.5 12.5
Greece 3.94 8.6 20.1
Spain 37.15 19.9 29.4
France 66.00 15.0 21.0
Ireland 0.84 3.6 13.2
Italy 46.46 16.0 25.0
Luxembourg 0.14 2.1 5.7
Netherlands 3.45 3.5 9.0
Austria 39.05 70.0 78.1
Portugal 14.30 38.5 39.0
Finland 19.03 24.7 31.5
Sweden 72.03 49.1 60.0
United Kingdom 7.04 1.7 10.0
EU 338.41 13.9 22.1
Although these targets are intended for reference purposes only, the Commission has indicated the possibility of future mandatory targets in the case where national indicative targets and progress towards such do not appear consistent with the global indicative target.
According to the Directive, the Commission will evaluate existing Member State support schemes for renewable energy, particularly in the context of achieving the nat ional indicative targets, and possibly propose a Community framework for such support schemes.
The Directive also addresses administrative and infrastructure issues, including a requirement for guaranteed and priority access for RES-E installations in transmission and distribution activities, as well as the establishment of a system of guarantee of origin.
Directive on energy performance in buildings [EC 2002/91/EC]
In May 2001 the European Commission put forward a proposal for a directive on energy performance in buildings (amended 16 Apr. 2002). European efforts in the building sector are justified given that the sector is responsible for approximately 1/3rd of total EU energy consumption, and is the sector with the least investments in energy efficiency. The proposed directive requires each MS to adopt:
§ A common methodology for energy performance calculation.
§ Minimum energy performance standards for all new buildings and for existing buildings subject to major renovations.
§ Systems for energy performance certification of all buildings.
§ Mandatory inspection of boilers and assessment of heating installations with boilers 15 years old or more.
§ Mandatory inspection of air conditioning systems.
Although this directive focuses on primary energy use as a whole, renewable energy is explicitly addressed as a means for achieving the goals of the Directive, and in particular with respect to its integration in constructions of new buildings >1000 m². The methodology for energy performance calculation must include the aspects of passive solar systems, natural lighting and ventilation, and also take into account the positive influence of active solar systems. The amended proposal was adopted 16 Dec. 2002.

Project CP/23 - “Renewable Energy Evolution in Belgium 1974 - 2025”
SPSD II - Part I - Sustainable production and consumption patterns – Energy 20/140
Directives on the promotion of bio-fuel use for transport and on the taxation of energy products and electricity [EC 2003/30/EC] [EC 2003/96/EC]
The EU transport sector is almost completely dependent on oil – a large part of which is imported – and the sector is expected to result in increasing amounts of CO 2 emissions. A harmonised strategy for the increased use of bio-fuels in the EU is targeted as one measure for meeting a number of EU-wide interests: CO2 emission reductions, increased supply security, and RES promotion. Consequently, in November 2001, the Commission put forward two proposals for promoting the use of bio-fuels in the EU:
1. A proposal for an EU Directive on the promotion and use of bio-fuels for transport.
2. A proposal for an amending Council Directive for applying a reduced rate of excise duty on certain mineral oils containing bio-fuels and on bio-fuels.
These resulted respectively in the adoption of a Directive on the promotion and use of bio-fuels for transport (8 May 2003) [EC 2003/30/EC], and a Directive restructuring the Community framework for the t axation of energy products and electricity (27 Oct. 2003) [EC 2003/96/EC].
The first Directive aims at promoting the use of bio-fuels or other renewable fuels for the replacement of diesel or petrol for transport purposes. It establishes a requirement for MS to ensure that a minimum proportion of bio-fuels and other renewable fuels is placed on their markets, and to set national indicative targets to that effect. Reference values for targets are given in the Directive, calculated on the basis of energy cont ent. The reference values are:
§ Minimum of 2%, calculated on the basis of energy content, of all gasoline and diesel for transport purposes placed on their markets by 31 Dec. 2005.
§ Minimum of 5.75%, calculated on the basis of energy content, of all gasoline and diesel for transport purposes placed on their markets by 31 Dec. 2010.
MS are required to implement the Directive by 31 Dec. 2004. The Commission will evaluate by 31 Dec. 2006 (and every 2 years thereafter) the progress achieved by MS in the promotion and use of bio-fuels, including the likelihood of achieving the indicative targets, and possibly the proposal of mandatory targets.
The second Directive serves to enlarge the scope of Council Directive 92/81/EEC on the harmonisation of excise duties on mineral oils. Under the Directive 92/81/EEC bio-fuels blended into motor or heating fuels would normally be taxed according to end product and use, unless specific authorisation for excise reduction or exemption is sought by the Member State. The Directive establishes minimum taxation levels for electricity and energy products other than mineral oils, and at the same time provides a mechanism for applying exemptions or reduced levels of taxation in specific circumstances; in particular renewable energy sources may qualify for preferential treatment. Furthermore, fuels consisting partly or fully of bio-fuels may also be eligible for reduced taxation.
The above two Directives may be seen as complementary with respect to achieving an enhanced use of bio-fuels in the EU and realising specific environmental objectives. It is envisaged that the flexibility provided by the taxation framework will not only assist in the incorporation of bio-fuels in transport fuel usage, but also enable MS to go beyond the compulsory objectives.
Directive on the promotion of co-generation of heat and power [EC 2004/8/EC]
The promotion of co-generation of heat and power is part of the European strategy for efficient use of energy, and supplementary to the strategy for increased use of renewables. The objective is to create a framework that can support and facilitate the installation and proper functioning of electrical co-generation plants where a useful heat demand exists or is foreseen. Renewables accounted for 13% of the use of fuels in cogeneration in 1998, according to the EUROSTAT definition. With respect to the use of renewable energy sources, the following elements are foreseen:
§ Facilitation of grid access for co-generation units using renewable sources of energy.
§ Determination of efficiency reference values for separate production of heat can be lowered to 80% compared to 90% for other new co-generation units.

Project CP/23 - “Renewable Energy Evolution in Belgium 1974 - 2025”
SPSD II - Part I - Sustainable production and consumption patterns – Energy 21/140
2.2.2 RD&D policy
Programmes
The first European Commission (EC) research programme devoted to renewable energy was drawn up by the Council of Ministers in 1975. The high European Union (EU) dependence on imported energy resources was the major driving force for investing in the development of new energy technologies. The programme included renewable energy, hydrogen and energy conservation.
Research programmes continued and a demonstration component of EC programmes was started in 1978. The EC has played a major role in e.g. the demonstration and upscaling of wind turbines and the development of new concepts in this field and, as a result, has had a major role in the industrial successes in the field, as is the case for photovoltaics.
From 1995 onwards, the research and demonstration programmes were integrated into the Framework programmes. Other EC programmes, such as the ALTENER and EIE programme, focussed on non-technical issues of renewable energy (planning, dissemination, norms and regulations, etc.).
Budgets
European funding was often used as source of co-financing of national and regional contributions. Therefore the RD&D budgets of European institutions and of the member states are considered together.
The budgets spent by national and regional programmes were reported to the IEA and published regularly and used as such for this study [IEA 02].
The budgets spent by European programmes are not consistently published in sufficient detail to allow for a split -up per technological domain over the entire period considered in this study. As a result, the European programmes from 1975 onwards were investigated case by case and their budgetary efforts estimated based on programme reports [EC 93] [EC 94] [EC 97], programme evaluations and personal communications. The results were compared with figures published by other references for overlapping periods in time. The evolution of these budgets in absolute figures and split -up into the fossil and nuclear energy on the one hand, and renewable and energy conservation on the other, are depicted in Figure 3. This ‘trajectory’ of public investment in RD&D enables one to conclude that RD&D investments in renewable energy and energy conservation remained relatively low, and were not a clear policy priority. Furthermore, the budgets for all technologies can be seen to evolve according to the state of the energy markets at a given time.
The oil crisis in 1973 and the early 80’s clearly gave rise to a growing public investment in RD&D in energy technologies. In the period 1985 - 1990, public interest decreased significantly due to lower oil prices and reduced nuclear RD&D budgets, possibly related to the Chernobyl accident (1986).
With increased attention to global environmental challenges, budgets tended to rise again slightly by 1990. For the first time, public investments for renewable energy and energy conservation combined equalled that for fossil and nuclear together. But in absolute values, the public spending on RD&D in energy technologies stays much lower than it was in the 1970s and 1980s.

Project CP/23 - “Renewable Energy Evolution in Belgium 1974 - 2025”
SPSD II - Part I - Sustainable production and consumption patterns – Energy 22/140
0
500
1000
1500
2000
2500
3000
3500
4000
0 500 1000 1500 2000 2500 3000 3500 4000
Renewable energy + Rational use of Energy RD&D (M€)
Foss
il +
Nuc
lear
RD
&D
(M
€)
1974
1999
1985
1990
Figure 3 : Trajectory of public spending on energy RD&D split -up in fossil and nuclear energy versus energy conservation and renewable energy. The grey line represents the evolution of the budgets spent by the EU15 member states. The black line includes the budgets spent by the EU15 member states plus the budgets spent by the European Institutions (i.e. European Commission and budgets spent in the frame of EGKS and EURATOM treaty).
The accumulated expenditure of European Institutions in renewable energy is between 10 to 15% of the combined public investments of the 15 current EU member states for the period 1974 – 2000.
Although the budgetary contribution of the European Institutions to the renewable energy RD&D is relatively modest, its contribution to technological progress is clearly focussed on wind energy technology and photovoltaics, whereas for solar thermal energy the main investments were done on national level. In addition, the European dimension offered by the EC programmes has been crucial for the technological progress of the European research society and industry, with the establishment of EU technology networks and information exchange in specific :
§ The exchange of scientific and technological national experiences.
§ Cooperation on supra-national issues such as standardisation (e.g. European Wind Turbine Standards [DEKK 98], certification [HUL 01], resource characterisation, etc. (e.g. the European Wind Atlas [TRO 89], the European Solar Atlas [PALZ 84]).
It should be noted that large differences occur between the budgets spent by different member states. The German case is clearly one of structural leadership, as, on average, the German budget represented 30% of the total of the 15 national budgets over the period 1974 – 2000.
In the last 2 decades, the professional federations in each domain were established on EU level : EWEA (European Wind Energy Association), EPIA (European Photovoltaic Industry Association), EUBIA (European Biomass Industry Association), EBIOM (Association Europeénne pour la Biomasse), EUREC (European Renewable energy research centres), ESTIF (European Solar Thermal Industry Federation).

Project CP/23 - “Renewable Energy Evolution in Belgium 1974 - 2025”
SPSD II - Part I - Sustainable production and consumption patterns – Energy 23/140
2.3 Belgian renewable energy policy
2.3.1 Belgian policy milestones
The Belgian state reforms have transferred a series of competencies from federal to the regional levels. The reform of 1980 was very restrictive with respect to the transfer of power on energy policy to the regions. With the memory of the oil crises still fresh, the federal government wanted to keep full control over the national energy policy. The reform of 1988 on the other hand gave autonomous competencies to the regions, in particular with respect to rational use of energy and renewable energy [DEK 01].
Another structural change in energy policy was the liberalisation of energy markets from 1999 onwards. This had a direct impact on renewable energy policies. Belgian policy on renewable energy must therefore be analysed taking into account the competence level before and after 1988, and the market organisation before and after 1999.
The federal policy with respect to renewable energy R&D support was implemented from 1974 onwards. From the 80’s onwards, fiscal measures were implemented to stimulate investments in energy efficiency and renewable energy. Investment subsidies were provided by the Regions from the early ‘90’s, based on the laws on economic expansion and reorientation. Investment subsidies for innovative technologies (‘demonstration programmes’) were provided in separate programmes.
In 1995, operational support was given as a production subsidy per kWh. This was changed to a mechanism of green certificates and quota from 1999 onwards.
A consequence of the changes of competence level is that the data available on past policies is spread over several public services and, in most cases, are not comparable because of different accounting principles. In addition, for most periods in time there either does not exist archived information or such information is not sufficiently differentiated to be able to distinguish support specific solely to renewable energy. Finally, the existing and useful data are mostly available on paper listings, rendering analysis time consuming. Within the scope of this study, the available data was analysed even if they did not cover the entire time period envisaged.
Within these methodological and practical limitations, an overview is given of the essential elements of the renewable energy policy from 1974 to 2000.

Project CP/23 - “Renewable Energy Evolution in Belgium 1974 - 2025”
SPSD II - Part I - Sustainable production and consumption patterns – Energy 24/140
FederalBrussels Capital Region Flemish Region Walloon Region
197219731974 Start of R&D on renewable energy1975
…19791980 State Reform 8/08/1980 1981
…19871988 State reform 8/08/1988 1989
…1994
1995CCEG recommendation production support
19961997
1998CCEG recommendation production support
1999 Federal liberalisation energy markets
2000
Regional liberalisation energy markets
2001
Regional liberalisation energy markets
2002
Regional liberalisation energy markets
20032004
Figure 4 : Policy milestones in the energy policy in Belgium relevant to renewable energy policy
2.3.2 Operational support
Belgium introduced its first operational support to the production of electricity from renewable sources in 1995. 1 BF/kWh was attributed to producers, and this amount was increased to 2 BF/kWh in 1998. Support was limited to wind and small hydro. This support was based on recommendations of the CCEG (‘Controlecomitee voor Elektriciteit en Gas- Comité de Controle de l’Electricity et du Gaz’1 ), and financed by a levy paid by all consumers. The system was abolished upon the introduction of the system of green certificates on regional level.
Belgium has implemented a system of tradable green certificates and quota as part of the liberalisation of the energy markets. The quota are imposed on the electricity suppliers, with minimum (‘fall-back’) prices for certificates. Implementation characteristics, such as targets and quota differ from region to region, as do the criteria for eligibility of technologies.
Each region and the federal government has appointed the regulators (CREG, CWAPE, VREG, IBGE/BIM) as issuing body and registration body. For the time being, there is limited mutual acceptance (for quota compliance) between the regions and the federal level, as indicated in
Table 4.
1 Electricity and Gas Control Committee

Project CP/23 - “Renewable Energy Evolution in Belgium 1974 - 2025”
SPSD II - Part I - Sustainable production and consumption patterns – Energy 25/140
Table 4 : Mutual acceptance of green certificates (Y = yes; N = no)
Issuing Body Flemish quota
(VREG)
Walloon quota
(CWAPE)
Brussels quota
(BIM/IBGE)
CREG Issued Y Y Y
VREG Issued Y Possibly Y under conditions
Possibly Y under conditions
CWAPE Issued Possibly Y under conditions
Y Possibly Y under conditions
BIM/IBGE Issued Possibly Y under conditions
Possibly Y under conditions
Y
Foreign issuing body Possibly Y under conditions
Possibly Y under conditions
Possibly Y under conditions
Federal level
The federal policy level has limited authorities in renewable energy policy. Its competence is limited to offshore wind and to aspects related to the high voltage grid.
The federal energy minister is in charge of the domain concession procedure for offshore wind. The federal regulator has been appointed as the issuing body for green certificates for offshore wind installations. The federal level does not impose quota on the high voltage grid supply, as this market share is included in the regional quota.
However, the federal policy level foresees fall-back prices for certificates to secure investors confidence. These prices are guaranteed by a purchase obligation put on the TSO (Transmission System Operator), ELIA, and differ according to the type of technology used :
Table 5 : Federal-level fixed (fall-back) prices for green certificates [KB 16/07/2002]
Renewable energy technology Fixed price (€/MWh)
Offshore wind energy 90
Onshore wind energy 50
Hydraulic energy 50
Solar energy 150
Other renewable energy sources (Biomass)
20
This purchase obligation of ELIA starts at the commissioning date of the installation and is valid for 10 years.
The grid code and the transmission grid tariff system foresee specific rules for electricity produced from renewable energy sources:
§ Priority in grid access and dispatching.
§ Reduction coefficient in cost components of the tariff structure for electricity from wind power.
§ Increased tolerance margin for the access responsible party, for the electricity from renewable sources.
However, these advantages have not yet been brought to a level of detail sufficient to be used in practice. It is expected that these rules will be further detailed in accordance with the timing of the first installations where these rules will apply.

Project CP/23 - “Renewable Energy Evolution in Belgium 1974 - 2025”
SPSD II - Part I - Sustainable production and consumption patterns – Energy 26/140
Flemish Region
A system of green certificates, accompanied by quota obligations and penalties has been in operation since January 1st 2002. The Flemish Regulator (VREG) is in charge of the management of the system.
The certificates are issued per production volume of 1 MWh electricity produced from renewable sources in the Flemish Region. These certificates get a market value as a consequence of the quota obligation imposed on the electricity suppliers, which is accompanied by penalties for non-compliance.
Each supplier is required to cover a given proportion of the electricity he supplies via the distribution network by green certificates. The required percentages are 0.8% in 2002, 1.2% in 2003 and 2% in 2004. This percentage grows to 6% in 2010. In the case of non-compliance, the supplier is obliged to pay a penalty in proportion to the number of missing certificates. The penalty is to be paid on March 31st following the year of supply. The penalty amounts to € 75 per missing certificate on March 31st 2003, € 100 on March 31st 2004, and € 125 on March 2005 and the subsequent years.
A supplier can obtain certificates by producing electricity from renewable sources or by purchasing them on the market.
The penalties will be used to finance a renewable energy fund. This fund will be used to finance additional policy initiatives in the renewable energy sector such as promotion and dissemination activities, investment subsidies, demonstration programmes etc.
The mechanism has given an important market push as proven by the growth in installed capacities (see chapter 3.2.1.).
Walloon region
Since 1 Jan. 2003, the Walloon region has implemented a system of green certificates for the promotion of green electricity generation [DW 12/04/01] [AGW 04/07/02].
In this system, green electricity is defined not only as electricity generated from renewable energy sources (including hybrid systems) but also as electricity from fossil-fuelled quality cogeneration plants when providing in both cases at least 10% of CO2 emission reduction. The CO 2 emission reduction factor is calculated by comparison of the CO2 emissions from the green electricity route considered to CO2 emissions from reference units for electricity and heat generation. Conventional values of CO2 emissions from fossil and RES primary energies are published by CWaPE.
On this basis, the issue of a green certificate corresponds to a fixed amount of CO 2 emission reduction (456 kgCO 2/MWhe). This amount is the CO2 emitted when 1 MWh is generated by the reference power plant (STAG unit, 55%, NG). The number of green certificates issued is then given by the product of the number of green electricity generated and the CO2 emission reduction factor calculated. For RES (biomass) – CHP systems, specific green certificates are issued for the CHP effect and for the RES effect. Consequently, a RES or CHP label is added t o green certificates issued by CWaPE.
For wind, hydro and photovoltaic systems, the CO2 saving rate (t) is one and they will get a green certificate for each MWh of produced. For solid biomass, the CO 2 saving rate (t ) is below 1 due to fossil energy consumption for drying, crushing, transport, etc. For CHP-biomass, the CO 2 saving rate (t ) is usually between 1 and 2 due to the additional CHP effect. For fossil-fuelled CHP systems, the CO2 saving rate (t) will typically be 0,3 GC per produced MWh.
A market for green certificates is created via a legal obligation on electricity suppliers to obtain a certain number of green certificates corresponding to a given percentage of the electricity supplied by them to consumers (quota obligation). If this obligation is not met the supplier faces a penalty proportional to the number certificates by which he is in shortage. During the transitory period 1 Jan. – 30 Jun. 2003, the penalty applied was 75 €/certificate in shortage. The current penalty is now fixed at 100 €/certificate in shortage for the remainder of the obligation period. The quotas applicable for the period 2003-2007 are shown in the table below. In 2005, at the proposal of the CWAPE, the government will fix the new quotas applicable from Jan. 2008, taking into account the development of the green certificates market in the Walloon region.

Project CP/23 - “Renewable Energy Evolution in Belgium 1974 - 2025”
SPSD II - Part I - Sustainable production and consumption patterns – Energy 27/140
Table 6 : Green certificates quota and penalty in the Walloon region
Year Quota Penalty 2003 3% 1st semester : € 75
2 other quarters : € 100 2004 4% € 100 2005 5% € 100 2006 6% € 100 2007 7% € 100
A new legislation has been passed by the Walloon government giving producers the option to choose for a system of fixed price guarantee for their green certificates, as an alternative to the green certificates market [AGW 6/11/03]. This option is only available for the RES aspect of the green certificates, and thus is not open to fossil co-generation installations. According to the legislation, green electricity producers from installations put into service after 30 June 2003, have the option to sell part or all of the green certificates granted to them, to the minister of Energy. Upon the request of the producer and upon the advice of the Walloon Commission for Energy (CWAPE), the minister concludes an agreement with the producer stating the duration (in months) during which the production aid is guaranteed with a maximum of 120 months, starting from the date at which the installation is put into service. The aid granted by the minister in exchange for green certificates is 65 €/certificate. The decision of the producer to opt for selling his certificates on the market or at the fixed price is taken by the electricity producer each time he submits his measuring data (on the basis of which his certificates are granted), that is, every 3 months.
Green certificates held by the Walloon region in relation to the production aid will be deleted from the certificate data bank by the CWAPE (Walloon Commission for Energy).
The mechanism has given an important market push as proven by the growth in installed capacities (see chapter 3.2.1.).
Brussels-Capital Region
On April 1st 2004, the Brussels-Capital region adopted a new legislation modifying the 2001 legislation on the organisation of the electricity market in the region [BXL 04]. The modifications provide for fixed green certificate quota obligations.
Under this new modification, suppliers in the Brussels-Capital region are required to cover a fixed percentage of their total electricity supply with green certificates, as follows:
§ 2% for 2004
§ 2.25% for 2005
§ 2.5% for 2006
The quota for subsequent years will be determined by the Brussels government on the basis of the evolution of the green electricity market and the operation of the liberalised market.
Under the established green certificates system, producers of ‘quality’ co-generation qualify for green certificates. As is already the case in the Walloon Region, it is expected that the green certif icates system in Brussels will be based on avoided CO2 emissions.
The penalties for non-compliance are fixed at €75 / missing certificate for 2004, 2005, 2006, and €100 / missing certificate for the subsequent years.
The quota for the Brussels-Capital region is significantly lower than in the 2 other Belgian regions (The Wallo0n Region, Flanders – where green certificates systems are already in operation) due to the relatively low indigenous potential for exploitation of eligible green energy in Brussels compared to its electricity requirements. Moreover, the relatively low potential of the region means that it is likely to seek agreement for green certificate trading with the other regions of Belgium, and possibly internationally.

Project CP/23 - “Renewable Energy Evolution in Belgium 1974 - 2025”
SPSD II - Part I - Sustainable production and consumption patterns – Energy 28/140
Guarantees of origin
Guarantees of origin as required by the European directive on RES-E will be used as a tool for disclosure, i.e. proving the origin of electricity supplied to consumers under the label ‘green’ or equivalent, and to avoid double counting and awarding of environmental benefits in different countries and regions.
Such guarantees of origin will allow the labelling of electricity from renewable sources dedicated to consumers (e.g. [EUG 04]).
It should be noted that the regional green certificate systems provide for such guarantees of origin and therefore satisfy the criteria of the European directive. The three regional regulators actively participate in the European Commission monitoring of the implementation of RES-E in the framework of the EC-funded project SETREC-GO. This project comprises two distinct but overlapping RE projects, SETREC and RE-GO. SETREC looks at the side effects (SE) of renewable energy certificates and aims to remove barriers for European Tradable Renewable Energy Certificates (TRECs). RE-GO deals with Guarantees of Origin (GO) for renewable energy (RE) and aims to assist Member States with GO implementation by providing essential information and a venue to share experiences [SETREC-GO 04].
Voluntary international exchange of green certificates
On international level, a system has been developed and established to allow for a harmonised European or international market for green certificates (RECS). This system is in operation in Belgium, but is only used for voluntary international exchanges of green electricity, independent of the quota-based internal markets in Belgium.
The internationally transferred certificates were sourced mainly from Austria and Scandinavian Countries and were issued on the basis of production primarily from hydro and biomass installations. As a consequence of their voluntary character, the market price of these green certificates was below 10 €/MWh and as such not giving any incentive for the investments in new installations at this moment.
Monthly RECS Certificates Issued - by Country
0
500,000
1,000,000
1,500,000
2,000,000
2,500,000
J F M A M J J A S O N D J F M A M J J A S O N D
Issue - 2002 Issue - 2003
Month
Cer
tifi
cate
s is
sued
UK & Ireland
Slovenia
PortugalPolandNetherlands
Italy
France
SpainDenmark (East)
Denmark (West)
GermanySwitzerland
Belgium and LuxembourgAustria
Sweden
NorwayFinland
Figure 5 : Monthly RECS Certificates issued – by country
Project CP/23 - “Renewable Energy Evolution in Belgium 1974 - 2025”
SPSD II - Part I - Sustainable production and consumption patterns – Energy 29/140
2.3.3 Investment subsidies and fiscal incentives
Investment subsidies
Federal
In the period before regionalisation, subsidy schemes were the responsibility of the federal government, and there were two main subsidy schemes through which renewable energy could be promoted: the law on economic expansion (1970) (for large enterprises) and the law on economic reorientation (1978) (small and medium enterprises and industries). Although the underlying objective of these schemes was to stimulate investments and employment in the private sector, and they did not actually result in federal subsidies for renewable energy, the schemes have played a major role in public investment in renewable energy in the period after regionalisation. This is because these policies provide the basis for implementation and execution of renewable energy support policies and programmes at regional levels. Programme budgets and sector distribution is decided at regional level.
The royal decree of 10 february 1983 was adopted giving a basis for investment subsidies in demonstration projects. Again, such subsidies were mainly used after 1988, in a regionalised policy on renewable energy.
Flanders
After the regionalisation Flanders has restructured the laws on economic expansion and reorientation and established a system of investment subsidies for the promotion of investments and employment in the private sector (excluding utilities), through decrees 15/12/1993 and 19/01/1994. The subsidy scheme allows for a maximum subsidy of 20% to support alternative energy sources development.
With the regionalisation the investment subsidies for demonstration projects were introduced around 1988. In 1992 the royal decree of 1983 was modified by decision of the Flemish government.These demonstration projects did not give rise to a significant market development of these new technologies. Their merit is more to be found in the establishment of a knowlegde base in industry and research community on the progress in energy technologies [VITO 04].
Walloon Region
The framework for investment subsidies in the Walloon region are the Decrees 25/06/1992, 09/07/1992 and 16/09/1993 implementing the federal laws on economic expansion (30/12/1973) and economic reorientation (04/08/1978), for the promotion of investments and employment in the private sector (utilities are excluded). In particular, the decree of 16/09/1993 is explicitly directed towards renewable energy development. Subsidies are accorded to a maximum of 15% of investment.
Renewable energy investment subsidy scheme s also exist for actions in the public sector; ECHOP and AGEBA (both to be grouped together under the scheme UREBA in 2003). Under ECHOP a subsidy of 20% is available for energy investments, including renewable energy, in schools and hospitals. Under the A GEBA programme a subsidy of 30% is available for investments for improving the energy efficiency of public buildings.
Other investment subsidies and related programmes were available for the energy in the period 1981-2000. Total budget amounted approximately 240 M€, of which 18 M€ (< 8%) was spent on renewable energy actions [DGT 80]. The total budget includes money set aside for subsidies, studies, research, development, demonstration, capacity building activities etc. In addition to renewable energy, the programme covers projects in the sectors of rational use of energy, and non-renewable energy sectors.
The SOLTHERM project was started in 2000 with the aim of turning an almost non-existent solar water heater market in the Walloon Region into a selfsupport ing economically viable market of around 9000 systems per year. The programme has developed a consistent set of action & sub-programs covering both the residential and tertiairy (large systems) market segments. The integrated approach has led to the implementation of a quality system developed in cooperation with the suppliers branche organisation, a range of training & qualification schemes (350 installers & 250 architects trained), marketing and promotion campaigns towards the general public. All of this has resulted in an increased
Project CP/23 - “Renewable Energy Evolution in Belgium 1974 - 2025”
SPSD II - Part I - Sustainable production and consumption patterns – Energy 30/140
awareness & readiness to consider solar thermal as a vaible option , and in a total solar collector sales figure increasing from less than 1500m²/yr in 2000 at the starting point of the program to nearly 5400 m² in 2003. The budgets for this program were respectively about 1 M€ for the programme components itself, and about 1.2 M€ for the system premia in the period 2000 – 2003.
Brussels Capital
As in the other regions, Brussels Capital has set up a system of investment subsidies for specific energy investments, through regional implementation of the federal laws on economic expansion and reorientation. However, due to the comparative lack of renewable energy resources in the Brussels-Capital region, these initiatives are direct ed primarily towards energy efficiency and conservation. The legal bases are provided in the Ordinance and decree of 01/07/1993 and 08/12/1994 respectively. A maximum subsidy of 20% (20% small enterprises, 10% medium and large enterprises) may be accorded to support initiatives in rational use of energy.
Other project subsidies in the energy sector were available, but no detailed historical overviews are available. The total budget allocated over the period 1991-2002 by the Brussels Capital region for actions in rational use of energy came to approximately 18.8 M€, of which roughly 14.6 M€ was actually attributed to projects. There is no indication as to the repartition of the budget for renewable energy actions, but it would be expected that this would be minimal. The total budget includes money set aside for subsidies, studies, RD&D, capacity building, overheads etc.
Fiscal incentives
The Federal government retains sole competence as far as fiscal measures are concerned.
There are four major fiscal policy initiatives affecting renewable energy and/or the rational use of energy in Belgium:
§ fiscal deductions for energy savings investments in enterprises
§ accelerated depreciation of investments for enterprises
§ tax reductions for households
§ levy exemption for bio-fuels.
These are described in further detail in Box 1 below.
Box 1 : Federal level fiscal policies in renewable energy
• Fiscal deductions for energy savings investments: The company tax code of 1992 gives preferential deduction for investments in improving energy efficiency and/or environmental impact, subject to approval of the project by the concerned regional government. The rate for 1998 fiscal year was 13.5% of the eligible investment cost. The rate is annually revised.
• Amortisation of investments: The company tax code of 1992 allows a choice between linear and regressive (accelerated) depreciation of investments. It regressive depreciation is twice the liner but cannot exceed 40%.
• Tax reductions for households: The law of 10 August 2001 provides for tax reductions for households investing in energy-savings measures. In terms of renewable energy this relates to investments for the installation of solar water heating systems, and the installation of photovoltaics for electricity generation. The tax reduction allowed is up to 15%, to a maximum amount of €600 for 2003 (or €500 indexed from 1992). In order to qualify for such tax reductions, the installations must adhere to certain specified technical characteristics.
• Additional levy on electricity and fuels (except bio-fuels): In order to finance special measures aimed at promoting employment and competitiveness of enterprises, a special levy was introduced on electricity consumption and on certain fuels, in particular for passenger vehicles. Although not specifically directed at renewable energy, bio-fuels benefit from this law in that they are exempt from the levy (however, renewable electricity is not).

Project CP/23 - “Renewable Energy Evolution in Belgium 1974 - 2025”
SPSD II - Part I - Sustainable production and consumption patterns – Energy 31/140
For most periods in time no information is availab le or not sufficiently differentiated to distinguish support to renewable energy technologies. Relatively detailed figures are however available for the period 1983 – 1989, specifically for the energy sector [SCE 90]. The fiscal incentives were to a large extent used to support rational use of energy and secondly fossil fuel installations. Biomass installations and solar systems benefited from these incentives, as did waste incineration and auxiliary technologies. It is unclear whether the fiscal incentives to promote energy efficiency and renewable energy have been evaluated in the past. Given the fact that the fiscal incentive for households has only recently been implemented sufficient data is not available to enable meaningful evaluation of such a measure.
2.3.4 RD&D policy
Programmes
The Belgian Science Policy2 conducted pluri-annual research programmes with a view to reinforcing the scientific and technical research potential in the country, where necessary, in co-operation with the regions. The programme consisted of three phases 1975-1978, 1978-1982, and 1982-1987. A number of renewable energy projects have been supported under this programme, including nine biomass projects and solar photovoltaic projects. The programme results are described in well docume nted publications [SPPS 88]. This programme was the main support programme for renewable energy in the period 1974 – 2000. In the period 1975 – 1987 the Belgian budgetary efforts in energy related R&D were significantly higher than subsequent periods, and it was the only period with a programme lifetime of more than a decade.
A new non-technical programme focussing on sustainable development was launched by the Belgian Science Policy, with a component on energy and renewable energy (Plan d'appui scientifique à une politique de développement durable (PADD) / Plan voor wetenschappelijke ondersteuning van een beleid gericht op duurzame ontwikkeling (PODO)).
The ’Service pour la conservation des energies’ [SCE 90]co-ordinates a R&D support programme within the framework of the law 10/02/83 for the promotion of the rational use of energy. Under the scheme, subsidies were accorded to two projects, one in the Walloon region (wood preparation: manufacture of fuels form wood waste) and one in the Flemish region (wood combustion: biomass power station).
Budgets
The budgets spent by national and regional programmes were reported to the IEA and published regularly, and as such are used for this study. Table 1 gives the accumulated public budget for RD&D on energy technologies in the period 1974 – 1999 in Belgium. To provide a basis for comparison, the accumulated budgets for EU15 members states are added in the same table. Renewable energy accounted for about 5.25 % of the accumulated public investments in Belgium, composed of budgets spent respectively on photovoltaics, biomass, geothermal, wind energy and solar heating and cooling. These figures compare well with the figures of the EU member states. In the case of EU15 member states, renewable energy accounted for 8.51 %.
2 the ‘Services de Programmation de la Politique scientifique’ (SPPS), later named the ‘Services fédéraux des Affaires Scientifiques, Techniques et Culturelles’ (SSTC), now called the ‘Programmatorische federale overheidsdienst Wetenschapsbeleid’ / ‘Service public fédéral de programmation Politique scientifique’)

Project CP/23 - “Renewable Energy Evolution in Belgium 1974 - 2025”
SPSD II - Part I - Sustainable production and consumption patterns – Energy 32/140
Table 7 : Accumulated public RD&D investments 1974 – 1999 Belgium and EU-15 Member States
Belgium EU-15
Total conservation 9.1% 8.3%
Total fossil fuels 7.1% 8.8%
Total nuclear fission/fusion 68.7% 65.2%
Total power & storage tech. 4.4% 2.9%
Total other tech./research 5.5% 6.3%
Total renewables 5.2% 8.5%
Solar Heating & Cooling 1.2% 1.2%
Solar Photo-Electric 1.3% 2.4%
Solar Thermal-Electric 0.3% 0.6%
Wind 0.5% 1.8%
Ocean 0.0% 0.2%
Biomass 1.2% 1.5%
Geothermal 0.6% 0.7%
Total Hydro 0.0% 0.0%
0
20
40
60
80
100
120
140
0 20 40 60 80 100 120 140
Renewable energy + Rational use of Energy RD&D (M€)
Foss
il +
Nuc
lear
RD
&D
(M
€)
1974
1999
1980
1990
Figure 6 : Trajectory of public spending on energy RD&D in Belgium split -up according to fossil and nuclear energy versus energy conservation and renewable energy, during the period 1974 – 1999.
Figure 6 shows the evolution of public spending on RD&D on energy technologies for Belgium, similar to Figure 3. A similar trend can be seen for the Belgian case, leading to similar conclusions :
§ RD&D public budgets have been very irregular and influenced strongly by the energy market situation (oil prices). In the Belgian case, the discontinuity is in particular noticeable in the late eighties when the RD&D programmes were stopped completely.

Project CP/23 - “Renewable Energy Evolution in Belgium 1974 - 2025”
SPSD II - Part I - Sustainable production and consumption patterns – Energy 33/140
§ RD&D investments have been to a very large majority concentrated on supply-based fossil and nuclear technologies, with energy conservation and renewable energy only starting to be treated in a more balanced was when the climate change issue rose on the political agenda, but in strongly reduced absolute values.

Project CP/23 - “Renewable Energy Evolution in Belgium 1974 - 2025”
SPSD II - Part I - Sustainable production and consumption patterns – Energy 34/140
2.4 Other National policies
Currently, most EU-15 member states have a supportive renewable energy policy on regional and/or national level.
A series of case studies illustrating a diversity of renewable energy policies have been selected. The case studies were selected on the basis of their relevance to the Belgian situation and to coverage of a range of sectors. Table 8 summarizes the case studies w hich have been used.
Table 8 : Case studies
Country Case Study
1. Austria Biomass district heating deployment
2. France Wood-based heating system
3. Germany PV market deployment programme
4. Germany Solar bau : energy efficiency & solar energy in commercial building sector
5. Germany Solar Na Klar Campaign
6. Germany Wind power for grid connection : the 250 MW wind programme
7. Japan PV power generation – from R&D to deployment
8. Spain Solar Ordinance Barcelona
9. Sweden Market transformation – heat pumps
10. UK Tradable green certificates market mechanism for green electricity
These case studies are described in detail in annex D using the following structure: policy objectives; design and development; actors and participants; monitoring, evaluation, and results. The reference for the majority of case studies described is [IEA 03]. Where other reference sources have been used, this is indicated in the text in the annex. No specific case study has been included for the field of offshore wind energy since an extensive overview of policies is given in a study conducted in 2002 [SHAW 02].

Project CP/23 - “Renewable Energy Evolution in Belgium 1974 - 2025”
SPSD II - Part I - Sustainable production and consumption patterns – Energy 35/140
3 Renewable Energy Production Evolution
3.1 Renewable energy production in the EU-15
3.1.1 Evolution of electricity production from renewables in EU-15
The development of the annual gross electricity consumption in the EU15 since 1996 is depicted in Figure 7. In this period the gross electricity consumption has increased with an average of 2.3% per year, up to about 2700 TWh in 2001. The electricity production from renewable energy sources has increased with an average of 5.6% per year, up to about 415 TWh in 2001.
0
500
1000
1500
2000
2500
3000
1996 1997 1998 1999 2000 2001
Cons
umed
and
pro
duce
d el
ectr
icity
(TW
h/ye
ar)
gross electricity consumption RES-E production
Figure 7 : Electricity consumption and electricity production from renewables from 1996 to 2001 in EU15
In spite of the growing electricity consumption in Europe, the renewable energy industry has been able to increase the share of renewable energy. Figure 8 shows the development of RES-E as share of the gross electricity consumption in the period 1996 – 2001. During this period the contribution from renewable electricity has grown from 13,3% to 15,5% in 2001. The reference target of 22.1% as set by the European directive on RES-E is also indicated.

Project CP/23 - “Renewable Energy Evolution in Belgium 1974 - 2025”
SPSD II - Part I - Sustainable production and consumption patterns – Energy 36/140
22.1%
15,514,8
13,814,2
13,713,3
0%
5%
10%
15%
20%
25%
1996 1997 1998 1999 2000 2001 2002 2003 2004 2005 2006 2007 2008 2009 2010
Shar
e R
ES-E
of gr
oss
elec
tric
ity c
onsu
mpt
ion
(%)
RES-E penetration RES-E target
Figure 8 : Share of electricity from renewable energy sources of the electricity consumption from 1996 – 2001 in EU15
Figure 9 shows the progress of each individual Member State towards its national indicative target, based on the penetration of renewable energy sources in 2001. Remarkable developments since then are the strong increase in the share of renewable electricity in the UK (currently at about 3.5%).
20,1%
5,12,4
53,3
22,134,5
3,03,1
17,0
8,7
16,3
25,417,2
1,1
71,4
15,5
6,813,2
10,0
60,0
29,4
39,0
9,05,7
25,0
12,5
21,0
31,529,0
6,0
78,1
21,6
0%
10%
20%
30%
40%
50%
60%
70%
80%
90%
100%
EU AT BE DK FI FR DE GR IE IT LU NL PT ES SE UK
Shar
e R
ES-E
of
gros
s el
ectr
icity
con
sum
ptio
n (%
)
RES-E penetration 2001 RES-E target 2010
Figure 9 : RES-E penetration in 2001 versus indicative targets 2010 in EU15
The development of the electricity production from renewable energy sources in the EU15 countries during the last decade is depicted in Figure 10. The applied definition of renewable energy sources is the one stated in the European directive on RES-E. Electricity production from RES has increased from 287 TWh in 1990 to 415 TWh in 2001. It can be clearly seen that traditionally large scale and small

Project CP/23 - “Renewable Energy Evolution in Belgium 1974 - 2025”
SPSD II - Part I - Sustainable production and consumption patterns – Energy 37/140
scale hydro power are by far the most important RES-E sources. However, the share of hydro power of the total RES-E generation in the EU-15 countries has decreased from 94% in 1990 to 84% in 2001. This is due to the fact that nearly all environmentally sustainable potential of large-scale hydro power in Europe has been exploited. Recent years show an important increase from biomass and wind energy. In the period from 1990 to 2001, electricity production from RES sources other than hydro power increased by a factor 4, to 68 TWh in 2001.
0
50
100
150
200
250
300
350
400
1990 1991 1992 1993 1994 1995 1996 1997 1998 1999 2000 2001
Elec
tric
ity g
ener
atio
n (T
Wh/
year
)
Large-scale hydro Small-scale hydro other RES-E (excl. hydro)
Figure 10 : Electricity production from RES in EU15 from 1990 to 2001
A more detailed view on the development of electricity generation from RES-E sources other than hydro power is provided in Figure 11. A breakdown of the relative contribution of the different renewable energy sources to the RES-E production in the years 1990 and 2001 is depicted in Figure 12.
0
10
20
30
40
50
60
70
1990 1991 1992 1993 1994 1995 1996 1997 1998 1999 2000 2001
Elec
tric
ity g
ener
atio
n (T
Wh/
year
)
On-shore Wind Off-shore wind Biomass (excl. MSW) Organic fraction of MSWBiogas Geothermal electricity Photovoltaics
Figure 11 : Electricity production from RES (excluding hydro power) in the EU-15 from 1990 to 2001

Project CP/23 - “Renewable Energy Evolution in Belgium 1974 - 2025”
SPSD II - Part I - Sustainable production and consumption patterns – Energy 38/140
1990
0.3% 1.1%
85.9%
7.8%
2.9%1.7%
0.2%
Large-scale hydro Small-scale hydro Onshore windOffshore wind Biomass (excl. MSW) Organic fraction of MSWBiogas Geothermal Photovoltaics
2001
6,6%
1,1%
1,8%3,4%
3,3%
9,7%
73,9%
Figure 12 : Contribution to RES-E production in 1990 and 2001 in EU15
Hydro power
In 2001 the electricity production from hydro power accounted for 347 TWh. Although during the last decade the annual electricity production from hydro power increased from 269 TWh in 1990 to 347 TWh in 2001, its relative contribution decreased from 94% to 84% in 2001.
Wind Energy
Next to hydro power, the most important RES-E source is wind power. At the end of 2003, the installed wind power capacity was 28 440 MW, accounting for 60 TWh production in 2003. Onshore wind is the fastest growing RES-E source in the EU15. In 2003, the installed wind power capacity increased with 23%. Offshore wind power generation is still very small compared to onshore wind, but the first steps for higher RES-E contributions have been taken. In 2001, the production from offshore wind was 0.3 TWh.
Biomass
The term biomass comprises solid and liquid biomass, the organic fraction of MSW and biogas. The currently most -used sources of biogas are landfill gas and sewage gas. Combined electricity production from these sources reached 36 TWh in 2001, corresponding to 9% of the RES-E production. From 1990 to 2001, the relative contributions of the organic fraction of MSW and biogas in particular, towards the overall RES-E generation have increased, whereas the relative contribution of the RES-E production from solid biomass to the RES-E generation increased as well, but to a lesser extent.
Geothermal
Geothermal electricity production has increased slowly in the last decade from 3.3 TWh to 4.6 TWh in 2001. This led to the fact that the contribution to the overall RES-E production has remained stable at around 1% during these years.
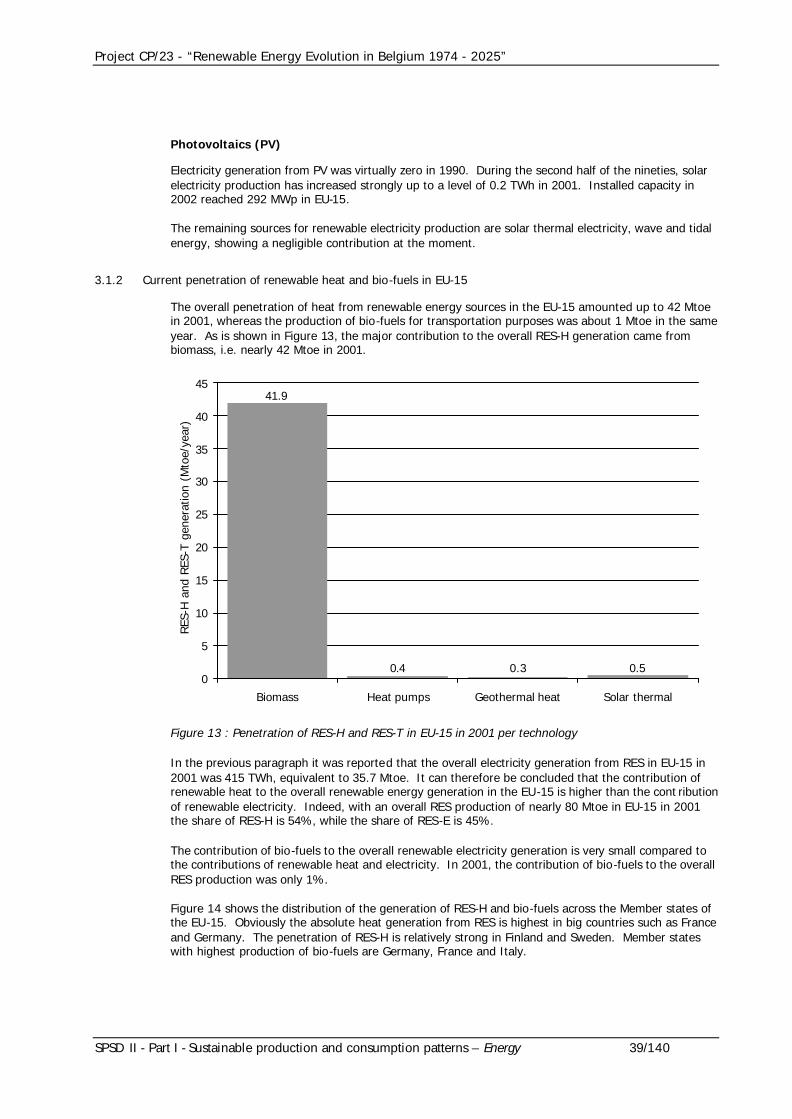
Project CP/23 - “Renewable Energy Evolution in Belgium 1974 - 2025”
SPSD II - Part I - Sustainable production and consumption patterns – Energy 39/140
Photovoltaics (PV)
Electricity generation from PV was virtually zero in 1990. During the second half of the nineties, solar electricity production has increased strongly up to a level of 0.2 TWh in 2001. Installed capacity in 2002 reached 292 MWp in EU-15.
The remaining sources for renewable electricity production are solar thermal electricity, wave and tidal energy, showing a negligible contribution at the moment.
3.1.2 Current penetration of renewable heat and bio-fuels in EU-15
The overall penetration of heat from renewable energy sources in the EU-15 amounted up to 42 Mtoe in 2001, whereas the production of bio-fuels for transportation purposes was about 1 Mtoe in the same year. As is shown in Figure 13, the major contribution to the overall RES-H generation came from biomass, i.e. nearly 42 Mtoe in 2001.
0.4 0.3 0.5
41.9
0
5
10
15
20
25
30
35
40
45
Biomass Heat pumps Geothermal heat Solar thermal
RES
-H a
nd R
ES-T
gen
erat
ion
(Mto
e/ye
ar)
Figure 13 : Penetration of RES-H and RES-T in EU-15 in 2001 per technology
In the previous paragraph it was reported that the overall electricity generation from RES in EU-15 in 2001 was 415 TWh, equivalent to 35.7 Mtoe. It can therefore be concluded that the contribution of renewable heat to the overall renewable energy generation in the EU-15 is higher than the cont ribution of renewable electricity. Indeed, with an overall RES production of nearly 80 Mtoe in EU-15 in 2001 the share of RES-H is 54%, while the share of RES-E is 45%.
The contribution of bio-fuels to the overall renewable electricity generation is very small compared to the contributions of renewable heat and electricity. In 2001, the contribution of bio-fuels to the overall RES production was only 1%.
Figure 14 shows the distribution of the generation of RES-H and bio-fuels across the Member states of the EU-15. Obviously the absolute heat generation from RES is highest in big countries such as France and Germany. The penetration of RES-H is relatively strong in Finland and Sweden. Member states with highest production of bio-fuels are Germany, France and Italy.

Project CP/23 - “Renewable Energy Evolution in Belgium 1974 - 2025”
SPSD II - Part I - Sustainable production and consumption patterns – Energy 40/140
0
1
2
3
4
5
6
7
8
9
10
11
AT BE
DK FI FR DE
GR IE IT LU NL
PT ES SE UK
RES
-H a
nd R
ES-T
gene
ratio
n (M
toe/
year
)
Penetration 2001 - RES-H Penetration 2001 - RES-T
Figure 14 : Penetration of RES-H and RES-E in EU-15 in 2001 by Member State
3.2 Renewable energy production in Belgium
3.2.1 Evolution of electricity production from renewables in Belgium
The development of the annual gross electricity consumption in Belgium since 1996 is depicted in Figure 15. In this period the gross electricity consumption has increased with an average of 2.4% per year, up to about 79.8 TWh in 2001. The electricity production from renewable energy sources (included large-scale hydro power) has increased with an average of 12% per year, from 538 GWh up to about 949 GWh in 2001 (with an average of 14% per year from 438 GWh up to about 804 GWh if large-scale hydro power is excluded).
0
10
20
30
40
50
60
70
80
90
1996 1997 1998 1999 2000 2001
Con
sum
ed a
nd p
rodu
ced
elec
tric
ity (
GW
h)
RES-E Production Belgium Gross electricity consumption Belgium
Figure 15 : Electricity consumption and electricity production from renewables in Belgium from 1996 to 2001

Project CP/23 - “Renewable Energy Evolution in Belgium 1974 - 2025”
SPSD II - Part I - Sustainable production and consumption patterns – Energy 41/140
Figure 16 shows the development of RES-E as share of the gross electricity consumption in the period 1990 – 2001. During this period the contribution from renewable electricity (excluding large-scale hydro power) has grown from 0.7% to 1.0% in 2001. The reference target of 6% as set by the European directive on RES-E is also indicated. If large-scale hydro power is included in RES-E, then the contribution from renewable electricity has grown from 1 % in 1990 to 1.2% in 2001.
1.11.10.90.80.81.0 1.0
0.9 0.9
1.2
0.90.80.7
0.9
0.60.70.60.60.60.7 0.7
1.00.9
0.6
6
0%
1%
2%
3%
4%
5%
6%
7%
1990 1992 1994 1996 1998 2000 2002 2004 2006 2008 2010
Shar
e of
RES
-E o
f gr
oss
elec
tric
ity c
onsu
mpt
ion
(%)
RES-E penetration Belgium (incl. large-scale hydro)RES-E penetration Belgium (excl. large-scale hydro)RES-E target 2010 for Belgium
Figure 16 : Share of electricity from renewable energy sources of the electricity consumption from 1996 – 2001 in Belgium
The development of the electricity production from renewable energy sources in Belgium during the last decade is depicted in Figure 17. The applied definition of renewable energy sources is the one stated in the European directive on RES-E. Electricity production from RES has increased from 602 GWh in 1990 to 949 GWh in 2001. In the period from 1990 to 2001, electricity production from RES sources other than hydro power increased from 278 GWh in 1990 to 614 GWh in 2001.
0
200
400
600
800
1000
1200
1400
1990 1991 1992 1993 1994 1995 1996 1997 1998 1999 2000 2001
Elec
tric
ity g
ener
atio
n [G
Wh/
year
]
Large-scale hydro Small-scale hydro Other RES-E (excl. hydro)
Figure 17 : Electricity production from RES in Belgium from 1990 to 2001

Project CP/23 - “Renewable Energy Evolution in Belgium 1974 - 2025”
SPSD II - Part I - Sustainable production and consumption patterns – Energy 42/140
A more detailed view on the development of electricity generation from RES-E sources other than hydro power is provided by Figure 18. A breakdown of the relative contribution of the different renewable energy sources to the RES-E production in the years 1990 and 2001 is depicted in Figure 19.
0
100
200
300
400
500
600
700
1990 1991 1992 1993 1994 1995 1996 1997 1998 1999 2000 2001
Elec
tric
ity g
ener
atio
n [G
Wh/
year
]
Biogas Biomass (excl. MSW) Organic fraction of MSW Photovoltaics Wind onshore
Figure 18 : Electricity production from RES (excluding hydro power) in Belgium from 1990 to 2001
1990
31%
23%1%
22%
22%
0% 0%
Large-scale hydro Small-scale hydro Onshore windBiomass (excl. MSW) Organic fraction of MSW BiogasPhotovoltaics
15%
20%
6%
18%
11% 0%
2001
30%
Figure 19 : Contribution to RES-E production in 1990 and 2001 in Belgium
Hydro power
In 2001 the electricity production from hydro power accounted for 335 GWh.(146 GWh large-scale and 190 GWh small-scale hydro power) During the last decade the annual electricity production from hydro
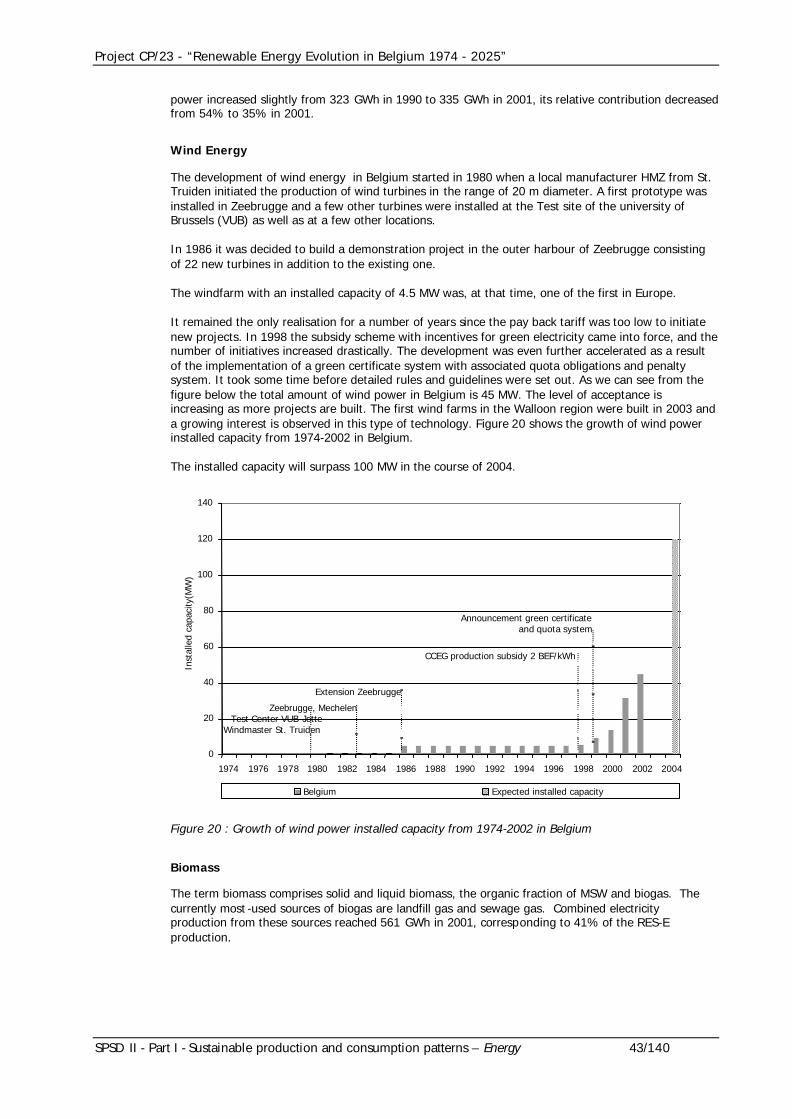
Project CP/23 - “Renewable Energy Evolution in Belgium 1974 - 2025”
SPSD II - Part I - Sustainable production and consumption patterns – Energy 43/140
power increased slightly from 323 GWh in 1990 to 335 GWh in 2001, its relative contribution decreased from 54% to 35% in 2001.
Wind Energy
The development of wind energy in Belgium started in 1980 when a local manufacturer HMZ from St. Truiden initiated the production of wind turbines in the range of 20 m diameter. A first prototype was installed in Zeebrugge and a few other turbines were installed at the Test site of the university of Brussels (VUB) as well as at a few other locations.
In 1986 it was decided to build a demonstration project in the outer harbour of Zeebrugge consisting of 22 new turbines in addition to the existing one.
The windfarm with an installed capacity of 4.5 MW was, at that time, one of the first in Europe.
It remained the only realisation for a number of years since the pay back tariff was too low to initiate new projects. In 1998 the subsidy scheme with incentives for green electricity came into force, and the number of initiatives increased drastically. The development was even further accelerated as a result of the implementation of a green certificate system with associated quota obligations and penalty system. It took some time before detailed rules and guidelines were set out. As we can see from the figure below the total amount of wind power in Belgium is 45 MW. The level of acceptance is increasing as more projects are built. The first wind farms in the Walloon region were built in 2003 and a growing interest is observed in this type of technology. Figure 20 shows the growth of wind power installed capacity from 1974-2002 in Belgium.
The installed capacity will surpass 100 MW in the course of 2004.
Announcement green certificateand quota system
0
20
40
60
80
100
120
140
1974 1976 1978 1980 1982 1984 1986 1988 1990 1992 1994 1996 1998 2000 2002 2004
Inst
alle
d ca
paci
ty(M
W)
Belgium Expected installed capacity
CCEG production subsidy 2 BEF/kWh
Extension Zeebrugge
Zeebrugge, Mechelen Test Center VUB Jette Windmaster St. Truiden
Figure 20 : Growth of wind power installed capacity from 1974-2002 in Belgium
Biomass
The term biomass comprises solid and liquid biomass, the organic fraction of MSW and biogas. The currently most -used sources of biogas are landfill gas and sewage gas. Combined electricity production from these sources reached 561 GWh in 2001, corresponding to 41% of the RES-E production.

Project CP/23 - “Renewable Energy Evolution in Belgium 1974 - 2025”
SPSD II - Part I - Sustainable production and consumption patterns – Energy 44/140
Photovoltaics (PV)
Photovoltaics have shown a slow development in the period 1974 – 1990, basically due to a limited market composed of off-grid commercial applications and a limited number of demonstration project s. The break-through in market development, and associated technological progress and cost reduction, has come thanks to the cost-covering tariff paid to PV electricity in Germany. This policy initiative started locally but extended quickly and was finally adopted on federal level. Similar policy concepts have been implemented in the meantime in Luxembourg, Switzerland and Spain.
Up to 1980, the implementation of photovoltaics in Belgium was limited to stand-alone systems, after which the first grid connected system was realised in Wevelgem. No private nor public investments followed this first initiative until mid 90’s. A series of new demonstration projects were initiated (Oostmalle, IMEC, Melle). The PV School programme, and the subsidy programme of the Flemish Community, combined with private subsidies (Electrabel, SPE) were the basis for a continued growth of installed capacity. Figure 21 shows the growth of photovoltaic installed capacity from 1974-2003 in Belgium.
0
100
200
300
400
500
600
700
800
900
1000
1974 1976 1978 1980 1982 1984 1986 1988 1990 1992 1994 1996 1998 2000 2002
Inst
alle
d ca
paci
ty (
kWp)
Stand-alone systems
WevelgemIMEC, Oostmalle, Melle
PV Schools ProjectFlemish PV Program
Figure 21 : Growth of photovoltaic installed capacity from 1974-2003 in Belgium
3.2.2 Current penetration of renewable heat and bio-fuels in Belgium
The overall penetration of heat from renewable energy sources in Belgium amounted up to 391 ktoe in 2001, whereas the production of bio-fuels for transportation purposes was nil in the same year. As is shown in Figure 22, the major contribution to the overall RES-H generation came from biomass, i.e. 384 ktoe in 2001. Although solar thermal contribute only for 1 ktoe to the overall RES-H in 1990, the installed surface increased with an average of 18% per year in the period 1997-2001. The growth of solar thermal installed surface from 1997-2003 in Belgium is shown in Figure 23. The growth is mainly due to the Soltherm Campaign in the Walloon region (see § 2.3.3 – Walloon Region).

Project CP/23 - “Renewable Energy Evolution in Belgium 1974 - 2025”
SPSD II - Part I - Sustainable production and consumption patterns – Energy 45/140
3 3 1
384
0
50
100
150
200
250
300
350
400
450
Biomass Heat pumps Geothermal heat Solar thermal
RES
-H a
nd R
ES-T
gen
erat
ion
(kto
e/ye
ar)
Figure 22 : Penetration of RES-H and RES-T in Belgium in 2001 per technology
0
10
20
30
40
50
60
1997 1998 1999 2000 2001 2002 2003
Inst
alle
d su
rfac
e (1
000
m²)
Figure 23 : Growth of solar thermal installed surface from 1974-2001 in Belgium

Project CP/23 - “Renewable Energy Evolution in Belgium 1974 - 2025”
SPSD II - Part I - Sustainable production and consumption patterns – Energy 46/140
Project CP/23 - “Renewable Energy Evolution in Belgium 1974 - 2025”
SPSD II - Part I - Sustainable production and consumption patterns – Energy 47/140
4 Renewable Energy Technology Evolution
4.1 Overview
The most obvious way of biomass utilisation - the combustion of organic material - has been known for milennia. Wind, solar and hydro power were first applied in the agricultural societies of the ancient world. With the abundant availability of fossil fuels in the age of industrialisation these energy sources fell into oblivion. With the exception of large-scale hydro power, the power densities of these energy carriers appeared to be ridiculously low in comparison to those of hard coal, crude oil, natural gas or nuclear fuel.
The dependency of the industrialised world on fuel import and the finiteness of these resources were generally recognised only after the first oil crisis in 1973, reinforced by emerging environmental awareness. This triggered publicly financed R&D on new conversion technologies for renewable energies in most industrialised countries, leading to new exploration of these forms of energy.
The subsequent shift from the research stage of a conversion technology to demonstration and finally market introduction of the new technology can be well observed with wind energy and photovoltaics. Experience curves of these technologies illustrate the effect of learning on production costs. Cost reduction by learning with increased cumulative production is a consequence of technological breakthrough on the one hand and of upscaling of unit sizes and production processes on the other hand.
In the field of biomass conversion and solar thermal energy, such learning effects are less obvious. For biomass conversion, the reason is the large variety of different biomass conversion technologies ranging from direct combustion to the extraction of liquid fuels. Most technologies for biomass conversion have been demonstrated in practice, however, aside from modern biomass combustion systems, these systems are not yet traded on a mass market.
The technological progress in solar thermal systems is less dynamic than in other domains of renewable energy. Solar thermal systems are available on the market in large variety and the systems are largely developed. Since the introduction of solar thermal systems, prices have dropped significantly. Unlike in photovoltaics, where trade occurs on a world market level, the markets for solar thermal equipment are to a larger extent national or European.
Comprehensive studies on the impact of technological learning on production costs have therefore not yet been published.
Modern hydro power has been around since the beginning of the 20 th century and the technology is mature, for large hydro power stations as well as for small-scale systems [EUR 02], [ PEN 98].
The present chapter provides an overview on the technical evolution of the different renewable energy conversion systems. The focus lies on biomass conversion, wind energy and photovoltaics. The technological development of solar thermal technology has been concluded in brief and mainly from a Belgian point of view. The overview is of course far from being complete, but covers the essential trends in historical developments and the position of Belgium in these developments.
4.2 Biomass conversion technologies
Biomass conversion systems can be classified as thermochemical conversion, biochemical conversion and extraction systems according to the process principles. They all have the function of converting a biomass fuel into another energy carrier which is either directly used or stored and possibly transported.
Biomass fuels exist under various forms ranging from wet (animal manure) to dry products (wood). They can be derived from natural (short rotation coppice) or human processes (municipal solid waste).

Project CP/23 - “Renewable Energy Evolution in Belgium 1974 - 2025”
SPSD II - Part I - Sustainable production and consumption patterns – Energy 48/140
Different resources are more or less suitable for different conversion processes: typically dry fuels are converted by thermochemical conversion systems and wet resources by biochemical ones. Extraction conversion systems are more generally applied for the production of bio-fuel for transportation.
The final energy carrier of biomass conversion can be electricity, heat, gas, steam, bio-diesel, ethanol, or methanol.
The evolution of biomass conversion technology is described by considering separately the evolution of each of the conversion technologies – thermochemical conversion, biochemical conversion, and extraction.
Before the 1970s
Thermochemical conversion
Traditional thermochemical conversion systems are combustion systems, such as woodstoves, wood boilers and wood power plants. New thermochemical conversion systems apply other kind of processes, namely, gasification, co-combustion, or pyrolysis. From the process point of view, combustion is characterized by excess of oxygen, gasification by lack of oxygen and pyrolysis by absence of oxygen.
While co-combustion techniques and pyrolysis have only been recently developed, the gasification process has been known since 1780. In the field of large-scale gasification the German company Lurgi has been the main player since 1922.
Small coal and biomass gasification systems were developed during World War I. Their energy output has been used to move vehicles, trains and electric engines. During World War II, around 1 million gasification units were used for transportation.
Biochemical conversion
Anaerobic digestion is a biochemical conversion process for the production of methane gas. It was already known in the 17th century (Volta). At the end of the 18th century, digestion was described as a way to reduce the volume of waste.
During World War II, anaerobic digestion became highly attractive due to a lack of local energy resources. Home -made installations began to spread throughout Europe. In the 1950s the interest in anaerobic digestion decreased due to the availability of low -cost fossil energy resources.
Extraction
Extraction systems were extensively used at the beginning of the 20th century. When Rudolf Diesel designed his prototype diesel engine, he ran it on peanut oil. He envisioned that diesel engines would operate on a variety of vegetable oils.
When Henry Ford first designed his Model T automobile in 1908, he expected ethanol, made from renewable resources, to be the major fuel used. From 1920 to 1924, the Standard Oil Company marketed in its gasoline a 25%-fraction of ethanol but high corn prices combined with storage and transportation difficulties terminated the project. Subsequent efforts to revive an ethanol fuel programme in the US failed. Meanwhile this fuel reached a peak in France in 1936 when more than 4 million hectolitres were consumed.
After World War II bio-fuels were superseded by cheap and abundant petrol.
Since the 1970
Thermochemical conversion
Traditional combustion systems have made rapid progress in many areas of wood burning technology, for example, secondary air, intelligent control, etc. VITO optimised with respect to efficiency and emissions combustion technology for untreated and treated waste wood in co-operation with Vyncke.

Project CP/23 - “Renewable Energy Evolution in Belgium 1974 - 2025”
SPSD II - Part I - Sustainable production and consumption patterns – Energy 49/140
In the early 1980s the Circulating Fluidized-bed (CFB) gasification technology was developed for large-scale gasification under atmospheric pressure by the US company Foster Wheeler. The aim was to reduce the dependence on fossil fuels in the pulp and paper industry. In 1983, the first commercial CFB gasifier was installed by Foster Wheeler in Pietarsaari, Finland. Between 1983 and 1986, four of such CFB gasifiers were installed in Finland, Sweden and Portugal.
Between 82 and 86, nine updraft Fixed-bed gasifiers were coupled to district heating boilers in Finland. The 5 MW th-units were produced by the company Bioneer.
Since 88, some companies showed interest for BIGCC (Biomass Integrated Gazification Combined Cycle - pressurized Fluidized bed gasifier + gas turbine + steam cycle). Two demonstration BIGCC plants were built in the 1990s in Sweden and UK in the framework of the European ARBRE project.
In Belgium, small-scale gasification projects for application in developing countries have already been developed for more than 25 years by ULB and UCL. Those competencies allowed the creation of a spin-off company from the UCL in 2001. The first large-scale gasification plant in Belgium was a gasifier coupled to a co-combustion coal/biomass power plant started by Electrabel in 2001 (Ruien).
A 500 kWe externally fired gas turbine gasification plant has been constructed and succesfully operated on the VUB campus in Brussels in the period 1994-2001. Wood pellets were gasified in a bubbling fluidized bed gasifier, and the product gas burnt in the exhaust of the gas turbine. The resulting heat is recovered in the gas turbine through a metallic 800°C air heater. Heat and power was produced for the University campus.
First rersearch for the co-combustion of bio-fuels was done in 1992 in the US. This combustion technique has rapidly been introduced in the pulp and paper industry. It can yield immediate results for greenhouse gas mitigation at low investment costs.
In 2000, Electrabel Nederland and EPON co-fired 3% of coal/wood waste at the Gelderland Power Plant in the Netherlands.
Pyrolysis has been explored since the early 1980s. A number of pilot installations were started up in France and Germany in the 1990s. Large-scale industrial pyrolysis plants are not yet in operation.
Biochemical conversion
New systems for anaerobic digestion started to be developed throughout Europe after the first oil crisis in 1973. The process was then also applied to sewage sludge and for water treatment. In Belgium, the first applications started at the beginning of the 1980s.
In 1980, the DRANCO process was developed at the university of Gent. This process is especially suitable for the anaerobic digestion of biomass containing a high percentage of dry matter such as municipal solid waste (MSW). At the same time a concurrent process was developed in France (VALORGA). In 1988 the first commercial DRANCO process unit was sold. Multiple DRANCO process units in Europe were started in 1999 by the Belgian company Organic Waste systems. The energetic valorization of biogas in new cogeneration technologies is investigated at VITO using 2 microturbines of 30 kWe.
Finally, demonstration projects for recuperation of landfill gas, also is a product of anaerobic digestion, were started in more than half of the European countries. Here, the main driving force was not energy recovery but the hazard of explosions. In Belgium, 4 experiments to recover landfill gas were started up in 1991. 2 plants PBE (Pellenbergh) and IGEMO (Lier) were monitored extensively by VITO in the framework of the promotion of energy efficient technologies in the Flemish Region.
Extraction
The oil shock of 1973 also opened new perspectives for bio-fuels. In Europe, the legislative framework which regulates bio-fuel production has significantly evolved, in particular during the past ten years. At the beginning of the 1990s, the European common agricultural policy had limited non-food crops to fallow land. At that time, bio-fuel production was seen as an excellent solution for making use of lands left in fallow.
Project CP/23 - “Renewable Energy Evolution in Belgium 1974 - 2025”
SPSD II - Part I - Sustainable production and consumption patterns – Energy 50/140
The two main bio-fuels used in Europe are bio-diesel based on rapeseed oil and ETBE (ethyl tertiary butyl ether), a mix of isobuylene and ethanol, which, in Europe, is typically distilled from beets and wheat. As a consequence of the European bio-fuel directive, the use of bio-fuel in the European Union is expected to increase considerably in the future. The directive aims at 2% of fuels for transportation from bio-fuels by the end of 2005 and 5.75% by 2010.
Milestones in the evolution of biomass conversion are listed in for thermochemical and biochemical conversion as well as for extraction systems.
VITO co-ordinated demonstration projects on the use of bio-diesel in daily use vehicles with 5 cars using 100% RME (Rapeseed Methyl Ester) and trucks on used vegetable oil methyl ester in 1998. VITO developed a method to synthezise bio-diesel from vegetable oils using supercritical methanol.

Project CP/23 - “Renewable Energy Evolution in Belgium 1974 - 2025”
SPSD II - Part I - Sustainable production and consumption patterns – Energy 51/140
Table 9 : Technology milestones in development of biomass conversion internationally and in Belgium
THERMOCHEMICAL CONVERSION, BIOCHEMICAL CONVERSION and EXTRACTION
International Belgium1976
19771978
1979 Demonstration of landfill gas recuperation; ethanol-gasoline blends reintroduced in US market
1980 Foster Wheeler's Circulating fluidized bed gasification for the pulp and paper industry; Demonstration Flash Pyrolysis
Demonstration gasification of papyrus in Rwanda; Lambiotte (carbonisation); Experimental R&D on anaerobic digestion (DRANCO)
1981 Introduction of digestors in agricultaral sector1982
1983 First Foster Wheeler CFB gasifier (atmospheric) coupled to steam cycle
…1988 VITO biofuel extraction
19891990
19911992 R&D co-firing biofuels in US; take-off of biofuel
extraction in FranceExperiments with biodiesel in buses [TEC, GIDEOL -Ministère RW – DGTR]
1993
1994 Biodiesel in schoolbus [Philippeville, 1995]; Construction of a small bio-diesel pilote production based on vegetable oil, Feschaux, GIDEOL project 1994-1996 ; VUB Gasifier Operational
1995
1996 VUB gasifier operational1997
1998 VITO Biodiesl demonstration
1999 Centrale de Varnamo: pressurized Fluidized bed gasificier + turbine + steam cycle: BIGCC large scale
Start of REGAL (small scale gasification UCL, Electrabel)
2000 Technical breakthrough pyrolysis allowed for high liquid yields with auger system [ENCON].
2001 XYLOWATT sa established ; VUB full plant operational
2002
2003 Expected take-off in EU driven by biofuel directive Co-combustion with gasifier Wood-Coal Ruien (Electrabel)
Demonstration digestor of 75m3 [Switzerland -Steiner / Monterhod]; Launch of ETBE-policy in Brasil
Renewable Oil International starts 500 lb/hr demonstration plant pyrolysis; extraction of biofuels in France, Germany
4.3 Wind energy
Before the 1970s
From the end of the 19 th century, several ideas and concepts were developed for wind powered electricity generation, both small and large scale. The first breakthrough was made by Poul la Cour in Denmark who introduced electricity generating wind turbines and contributed to the physical theory. In the twenties Betz developed the axial impulse theory, the basic law for energy extraction from the wind. Significant industrial manufacturing of wind turbines before the 1970s was only seen in the area of small stand-alone wind turbines (100 W to approximately 10 kW). In Denmark the ancestor of the ‘Danish concept’ was developed in the 1950s (200 kW Gedser turbine, 3 bladed stall regulated). Another pioneer in the fifties was professor Ulrich Hütter in Germany, who applied modern aerodynamic principles to wind energy and built several prototypes (mostly 2 bladed, variable speed,

Project CP/23 - “Renewable Energy Evolution in Belgium 1974 - 2025”
SPSD II - Part I - Sustainable production and consumption patterns – Energy 52/140
pitch controlled). Summarizing this period, one could state that many promising ideas and concepts were introduced, but the development was halted because wind generated electricity could not compete economically with fossil fuel generated electricity.
1970s
This period was characterised by the sudden awareness of environmental problems and subsequent political pressure to initiate and finance research into cleaner energy technologies. In the early 1970s the DOE (Department of Energy) in the US initiated a programme for the development of large wind energy converters and several prototypes ranging from 100 kW (38 m diameter Mod 0) to 3.2 MW (98 m diameter Mod 5B) were built and tested. The vertical axis concept (Darrieus turbine) was intensively investigated from 1973 in Canada, and later on in the USA (Sandia Laboratories), resulting in MW size prototypes and commercial production in the US from the 1980s onwards. In addition, in the UK, a development of vertical axis technology was initiated (straight bladed, H-rotor concept). In Germany wind R&D resources were used for the design and construction of the two-bladed 3 MW Growian, 100 m diameter. Flexible rotor concepts were developed and tested (Rocky Flats) in the USA, mainly for small-scale applications.
1980 - 1985
Several European countries initiated R&D programmes and focused on the development of large wind turbines. An extensive comparative measurement programme was carried out in DK on two 60 m turbines (Nibe A and B) for development of know -how and design methods. In the Netherlands a research wind turbine (25 mHAT) was built by ECN and generated a lot of know -how. MW size prototypes were built in Sweden, Denmark, Netherlands, Germany, Spain, Italy, and the United Kingdom. The concepts for large scale (up to 3 MW in Sweden and Germany) tended to be two-bladed (except in Denmark). At the same time – at the smaller end of the spectrum, in the 100 kW range - technically/scientifically supported by their National Laboratory Risoe, the Danish concept (3-bladed, stall regulated) was further developed and relatively large series were manufactured for the booming market in California. Successful structural and aerodynamic solutions were developed for rotor blade technology, and composite materials (GRP and wood-epoxy) emerged as winning materials. The electrical systems are almost exclusively based on constant speed, asynchronous generators. Vertical axis technology was further investigated in North America (USA and Canada) as well as in the Netherlands (Darrieus, without guy wires) and the UK (straight bladed). In the area of resource mapping – essential for successful siting and planning of wind power plants – efforts resulted in the development of a European Wind Atlas and methods for wind modelling in complex terrain.
1985 – 1990
As a result of improved products, the commercial markets for wind turbines started opening slowly in Europe, but the fastest growth was still seen in Denmark. As a result of international co-operation, uniform test methods, safety and loads criteria and certification systems were developed, ruling out the initial variety in design methods and criteria. International R&D programmes supported the development and validation of advanced aero-elastic design codes, validated by field tests on wind turbines. The average rotor diameter of commercial wind turbines increased up to 25 m (Figure 24). The European R&D programme WEGA gave an additional impetus to the development of large-scale wind turbines. The two-bladed concept was still dominating in this segment, and even one-bladed prototypes were built. In Canada a 4 MW vertical axis machine (Eole) was built, but in Europe the vertical axis technology disappeared from the scene.
1990 – 1995
The three-bladed concept kept on winning terrain and growing in size (Figure 24). Two-bladed concepts became more and more an exception, mainly because of increasing public resistance to ‘visual pollution’. The application of blade pitch control became more and more successful, in parallel with the further upscaling of stall controlled rotors beyond 50 meter diameter. Improvement of blade form designs were realized with respect to increased aerodynamic efficiency, better controlled structural behaviour and reduced acoustic noise emission, resulting in cheaper, more efficient and more silent rotors. Implementation of the grid feed-in law resulted in the opening of a booming market in Germany. The direct drive concept was successfully developed and introduced in Germany by Enercon. In Europe and India, large wind farms were making their entry, whereas in the USA the large wind turbine manufacturer/developer Kenetech went bankrupt, and the development of the market

Project CP/23 - “Renewable Energy Evolution in Belgium 1974 - 2025”
SPSD II - Part I - Sustainable production and consumption patterns – Energy 53/140
temporarily stagnated. Advanced European designs (variable speed) were not welcome on the US market because of patent violation.
The first small-scale offshore wind farms were built in Denmark, Sweden and the Netherlands.
1995 – 2000
Improved experience and know -how (aspects such as aero-elastics, materials, control strategies, electrical conversion systems) enabled the large manufacturers to take the large wind turbines out of the R&D domain into the commercial domain. Controlled rotor blade flexibility and improved control strategies allowed increasing of size, and limitation of the loads with increasing cost effectiveness. There was a strong development towards variable speed technology based on massive introduction of power electronics. The doubly fed asynchronous generator became the successor of the simple induction generator. Improved electrical systems showed a better grid compatibility. The two-bladed rotor concepts almost disappeared. The market of the direct drive concept grew very fast in Germany and one also saw further development of this concept in The Netherlands and in France.
In this period the 500+ kW scale technology (45 – 50 m diameter) largely dominated the market, both in pitch regulated and stall-regulated versions. There was a strong enhancement of the knowledge on gearbox design forced by massive failures. A new development was the massive introduction of wind turbine types for low wind regimes (relative large rotors, high towers), as a result of the continuing booming market in Germany, spreading to inland areas. In the area of wind farm design, resource mapping tools and software were developed, supported by improved understanding of meteorology and of wake effects of wind turbines. Growing attention was given to offshore, and more small-scale offshore demonstration projects were built. Forecasting methods were developed, allowing the prediction of the power output of wind power plants a few days ahead, and t hus enabling producers and TSOs to better exploit the wind power flow in the system.
0
20
40
60
80
100
120
1985 1990 1995 2000 2005
Rot
or D
iam
eter
(m
)
0
1
2
3
4
5
6
Uni
t Po
wer
Siz
e (M
W)
Rotor Diameter
Unit Power
Figure 24 : Unit power size and diameter of wind turbine at the moment of market introduction
2000 – 2004
This period sees massive implementation of MW size wind turbines onshore, the market share of MW+ machines becoming larger than 50 %. The largest prototype is introduced in 2002: 119 m diameter, 4.5 MW. The period is characterized by further upscaling of the wind turbines without significant technical changes, and striking technological breakthroughs (Figure 24). Variable speed operation,
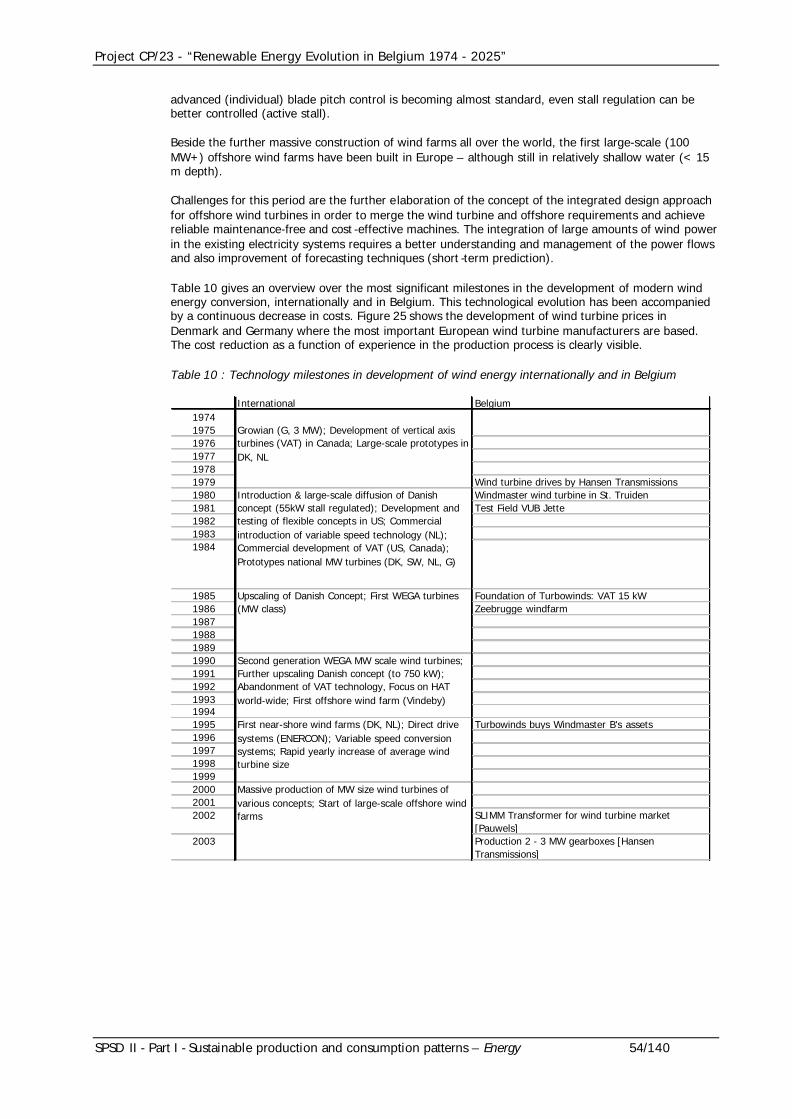
Project CP/23 - “Renewable Energy Evolution in Belgium 1974 - 2025”
SPSD II - Part I - Sustainable production and consumption patterns – Energy 54/140
advanced (individual) blade pitch control is becoming almost standard, even stall regulation can be better controlled (active stall).
Beside the further massive construction of wind farms all over the world, the first large-scale (100 MW+) offshore wind farms have been built in Europe – although still in relatively shallow water (< 15 m depth).
Challenges for this period are the further elaboration of the concept of the integrated design approach for offshore wind turbines in order to merge the wind turbine and offshore requirements and achieve reliable maintenance-free and cost -effective machines. The integration of large amounts of wind power in the existing electricity systems requires a better understanding and management of the power flows and also improvement of forecasting techniques (short -term prediction).
Table 10 gives an overview over the most significant milestones in the development of modern wind energy conversion, internationally and in Belgium. This technological evolution has been accompanied by a continuous decrease in costs. Figure 25 shows the development of wind turbine prices in Denmark and Germany where the most important European wind turbine manufacturers are based. The cost reduction as a function of experience in the production process is clearly visible.
Table 10 : Technology milestones in development of wind energy internationally and in Belgium
International Belgium197419751976197719781979 Wind turbine drives by Hansen Transmissions1980 Windmaster wind turbine in St. Truiden1981 Test Field VUB Jette198219831984
1985 Foundation of Turbowinds: VAT 15 kW1986 Zeebrugge windfarm198719881989199019911992199319941995 Turbowinds buys Windmaster B's assets 1996199719981999200020012002 SLIMM Transformer for wind turbine market
[Pauwels]2003 Production 2 - 3 MW gearboxes [Hansen
Transmissions]
First near-shore wind farms (DK, NL); Direct drive systems (ENERCON); Variable speed conversion systems; Rapid yearly increase of average wind turbine size
Massive production of MW size wind turbines of various concepts; Start of large-scale offshore wind farms
Growian (G, 3 MW); Development of vertical axis turbines (VAT) in Canada; Large-scale prototypes in DK, NL
Introduction & large-scale diffusion of Danish concept (55kW stall regulated); Development and testing of flexible concepts in US; Commercial introduction of variable speed technology (NL); Commercial development of VAT (US, Canada); Prototypes national MW turbines (DK, SW, NL, G)
Upscaling of Danish Concept; First WEGA turbines (MW class)
Second generation WEGA MW scale wind turbines; Further upscaling Danish concept (to 750 kW); Abandonment of VAT technology, Focus on HAT world-wide; First offshore wind farm (Vindeby)

Project CP/23 - “Renewable Energy Evolution in Belgium 1974 - 2025”
SPSD II - Part I - Sustainable production and consumption patterns – Energy 55/140
0.1
1.0
10.0
1 10 100 1000 10000
Cumulative Sold Wind Turbine Capacity (MW)
Win
d Tu
rbin
e Li
st P
rice
(200
0 €/
W)
1981 Denmark1985
1990
1995
2000
Germany
19871990
1995
2000
Figure 25 : Experience curve of wind turbine prices from Danish and German manufacturers; adapted from [NEIJ 03]
4.4 Photovoltaics
Before the 1970s
The photovoltaic effect was discovered by A.E. Becquerel in 1839 and physically explained by A. Einstein in 1904.
In 1954 the first silicon solar cell was presented by Bell Laboratories as a “solar battery”. It was intended for the energy supply of their telephone repeater stations. After a demonstration project in Americus, Georgia, running from 1955 to 1956, Bell Laboratories abandoned their research on PV due to the disproportionate costs [FITZ 03, PER 03].
Since 1955 photovoltaics has been explored for the power supply of space craft. The first PV powered satellite was launched in 1958. Space flight remained the major commercial application of PV and the main driver for continued R&D until the 1970s [GREEN 00].
The applied solar cells were almost exclusively made of single-crystalline silicon wafers. Reported efficiencies of laboratory cells ranged from 6% in 1954 to 18% in 1970 [ILES 70].
1970s
The development of terrestrial photovoltaics was resumed in 1973 in response to the first oil crisis. As a consequence, funding for PV R&D increased rapidly mainly aiming at cost reduction and the development of applications. In 1974 the Sunshine Project was started in Japan [KATO 02] and in 1975 the US government initiated a terrestrial PV research and development project [SUR 03]. The first European Commission R&D programme devoted to renewable energy started in 1975. The PV activities were focused on crystalline silicon R&D. Several national PV programmes were initiated in the EU member states from 1974 [PAL 98]. In Belgium, the government init iated a National R&D Programme for Energy in 1975, which ran in 3 phases until December 1987 [OVE 78, DPW 98].
This world-wide research was accompanied by great expectations. The goal was for PV to be competitive with classical central power stations by t he end of the 1980s. This goal turned out to be too ambitious, especially when in the 1980s the oil price dropped and cheap bulk electricity became available from large nuclear power stations [SUR 03].

Project CP/23 - “Renewable Energy Evolution in Belgium 1974 - 2025”
SPSD II - Part I - Sustainable production and consumption patterns – Energy 56/140
A number of technological developments from this period have only been commercialised in the late 1990s. Examples are the production of wafers from silicon ribbons and thin-film solar cells from cadmium telluride, copper indium diselenide and amorphous silicon.
PV systems installed in the 1970s were mainly stand-alone systems for remote power supply. Typical applications were water pumping, medical care, lighting and communication technology [FITZ 03].
1980s
The 1980s were the decade of large central PV power plants often operated by electric utilities. In the US, PV arrays of several hundreds up to 1000 kWp were installed between 1982 and 1984. Also, almost all EU member states installed large PV power plants, with capacities between 30 and 362 Wp (Germany). This development continued into the mid 1990s with increased plant capacities of 1 MW and more (Toledo, Spain: 1 MW and Serre, Italy: 3.3 MW).
In addition, in the 1980s the markets for off-grid applications and consumer products slowly continued growing. In terms of PV cell technology the decade was characterised more by a solid but slow progress than by significant breakthroughs [SUR 03].
1990s
The period of the 1990s may be referred to as the renaissance of photovoltaics. Driven by the threat of global warming and a number of hazardous nuclear reactor incidents in the 1980s, governments world-wide regained interest in renewable energies including PV. In that period, the market development of PV took off, stimulated by ambitious national financial support programmes mainly in Japan, Germany, Switzerland and the Netherlands [KATO 02, ERG 98]. As a result, worldwide PV shipments grew strongly, as did the share of decentralized grid-connected photovoltaic systems on private houses [NORD 02].
As a consequence of these programmes, the largest growth was experienced by grid-connected PV systems, typically applied on buildings and other structures. While in the early 1990 these systems were typically privately-owned and no larger than 5 kWp, in the late 1990s there was a trend towards systems of dozens up to hundreds of kWp, often owned by corporate investors [WOYT 03].
Technologically this period can be characterised by increased cell efficiencies and improved processes for cell and module manufacturing, yielding reduced manufacturing costs. Moreover, new promising techniques emerged such as crystalline silicon thin-films, dye-sensitised and organic cells, and nanostructures.
The increased market volume led to a professionalisation of PV system technology with the consequence of an increased reliability of PV modules, inverters and installations [JAHN 03], [WOYT 03]. This development is also reflected by the large number of international standards related to PV cells and modules, developed during this period, in particular by the IEC Technical Committee 82.
The most significant developments from this period are:
§ The share of single-crystalline silicon cells decreased in favour of cells made of multi-crystalline feedstock material, which, although being less efficient, can yield lower prices per kWp.
§ PV modules have more than doubled in size and rated power from typically 40 to 50 Wp for a standard module of 0.4 m2 up to 120 to 140 Wp for a 1 m2 module. Module manufacturers give warranties for 20 years and more.
§ Power conditioners apply modern power semi-conductors, which enable pulse-with modulation resulting in a very high power quality.
To summarise the 1990s, one could state that PV became a reliable energy technology that coming out of the pioneering stage.
Since 2000
PV cells based on crystalline silicon wafers are still expected to dominate the market until the end of this decade, with steadily increased efficiencies yielding reduced Wp prices [SUR 03], [GREEN 00]. This development is indicated by the current or scheduled investments in manufacturing facilities of virtually

Project CP/23 - “Renewable Energy Evolution in Belgium 1974 - 2025”
SPSD II - Part I - Sustainable production and consumption patterns – Energy 57/140
all important market players. The start -up of a PV cell production line in 2003 in Tienen, by the company Photovoltech, also fits into this development.
On the other hand, new types of solar cells developed in the 1990s have to prove whether they can gain a significant market share. Conditions are a competitive price per Wp in series production and a satisfactorily high efficiency that remains stable over the entire module life time. Potential candidates are different types of thin-film cells, such as thin-film crystalline silicon, multijunction amorphous silicon or several II-VI compound semiconductors (for example, copper indium diselenide) and organic solar cells.
In photovoltaic system technology the trend towards longer lifetime and increased reliability of inverters persists. Due to the application of high-frequency transformers, inverters become smaller and lighter. Transformerless inverters yielding very high efficiencies at lower costs have been introduced but they are still subject to safety concerns with respect to fault currents, for example in the Netherlands. The monitoring of PV system yields is gaining importance, due to the shift of support schemes in Europe from investment subsidies towards yield-dependent incentives [JAHN 03].
A renaissance of large PV power stations is also visible. While in the late 1990s a number of megawatt PV plants were installed on buildings, new ground-mounted plants have recently been installed in Germany. With the German feed-in tariff prior to 2004, these systems yield very high returns; however, due to their large landuse requirements, these systems are not undisputed and the idea is to limit them to unusable land, for example, former land fill areas. Moreover, the feasibility of very large PV power plants in deserts is currently seriously explored by a working group of the International Energy Agency’s PV Power Systems programme (IEA PVPS Task 8). The size of such systems would range between 0.1 to 20 km2 or 10 MW up to several GW peak power [KURO 03].
Since the late 1990s, the share of stand-alone and hybrid PV systems for rural electrification has been constantly decreasing as a result of the market introduction schemes for grid-connected PV in Europe and Japan. This tendency continues today. In order to facilitate a sustainable development in the developing countries, financing schemes for rural electrification will be necessary.
Table 11 gives an overview of the most significant milestones in the evolution of PV research and system technology, as well as the underlying market developments. Photovoltaic cells and modules are traded on a world market. The decrease of production costs, together with advancing technological and market development during the past decades, can be expressed as a function of the total power generating capacity of shipped PV modules (Figure 26). In the past, every doubling of the cumulative world PV module production has been accompanied by a decrease in price of about 20%. Other PV system components like inverters are traded on national markets rather than on a world market and comparable experience analyses are not available. Nevertheless during the past decade, the prices of PV system components in the larger European PV markets have decreased faster than PV module prices [NORD 02].

Project CP/23 - “Renewable Energy Evolution in Belgium 1974 - 2025”
SPSD II - Part I - Sustainable production and consumption patterns – Energy 58/140
Table 11 : Technology milestones in development of photovoltaics internationally and in Belgium
International Belgium1954 -- 1973
First Si solar cells by Bell Labs. Subsequent application in space accompagnied by a steady increase in laboratory efficiency from 4.5% to 18%.
1974 RD&D programme Belgium1975197619771978 Univ. Gent: II-VI compound cells19791980 Si cell production by ENE1984 Founding of IMEC, including PV R&D group1985 20% efficiency Si solar cells [M. Green, Australia]
1989 Soltech establishment PV-module manufacturing1990199119941995 First grid-connected BIPV system [Oostmalle, 2.3
kWp], GaAS cell production by ENE1996 Record efficiencies of 16% (pSi ) and 17% (mSi)
[IMEC]199719981999 National support moves from demonstration to large-
scale market introduction (Jap., G, other EU).
2000 Bekaert-ECD joint venture a-Si triple junction [withdrawal 2002]
2001 24.5% world record efficiency GaAs solar cells on a Ge substrate [IMEC, INTEC, UMICORE]
2002 BIPV modules with innovative back-contacted solar cells [IMEC]
2003 Photovoltech establishment X-Si production facility [IMEC, Electrabel, TotalFinaElf]
New German feed-in tarif of 0.50 euro/kWh, followed by other EU countries (Spain, F, L, parts of B and Austria). Building integration in EU. Large PV power stations. Large-scale crystalline cell and module manufacturing. Market introduction of new cell types. Steady progress in system components.
World-wide R&D PV programmes with great expectations. Research on II-VI compounds, amorphous Si and Si ribbons. Mainly stand-alone systems installed.
Large grid-connected PV power plants
Financial support programmes (Jap., G, CH, NL). Cost covering feed-in tariffs (G, CH). Consequences: Strong growth in on-grid PV. Professionalisation in system technology. Improved cell technology and manufacturing processes. Emerging of new technologies: dye-sensitized and organic cells, crystalline Si thin-film, nanostructures
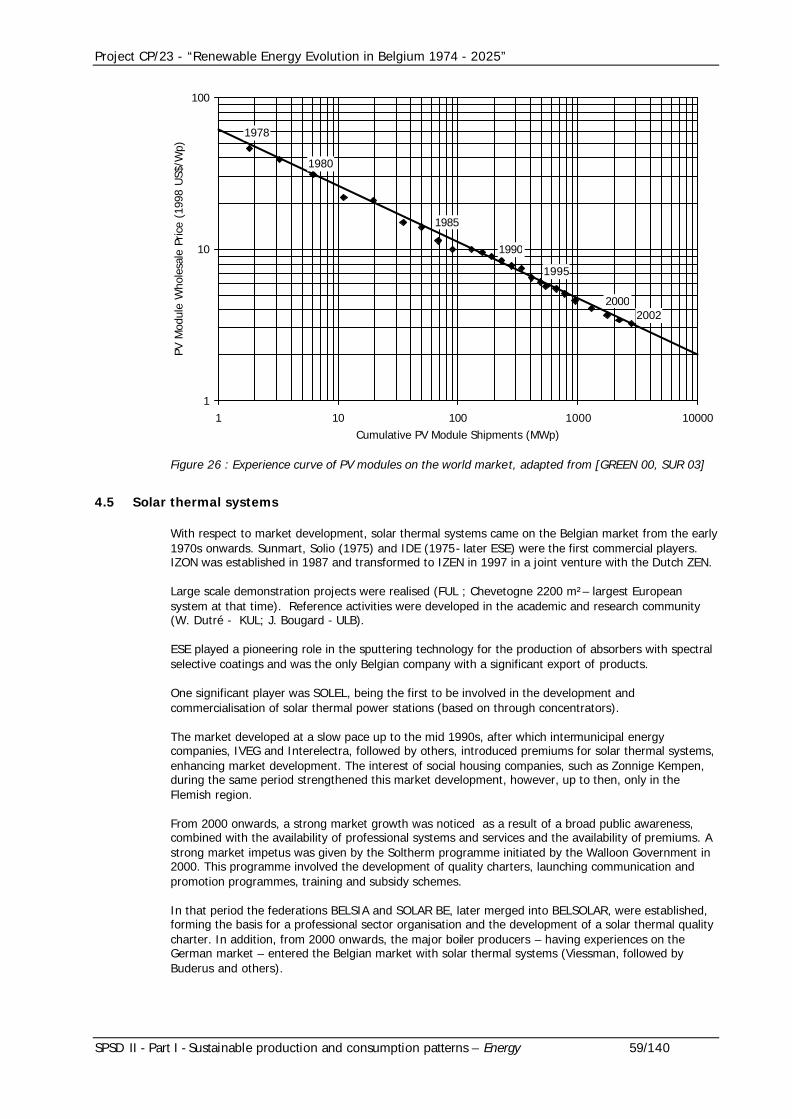
Project CP/23 - “Renewable Energy Evolution in Belgium 1974 - 2025”
SPSD II - Part I - Sustainable production and consumption patterns – Energy 59/140
1
10
100
1 10 100 1000 10000Cumulative PV Module Shipments (MWp)
PV M
odul
e W
hole
sale
Pric
e (1
998
US$
/Wp)
1978
1980
1985
1990
2000
1995
2002
Figure 26 : Experience curve of PV modules on the world market, adapted from [GREEN 00, SUR 03]
4.5 Solar thermal systems
With respect to market development, solar thermal systems came on the Belgian market from the early 1970s onwards. Sunmart, Solio (1975) and IDE (1975- later ESE) were the first commercial players. IZON was established in 1987 and transformed to IZEN in 1997 in a joint venture with the Dutch ZEN.
Large scale demonstration projects were realised (FUL ; Chevetogne 2200 m²– largest European system at that time). Reference activities were developed in the academic and research community (W. Dutré - KUL; J. Bougard - ULB).
ESE played a pioneering role in the sputtering technology for the production of absorbers with spectral selective coatings and was the only Belgian company with a significant export of products.
One significant player was SOLEL, being the first to be involved in the development and commercialisation of solar thermal power stations (based on through concentrators).
The market developed at a slow pace up to the mid 1990s, after which intermunicipal energy companies, IVEG and Interelectra, followed by others, introduced premiums for solar thermal systems, enhancing market development. The interest of social housing companies, such as Zonnige Kempen, during the same period strengthened this market development, however, up to then, only in the Flemish region.
From 2000 onwards, a strong market growth was noticed as a result of a broad public awareness, combined with the availability of professional systems and services and the availability of premiums. A strong market impetus was given by the Soltherm programme initiated by the Walloon Government in 2000. This programme involved the development of quality charters, launching communication and promotion programmes, training and subsidy schemes.
In that period the federations BELSIA and SOLAR BE, later merged into BELSOLAR, were established, forming the basis for a professional sector organisation and the development of a solar thermal quality charter. In addition, from 2000 onwards, the major boiler producers – having experiences on the German market – entered the Belgian market with solar thermal systems (Viessman, followed by Buderus and others).

Project CP/23 - “Renewable Energy Evolution in Belgium 1974 - 2025”
SPSD II - Part I - Sustainable production and consumption patterns – Energy 60/140
In terms of technology evolution, the early 1970s can be characterised by ‘do-it-yourself’-systems and experimental set-ups. From the early 1980s, the flat plate collector became the standard. In the mid-1980s, spectral selective coatings increased the efficiency of the collectors, together with adapted glazing and insulation. From 2000 onwards, the technological developments focus primarily on user friendliness, ease of installation, lifetime, standardisation and related logistics, as a consequence of the development of multi-lateral and international markets for solar thermal systems (e.g. IZEN Europallet). The first combined solar – wood pellets also appeared on the Belgian market.
4.6 Conclusion
The various renewable energy carriers have experienced different evolutions.
Large- and small-scale hydro power are mature technologies.
For biomass conversion, a large part of the experience gained is in gasification, anaerobic digestion and fuel extraction. The DRANCO process for anaerobic digestion has been developed in Belgium. Moreover, co-combustion, which has only recently been introduced, can offer fast results in greenhouse gas mitigation at relatively low investment costs. Pyrolysis installations are currently at the demonstration stage. Advanced RD&D experience is available on gasification (VUB) and small scale gasification in particular (UCL-TERM) and in the latter case, the expertise has developed into a spin-off commercial activity of Xylowatt sa.
Wind energy has evolved very rapidly, particularly in the past 15 years. Currently, technical progress is mainly shown via improved control concepts and a more integrated design in order to yield low production costs and high reliability. In the future large offshore wind farms will be built. While Belgian suppliers for wind turbine transformers and gear boxes are among the world market leaders, wind turbines made in Belgium have lost significance lately, due to their absence in the markets for MW turbines.
Similar to the experience of wind energy in the late 1980s, photovoltaics is currently rapidly evolving. Thanks to the German and Japanese market introduct ion programmes, the technology has moved from a demonstration stage to the market deployment stage. If this growth can be continued for another decade, prices will further decrease and new cell technologies will gain a share of the world market. Although Belgium plays an important role in PV cell R&D, the Belgian experience in practical application is negligible.
Solar thermal energy systems are well developed although there is still potential for technological progress. The markets are dispersed. Experience in Belgium has been gained through Flemish demonstration programmes as well as from the Walloon Soltherm initiative.
Project CP/23 - “Renewable Energy Evolution in Belgium 1974 - 2025”
SPSD II - Part I - Sustainable production and consumption patterns – Energy 61/140
5 Renewable Energy Business evolution
Along with the growth of the installed renewable energy capacity, Belgium has developed economic activities in the renewable energy sector since 1974.
Studies have given indicative figures and primarily treat the EU as a whole. These studies distinguish direct and indirect employment, and estimate the net employment figures [ESD 03]. For the Belgian situation, it is interesting to distinguish in addition the economic activity linked to the home market, and that related to the international market.
At the time of this study, there are no reliable data available on the Belgian market as a whole.
A limited review was done for the Flemish market, focussing on 10 selected technology and services providers3 with focus on the home and export markets. This analysis gives only an indication as it represents an unknown share of the economic activity as a whole. It nevertheless shows the growth rates and the diversity of sectors involved. 90% of the presented turnover is realised on export markets (see Figure 27).
EDORA, the Walloon Federation of green electricity industry, estimates the current number of full time equivalents at about 750 -–1000 for the green electricity sector in the Walloon Region alone [EDORA 04].
3 DEME (offshore wind), Vyncke (biomass boiler technology), Photovoltech (photovoltaic solar cell production), Iemants (wind farm towers and foundations), 3E (renewable energy system design and consultancy), Turbowinds (wind turbine manufacturer), IZEN (Solar heating systems), Pauwels trafo (transformers dedicated for wind turbines), Hanssen Transmissions (wind turbine gear boxes), Bekaert ECD Solar Systems (Photovoltaic solar cell production- ceased activities).

Project CP/23 - “Renewable Energy Evolution in Belgium 1974 - 2025”
SPSD II - Part I - Sustainable production and consumption patterns – Energy 62/140
162 171 187253
364394
452
599
710
851
982
0
200
400
600
800
1000
1200
1995 1996 1997 1998 1999 2000 2001 2002 2003 2004 2005
Full
Tim
e Eq
uiva
lent
s
Figure 27 : Direct employment in the renewable energy sector of 10 Flemish companies in the period 1995 – 2002 and their expectations up to 2005 based on committed investments – 90% of the associated turnover is realised on export markets [3E 03].

Project CP/23 - “Renewable Energy Evolution in Belgium 1974 - 2025”
SPSD II - Part I - Sustainable production and consumption patterns – Energy 63/140
6 Renewable Energy Outlook 2000 - 2025
6.1 Introduction
6.1.1 Methodology
A number of detailed potential studies have been realised in the past [ODE 97], [AMP 00], [RUYCK 96]. This chapter bases its figures largely on the mentioned references, and updates these references with newly gained knowledge on offshore wind potential and the international market of solid bio-fuels.
Two scenarios are developed for technically feasible developments of renewable energy in Belgium. The scenarios are based partially on recent experiences in neighbouring countries and take into account technological innovations.
The scenarios are built with a set of specific conversion technologies (as indicated in Table 12) using specific resources. The conversion technologies used in the scenarios are characterised in technical and economic terms, such as:
§ Power capacity
§ Load
§ Life time of the installation
§ Efficiency
§ Investment costs
§ Annual O&M Costs
§ Collector surface (for solar thermal installations)
§ …
Table 12 : Conversion technologies considered in this study
Traditional wood stoves
Wood boilers
Wood boiler industrial
Wood boiler District heating
Steam Turbine - CHP
Steam Turbine Power
Gasification CHP Small Scale
Co-combustion
Landfill gas (combustion engine)
CHP from manure based biogas
Biogas from industrial and municipal waste water treatment
Biomass technologies
MSW incineration/ digestion (organic fraction)
Flat plate collectors
Unglazed collectors
Solar thermal technologies
Evacuated tube collectors

Project CP/23 - “Renewable Energy Evolution in Belgium 1974 - 2025”
SPSD II - Part I - Sustainable production and consumption patterns – Energy 64/140
PV technologies (Non) Building integrated – Small scale to medium scale
Medium to large unit power Wind technologies
Offshore technologies based on [HUL 04]
Hydro power technologies Small to medium unit power
The used technologies are chosen as such that at least a 90% of the energy from that could be available in Belgium from RES in the upcoming 20 years would be covered.
This approach allows a quantitative and qualitative assessment of the scenarios in terms of the following indicators:
§ Energy production from renewable sources
§ Cost to the consumer or taxpayer
§ Impact on landscape (wind energy)
§ Spreading of energy production over power classes (distributed generation)
The scenarios are chosen in a manner which allows rational assessment of the impact of policy choices in the Belgian context :
§ BAU : the scenario ‘Business-as-usual’ (BAU) assumes a continued policy support for renewable energy without major infrastructural investments nor major structural changes in legislation.
§ PROA : the scenario ‘Pro-active’ (PROA) assumes structural investments in offshore electric infrastructure and power management, a continued public support for onshore wind energy and a stable international market for bio-fuels to source installations in Belgium.
6.1.2 Assumptions
6.1.2.1 Inventory of the current energy from RES market
Until 2020, the annual growth of the electricity demand in Belgium estimated by [ENE 04] is used:
§ Annual growth of 1.5% between 2000 and 2010
§ Annual growth of 1.3 % between 2010 and 2020
§ Annual growth of 0.8% between 2020 and 2030
The Belgian federation of electricity companies publishes the electricity consumption of 2002 [BFE 03]. The Belgium electricity consumption in the considered years is shown in Table 13.
Table 13 : Present and future electricity consumption in Belgium, used in the model
Year Electricity consumption (GWh/year)
2002 80 438
2003 81 645
2005 84 112
2010 90 613
2015 96 658
2020 103 106
2025 107 297
6.1.2.2 Evolution of the gas and oil prices and recuperation of the heat
Gas and oil prices

Project CP/23 - “Renewable Energy Evolution in Belgium 1974 - 2025”
SPSD II - Part I - Sustainable production and consumption patterns – Energy 65/140
For all scenarios, the values of the Federal Planning Bureau [ENE 04] were used. The gas prices will stay coupled to the oil prices in that considered period. The planning bureau uses the values that are stated in the POLES model of the European Commission. The prices for oil will go from 27.9 USD per barrel crude oil in 2000 to 20.1 USD in 2010. After 2010, price will rise until the level of 2000 is reached in 2030 (27.9 USD).
Heat prices
The price of 1 kWhth is calculated using the alternative way to produce heat - the combustion of natural gas with a 90% thermal efficiency. Prices for gas depend on the kind of consumer and the amount of consumption. The same tariff structure and prices for 2003 as published by the CREG are used [CRE 03].
Prices for the heat network
The price of heat works is estimated by 170 €/running meter added with the prices for the heat exchanger, which are dependent on their installed capacity (226 €/kW heat output).
6.1.2.3 Economical assumptions of the installations
To obtain the energy prices for different technologies of renewable energies, some economic assumptions were made.
Currency
All prices are in 2003 € prices.
Energy cost of the type of installations
The energy cost is the production cost of 1 kWh of energy and is expressed in €/MWh. To calculate this cost, an assumption was made that all the costs, including future costs, need to be loaned. The energy cost is the annual payment of the total cost, divided by the annual energy production of the installation. The parameters for the loan are:
§ a constant interest rate of 8.50%
§ duration is the lifetime of the installation
§ amount of money to be loaned is the present value of all the (future) costs/revenues:
§ the investment costs
§ the heat network costs for installations feeding a heat network
§ all future O&M costs
§ all future fuel costs (for biomass plants only) ; for indigenous wood, the market prices is assumed to be 2 €/GJ, whereas the price of imported wood is assumed to be 4 €/GJ ; waste streams of biomass are assumed to have zero or slightly negative costs, which is a conservative assumption considering the obligation of treatment of most such streams
§ all future revenues of the heat (for biomass co-generation plants only)
The energy prices of an installation installed in a specific year will be held constant over the total period of the lifetime of the installation. After its lifetime, an installation will be replaced by its best available technique and new energy prices will be calculated as before. Although the biomass plants are dimensioned on the heat demand, the energy cost is calculated per electricity unit (kWh). Fuel costs for the biomass installations will be calculated in the year of the installation of the plant and will be held constant over the total period of the lifetime of the installation. (Owner of the installation and supplier of the fuel will have a lifetime agreement for the fuel supply).
Balancing costs
Balancing costs have not been considered in this study. There is little consensus on the level of these cost in the current market situation and even less in the future electricity market. These costs are in

Project CP/23 - “Renewable Energy Evolution in Belgium 1974 - 2025”
SPSD II - Part I - Sustainable production and consumption patterns – Energy 66/140
particular of importance to wind energy and will depend on the flexibility of the future energy system, and of the expected increased ability to control and predictability of wind power.
Other assumptions
§ Installations will be automatically replaced by their best available techniques after the end of their lifetime.
§ With the replacement of the installations, the new market prices for fuel and heat will be used, new energy cost will be calculated using parameters of the replacing installation.
6.2 Scenario definition
6.2.1 Wind energy
6.2.1.1 Wind energy onshore
Wind energy is at the start of its development in Belgium as shown in Figure 20. The proposed scenarios are based on the estimation of the real-life experiences from project developers, public authorities and citizens involved with wind energy in the last 5 years :
§ The chance for realisation of a planned wind farm is limited due to a restrictive permitting policy, excluding agricultural areas, long procedures and dense population (especially in Flanders).
§ The public support is to a large extent neutral to positive for well planned and communicated projects. Wind turbines are considered as a positive element in landscape under a series of conditions: guarantees for a planned growth in a zone ; impact analysis before permitting (shadowing, noise, visual impact). Communication to and participation of local citizens in different ways prove to be beneficial4.
§ Large scale projects will be almost exclusively limited to industrial areas.
The long term potential of wind energy is determined by ‘hard’ boundary conditions such as exclusion zones, and by the public acceptance in function of the increased implementation. Spatial planning regulations are assumed to develop accordingly in the next decades.
The scenarios are based on the following assumptions.
Zones with visual influence
In both scenarios it is assumed that the density of wind turbines in the landscape is kept to an acceptable level. The perception of wind turbines in a landscape is a personal matter provoking points of view on wind turbines ranging from ‘Disturbing visual intrusion’ to ‘Contemporary constructions reflecting innovation and progress’.
It is nonetheless important to assess its visual impact for the purposes of constructing reasonable scenarios. This report compares the wind turbine density in the landscape with the density of other existing structures such as water towers, high voltage towers, etc.. The rationale of this comparison is that water towers are usually placed on elevated sites, and are also structures with a utility function, just as wind turbines are. The comparison is of limited use when taking into account the fact that wind turbines in general have a greater height, and have rotating blades.
4 (1) Wind energy public participation : Ecopower (Eeklo), Vents d’Houyet (Houyet), Beavent (Beauvoorde), Wase Wind (Waasland) ; (2) launch of bond issues by Electrabel for investment in wind farms (3) Public hearings organised by municipalities and project developers

Project CP/23 - “Renewable Energy Evolution in Belgium 1974 - 2025”
SPSD II - Part I - Sustainable production and consumption patterns – Energy 67/140
120 m
80 m
60 m
40 m
100 m
70 kV
380kV
Figure 28 : Height of structures commonly found in the Belgian landscape : Mobile phone mast, water towers, high voltage towers compared to a wind turbine (typically 100 m hub height for 2MW unit size)
In the most ambitious scenario (PROA), an upper limit of wind turbine penetration is put in zones where visual impact plays a role at a level equivalent to the penetration of water towers in Belgium.
The following other assumptions are made :
Infrastructure zones
Wind parks would be concentrated in infrastructure zones such as parking lots, roads, channels, and other public infrastructure. In the Flemish Region, it is reasonable to expect a development of 30 x 2 MW at parking lots, and 15 x 2 MW at other infrastructure sites. It is assumed that the same capacity could be installed in the Walloon Region. This results in an installed capacity of 90 x 2 MW, which is assumed for both scenarios, BAU as well as PROA. In the Brussels capital region, no significant development would be expected.
Agricultural area and industrial zones
We can base ourselves on the assumption that the Flemish government would like to make optimal use of the existing infrastructural adaptations in the landscape, such as harbours, industry zones. In the majority of Flanders there is little height variation in the landscape, and with current hub heights of 100m, a number of projects can be realised.
For the Walloon region this is not so much the case. Industry zones are often located within hilly landscape areas, which are generally not favourable for wind turbine location. As a result, in the Walloon region, windy areas are more likely to be located in areas designated for agricultural purposes.
§ BAU : in the Flemish region, 125 turbines x 2 MW would be installed, in the Walloon and Brussels capital region 175 turbines x 2 MW would be installed.
§ PROA : in the Flemish region, 260 turbines x 2 MW would be installed, in the Walloon and Brussels capital region 350 turbines x 2 MW would be installed.
In the PROA scenario, the total influence on the landscape (number of wind turbines) for infrastructural zones, agricultural zones and industrial zones in Belgium would not be higher than that of water towers in the Belgian landscape (i.e. a maximum of an extra 700 wind turbines)
The number of industrial zonings and their surface can be found in Table 14.
Table 14 : Industrial zonings in the Walloon and Flemish Region, (ICEDD and EWBL)
Number of industrial zonings Total surface (ha)
Flemish Region 2616 39722
Walloon Region 206 12092
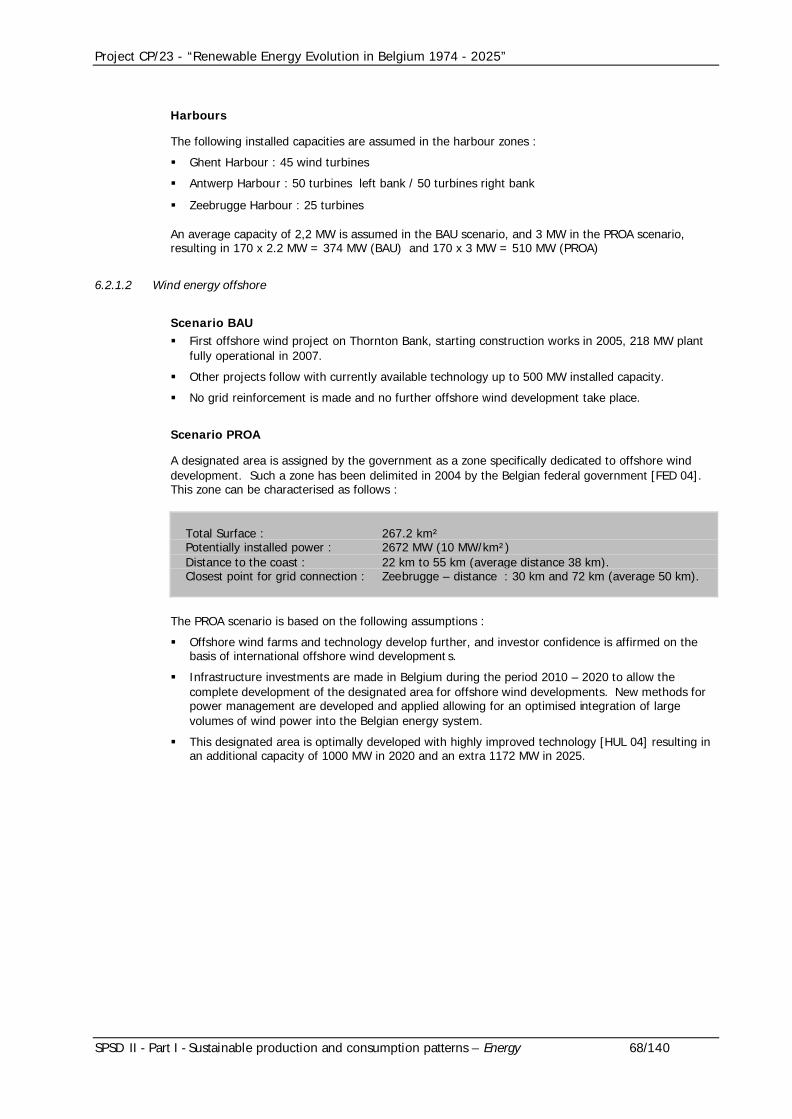
Project CP/23 - “Renewable Energy Evolution in Belgium 1974 - 2025”
SPSD II - Part I - Sustainable production and consumption patterns – Energy 68/140
Harbours
The following installed capacities are assumed in the harbour zones :
§ Ghent Harbour : 45 wind turbines
§ Antwerp Harbour : 50 turbines left bank / 50 turbines right bank
§ Zeebrugge Harbour : 25 turbines
An average capacity of 2,2 MW is assumed in the BAU scenario, and 3 MW in the PROA scenario, resulting in 170 x 2.2 MW = 374 MW (BAU) and 170 x 3 MW = 510 MW (PROA)
6.2.1.2 Wind energy offshore
Scenario BAU § First offshore wind project on Thornton Bank, starting construction works in 2005, 218 MW plant
fully operational in 2007.
§ Other projects follow with currently available technology up to 500 MW installed capacity.
§ No grid reinforcement is made and no further offshore wind development take place.
Scenario PROA
A designated area is assigned by the government as a zone specifically dedicated to offshore wind development. Such a zone has been delimited in 2004 by the Belgian federal government [FED 04]. This zone can be characterised as follows :
Total Surface : 267.2 km² Potentially installed power : 2672 MW (10 MW/km²) Distance to the coast : 22 km to 55 km (average distance 38 km). Closest point for grid connection : Zeebrugge – distance : 30 km and 72 km (average 50 km).
The PROA scenario is based on the following assumptions :
§ Offshore wind farms and technology develop further, and investor confidence is affirmed on the basis of international offshore wind development s.
§ Infrastructure investments are made in Belgium during the period 2010 – 2020 to allow the complete development of the designated area for offshore wind developments. New methods for power management are developed and applied allowing for an optimised integration of large volumes of wind power into the Belgian energy system.
§ This designated area is optimally developed with highly improved technology [HUL 04] resulting in an additional capacity of 1000 MW in 2020 and an extra 1172 MW in 2025.
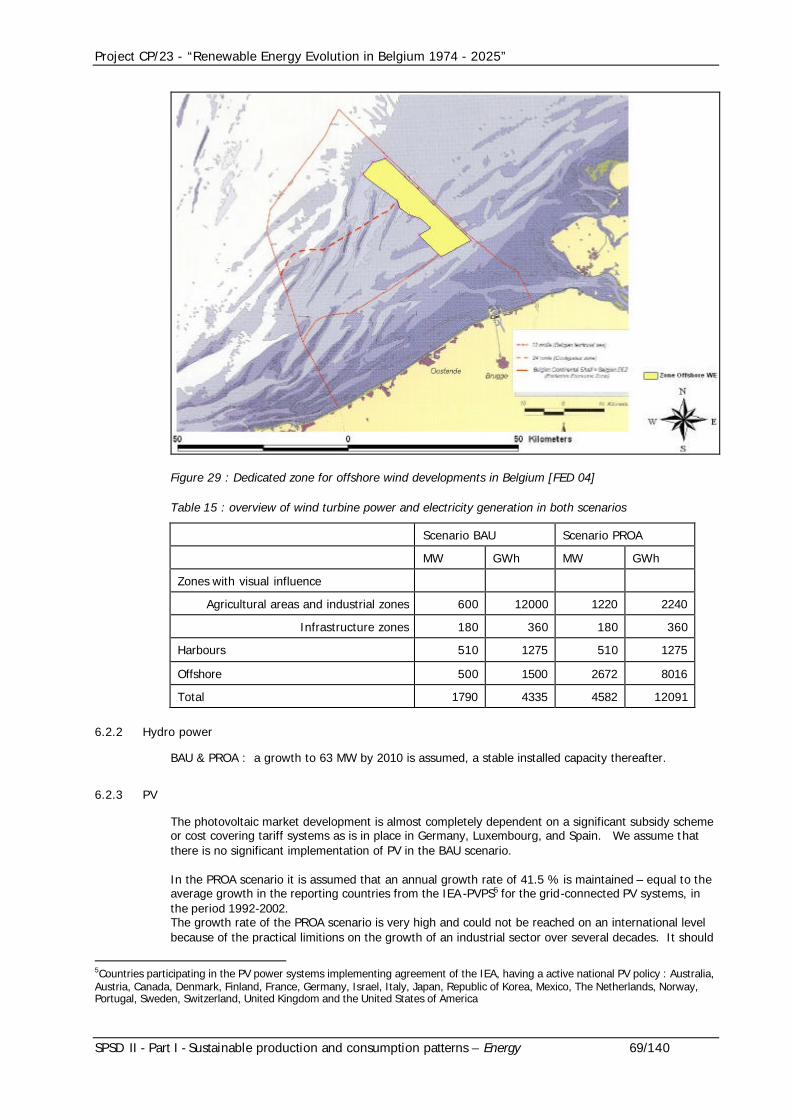
Project CP/23 - “Renewable Energy Evolution in Belgium 1974 - 2025”
SPSD II - Part I - Sustainable production and consumption patterns – Energy 69/140
Figure 29 : Dedicated zone for offshore wind developments in Belgium [FED 04]
Table 15 : overview of wind turbine power and electricity generation in both scenarios
Scenario BAU Scenario PROA
MW GWh MW GWh
Zones with visual influence
Agricultural areas and industrial zones 600 12000 1220 2240
Infrastructure zones 180 360 180 360
Harbours 510 1275 510 1275
Offshore 500 1500 2672 8016
Total 1790 4335 4582 12091
6.2.2 Hydro power
BAU & PROA : a growth to 63 MW by 2010 is assumed, a stable installed capacity thereafter.
6.2.3 PV
The photovoltaic market development is almost completely dependent on a significant subsidy scheme or cost covering tariff systems as is in place in Germany, Luxembourg, and Spain. We assume that there is no significant implementation of PV in the BAU scenario.
In the PROA scenario it is assumed that an annual growth rate of 41.5 % is maintained – equal to the average growth in the reporting countries from the IEA -PVPS5 for the grid-connected PV systems, in the period 1992-2002. The growth rate of the PROA scenario is very high and could not be reached on an international level because of the practical limitions on the growth of an industrial sector over several decades. It should
5Countries participating in the PV power systems implementing agreement of the IEA, having a active national PV policy : Australia, Austria, Canada, Denmark, Finland, France, Germany, Israel, Italy, Japan, Republic of Korea, Mexico, The Netherlands, Norway, Portugal, Sweden, Switzerland, United Kingdom and the United States of America

Project CP/23 - “Renewable Energy Evolution in Belgium 1974 - 2025”
SPSD II - Part I - Sustainable production and consumption patterns – Energy 70/140
however be noticed that the Belgian market is negligible compared to the internationally produced volumed in the course of the next decades, and that with a moderated average growth of the industry, a signficant higher growth can be implemented in an assumed pro-active policy approach.
6.2.4 Solar thermal
Flat plate glazed collectors are used for domestic and tertiary hot water and space heating. They can also be used for industrial processes. In 2002 in Belgium, 78% of the total installed surface of solar thermal surface were flat plate glazed collectors [BEL 04].
Evacuated tubes collectors can be used for domestic, tertiary and industrial applications. In 2002 in Belgium, 18% of the total installed surface of solar thermal surface were evacuated tubes collectors [BEL 04].
Unglazed collectors are mainly used for open pool applications. In 2002 in Belgium, 4% of the total installed surface of solar thermal surface were unglazed collectors [BEL 04].
BAU
In the Business-as-usual scenario, the growth in implementation of solar thermal systems is assumed to follow the same average growth rate in implementation as that observed over the period 1998 – 2003 (15%) until 2010. After 2010, the same number of additional solar thermal installations installed in 2010, will be installed in each subsequent year.
PROA
The PROA scenario assumes an additional implementation rate of 46% (which is the same as the additional implementation rate of the Walloon region between 2001-2003) for another 5 years, until 2008. After 2008, the same number of additional solar thermal installations installed in 2008, will be installed each year.
6.2.5 Energy from biomass
6.2.5.1 Indigenous
The indigenous potential of biomass has been estimated in different studies [AMP 00].
Table 16 : Indigenous potent ial of biomass for Belgium
Indigenous source Potential resources (primary energy)
PJ/year
Energy crops 2.4 – 4.8
Wood residues 0 – 5.5
Sewage sludge 1.4 – 2.5
Verge grass 0.5 – 1.7
Agricultural residues 0
Municipal solid waste 15
Landfill gas 0.4 – 0.8
Industrial waste 1.3 – 4.6
Manure 0 – 6.8
Chicken litter 3.5 – 10.5
TOTAL 24.5 – 52.2

Project CP/23 - “Renewable Energy Evolution in Belgium 1974 - 2025”
SPSD II - Part I - Sustainable production and consumption patterns – Energy 71/140
6.2.5.2 Imported biomass
European biomass market situation
There is competition between food, feed, energy crops and material production. This has consequences for t he biomass availability in the near future.
On the 17th of May 2003 the EC published its “Directive 2003/30/EC on the stimulation of the use of bio-fuels and other renewable fuels in transport” (see also 2.2.1). This directive demands from the member states that they ensure that a minimum proportion of bio-fuels and other renewable fuels is placed on their markets and, to that effect, that they set national indicative targets. As reference values for this national indicative targets for the year 2005 the directive mentions 2%, calculated on the basis of energy content of all petrol and diesel for transport purposes placed on their markets by 31 December 2005. In a similar way, a reference value of 5.75% is mentioned for 31 December 2010. To reach the target of 5,75% of all transport fuel to be derived from bioenergy by 2010 on the basis of agricultural biomass would mean that between 4 and 13% of farmland in the EU-25 would have to be planted with bio-fuel crops. A positive effect of this is that this bio-fuel directive would lead to large quantities of by-products, such as straw or rapeseed residues. These by-products can be utilised for the production of electricity and heat. A negative effect for electricity and heat production out of biomass is that on the long term woody biomass that could be used for electricity and heat production could instead be used for bio-fuel production. This depends on the development of for example the technology to convert lingo-cellulose into ethanol. We may assume that the implementation of this technology will take place after the year 2010.
According to recent studies implementation of this bio-fuel directive has the consequence that the total European demand for biomass for energy purposes (bot h electricity and transportation fuels) is about 60% of the total estimated technical potential indigenous biomass availability in 2010 in the EU25. This is illustrated by the following figure. However, it is also clear that there is still much uncertainty in the assessment of the technical biomass potential within the EU25. This is especially the case regarding the AC10, of which current estimates are expected to be relatively modest.
-
5
10
15
20
25
Tere
s II
Hal
l
Biew
inga
-max
WEC
Des
us
Best
est
imat
e
Biom
ass
dem
and
2005
Biom
ass
dem
and
2010
Prim
ary
ener
gy [
EJ/y
r]
Bioelectricity AC10
Bioelectricity EU15Biofuels AC10Biofuels EU15
Europe residuesAC10-residues
EU15-residuesEurope energy crops
AC10-energy cropsEU15-energy crops
Figure 30 : The potential biomass availabilit y of the EU15, AC10 (10 Accession Countries) and/or Europe according to 5 studies (left part of the figure). The middle part of the figure presents the best estimate as used in this study and the right side of the figure presents the estimated demand for biomass for bio-fuel and bioelectricity purposes for the year 2005 and 2010. For electricity the indicate country based EC targets are used. Sources: (ESD, 1997; Hall, 1993; Biewinga et al., 1996; WEC, 1994; Dessus, 1991;NTUA, 2003; EC, 2003)

Project CP/23 - “Renewable Energy Evolution in Belgium 1974 - 2025”
SPSD II - Part I - Sustainable production and consumption patterns – Energy 72/140
From Figure 30 we can conclude that the biomass demand in Europe in the year 2005 for the production of electricity and heat may not necessarily lead to import of large quantities of biomass. The biomass demand can probably be covered with biomass of EU origin. In the year 2010 implementation of the bio-fuel directive has the consequence that the total European demand for biomass for energy purposes is about 60% of the total estimated technical potential biomass availability in 2010 in the EU25.
The demand for other uses of biomass resources (e.g. material6) adds up to this figure, and will put further pressure to import biomass from outside the current EU.
Import of biomass into Belgium
The demand will lead to important amounts of biomass imports for the production of electricity and heat in the EU as a whole. The limited indigenous biomass potential suggests that Belgium will be a net importer.
Belgium has the target to fulfil in the year 2010 6% of the gross energy consumption by renewable energy. Under the assumption that 50% of this target needs to be fulfilled with biomass by 2010, about 2.9 TWh electricity out of biomass is needed. Taking into account the indigenous potential shown in Table 16, it means that in theory around the year 2010 import will take place on large scale from European or neighbouring countries with a high biomass potential compared to their needs, for example from the Baltic States and the East of EU25.
Import will be triggered sooner on basis of additional arguments Imported biomass can have the advantage of having large volumes from one supplier, with guaranteed homogeneity and with greater cost security. The dispersed character of the indigenous potential will limit its usage to local smaller scale applications possibly in CHP-mode, whereas imported bio-fuels will source larger scale installations.
Prices of imported bio-fuels are highly volatile, both as consequence of the lack of market transparency as well as changing agricultural, energy, environmental, fiscal and other policies throughout the EU. This makes it difficult to assess the penetration of these fuels in the Belgian context. Therefore the BAU and PRO scenarios assume respectively a limited and an advanced development of t he EU bio-fuel market. The scenarios only consider bio-fuels for electricity and heat production. Scenarios for the development of a bio-fuel market for transport purposes are out of the scope of this study.
Energy balance electricity generation from imported biomass
Various studies have been done on the cost and energy balance of international transport of biomass. [VDB 00] [VDB 03] summarises a few of them. This study calculates the output / input energy balance of an international energy chain in which eucalyptus is cultivated in Central America, transported by truck to the harbour, and by ship to the harbour in Rotterdam and used there for the purpose of co-firing in an existing coal plant. For each unit of biomass energy produced, about 13% of fossil energy input was needed (output/input ratio of about 8).
Recently a detailed study has been performed, on the basis of previous literature as mentioned above, by Hamelinck [HAM 03]. Here a range of biomass import routes from both Northern and Eastern Europe have been compared with various transport modes and various biomass pre-treatment routes. Figure 31 shows the result regarding the energy balances.
6 In the long term there is no competition between biomass based materials and biomass based energy, because biomass based materials can, after a cascade of uses, still be used as an energy source (e.g. demolition wood).

Project CP/23 - “Renewable Energy Evolution in Belgium 1974 - 2025”
SPSD II - Part I - Sustainable production and consumption patterns – Energy 73/140
0.0
1.0
2.0
3.0
4.0
5.0
6.0
7.0
ResiduesEurope
12.5 MWChips per
Ship
ResiduesEurope
12.5 MWChips per
Train
ResiduesEurope
12.5 MWPellets per
Ship
ResiduesEurope
12.5 MWPellets per
Train
CropsEurope300 MW
Pellets perShip
Crops LAinland
300MWPellets
Crops LAcoastal
1200MWPellets
Ener
gy u
se (
GJ/t
onne
dry
del
iver
ed)
Storage
Densification
Drying
Sizing
Ship
Train
Truck
WireBiomass harvesting
Figure 31 : Example of energy use in various biomass import chains from both North-Eastern Europe and Latin America (LA). Energy use is presented as HHV. Source [HAM 03].
Considering an HHV on dry basis of biomass of about 19 GJ/ton, indirect energy use in all cases presented varies between about 5-30%. The 30% value is caused by the choice of long distance train transport. When international transport takes place by ship, the fossil energy input over the whole chain varies between 5-15% of the delivered biomass based energy.
Therefore, in general we can conclude that international transport, if organized in an efficient way, can have very acceptable energy balances.
A specific study focussing on the LCA of biomass conversion routes applicable in Belgium is ongoing [LIBI 04]
Sustainability of biomass energy import
A potential disadvantage of biomass import into Belgium is that it is more difficult to control from Belgium whether the biomass used is really produced in a sustainable way. Therefore additional guarantees may need to be introduced for this. In the Netherlands this is currently undertaken by a utility which is importing large quantities of biomass from all over the world. A full track and trace system with independent certification has been developed. The exact sustainability criteria that have to be used at the source are still under development. This process is executed in close co-operation with environmental and social (fair trade) organisations.
Previous work has indicated various types of sustainability criteria that may be introduced for imported biomass. The challenge will be to come up with an acceptable set of criteria that can still be monitored in real practice. In a broad sense, imported biomass should be:
§ Clean
§ Safe
§ Efficient

Project CP/23 - “Renewable Energy Evolution in Belgium 1974 - 2025”
SPSD II - Part I - Sustainable production and consumption patterns – Energy 74/140
§ Reliable
§ Competitive
§ Have a high long term potential
§ Prevent technology ‘lock in’
§ Contribute to industrial development and employment
§ Acceptable for society
More details are presented in [VDB 03]. It is concluded that the above-mentioned list gives useful ideas of how a sustainable bio-fuel should look. However, these will be, in part, automatically realised if a level playing field and limited market distortions are created in the market. Certification of the whole chain will be difficult in practice. In order to be sustainable, a bio-fuel chain should at least:
§ Demand a theoretical environmental chain performance, as determined by methods like LCA, that is above a certain minimum level (to be determined inter-subjectively by stakeholders). Such a chain performance criterion could relate only greenhouse gases, but could also be extended to other environmental themes. The producer could be required to prove and calculate the chain performance of his product, according to a well-described methodology. An independent (and possibly certified) party could review such a statement by means of an environmental due diligence. Instead of having a minimal level requirement, one could make financial incentives, which are dependent on the amount of environmental gain achieved.
§ Demand that the bio-fuel is proven to come from a resource that meets certain resource based criteria. This can be arranged by a resource certification, which can be integrated in or administrated on the bio-fuel certificates that have been discussed above. An absolute minimum demand here should be that the biomass is renewable, i.e. that the rate of harvest is equal to or lower than the rate of regrowth.
§ Demand that a producer should prove that each step of the production chain meets the local environmental standards of the country/region where this step takes place.
6.2.5.3 Conversion technologies
Traditional wood stove - domestic wood boiler (<100kWth)
Technology
a. Traditional Wood Stoves
The technology has been well established and integrated into society for over 200 years. Wood stoves are the main wood energy technology installed in Belgian households. For domestic heating 4 different technologies are available: log stoves, pellet stoves, log boilers, chip boilers. Efficiency has increased from 55% for old technologies to 90% efficiency for new technologies in 2000. Old stoves are used with an equivalent of 1100 hours on full load annually, 70% efficiency and an investment cost of 280€/kWth. [DEI 02]. Higher full load hours can be reached by using the heat for hot domestic water, like in modern wood boilers.
b. Wood boilers
Wood boilers are increasingly installed in northern and eastern European countries (15,000 new wood boilers were installedin Austria in 1996, Lasselsberger et al. 1998). Important improvements have been realised in boiler efficiency (70%-90%) and atmospheric emissions (50-1,000 mgCO/MJcomb, 50-350 mgNOx/MJcomb and 20-100 mgparticules/MJcomb). Investments depend on boiler type and power range : 200-400 €/kWth for a log boiler with hot water tank for heat storage (20-50 kWth), 300-700 €/kW th for an automatic wood chip boiler (20-50 kWth).
Wood boilers are used with an equivalent of 2000 hours on full load annually, 80% efficiency and an investment cost of 280 €/kWth [DEI 02]. Investment cost is estimated to decrease by 10% over 20 years [DEI 02]. Wood boilers will be used with an equivalent of 2000 hours on full load annually.
Project CP/23 - “Renewable Energy Evolution in Belgium 1974 - 2025”
SPSD II - Part I - Sustainable production and consumption patterns – Energy 75/140
BAU scenario
For the old wood stoves, no growth is expected. According to Eurostat figures and Institut Wallon, in 1999, domestic wood stoves were used in Belgium to convert about 25% of the total primary biomass energy supplied. These wood stoves produced 2 TWhth energy in 2000 in Belgium. From 2010 onwards, the annual energy production by these stoves would decrease to 1.7 TWhth in 2025, due to some units coming out of operation and being replaced by wood boilers.
Old stoves would be replaced by new domestic wood boilers, which will be used for space heating hot water production in a dwelling. Pellets make this technology automated, flexible and more appropriate in urbanised areas. The energy produced by the domestic wood boilers would increase from 0.1 GWhth in 2005 up to 790 GWhth in 2025, which is equivalent to heat demand for about 40.000 dwellings.
The total energy production of the old wood stoves and the domestic wood boilers would increase from 2.1 TWhth in 2000 to 2.5 TWhth in 2025. Primary energy consumption would increase from 10.2 PJ in 2000 to 12.2 PJ in 2025.
PROA scenario
For the old stoves the same evolution is assumed as the BAU scenario.
The energy produced by the domestic wood boilers would increase from 0.1 GWhth in 2005 up to 1.6 TWhth in 2025, equivalent to heat demand for about 80.000 dwellings.
The total energy production of the old wood stoves and the domestic wood boilers would increase from 2.1 TWhth in 2000 to 3.3 TWhth in 2025. Primary energy consumption would raise from 10.2 PJ in 2000 to 15.6 PJ in 2025.
Wood boiler industrial – Wood boiler District heating
Technology
Collective wood boilers can be designed for clean wood or contaminated wood. Clean wood boilers are 3 to 5 times cheaper than contaminated wood boilers due to the avoided investment in a flue gas cleaning system. Investment cost is very sensitive to the boiler size (150-600 €/kW th for boiler size 50 –1000 kW th, 100-320 €/kW th for boilers from 1 MW th to 2 MW th and < 250 €/kWth for boilers > 2 MW th). Thermal efficiencies are between 70% and 105% (for flue gas condensing boilers) with a mean value around 80.
Wood boiler technology is well established and mature. Nevertheless it is not widely spread in Belgium. The wood boilers known in Belgium are essentially installed within wood industries. The Institut Wallon identifies about 25 of those installations (of thermal power between 100 and 2000kW th) in the Walloon Region. We can assume a quite similar situation in the rest of the country. Other sources assess the penetration at a few hundred installations [VYN 96]. The most important boiler is installed at spanolux (Vielsalm) with 40 MW th.
Wood boilers can be applied in industrial applications – where the heat demand is too low to apply a steam turbine in CHP-mode (this is roughly below 15 MW th), and in wood district heating schemes:
§ Industrial applications: This application is of commercial interest in situations with cheap bio-fuel availability (often residual streams), a high load factor and CO 2 emission reduction ambitions. It competes with coal fired or gas/oil fired boilers. In the case of coal fired boilers, co-firing of biomass is often possible with minor adaptations. In the case of gas fired boilers, the wood boiler is usually placed in addition, only avoiding the gas commodity costs.
§ District heating schemes sourced with a wood boiler are implemented in situations with a high density built area, newly built or in the phase of infrastructural renewal and preferably combined with higher load consumers (swimming pools, etc.) The socio-economic advantages for the local community is often an additional driving force (income for local wood industry, forestry).
§ In general one would strive to have a biomass boiler running at an optimal number of hours per year. Therefore, the choice is often made for a base load capacity on the basis of biomass with peak load capacity on the basis of natural gas.

Project CP/23 - “Renewable Energy Evolution in Belgium 1974 - 2025”
SPSD II - Part I - Sustainable production and consumption patterns – Energy 76/140
Very few district heating schemes are operational in Belgium. This could be explained by the poor reputation of district heating in Belgium. Nevertheless, in 2000 the Walloon Government established a plan to install 10 small wood boilers and district heating schemes. At least 75 Walloon Communes are considering the installation of a district heating scheme (equivalent of 40MW) [REA 03]. A series of public tenders launched by Walloon local communities confirms their interest to realise small-scale district heating schemes.
In France, wood boilers coupled to a district heating have been well and rapidly established since 1994, due to a public plan called “Plan Bois Energie”. A second part of this plan aims at the installation of 1000 new wood boilers by the end of 2006 [ENE 01].
BAU scenario
a. Industrial purpose
An increase from the equivalent in 2000 of about 256 MW to an equivalent of 300 MW in 2025 is assumed to occur. This assumption is based on ‘expert estimate’ based on market prospects, but there are no detailed studies to make more accurate assumptions.
This results in an increase from the equivalent in 2000 of 1.5 TWhth produced heat to an equivalent of 1.8 TWhth produced heat in 2025 . Primary energy consumption would raise from 6.9 PJ in 2000 to 8.1 PJ in 2025.
b. Non-industrial purpose
In Belgium, there are still 124 communes which are not connected to the gas distribution grid. In the BAU scenario 10% of these communes would have implemented a district heating scheme of 2 MW by the year 2025. This would produce 48 GWhth heat by 2025 with a primary energy input of 218 TJ/year.
PROA scenario
a. Industrial purpose
An increase of the equivalent in 2000 of 256 MW to an equivalent of 370 MW in 2025 is assumed to occur. This results in an increase from the equivalent in 2000 of 1.5 TWhth produced heat to an equivalent of 2.2 TWhth produced heat in 2025. Primary energy consumption would raise from 6.9 PJ in 2000 to 10 PJ in 2025.
b. Non-industrial purpose
In Belgium, there are still 124 communes which are not connected to the gas distribution grid. In the PA scenario 50% of these communes would have implemented a district heating scheme of 2MW by the year 2025.
This wouldill produce 242 GWhth heat by 2025 with a primary energy input of 1.1 PJ/year
Steam turbine - CHP
Technology
The most important biomass conversion installation of this type operational in Belgium is the Burgo Paper Mill at Harnoncourt. The main bio-fuel used until now is the black liquor (60%) resulting from the industrial paper process, mixed with bark (15%) and oil (25%). This installation is a CHP plant because part of the steam generated is used for industrial process. The plant is composed of 4 boilers (100 MW th – 125 MWth - 50 MW th – 50MW th) and 2 steam turbines (47MW e).
Before 1999, the contribution of this installation to the total biomass primary energy supply of Belgium is assessed to about 25%.

Project CP/23 - “Renewable Energy Evolution in Belgium 1974 - 2025”
SPSD II - Part I - Sustainable production and consumption patterns – Energy 77/140
In 2002, motivated by new legislation in favour of green energy and RUE, Burgo undertook a reprocessing of the installation in order to improve their CHP global efficiency and green power production and to extend their capacities. A new boiler (for black liquor) of 150 MW th was installed instead of one unit of 50MW th
For steam boiler and steam turbine systems there is a considerable economy of scale, and the most cost -effective plants are above 20 MW e. For power ranges above 10 MW e, investment costs are between 1,500-2,700 €/kW e.
BAU scenario
Due to the high required heat demand, the growth potential is expected to be limited. It is assumed that the current contribution (expressed in primary energy input) is only doubled from now to 2025.
The total energy production of steam turbines would increase from 600 GWhe in 2000 to 0.9 TWhe in 2010 and to 1.22 TWhe in 2025. Secondary heat production would increase from 0.6 TWhth in 2000 to 0.9 TWhth in 2010 and to 1.2 TWhth in 2025. Primary energy consumption would raise from 7.2 PJ in 2000 to 14.6 PJ in 2025.
PROA scenario
In this scenario, the same assumptions are made for the application of steam turbines in CHP mode.
In addition, it is assumed that 2 full-biomass steam turbine plants are built using imported bio-fuels. These plants would have a unit size of 50 MW e and would typically be built in a harbour area to ensure cheaper biomass sourcing. This would be achieved by the year 2020.
The total energy production of steam turbines would increase from 600 GWhe in 2000 to 0.9 TWhe in 2010 and to 1.8 TWhe in 2025. Secondary heat production would increase from 0.6 TWhth in 2000 to 0.9 TWhth in 2010 and to 1.2 TWhth in 2025. Primary energy consumption would raise from 7.2 PJ in 2000 to 21.9 PJ in 2025.
Co-combustion
Technology
Co-combustion can be done in association with various technologies: direct combustion, pulverisation, gasification, pyrolisis, torrefaction, etc. We can consider completely new installations or repowering of existing installations. Various type of biomass (wood, polluted wood, sewage sludge, manure, …) can be used. Considering its centralised character and the generally suitable logistic positioning of these plants, imported biomass is expected to be used as well.
Most existing coal plants are pulverised coal plants. This has as a consequence that only very fine biomass (like sawdust) can be directly fires into such a boiler. Larger biomass pieces will need some from of pre-treatment.
Co-firing biomass in a standard and existing boiler, either directly or indirectly, requires often small investment and will probably result in an increase in the use of bio-fuels in electric power generation. This way is highly attractive for electrical companies in order to re-process some old (coal) power plants and produce energy from renewable sources at low cost and with relatively high efficiency. Nevertheless, there is a limitation in the percentage of bio-fuels in the mixed fuel (5-10% without major changes, up to 20% with adaptation of coal mills and related equipment). The additional investment to ensure the retrofitting of such old installations to co-fire bio-fuels can vary between almost zero up to 1000 €/kW e. In a cost comparison with stand alone biomass applications, one has to include the investment cost in the coal plant itself as well. We can assume an electric efficiency of about 38% and a full load of 7000 hours per year.
The coal power plants will be under pressure to be removed from the energy mix. It is uncertain which capacity of coal power plants will still be operational in the next years and decades as consequence of a increasingly strict GHG policy and other emission reduction policies (acidification) on the one hand, and the energy diversification policy on the other hand.

Project CP/23 - “Renewable Energy Evolution in Belgium 1974 - 2025”
SPSD II - Part I - Sustainable production and consumption patterns – Energy 78/140
In the meantime alternative options to (co-)combust different types of bio-fuels in conventional power plants w ill further develop. In the future, it is possible to construct new combined 100% flexible coal/biomass plants, e.g. based on fluidised bed combustion. It is furthermore possible to convert woody biomass in a decentralised manner into pyrolysis oil, transport the oil to gas power plants and convert it into electricity and heat. Another example is the gasification of woody biomass and subsequent co-combustion of the gas in gas or coal power plants. The costs of these alternative conversion routes will be significantly higher than the straightforward co-combustion in coal plants. Upcoming R&D and demonstration will validate costs and feasibility of alternative options in the medium and long term.
The European bio-energy market clearly shows the immediate interest in the relatively cheap co-combustion option. In The Netherlands, an installed capacity of 500 MW e co-firing in coal fired power stations is foreseen by 2010.
BIGCC (Biomass Integrated Gasification Combined Cycle) technology seems to be operational from a technical point of view. Different demonstration projects (Varnamo 6MW e + 9MW th, ARBRE 10 MWe) have been realised in the late 90’s. Nevertheless those installations are now shut -down. The reasons are probably economic ones. The first industrial-scale demonstration plants require substantial public support in order to compensate the remaining technical risks and the high investment costs typical of first-of-a-kind plants. Based on those experiences, capital costs for a commercial plant are expected t o be around 2700$/kW for a 30-35 MW e plant and around 2000 $/kW e for 80 MW e.
BAU scenario
This scenario assumes an increase from the equivalent in 2000 of 0 MWe installed capacity to an equivalent of 25 MW e installed capacity in 2005, to an equivalent of 185 MW e installed capacity in 2020, corresponding to 10% of the current installed capacity of coal power plants in 2004 [BFE 04]. Energy production would increase from 0 GWhe in 2000 to 166 GWhel in 2005 to 1.3 TWhel 2020.
Primary energy consumption would increase from 0.3 PJ in 2000 to 1.6 PJ in 2005 to 12.9 PJ in 2025.
PROA scenario
This scenario assumes an increase from the equivalent in 2000 of 0 MWe installed capacity to an equivalent of 50 MW e installed capacity in 2005, to an equivalent of 370 MW e installed capacity in 2025, corresponding to 20% of the current installed capacity of coal power plants in 2004 [BFE 04]. Energy production would increase from 0 GWhe in 2000 to 270 GWhe in 2005 to 2.6 TWhe in 2025. It is assumed that the decommissioning of old coal fired power stations is compensated by increased usage of biomass in other coal or gas fired power stations.
Such scenario is conditional to satisfactory results of a detailed study on logistics and associated environmental impact as discussed in section 6.2.5.2.
Primary energy consumption would increase from 0.3 PJ in 2000 to 25.7 PJ in 2025 .
Small gasification CHP (combustion engine)
Technology
Small gasification CHP plants (30 – 1000 kW e) have been developed in recent years, as prototype or demonstration plants. They are generally fixed-bed units with gas engines. Global efficiency is around 65%-75% (thermal : 50%, and electrical : 20%-25%). Investment costs are between 2500 and 5000 €/kWe. Small-scale gasification seems now at the starting point for commercial exploitation, but has not yet been proven commercially.
A typical size for a combustion engine used for gasification is around 300 kW e with an electrical efficiency of around 30% and an equivalent of 5000 hours on full load per year. The full load hours will increase to 7000 hours in 2025. (availability would raise due to learning effects)

Project CP/23 - “Renewable Energy Evolution in Belgium 1974 - 2025”
SPSD II - Part I - Sustainable production and consumption patterns – Energy 79/140
The technology is applied in industrial environments with relatively stable heat demand, electricity consumption, and preferably cheap availability of the biomass resource. Compared to wood boilers, this technology puts more requirements on the resource characteristics.
BAU scenario
It is assumed that 10 units will be operational by 2005, steadily growing to 100 units by 2025.
An increase from the production of 0 MWhe to an electricity production of 9 GWhe and heat production of 9 GWhth in 2005 to an electricity production of 115 GWhe and heat production of 96 GWhth in 2025 would occur.
Primary energy consumption w ould raise from 130 TJ in 2005 to 1.3 PJ in 2025.
PROA scenario
It is assumed that 10 units will be operational by 2005, and thanks the acceptance of the market as a proven technology, quickly growing to an equivalent of 300 MW e by 2025.
An increase from the production of 0 GWhe to an electricity production of 9 GWhe and heat production of 9 GWhth in 2005 to an electricity production of 1.0 TWhe and heat production of 0.9 TWhth in 2025 would occur.
Primary energy consumption would raise from 130 TJ in 2005 to 12.9 PJ in 2025.
Landfill gas (combustion engine or stirling engine)
Technology
Gas motors with a global efficiency of around 85%-90% (thermal : 55% and electrical : 30%-35%) with power ranges of 500 – 1000 kW e are used.
BAU scenario and PROA scenario
The technical potential is estimated [AMP 00] between 0.4 en 0.8 PJ/year. The maximum of 0.6 PJ would be reached in 2015. Afterwards this will decrease.
An increase from the equivalent in 2000 of 1 GWhth heat and 3 GWhe electricity production to an electricity production of 56 GWhe and a heat production of 18 GWhth in 2015 with no increase after 2015 would occur. This potential will be exploited on short to medium term because of its relatively low cost, and is assumed to decrease after 10 years and completely extinguish after 20 years.
As a consequence of waste management policies, and the prohibition of landfills for organic waste in particular, the potential of landfills as a source of renewable energy is limited in time.
CHP from manure based biogas
Technology
The global efficiency will be around 48% (thermal : 29% and electrical : 1927%). A type installation of 30 kW e and an equivalent of 6000 full load hours a year has an investment cost of 4500€/kW e.
BAU scenario and PROA scenario
10% of the indigenous resources potential of chicken litter and 100% of the indigenous resources potential of manure is assumed to be treated in this way. Primary input would raise from 0.4 PJ in 2005 to 6.5 PJ in 2025. An increase from the equivalent in 2000 of 4.6 GWhth heat and 2.2 GWhe electricity production to an electricity production of 541 GWhe and a heat production of 991 GWhth in 2025.

Project CP/23 - “Renewable Energy Evolution in Belgium 1974 - 2025”
SPSD II - Part I - Sustainable production and consumption patterns – Energy 80/140
Biogas from industrial and municipal waste water treatment
Technology
Combustion engines have a global efficiency around 55%-60% (thermal : 25% and electrical : 30%-35%). A type installation of 500 kW e and an equivalent of 6000 full load hours per year has an investment cost of 1300€/kW e.
BAU scenario and PROA
An increase from the equivalent in 2000 of 24 GWhe electricity production to an electricity production of 198 GWhe in 2025 .
Waste incineration
Technology
Incineration is a generic term designing waste combustion.
Incineration of municipal solid waste (MSW) is more related to waste management policy than to energy policy. Early incinerators were characterised by very poor performance and energy recovery was not a priority.
About 20 incinerators were running in Belgium (4 without energy recovery) in 1995. At this time, only 10% of the primary energy supply theoretically available (considering 8 GJ/t) was exploited. This result is explained by the fact that some ovens do not recover energy. Indeed 420 000 tons among the 2 120 302 tons of waste available were burnt without energy exploitation in 1995. Considering the quantity which is burnt in units equipped with energy recovery systems, about 45% is actually exploited, with a conversion efficiency of 30%.
Due to higher landfill costs and waste management difficulties (scarcity of suitable landfills), some investments w ere made during the last 10 years and allowed better results in energy recovery (e.g. the Walloon electrical power capacity increases from 20 to 26 MW e between 1995 and 2001). Nevertheless, the current situation is not optimised as the infrastructure is aimed at waste management only without considering energy recovery.
Today, sorting is successfully done by the inhabitants, and only 35% of the raw waste goes to the incineration in the Flemish region and 55% in the Walloon Region. Future processes could allow a greater degree of sorting of the residual waste, but it is expected that about 25 % of the waste will stay available for conversion to energy.
A typical incineration facility costs 4000 $ per installed kW [SIMS 02]. We do not expect to see a decrease of the costs in the future years, essentially due to reinforcement of waste legislation.
Alternatives to waste combustion are available and can partially substitute the presented potential. The anaerobic digestion of the organic fraction of the MSW is a viable option and commercially applied in Belgium (DRANCO - Brecht, IGEAN). The energetic efficiency is generally lower, but the environmental performance can be higher due to the lower emissions associated to the digestion.
Scenarios BAU and PROA
No significant modification in installed powers is expected until 2010, but some complementary plants and increases in the efficiency could slightly increase the electricity production from the equivalent in 2000 of 457 GWhe to 523 GWhe in 2010.
After 2010, sust ainable energy policy and new waste treatment processes should enable the reduction of the residual quantity for energy production, so that the level of electricity production decreases to the level of 2000 or below.

Project CP/23 - “Renewable Energy Evolution in Belgium 1974 - 2025”
SPSD II - Part I - Sustainable production and consumption patterns – Energy 81/140
6.3 Characterisation of scenarios
6.3.1 Energy production
6.3.1.1 Electricity production
BAU
In the BAU scenario, the indicative objective of 6% for Belgium is reached in 2013, and the penetration of electricity from renewables saturates at about 8% of the gross inland consumption in the period 2004 – 2025. Wind energy contributes with 4.0 % (onshore wind 2.6%; offshore wind 1.4%) and biomass with 3.7%.
PROA
In the PRO scenario, the indicative objective of 6% is reached by 2011 and the penetration of renewables grows to 19% of the gross inland consumption, of which 3.8% is produced from onshore wind energy, 7.5% from offshore wind energy and 6.3% from biomass. From 2025 onwards, solar photovoltaics start to play a role and reaches about 1% of the gross inland electricity consumption.
Figure 32, Figure 33 and Figure 34 give an overview of the electricity production from renewable sources from 2003-2025 for both scenarios.
6.3.1.2 Heat production
BAU
The heat production from renewable sources of energy grows from 14.9 PJ in 2003 to 23.3 PJ in 2025 in the BAU scenario. The contribution from biomass is 22 PJ in 2025, and 1.3 PJ from solar thermal applications (respectively 95% and 5% of renewable energy based heat production).
Traditional wood stoves decrease gradually in importance but are compensated by highly efficient wood boilers. The heat production from district heating stays very small. Biomass supply to industrial applications (wood boiler industrial, steam turbine CHP, gasification CHP small scale) reaches the level of 10.9 PJ, and represents 47% of the renewable energy based heat production.
Solar thermal applications are dominated by the traditional flat plate collectors, namely 82 % of the solar thermal heat production.
PROA
The heat production from renewable sources of energy grows from 14.9 PJ in 2003 to 33 PJ in 2025 in the PROA scenario. The contribution from biomass is 30 PJ in 2025, and 3 from solar thermal applications PJ (respectively 91% and 9% of renewable energy based heat production).
Traditional wood stoves decrease gradually in importance but are compensated by highly efficient wood boilers. The heat production from district heating stays very small. Biomass supply to industrial applications (wood boiler industrial, steam turbine CHP, gasification CHP small scale) reaches the level of 15.3 PJ, and represents 46% of the renewable energy heat production.
Solar thermal applications are dominated by the traditional flat plate collectors, which contribute 82% of the solar thermal heat production.
Figure 35 shows the difference of the heat production from renewable for the BAU and the PROA scenario.

Project CP/23 - “Renewable Energy Evolution in Belgium 1974 - 2025”
SPSD II - Part I - Sustainable production and consumption patterns – Energy 82/140
6.3.2 Economic characteristics
Costs associated with the presented scenarios are calculated on the basis of the cost curves as shown in Figure 36, using the reference electricity prices as given in the assumptions.
The financial burden is calculated as the extra cost for the total electricity from renewable sources compared to t he reference electricity cost, divided by the total energy consumption in Belgium. This financial burden is calculated for both scenarios and shown in Figure 37.
The calculated cost represents the cost to realise the scenario, without taking into account the efficiency of market mechanisms such as feed-in tariffs and green certificate schemes. In a quota based certificate system with penalties without differentiation between technologies, the price can be significantly higher – typically a factor of 2 (see also [IFIEC 03]). A careful design of the market mechanisms supporting green electricity are clearly an important factor in the real cost for the electricity consumers.
This comparison is based on current mirco-economic market reality and does not consider external costs of energy generation. Note that the external costs associated with fossil and nuclear energy are estimated at 40 – 150 €/MWh (coal), 10 – 20 €/MWh (gas), 5 €/MWh (nuclear) [EC 03]. In addition to the neglect of external costs in this comparison, renewable energy projects are often subject to high environmental performance requirements (requiring additional investments) which would render non-renewable projects unfeasible (e.g decommissioning requirements of w ind farms).
Finally, no economic advantages are taken into account associated with the inexhaustible character of renewable energy resources and their high price stability compared to the price uncertainty of fossil resources for the considered period 2004 – 2025 (see also [AWE 03])
BAU
In the BAU scenario, the cost to realise the indicated volume of electricity from renewables compared to the reference electricity price, equally spread over the gross inland consumption grows to 1.5 €/MWh. Biomass contributes to 88% to this financial burden, wind energy adds about 10% (offshore wind 14% - onshore wind –4%).
The burden decreases after 2020 due to the increasing reference electricity price and the decreasing cost of renewable energy based electricity, mainly onshore wind energy.
PROA
In the BAU scenario, the cost to realise the indicated volume of electricity from renewables compared to the reference electricity price, equally spread over the gross inland consumption grows to 2.9 €/MWh. Biomass represents 62% of this financial burden, wind energy adds about 15%, and PV 10%.
Photovoltaics appear as a significant cost in this scenario, although the technology only contributes less than 1% to the gross inland electricity consumption. It is assumed that during the period 2015 – 2020 the ‘docking point’ is reached, i.e. the point where the market is self-supporting without national support schemes, thanks to growing competitive market sectors. Furthermore from 2015 – 2020 onwards, the electricity cost of PV reaches levels below 150 - 200 €/MWh, and therefore the indicated cost will largely be carried by private consumers choosing for PV as a competitive option compared to bulk grid electricity. The burden as a whole cannot be considered as a burden for all electricity consumers. T aking this fact into account, the burden for the electricity consumers will show a decreasing trend from 2020 onwards, as in the BAU scenario.

Project CP/23 - “Renewable Energy Evolution in Belgium 1974 - 2025”
SPSD II - Part I - Sustainable production and consumption patterns – Energy 83/140
6.3.3 Distributed generation characteristics
In this paragraph, the spreading of the electricity production over the different power ranges is analysed. It gives an indication of the trend to decentralisation in both scenarios.
Table 17 distributes the considered technologies over power ranges, and Figure 38 presents the electricity production between 2003 and 2025 in these power ranges for both scenarios.
Table 17 : Spreading of technologies over power ranges
Power range (MW) Technologies BAU PROA
Share of RES-E production 2025
0.01 – 0.1 PV, CHP from manure based biogas, Small hydro power
6.5% 7.7%
0.1 – 1 Small gasification CHP, Landfill gas, Biogas from industrial and municipal waste water treatments, Small hydro power
4.8% 6.7%
1 – 10 Onshore wind, Steam turbine CHP, Small Hydro power,
56.2% 30.1%
10 – 100 Steam turbine power, Waste incineration
0.0% 3.0%
100 - 1000 Offshore wind farms, Co-combustion
32.5% 52.5%
The small scale applications consist of photovoltaics and CHP from manure based biogas, supplying 0.56 (BAU) and 1.55 TWh (PROA) in the 0.01 – 0.1 MW class by 2025. The difference between the scenarios is due to the difference in PV growth.
In the class 0.1 – 1 MW, the small scale biomass technologies and small hydro supply 0.41 in BAU and 1.34 TWh in PROA, the difference being due to the growth in small gasification CHP in industrial applications.
The class 1 – 10 MW groups mainly the medium-size biomass systems implemented in industry, the onshore wind farms, and the waste incineration supplying 4.83 to 6.07 TWh in the BAU and the PROA scenario respectively.
The class 10 – 100 MW consists of the large scale biomass installations i.e. steam turbine power, ranging from 0 to 0.6 TWh in BAU and PROA respectively.
The class of 100 – 1000 MW consists of the offshore wind farms, and the co-combustion producing 2.8 to 10.6 TWh in the BAU and PROA scenario respectively. Co-combustion of biomass is taken up in the class 100 – 1000 MW because the energy produced will be done with installations with a unit size of that power range.
Hydro is spread over three classes but its contribution is assumed equal in both scenarios.
6.3.4 Visual impact and social acceptance
To assess the visual impact of the scenarios, a comparison is made between the number of wind turbines and other common installations in the landscape in Belgium for the period 2004 – 2025, that is: high voltage towers, water towers, mobile phone masts.
Figure 39 shows this comparison. As presented in the definition of scenarios, both scenarios keep the density of wind turbines in zones with visual impact below the current density of water towers in

Project CP/23 - “Renewable Energy Evolution in Belgium 1974 - 2025”
SPSD II - Part I - Sustainable production and consumption patterns – Energy 84/140
Belgium. This is an arbitrary level, considered as a limit of social acceptance. Although being arbitrary, it gives an indication of the potential visual impact of the BAU and PROA scenario.
6.3.5 Indigenous versus imported renewable energy fuels
Figure 40 indicates the share of primary input of bio-fuels for both scenarios BAU and PROA, split -up according to their origin (indigenous or imported).
In the BAU scenario, the imported bio-fuels is limited to about 20 %, whereas just over 30 % of the converted bio-fuel in the PROA scenario is of foreign origin.

Project CP/23 - “Renewable Energy Evolution in Belgium 1974 - 2025”
SPSD II - Part I - Sustainable production and consumption patterns – Energy 85/140
BAU
0
5
10
15
20
25
2003 2005 2010 2015 2020 2025year
Elec
tric
ity p
rodu
ctio
n (T
Wh/
y)
Biomass Wind onshore Wind offshore PV Hydropower
6% of gross inland consumption
10% of gross inland consumption 20% of gross inland consumption
15% of gross inland consumption
PRO
0
5
10
15
20
25
2003 2005 2010 2015 2020 2025year
Elec
tric
ity p
rodu
ctio
n (T
Wh/
y)
Biomass Wind onshore Wind offshore PV Hydropower
6% of gross inland consumption
10% of gross inland consumption 20% of gross inland consumption
15% of gross inland consumption
Figure 32 : Electricity production from renewable sources from 2003 – 2025 in the BAU and PROA scenarios in relation to the gross inland electricity consumption in Belgium (grey lines)

Project CP/23 - “Renewable Energy Evolution in Belgium 1974 - 2025”
SPSD II - Part I - Sustainable production and consumption patterns – Energy 86/140
BAU
98% 97%95%
93% 92% 92%
1.8%2.3%
2.9% 3.5% 3.7%
1.4%
2.2% 2.6%1.8%1.3% 1.5%1.6% 1.4% 0.0%
75%
80%
85%
90%
95%
100%
2003 2005 2010 2015 2020 2025
Non renewables Biomass Wind onshore Wind offshore PV Hydro
PRO
98%97%
94%92%
86%
81%
1.9%
2.6%
3.8%
5.7%
6.3%
1.4%
3.2%
3.8%
2.6%1.8%
4.4%1.6%
7.5%
0.9%
75%
80%
85%
90%
95%
100%
2003 2005 2010 2015 2020 2025
Non renewables Biomass Wind onshore Wind offshore PV Hydro
Figure 33 : Share and split -up of the electricity production from renewable sources from 2003 – 2025

Project CP/23 - “Renewable Energy Evolution in Belgium 1974 - 2025”
SPSD II - Part I - Sustainable production and consumption patterns – Energy 87/140
BAU
01234567
2003 2005 2010 2015 2020 2025
Year
Prod
uctio
n (T
Wh/
y)
Co-combustionSteam turbine PowerWaste incinerationBiogas from industrial and municipal waste water treatmentCHP from manure based biogasgasification CHP Small ScaleSteamTurbine - CHPLandfill gas (combustion engine)
PRO
01234567
2003 2005 2010 2015 2020 2025
Year
Prod
uctio
n (T
Wh/
y)
Co-combustionSteam turbine PowerWaste incinerationBiogas from industrial and municipal waste water treatmentCHP from manure based biogasgasification CHP Small ScaleSteamTurbine - CHPLandfill gas (combustion engine)
Figure 34 : Split -up of electricity production from biomass according to technology-resource combination

Project CP/23 - “Renewable Energy Evolution in Belgium 1974 - 2025”
SPSD II - Part I - Sustainable production and consumption patterns – Energy 88/140
BAU
0
5
10
15
20
25
30
35
2003 2005 2010 2015 2020 2025Year
heat
(PJ
)
Traditional wood stoves Wood boilersWood boiler industrial Wood boiler District heatingSteamTurbine - CHP gasification CHP Small ScaleLandfill gas (combustion engine) CHP from manure based biogasSolar thermal flat plate Solar thermal unglazedSolar thermal vacuum tubes
PRO
0
5
10
15
20
25
30
35
2003 2005 2010 2015 2020 2025
Year
heat
(PJ
)
Traditional wood stoves Wood boilers
Wood boiler industrial Wood boiler District heating
SteamTurbine - CHP gasification CHP Small Scale
Landfill gas (combustion engine) CHP from manure based biogas
Solar thermal flat plate Solar thermal unglazed
Solar thermal vacuum tubes
Figure 35 : Heat production from renewable sources (biomass and solar thermal installations)
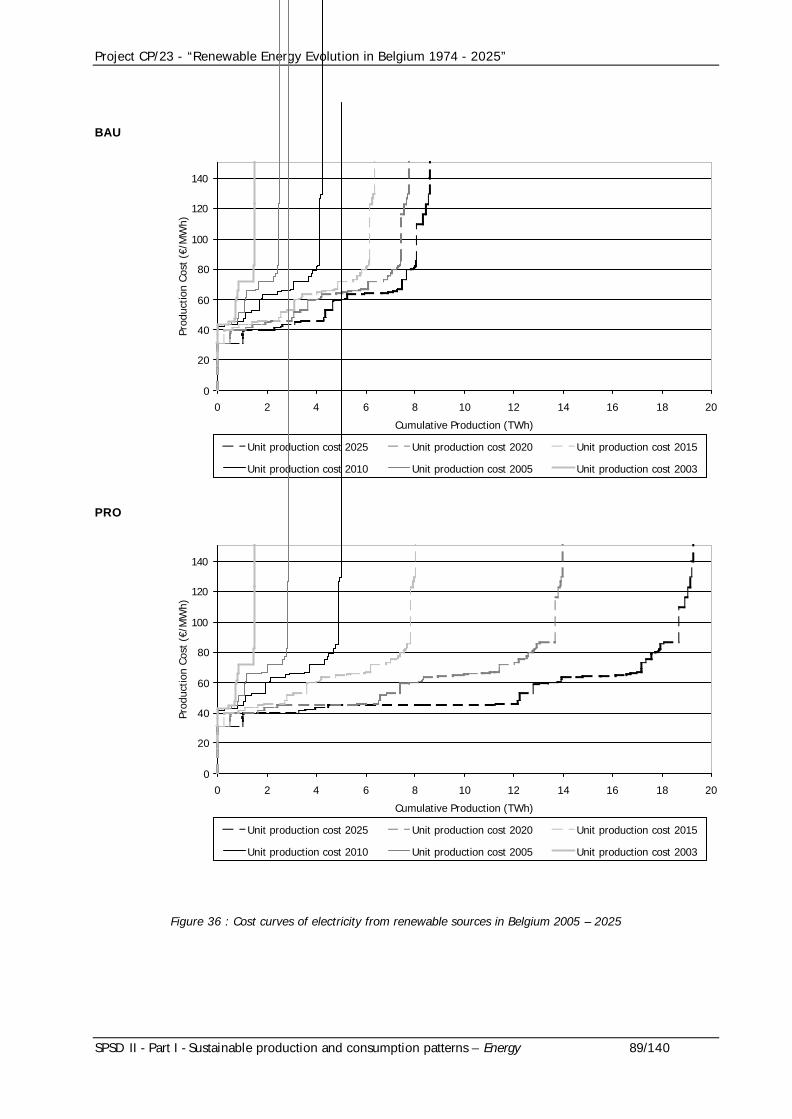
Project CP/23 - “Renewable Energy Evolution in Belgium 1974 - 2025”
SPSD II - Part I - Sustainable production and consumption patterns – Energy 89/140
BAU
0
20
40
60
80
100
120
140
0 2 4 6 8 10 12 14 16 18 20
Cumulative Production (TWh)
Prod
uctio
n Cos
t (€
/MW
h)
Unit production cost 2025 Unit production cost 2020 Unit production cost 2015
Unit production cost 2010 Unit production cost 2005 Unit production cost 2003
PRO
0
20
40
60
80
100
120
140
0 2 4 6 8 10 12 14 16 18 20
Cumulative Production (TWh)
Prod
uctio
n Cos
t (€
/MW
h)
Unit production cost 2025 Unit production cost 2020 Unit production cost 2015
Unit production cost 2010 Unit production cost 2005 Unit production cost 2003
Figure 36 : Cost curves of electricity from renewable sources in Belgium 2005 – 2025

Project CP/23 - “Renewable Energy Evolution in Belgium 1974 - 2025”
SPSD II - Part I - Sustainable production and consumption patterns – Energy 90/140
BAU
0
0.5
1
1.5
2
2.5
3
3.5
2003 2005 2010 2015 2020 2025
year
burd
en o
n pr
ice
(€/M
Wh)
biomass wind onshore wind offshore PV hydropower total green electricity
PROA
0
0.5
1
1.5
2
2.5
3
3.5
2003 2005 2010 2015 2020 2025
year
burd
en o
n pr
ice
(€/M
Wh)
biomass wind onshore wind offshore PV hydropower total green electricity
Figure 37 : Financial burden of BAU and PROA scenarios per kWh supplied in Belgium 2005 – 2025

Project CP/23 - “Renewable Energy Evolution in Belgium 1974 - 2025”
SPSD II - Part I - Sustainable production and consumption patterns – Energy 91/140
BAU
0.01
-0.1
0.1-
1
1-10
10-1
00
100-
1000
20052010201520202025
0.560.41
4.83
0.00
2.80
0
2
4
6
8
10
12
Cum
ulat
ive
prod
uctio
n (T
Wh)
Plant capacity (MW)
2005 2010 2015 2020 2025
PRO
0.01
-0.1
0.1-
1
1-10
10-1
00
100-
1000
20052010201520202025
1.551.34
6.07
0.60
10.61
0
2
4
6
8
10
12
Cum
ulat
ive
prod
uctio
n (T
Wh)
Plant capacity (MW)
2005 2010 2015 2020 2025
Figure 38 : Spreading of electricity production from renewable sources over power ranges of installations (kW)

Project CP/23 - “Renewable Energy Evolution in Belgium 1974 - 2025”
SPSD II - Part I - Sustainable production and consumption patterns – Energy 92/140
BAU
0
2000
4000
6000
8000
10000
12000
14000
2003 2005 2010 2015 2020 2025
Year
Am
ount
total onshore (zones with visual impact)total offshore (not visible)total onshore (harbours)
amount of high voltage towers (70kV) anno 2003amount of Watertowers anno 1991amount of high voltage towers (380kV) anno2003amount of GSM towers anno 2003
PRO
0
2000
4000
6000
8000
10000
12000
14000
2003 2005 2010 2015 2020 2025
Year
Am
ount
total onshore (zones with visual impact)total offshore (not visible)total onshore (harbours)
amount of high voltage towers (70kV) anno 2003amount of Watertowers anno 1991amount of high voltage towers (380kV) anno2003amount of GSM towers anno 2003
Figure 39 : Comparison of number of wind turbines (in zones with visual influence, harbours and offshore) with other common installations in the landscape in Belgium 2004 – 2025

Project CP/23 - “Renewable Energy Evolution in Belgium 1974 - 2025”
SPSD II - Part I - Sustainable production and consumption patterns – Energy 93/140
BAU
0%
20%
40%
60%
80%
100%
2003 2005 2010 2015 2020 2025
Import Indigenous
PROA
0%
10%
20%
30%
40%
50%
60%
70%
80%
90%
100%
2003 2005 2010 2015 2020 2025
Import Indigenous
Figure 40 : Indigenous use of biomass versus import of biomass for the use of energy production

Project CP/23 - “Renewable Energy Evolution in Belgium 1974 - 2025”
SPSD II - Part I - Sustainable production and consumption patterns – Energy 94/140

Project CP/23 - “Renewable Energy Evolution in Belgium 1974 - 2025”
SPSD II - Part I - Sustainable production and consumption patterns – Energy 95/140
7 Conclusions
7.1 Renewable energy policy 1974 - 2000
Renewable energy anchored in main international policy priorities
The UNFCCCC, i.e. the world-wide framework for greenhouse gas emissions reductions, served as a basis for increased efforts in research on, and the promotion, development and increased use of new and renewable forms of energy. Moreover, in the framework of the project -based mechanisms, Joint Implementation and Clean Development Mechanism, renewable energy is indirectly implicated, and these mechanisms can provide a leverage to the international wide-scale use.
In addition to the climate friendly character of renewables, renewable energy is recognized as a important component in other international policy priorities such as poverty alleviation in rural areas (rural electrification), and in sustainable development as a whole.
European policy from R&D oriented to implementation oriented
The European Union officially started its renewable energy policy through the launching of RD&D programmes from 1974 onwards. This was extended to include demonstration of new energy technologies in 1978. The basis for implementation-directed policy was set out in the White Paper ‘Energy for the future - renewab le sources of energy’. The first European directive on renewable energy was adopted in 2001 and introduced indicative targets for electricity produced from renewable sources of energy. Other implementation-oriented directives followed: energy performance of buildings, use of bio-fuels, and combined heat and power.
Belgian policy has offered a low priority and a lack of stability to renewables
The Belgian policy was purely research-oriented from 1974 onwards, and almost no implementation-oriented policies were developed of any significant scale. Public research efforts can be characterised as small, relative to the total energy research budgets, and somewhat fragmented. Valuable programmes were developed of fundamental as well as industry-oriented nature, but none of them were continued for more than a few years.
Low budgetary commitment and lack of stability in Belgium (but also on international level), in particular from 1980 -1985 onwards to the early ‘90’s have limited progress in that period.
European budgets have been significant for Belgium and have contributed to compensate for the fragmented support to RD&D in Belgium.
Belgium introduced a pro -active policy from 1999 – 2002, based on operational support both for electricity as for heat
In the late ‘90’s operational support was introduced by means of a production subsidy. The liberalisation of the energy markets has brought important changes and challenges for all market actors, including for the renewable energy sector. Operational support was t hen provided for electricity produced from renewable sources through a system of green certificates combined with quota. This mechanism has given a strong market pull, resulting in strong market growth.
Belgium (its regions) has now a successful operational support scheme in place. This is however not backed up with a significant long-term- oriented technological RD&D programme dedicated to renewable energy.

Project CP/23 - “Renewable Energy Evolution in Belgium 1974 - 2025”
SPSD II - Part I - Sustainable production and consumption patterns – Energy 96/140
7.2 Renewable Energy Production 1974 – 2000
7.2.1 EU-15
RES-E (excl. hydro) growth since 1990 – 2001 by factor 4
RES-E contribution in EU-15 rose to 15.5% in 2001
The relative importance of hydro power decreased from 94% to 84% due to a growth of the other RES by a factor of 4 from 1990 to 2001.
New technologies have come on the scene to a marginal extent since 2001: photovoltaics (0.2 TWh) and offshore wind (0.3 TWh).
RES-H largely dominated by biomass and higher contribution than RES-E
RES-H in the EU-15 amounted up to 42 Mtoe in 2001, based almost entirely on biomass. The RES-H represents 54% of the total contribution of RES compared to an equivalent of RES-E of 35.7 Mtoe (415 TWh).
RES-T contribution to overall RES production about 1%
The production of bio-fuels for transportation purposes was limited to 1 Mtoe in 2001, and represents about 1% of the total penetration of renewable energy sources in the EU-15.
7.2.2 Belgium
RES-E strong growth of wind energy and biomass
The average yearly growth of new RES-E (without large-scale hydro power) amounted to 14% from 1996 – 2001, (7.7% from 1990-2001) constituting about 0.6% in 1990-1996 and growing to 1% of the gross inland consumption in 2001. The relative importance of (small-scale) hydro power decreased from 23% to 20% due to growth of the other RES by a factor 1.9 from 1990 to 2001.
The yearly average growth rate over the period 2001 – 2004 is much higher, for example over 50% for wind energy alone.
RES-H largely dominated by biomass
RES-H in Belgium amounted up to 391 ktoe in 2001, of which 384 ktoe is based on biomass. The contribution of solar thermal is the smallest (about 1 ktoe in 2001) but grew strongly in the period from 1997 to 2003 with an average of 18%.
RES-T negligible
RES-T was nil in 2001.
7.3 Renewable energy technologies 1974 - 2000
Steady learning and cost reductions mainly for wind energy and photovoltaics
The subsequent shift from the research stage of a conversion technology to demonstration and finally market introduction of the new technology can be well observed with wind energy and photovoltaics. Experience curves of these technologies illustrate the effect of learning on the production costs. Cost reduction by learning with increased cumulative production is a consequence of technological breakthrough on the one hand and of upscaling of unit sizes and production processes on the other hand. The growing markets, in particular over the last decade, have had a significant impact on the costs of photovoltaics and wind energy in particular.

Project CP/23 - “Renewable Energy Evolution in Belgium 1974 - 2025”
SPSD II - Part I - Sustainable production and consumption patterns – Energy 97/140
§ Wind turbines: In the past, every doubling of the cumulative world wind turbine production has been accompanied by a decrease in price of about 10% and this trend continues ; the unit size of turbines is approaching 5 MW and conceptual changes are ongoing aiming at better system integration, high reliability and optimisation for entrance in the offshore market.
§ Photovoltaic modules: In the past, every doubling of the cumulative world PV module production has been accompanied by a decrease in price of about 20% and this trend continues; system component costs decrease faster than that of renewables, innovation on cell level continues towards different concepts of thin film cells
§ Biomass technologies show less room for cost reduction due to the diversity in biomass streams and conversion technologies. The market is expected to be dominated by the conventional systems for at least the next decade (co-combustion in different concepts). Gasification systems and other dedicated biomass conversion systems are progressing and expected to gain significant market share in the subsequent decade
§ Thermal solar systems highly reliable industrial products and focus is now on quality , standardisation, lifetime, logistics and user friendliness.
Vulnerability of technological progress
Current economic and technological progress arises largely from the mass production resulting from the pro-active policies in very few countries (Germany, Spain, Japan, etc.). This points at the vulnerability of the current progress being largely dependent on the policies of a few countries, but also shows the opportunity for an international commitment to develop renewables at large scale by a large number of countries.
7.4 Future scenarios 2004 - 2025
RES-E will not reach the 6% indicative objective of Belgium in 2010
Both the BAU and the PROA scenario present strong growth rates for RES-E penetrat ion, but both scenarios show that the indicative target will not be reached by 2010.
The target is reached in respectively 2014 (BAU) and 2011 (PROA).
RES-E between 8 – 18% in 2025 without major technology break-through
The BAU scenario assumes a continued supportive policy as is operational at the moment. The RES-E contribution to the gross domestic electricity consumption saturates in this scenario at 8% of the electricity consumption by 2025.
The PROA scenario assumes new investments in the electricity infrastructure and system management to accommodate large volumes of offshore wind power in the electric grid. Furthermore, it assumes a higher level of imported solid bio-fuels at acceptable cost and life cycle environmental impact, and higher penetration of bio-energy in cogeneration-mode in industry. Under these assumptions a penetration of RES-E of 18% is reached by 2025.
Visual impact of onshore wind energy
With respect to visual impact, both scenarios assume a number of wind turbines in specific zones (all with the exception of harbours and offshore areas) is lower than or equal to the number of water towers present in Belgium in 2003.
Decentralisation associated with RES
The introduction of a higher degree of renewable energy into the energy system gives rise to a higher degree of decentralisation. The share of electricity produced in lower power classes (< 10MW) reaches 67.5% (BAU) and 44.5% (PROA) respectively of the total RES-E production.
The further decentralisation is continued in the power class of 0.01 – 0.1 MW after 2025 when photovoltaics would increase its penetration in the electricity system.
Project CP/23 - “Renewable Energy Evolution in Belgium 1974 - 2025”
SPSD II - Part I - Sustainable production and consumption patterns – Energy 98/140
RES-H can increase its contribution to 2.2 times the current level
RES-H would realise a significant increase to 1.6 and 2.2 time its current leve l in respectively BAU and PRO. This increase is largely based on industrial applications (wood boilers, cogeneration based on biomass).
A limited contribution is expected from heat networks in the residential and tertiary sector, and thermal solar energy systems.
Large uncertainty on RES-H potential in industry
The possible penetration of RES-E in the Belgian energy system can be assessed in a satisfactory way, mainly thanks to its possibility to be grid-connected and not necessarily be in close proximity to the consumer.
The RES-H potential has not yet been assessed in a reliable way in Belgium. There is limited (public) knowledge on the heat demand that can be supplied by renewable sources (biomass, thermal solar systems).
The presented scenarios are based on acceptable ‘best guess’ and reasonable assumptions.
Solar energy would reach a role of significance in Belgium from 2025 onwards
The assumed growth in the PROA scenario brings photovoltaics to the level of significance in 2025 (≈ 1% of the gross domestic electricity consumption).

Project CP/23 - “Renewable Energy Evolution in Belgium 1974 - 2025”
SPSD II - Part I - Sustainable production and consumption patterns – Energy 99/140
8 Recommendations
8.1 Long term oriented renewable energy policy
Target setting for 2020
The current policy target for renewable energy is limited to electricity and to 2010. A target of at least 10 years into the future is required to guarantee investor confidence, i.e. target setting for 2015 and preferably 2020 is needed if a continued growth is envisaged. Similar targets for renewable sources for the heat and fuel sector should also be prepared.
The targets can be based on a consensus on allowable cost for the consumer, and using the cost curves presented in Figure 36.
RD&D programme
A dedicated long-term-oriented research programme on renewable energy and auxiliary technologies should be set-up. Such programme should focus on:
§ Promising technological developments which can increase the cost competitiveness of renewable energy technologies.
§ Infrastructure and optimal system integration of renewable energy, including aspects of power management, output prediction and management of wind, including aspects of demand side management.
International co-operation
The public and private investments in RD&D on renewables are orders of magnitude higher in countries like Germany and Japan. International cooperation – co-financed from national sources – in EU or in the IEA framework provides a leverage effect to maintain Belgian expertise on international level.
8.2 Optimisation of support schemes and short to medium term policy
Medium term focus operational support mechanism
Current support schemes, especially the green certificate system should be evaluated and optimised with a view to medium term stability of the mechanism.
The main elements to be considered are:
§ Reduction of complexity: the co-existence of 4 different market mechanisms in Belgium for a small market volume of green electricity could evolve to regional systems with a common basis to increase the transparency for investors.
§ Differentiation: the non-differentiation between technologies in the current certificate system leads to high margins for cheap renewable energy technologies.
§ International relations: the relation with international evolutions, such as the guarantees of origin used for disclosure purposes are to be clarified.
§ Adapted support to high-risk/high potential technologies : the need to foresee temporary cost -covering prices for high risk but potentially interesting technologies such as offshore wind and photovoltaics.

Project CP/23 - “Renewable Energy Evolution in Belgium 1974 - 2025”
SPSD II - Part I - Sustainable production and consumption patterns – Energy 100/140
The combined effect of support mechanisms on federal level (fiscal) and regional level (certificate system, investment subsidies) should be monitored with a view to ensuring the desired market growth at minimal cost, and avoiding windfall profits in specific sectors/situations.
8.3 Specific sectoral priorities
Preparation next phases of offshore wind developments
Offshore wind can contribute up to 7.5% of the gross inland electricity consumption. This contribution is possible under a series of conditions which require careful and timely preparation.
It is recommended t o:
§ Investigate the options and related costs of grid connection, grid reinforcements, power management and integration into the electricity system focussing on the dedicated zone for offshore wind development.
§ Follow and participate in the developments abroad, and in particular in the UK and Scandinavian countries, so as to have access to offshore wind energy costs, risks and future opportunities.
Analysis of RES-H&E potential in industry and dedicated technological developments
The uncertainty of the potential of RES-H and RES-E (mainly in cogeneration mode) in industry calls for an in-depth analysis of this potential, per sector, for the whole of Belgium.
Technological developments of solar thermal energy systems and biomass systems should be geared to the requirements of these sectors in terms of security of supply, costs, emissions, characteristics of output (profile, temperature ranges, etc.).
Biomass co-combustion/gasification
Integrated policy on coal fired power stations
Co-firing is likely to become a very important development for renewable energy towards 2025. Experiences of the broad range of possible types of co-firing are still limited. More in-depth practice-oriented investigation into this theme, making use of international experiences may accelerate this promising development in Belgium. This could include a range of fuels, pre-treatment technologies and the full range of large-scale coal and gas fired power plants in Belgium.
However, this conversion route will only develop to a significant scale if an integrated policy gives a secure framework to convert such power stations to co-firing with biomass. Therefore the policy on emission reductions applicable to coal fired power stations, and the renewable energy policy must be aligned.
RD&D on new and advanced options of biomass to energy conversion
The use of coal fired power stations is an obvious and short-term option, but more advanced and environmentally more interesting options would be to co-fire biomass in gas fired power plants. New promising developments in this field are ongoing, as well as in other long-term options for biomass for energy conversion.
Maintain technological pole position in solar photovoltaics
Belgium is at the forefront of technological developments in photovolt aics. This position is hard to maintain as public RD&D investments in this sector have strongly increased in other countries.
8.4 Quality and performance oriented implementation and monitoring
Norms and certification

Project CP/23 - “Renewable Energy Evolution in Belgium 1974 - 2025”
SPSD II - Part I - Sustainable production and consumption patterns – Energy 101/140
Norms, certification, and quality labels have been developed for renewable energy technologies and services. Up to now, Belgium has not played an active role in the development and implementation of these norms and procedures.
An active role in the committees on European and international level is highly recommended:
§ It ensures that Belgian norms and procedures are up-to-date with international evolutions.
§ It helps the products and services of Belgian companies to be accepted on the international markets.
The cost of such participation is very low in comparison with the cost of typical energy related public programmes.
Performance oriented implementation and monitoring
Any public policy or programme should ensure that the best available technology is implemented in an optimal way.
The green certificate registries allow a detailed statistical follow-up of the performance of individual installations and of the entire renewable energy based installed capacity.
With a view upon an increased penetration of wind energy, it is of interest to have a detailed follow-up of the production of the entire installed capacity in Belgium, and its variation in time.
8.5 Sustainability including social acceptance
Labelling of imported biomass resources
If biomass is to play an important role in Belgium towards 2025, imports seem unavoidable. Imported biomass can be a sustainable form of bioenergy, if logistics are well designed and if sustainability at the source is guaranteed. A labelling system should be developed linked to the incentive schemes for renewable energy production in Belgium.
Avoidance of perverse effects of large scale development of biomass projects
In the potential negative environmental impact of biomass, its large-scale use can have perverse effects on other markets and policies. The increase of w ood and waste prices can affect the activities of industrial sectors using this type of input. A strongly stimulating policy to use wood for energy conversion can result in a shift from other uses of wood as durable material use.
Public acceptance of onshore wind energy
The public acceptance of onshore wind power is the major factor determining the allowable penetration of wind energy.
Open communication, public consultation and careful planning have proven to be beneficial for the chances for project developers as well as for the acceptance of projects in operation. These efforts should be supported by the regional governments, together with a pro-active policy with respect to landscape integration using international ‘best practice’.
8.6 International market orientation of Belgian industry
It is highly probable that the renewable energy sector will grow for several decades.
Technological leads in this sector are therefore valuable opportunities, offering a high and stable export potential. Dedicated efforts should be undertaken to direct current RD&D and industrial competitive advantages to the international renewable energy markets.

Project CP/23 - “Renewable Energy Evolution in Belgium 1974 - 2025”
SPSD II - Part I - Sustainable production and consumption patterns – Energy 102/140

Project CP/23 - “Renewable Energy Evolution in Belgium 1974 - 2025”
SPSD II - Part I - Sustainable production and consumption patterns – Energy 103/140
9 References
Cited references
[3E 03] Inventory of turn-over and employment of selected companies with activities in renewable energy technology – Internal report 3E 2003
[ADEME 02] ADEME, December 2002, ‘Situation des chaufferies bois en Rhône-Alpes’, presentation by Stéphane Gagliardi
[ADEME website] ADEME, ‘Le Programme Bois Energie’, http://www.ademe.fr/Collectivites/bois-energie/pages/Bois-energie/Programme/program0.htm
[AGW 04/07/02] Arrêté du Gouvernement wallon rélatif à la promotion de l’électricité verte, du 04/07/02 [M.B. du 17/08/2002, p. 35354]
[AGW 6/11/03] Arrêté du Gouvernement wallon relatif à l'aide à la production octroyée à l'électricité verte et modifiant l'arrêté du Gouvernement wallon du 4 juillet 2002 relatif à la promotion de l'électricité verte, du 06/11/03 (M.B. du 11/02/2004, p. 8003)
[AMP 00] Pauwels J.-P., Streydio J.-M., Jacquet L. Rapport van de Commissie voor de Analyse van de Productiemiddelen van Elektriciteit en de Reoriëntatie van de Energievectoren (AMPERE° aan de staatssecretaris voor energie en duurzame ontwikkeling, Besluiten en aanbevelingen, Executive summary Pauwels - Streydio; October 2000
[AWE 03] Awerbuch, M. Berger, “Applying portfolio theory to EU electricity planning and policy making”, International Energy Agency, EET/2003/03, February 2003
[BEA website] Barcelona Energy Agency website, solar ordinance information, explicative text in English, http://www.barcelonaenergia.com/pdf/Ordenanza%20Solar%20-%20angles.pdf
[BEL 04] Personal communication Belsolar
[BFE 03] Beroepsfederatie van de producenten en verdelers van elektriciteit in België (BFE) Statistisch jaarboek 2002 2003
[BFE 04] Personal communication BFE, 2004
[BMU website] BMU (German Federal Environment Ministry], website, 28 Nov. 2003, ‘Course is set for promoting solar energy’, available at http://www.bmu.de/en/800/nj/topics/renewableenergy/solar_energy/main.htm
[BXL 04] Ministère de la Region de Bruxelles-Capitale, 1er AVRIL 2004. Ordonnance relative à l'organisation du marché du gaz en Région de Bruxelles-Capitale, concernant des redevances de voiries en matière de gaz et d'électricité et portant modification de l'ordonnance du 19 juillet 2001 relative à l'organisation du marché de l'électricité en Région de Bruxelles-Capitale (1). Publié le : 2004-04-26, Moniteur Belge. TITRE IV. - Modifications de l'ordonnance du 19 juillet 2001.

Project CP/23 - “Renewable Energy Evolution in Belgium 1974 - 2025”
SPSD II - Part I - Sustainable production and consumption patterns – Energy 104/140
[CRE 03] Commissie voor de Regulering van de Electriciteit en het Gas – Commission de Régulation de l’Electricité et du Gaz www.creg.be
[DEI 02] Deimling, S., et al., Leitfaden bioenergie. Planung, betrieb und wirtschaftlichkeit von bioenergieanlagen, Fachagentur Nachwachsende Rohstoffe, Gutzow, 2002
[DEK 01] Deketelaere, K. et al, Handboek Energierecht,2001 Intersentia Rechtswetenschappen Antwperen Groningen ; ISBN 90-5095-157-0
[DEKK 98] Dekker J. et al, ‘European Wind T urbine Standards II’, European Commission, Directorate General for Science, Research and Development JOULE Programme JOR3-CT95-0064. Published by ECN 1998
[DGT 80] Région Wallonne, Situations budgétaires des actions pour les années 80 à 2001, imputation budgétaire section 12 (DGTRE) - programme 01 (énergie)
[DPW 98] Eindverslag (derde fase) Nationaal Programma RD Energie, Diensten voor Programmatie van het Wetenschapsbeleid, depot nr. D/1988/1191/19, 1988
[DW 12/04/01] Décret rélatif à l’organisation du marché régional de l’électricité of 12/04/01 [M. B. du 01/05/2001, p. 1411811]
[EC 93] Commission of the European Communities, Directorate-General XII, Science, Research and Development, JOULE I Programme 1989-1992, Catalogue of Contracts of the Joint Opportunities for Unconventional Longer-term Energies (Brussels, Luxembourg 1993)
[EC 94] European Commission, Directorate-General XII, Science, Research and Development, Research and Technological Development Programme in the field of Non-Nuclear Energy (1990-1994) JOULE II, Project synopses (Brussels, Luxembourg 1994)
[EC 97] European Commission, Directorate-General XII, Science, Research and Development, Specific programme for research and technological development, including demonstration, in the field of non-nuclear energy (1994-1998) JOULE III, Project synopses 1995-96 (Brussels, Luxembourg 1997)
[EC 2001/77/EC] Directive 2001/77/EC of the European Parliament and of the Council of 27 September 2001 on the promotion of electricity produced from renewable energy sources in the internal electricity market, OJEU L 283/33 of 27 Oct 2001, available at: http://europa.eu.int/eur-lex/pri/en/oj/dat/2001/l_283/l_28320011027en00330040.pdf
[EC 2002/91/EC] Directive 2002/91/EC of the European Parliament and of the Council of 16th December 2002 on the energy performance of buildings (OJ L1, 4.1.2003, p. 65-70), available at: http://europa.eu.int/smartapi/cgi/sga_doc?smartapi!celexapi!prod!CELEXnumdoc&lg=EN&numdoc=32002L0091&model=guichett
[EC 2003/30/EC] Directive 2003/30/EC of the European Parliament and of the Council of 8 May 2003 on the promotion of the use of bio-fuels and other renewable fuels for transport, OJEU L123 of 17 May 2003, available at: http://www.europa.eu.int/comm/energy/res/legislation/doc/biofuels/en_final.pdf
[EC 2003/96/EC] Council Directive 2003/96/EC of 27 October 2003 restructuring the Community framework for the taxation of energy products and electricity, OJEU L283/51 of 31 Oct. 2003, available at: http://www.europa.eu.int/comm/energy/res/legislation/doc/biofuels/taxation_energy_products_and_electricity.pdf
[EC 03] European Commission, Directorate General for Transport and Energy, External Costs - Research results on socio-environmental damages due to

Project CP/23 - “Renewable Energy Evolution in Belgium 1974 - 2025”
SPSD II - Part I - Sustainable production and consumption patterns – Energy 105/140
electricity and transport, 2003 (EUR 20198)
[EC 2004/8/EC] Directive 2004/8/EC of the European Parliament and of the Council of 11 February 2004 on the promotion of cogeneration based on a useful heat demand in the internal energy market and amending Directive 92/42/EEC, OJEU L 52 of 21 Feb. 2004 p. 0050 – 0060, available at: http://europa.eu.int/smartapi/cgi/sga_doc?smartapi!celexplus!prod!DocNumber&lg=en&type_doc=Directive&an_doc=2004&nu_doc=8
[EC COM(2002)321 final]
Communication to from the Commission to the Council and the European Parliament, Final report on the Green Paper "Towards a European strategy for the security of energy supply", Brussels, 26.6.2002, COM(2002) 321 final, available at: http://www.europa.eu.int/comm/energy_transport/livrevert/final/report_en.pdf
[EDORA 04] Analyse socio-économique du secteur de la production d’électricité à partir de sources d’énergie renouvelables, A la demande et en collaboration avec EDORA, realisé par IDEA Consult, Institut pour un Développement Durable (IDD), Bruxelles, Juin 2004
[ENE 01] ENERGIE PLUS, Bois et chauffage domestique : flamme verte, l'assurance d'un rendement élevé, Dossier bois énergie - ENERGIE PLUS n°271 du 15 septembre 2001. Article found at: http://www.energie-plus.com/news/archivestory.php/aid/1352/Bois_et_chauffage_domestique_:__flamme_verte,_l'assurance_d'un_rendement_%E9lev%E9.html
[ENE 04] D. Gusbin, B. Hoornaert, Planing Paper 95, Energievooruitzichten voor België tegen 2030, Federaal Planning Bureau, january 2004
[ERG 98] Erge, Th. et al., The German 1000-Roofs-PV-Programme - a Résumé of the 5 Years Pioneer Project for Small Grid-Connected PV-Systems, 2nd World Conference on Photovoltaic Solar Energy Conversion: Proc. of the 2nd World Conference and Exhibition on Photovoltaic Solar Energy Conversion, 6-10 July 1998, Vienna, Austria. Italy: European Commission; Vol. III, p. 2648
[ESD 03] ESD (Energy for Sustainable Development, Ltd), Ecotec, NTUA - RENES, EUFORES, DITEC - Politecnico di Milano, Meeting the Targets and Putting Renewables to Work, Overview Report, Monitoring & Modelling Initiative on the Targets for Renewable Energy – MITRE, project conducted under the Altener II programme of the European Commission Directorate-general Energy & Transport.
[EUG 04] WWF Europe, Eugene label for green electricity. For more information refer to http://www.greenelectricitynetwork.org/
[EUR 02] EUREC Agency, The Future of Renewable Energy 2, March 2002, Brussels, Belgium
[FED 04] Minister voor Economie, Energie, Buitenlandse handel en wetenschapsbeleid, “Het voorontwerp van koninklijk besluit houdende afbakening van de zone van inplanting voor elektriciteitsproductie in de zeegebieden waarin België rechtsmacht kan uitoefenen overeenkomstig het internationaal zeerecht”, februari 2004
[FITZ 03] M. Fitzgerald, The history of PV, website PV Power, http://www.pvpower.com/pvhistory.html, visited May 2004
[G8 01] G8 Renewable Energy Task Force, Final Report, at http://www.renewabletaskforce.org/pdf/G8_report.pdf. General information on G8 activities, http://www.g8.utoronto.ca/ and http://www.g8.gc.ca/. Information on the Renewable Energy Task Force, http://www.renewabletaskforce.org/ )
[GREEN 00] M.A. Green, Photovoltaics: technology overview, Energy Policy, Vol 28 (2000), pp. 989–998
[HAM 03] Hamelinck, C., R. Suurs, and A. Faaij, International bioenergy transport costs

Project CP/23 - “Renewable Energy Evolution in Belgium 1974 - 2025”
SPSD II - Part I - Sustainable production and consumption patterns – Energy 106/140
and energy balance, Utrecht University, Utrecht: 2003.
[HUL 01] Van Hulle F. et al, ‘Harmonisation of European Wind Turbine Certification’, ECN, Geramnischer Lloyd, RISO, Det Norske Veritas, CRES 2001
[HUL 04] Van Hulle, F et al., ‘Optimal Offshore Wind Developments in Belgium’ published by Scientific Support Plan for a Sustainable Development Policy 2004
[IDAE 01] SOLAR-NA-KLAR, a national promotion campaign for solar collectors, available at http://europa.eu.int/comm/energy/en/renewable/idae_site/deploy/prj033/prj033_1.html
[IEA PVPS 03a] IEA PVPS (www.iea-pvps.org), Country Information: Germany, http://www.oja-services.nl/iea-pvps/countries/germany/index.htm
[IEA PVPS 03b] IEA PVPS (www.iea-pvps.org), Country Information: Japan, http://www.oja-services.nl/iea-pvps/countries/japan/index.htm
[IEA 02] ‘IEA Energy Technology R&D Statistics Service’, Energy Statistics Division and the Energy Technology Policy Division of the International Energy Agency, 2002.
[IEA 03] International Energy Agency, Creating Markets for Energy Technologies, Book & CD, Paris, 2003.
[IFIEC 03] Promotion of renewable energies in the EU member states – consequences on the price of electricity. October 2003.
[ILES 70] P.A. Iles, Increased Output from Silicon Solar Cells, 8th IEEE Photovoltaic Specalists Conference, Seattle, WA, USA, August 1970, pp. 345–352
[JAHN 03] U. Jahn, W. Nasse, Performance Analysis and Reliability of Grid-connected PV Systems in IEA Countries, 3rd World Conference on Photovoltaic Energy Conversion, Osaka, Japan, May 2003, CD-ROM
[JREC 02] Joint Declaration by Bulgaria, Cyprus, Czech Republic, Estonia, the European Union, Hungary, Iceland, Latvia, Lithuania, Malta, New Zealand, Norway, Poland, Romania, Slovakia, Slovenia, the Alliance of Small Island States, Switzerland and Turkey, “The way forward on renewable energy”, at http://europa.eu.int/comm/environment/wssd/energy_declaration.pdf . Additional information on the activities of the coalition may be found at http://forum.europa.eu.int/Public/irc/env/ctf/library. The strategic priorities are outlined in http://europa-eu-un.org/article.asp?id=2396
[KATO 02] K. Kato et al., Progress in PV Technology Development under the New Sunshine Program JFY1997-2000 – PV System Technology, 29th IEEE Photovoltaic Specalists Conference, New Orleans, LA, USA, May 2002, pp. 1718–1721
[KB 16/07/2002] Ministère des Affaires Economiques, 16 JUILLET 2002. - Arrêté royal relatif à l'établissement de mécanismes visant la promotion de l'électricité produite à partir des sources d'énergie renouvelables, publié le 23/08/2002
[KfW 02] KfW (Kreditanstalt für Wiederaufbau) press release, Frankfurt, Nov. 11, 2002, ‘KfW awarded loans of EUR 1 billion under its 100,000 Solar Roofs Programme’, available at http://www.kfw.de/Dateien_RSP/pdf/110e.pdf
[KfW 03] KfW ((Kreditanstalt für Wiederaufbau), 100,000 Roofs Solar Power Programme, Programme No. 127, Loans for Photovoltaic Systems in Germany, http://www.kfw.de/EN/Bauen%20Wohnen%20Energiesparen/100,000_roofs_0103.pdf
[KURO 03] K. Kurokawa, Summary Energy from the desert, Report IEA PVPS Task 8, May 2003, available at http://www.iea-pvps.org/ , visited May 2004
Project CP/23 - “Renewable Energy Evolution in Belgium 1974 - 2025”
SPSD II - Part I - Sustainable production and consumption patterns – Energy 107/140
[LIBI 04] ‘Liquid Bio-fuels in Belgium in a global bio-energy context(LIBIOFUELS), Belgian Science Policy, Programme PODOII -VUB, UCL-ECOP, 3E
[NAT website] Natsource, European Environmental Desk Division, European Renewable Markets, website publication, http://www.natsource.com/markets/index.asp?s=103
[NEIJ 03] L. Neij et al., Experience Curves: A Tool for Energy Policy Assessment (EXTOOL), Final project report, ENG1-CT2000-00116 and publishable database, available at http://www.iset.uni-kassel.de/extool/, visited May 2004
[NORD 02] T. Nordmann, Solarstromsystemkosten in Vergangenheit, Gegenwart und Zukunft, 18. Symposium Photovoltaische Solarenergie, Bad Staffelstein, Germany, March 2002, pp. 13–18
[ODE 97] ODE Vlaanderen, De mogelijkheden en belemmeringen voor hernieuwbare energie in Vlaanderen, 1997. Done by: W. De Groote et al.
[OFGEM 03] Ofgem, List of accredited generating stations (RO and CCL), 03/12/2003, http://www.ofgem.gov.uk/temp/ofgem/cache/cmsattach/5290_RO_data_3dec03.xls
[OVER 78] Van Overstraeten, R. et al., Wetenschappelijk eindrapport; Luik: Zonne-energie; Silicium Zonnecellen, Nationaal onderzoeks- en ontwikkelingsprogramma op het gebied van de energie, Katholieke Universiteit Leuven, Departement Electrotechiek, 1978
[PAL 98] G. Palmers et al., A 25 years perspective on the influence and impact of publicly funded PV programs in Europe, the United States and Japan: Proc. of the 2nd World Conference on Photovoltaic Solar Energy Conversion, 6-10 July 1998, Vienna, Austria. Italy: European Commission; Vol. III: pp. 3377-3380
[PALZ 84] Commission of the European Communities' European Solar Radiation Atlas, Vol. 1 (2nd edition). F. Kasten, H. J. Golchert, R. Dogniaux, M. Lemoine. Ed. W. Palz, Verlag TUV Rheinland, Cologne, 1984.
[PEN 98] C. Penche, Layman’s Handbook on How to Develop a Small Hydro Site, 2nd Ed. , CEC DG TREN and ESHA, June 1998, available at http://europa.eu.int/comm/energy/library/hydro/layman2.pdf , visited May 2004
[PER 03] John Perlin, The History of Solar Energy, website California Solar Center http://www.californiasolarcenter.org/history_pv.html
[PLATTS 03] Platts, “Price for Renewable Power Increases Due to New Build Shortfall, According to Platts and the Renewable Power Association”, press release London, January 30, 2003, http://www.platts.com/pressreleases/pressrelease2003-0212.shtml
[PUIG html] J. Puig, The Barcelona Solar Ordinance, available on Eurosolar website, http://www.eurosolar.org/solarzeitalter/solarzeit_3_01-3.html
[PUIG ppt] J. Puig, THE BARCELONA SOLAR ORDINANCE, A case study about how the impossible became reality, presentation at Johannesburg, Aug-Sep. 2002, available at: http://www.uniseo.org/image/energypages/Barcelona.ppt
[RAEE 03] Personal communication with personnel of Rhônalpénergie-Environnement (RAEE), 22 & 23 December, 2003.
[REA 03] Journal trimestriel d'information sur l'énergie en Région wallonne, le Réactif n. 36, p 10, juin, juil, aout 2003, available at: http://energie.wallonie.be/xml/dgtre.html?P=NON&IDC=443&IDD=804
[REIN 02] D. Reinmüller, B. Praetorius, O. Langniss (2002) ‘Sustainable Energy Policy Concepts’, Final Report, International Solar Energy Society, as referred to in M. Bolinger, R. Wiser, Berkely Lab and the Clean Energy Group, ‘Case studies

Project CP/23 - “Renewable Energy Evolution in Belgium 1974 - 2025”
SPSD II - Part I - Sustainable production and consumption patterns – Energy 108/140
of state support for renewable energy: Support for PV in Japan and Germany’, September 2002, available at: http://eetd.lbl.gov/ea/ems/cases/PV_in_Japan_Germany.pdf
[RUYCK 96] DE RUYCK J., Potentieel van durzame energiebronnen voor elektriciteirsproductie in Belgie, VUB, juni 1996.
[SCE 90] Ministère des Affaires Economiques, Administration de l'Energie, Service pour la conservation des énergies, L'action nationale en matière d'Utilisation Rationelle de l'Energie - Bilan, Ministère des Affaires Economiques (doc. Interne), Bruxelles, 1990
[SCHOCK 01] H. Schock, F. Pfisterer, Thin-film solar cells. Past, present ... and future, in: Renewable ENERGY World, Mar—Apr 2001, Vol. 4, N. 2, pp. 75-87, James & James, London
[SETREC-GO 04] Side Effects of Tradable Renewable Energy Certificates (SETREC), as well as the implementation progress of Guarantees of Origin for renewable energy (RE-GO) across Europe, http://www.re-go.info/
[SHAW 02] S. Shaw, M. J. Cremers, G. Palmers (2002), Enabling offshore wind developments, download available at: http://www.3e.be/downloads/Sealegal.pdf
[SIMS 02] Ralph E H SIMS, The brilliance of bioenergy: in business and in practice, James & James, London, 2002.
[solarserver website]
The Solarserver, Act on Granting Priority to Renewable Energy Sources (Renewable Energy Sources Act – EEG), available at http://www.solarserver.de/solarmagazin/eeg-e.html#begruendung source: Hans-Josef Fell
[Soltherm website]
http://www.soltherm.org/solarordinance.htm ,The Solar Bylaw: A succes story from Barcelona, Spain
[SPPS 88] Service de Programmation de la Politique Scientifique, Rapport Final Programme National RD Energie, 1998
[SUR 03] T. Surek, Progress in U.S. Photovoltaics: Looking Back 30 Years and Looking Ahead 20, 3rd World Conference on Photovoltaic Energy Conversion, Osaka, Japan, May 2003, CD-ROM
[TRO 89] I. Troen, E.L. Petersen. European Wind Atlas, Risoe 1989, ISBN 87-550-1482-8
[UN Econ 02a] Johannesburg Declaration on Sustainable Development, available from United Nations Department of Economic and Social Affairs, Division for Sustainable Development, http://www.un.org/esa/sustdev/documents/WSSD_POI_PD/English/POI_PD.htm
[UN Econ 02b] Plan of Implementation of the World Summit on Sustainable Development, available from United Nations Department of Economic and Social Affairs, Division for Sustainable Development, at: http://www.un.org/esa/sustdev/documents/WSSD_POI_PD/English/WSSD_PlanImpl.pdf (separate chapters downloadable from: http://www.un.org/esa/sustdev/documents/WSSD_POI_PD/English/POIToc.htm )
[UNCBD 92] United Nations Convention on Biological Diversity, http://www.biodiv.org/doc/legal/cbd-en.pdf
[UNCED 92a] Rio Declaration on Environment and Development available at: http://www.un.org/documents/ga/conf151/aconf15126-1annex1.htm
[UNCED 92b] Agenda 21, downlaodable at: http://www.un.org/esa/sustdev/documents/agenda21/english/agenda21toc.htm

Project CP/23 - “Renewable Energy Evolution in Belgium 1974 - 2025”
SPSD II - Part I - Sustainable production and consumption patterns – Energy 109/140
[UNCED 92c] Non-legally binding authoritative statement of principles for a global consensus on the management, conservation and sustainable development of all types of forest, http://www.un.org/documents/ga/conf151/aconf15126-3annex3.htm
[UNCHE 72a] Declaration of the United Nations Conference on the Human Environment, available at: http://www.unep.org/Documents/Default.asp?DocumentID=97&ArticleID=1503
[UNCHE 72b] Action Plan for the Human Environment, available at: http://www.unep.org/Documents/Default.asp?Docume ntID=97&ArticleID=1504
[UNCHE 72c] Recommendations for Action at the international level, available at: http://www.unep.org/Documents/Default.asp?DocumentID=97&ArticleID=1506
[UNFCCC 92] United Nations Framework Convention on Climate Change, http://unfccc.int/resource/docs/convkp/conveng.pdf
[UNFCCC 97] Kyoto Protocol to the United Nations Framework Convention on Climate Change http://unfccc.int/resource/docs/convkp/kpeng.pdf
[UNFCCC 01] Report of the Conference of the Parties on its seventh session held at Marrakesh, from 29 October to 10 November 2001. Part one: Proceedings (http://unfccc.int/resource/docs/cop7/13.pdf ), Addendum, Part two: Action taken by the conference of the Parties, Vol. I (http://unfccc.int/resource/docs/cop7/13a01.pdf ), Vol. II (http://unfccc.int/resource/docs/cop7/13a02.pdf ), Vol. III (http://unfccc.int/resource/docs/cop7/13a03.pdf ), Vol. IV (http://unfccc.int/resource/docs/cop7/13a04.pdf )
[VDB 00] Van den Broek, R. van den, Electricity from biomass: impact assessment in Nicaragua, Ireland and the Netherlands, Universiteit Utrecht, publisher: Eburon (Delft), Utrecht: 2000.
[VDB 03] Van den Broek, R., M. van Walwijk, P. Niermeijer, and M. Tijmensen, Biofuels in the Dutch market: a fact finding study, NOVEM Report 2GAVE03.12, Ecofys, 2003 : Utrecht.
[VDN 03a] Verband der Netzbetreiber VDN e.V. beim VDEW, Aktuelle Daten zum Enerneuerbare-Energien-Gesetz (EEG), www.vdn-berlin.de/aktuelledaten_eeg.asp . Accessed Nov. 11, 2003
[VDN 03b] Verband der Netzbetreiber VDN e.V. beim VDEW, Entwicklung bei EEG 2000 – 2008, PDF-download on http://www.vdn-berlin.de/eeg_mittelfristprognose.asp
[VITO 04] Personal communication VITO 2004 – The performance of most demonstration projects have been monitored by VITO
[VYN 96] Personal communication Vyncke, 1996
[WCED 87] World Commission on Environment and Development, Our Common Future (1987)
[WEISS 02] I. Weiss, P. Spraus “100,000 roofs and 99 Pfennig – Germany’s PV financing schemes and the market”, work carried out in the framework of the IEA PVPS programme, published in Renewable Energy World Jan-Feb. 2002, http://www.jxj.com/magsandj/rew/2002_01/weiss.html#author
[WOYT 03] A. Woyte, Design Issues of Photovoltaic Systems and their Grid Integration, PhD Thesis, K.U.Leuven, Fac. Toegepaste Wetenschappen, Leuven, Belgium, December 2003.
[WSS 96] Harare Declaration on Solar Energy and Sustainable Development, at http://www.gta.gov.zw/zoc/Hre%20Declaration.htm

Project CP/23 - “Renewable Energy Evolution in Belgium 1974 - 2025”
SPSD II - Part I - Sustainable production and consumption patterns – Energy 110/140
General references
[AIE 79] AIE, Politiques et programmes de politiques énergétiques des pays membres de l'AIE. Examen 1978, Paris, OCDE, 1979
[AIE 83] AIE, Politiques et programmes de politiques énergétiques des pays membres de l'AIE. Examen 1981, Paris, OCDE, 1983
[AIE 84] AIE, Politiques et programmes de politiques énergétiques des pays membres de l'AIE. Examen 1983, Paris, OCDE, 1984
[AIE 85] AIE, Politiques et programmes de politiques énergétiques des pays membres de l'AIE. Examen 1984, Paris, OCDE, 1985
[AIE 86] AIE, Politiques et programmes de politiques énergétiques des pays membres de l'AIE. Examen 1985, Paris, OCDE, 1986
[AIE 87] AIE, Politiques et programmes de politiques énergétiques des pays membres de l'AIE. Examen 1986, Paris, OCDE, 1987
[AIE 88] AIE, Politiques et programmes de politiques énergétiques des pays membres de l'AIE. Examen 1987, Paris, OCDE, 1988
[AIE 89] AIE, Politiques et programmes de politiques énergétiques des pays membres de l'AIE. Examen 1988, Paris, OCDE, 1989
[AIE 90] AIE, Politiques et programmes de politiques énergétiques des pays membres de l'AIE. Examen 1989, Paris, OCDE, 1990
[AIE 92] AIE, Politiques énergétiques des pays l'AIE, Paris, OCDE, 1992
[AN 00] Délégation de l'Assemblée Nationale pour l'Union Européenne, Rapport d'information sur les biocarburants dans l'Union Européenne, Assemblée Nationale, 4/5/2000, France
[APERE 01] APERE, Aides à l'investissement appliquées dans des pays de l'Union européenne, rapport du 28 juin 2001, Namur, Cabinet du Ministre des Transports, de la Mobilité et de l'Energie, 2001
[BER 98] BERNA G., Integrated biomass system, European Commission - DG XII/E.2, 1998, Luxembourg
[DEHO 00] DEHOUSSE, F., TSONKA, I., L'Europe de l'énergie: un projet toujours reporté in Courrier hebdomadaire, n° 1698-1699, CRISP, Bruxelles, 2000
[DEMU 87] M. DEMUYNCK, E.J. NYNS, W. PALZ, Installations de biogaz en Europe: un guide pratique, Commission des Communautés Européennes CECA -CEE-CEEA, Bruxelles, Luxembourg, 1987.
[DGTRE 01] DGTRE, Situations budgétaires des actions pour les années 1980 à 2001
[ECOTEC 01] Ecotec Research and consulting Ltd. And A. Mourelatou, Renewable Energies: success stories, European Environment Agency, Copenhagen, Denmark, 2001
[ELEC 00] Electrabel, Rapports d'activités 2000 Electrabel, pp 80-89
[ENGS 99] ENGSTRÖM Folke, Overview of power generation from biomass, Foster Wheeler Development Corporation, New Jersey; Paper presented at the 1999 Gasification Technology conference - San Fransico
[ESD 96] ESD ltd, TERES II country report - Belgium, European Commission, DGXVII, 1996
[EURO 01] EUROSTAT, Renewable energy sources statistics in the European Union, data 1989-1998, Eurostat, 2001.
[FAAI 95] Faaij, A., Lammers, G., A.A.C.M. Beenackers, Biomass gasification activities in The Netherlands and Belgium, Country reports on The Netherlands and Belgium in the context of the concerted action project "Analysis and

Project CP/23 - “Renewable Energy Evolution in Belgium 1974 - 2025”
SPSD II - Part I - Sustainable production and consumption patterns – Energy 111/140
coordination of the activities concerning gasification of biomass" (AIR-PL94-2284), within the framework of the CEC-AIR program, Department of Science Technology and Society, Utrecht University and Department of Chemical Engineering, University of Groningen, September 1995
[GASI website] Gasifier inventory: http://www.gasifiers.org/
[GERI 01] GERIN P., Biométhanisation: valorisation énergétique de biomasses humides, scientific paper, UCL, 2001.
[IW 93] Institut Wallon, Enquête sur les énergies renouvelables et leur contribution dans le bilan énergétique pour la Belgique 1991, Namur, mars 1993.
[IW 96] Institut Wallon, Inventaire des energies renouvelables en Belgique 1995, Namur, Sept. 96
[JOSS 03] JOSSART, J.M., Les biocarburants en Wallonie, version provisoire, Valbiom - FarrWal, 2003
[KEUK 97] DE KEUKELEERE D., Biomasse als energiedrager in Vlaanderen, in: Energie en milieu, 4 juli 1997, pp 159-164.
[KRAE 97] Kræmer, T. P. and Stjernström, L., Energy policy instruments, Description of Selected Countries, AFK Forlaget, Institute of local government Studies, Denmark 1997. Countries used: France, Belgium
[LEQU 90] P. LEQUEUX, J. CARRE, J. HEBERT, L. LACROSSE et Y. SCHENKEL, Energie et Biomasse, la denseification, Les presses agronomiques de Gembloux asbl, GEMBLOUX, 1990.
[LOVI 02] DE LOVINFOSSE I. et VARONE F. (2002), Belgium, in Danyel Reiche (ed.), Handbook of Renewable Energies in the European Union. Case Studies of all Member States, Berlin: Peter Lang Publishing, pp. 49-62.
[McKE 01] McKENDRY P., Energy production from biomass, part II: conversion technologies, in Bioresource technology, Elsevier, 2001
[MEUN 97] MEUNIER F., Une promotion de la cogénération de qualité, Journée d'études Cogensud 31/10/97, Namur
[MINECO 90] Ministère des Affaires Economiques, Administration de l'Energie, Service pour la conservation des énergies, L'action nationale en matière d'Utilisation Rationelle de l'Energie - Bilan, Ministère des Affaires Economiques (doc. Interne), Bruxelles, 1990
[NOVA 01] NOVAK M.H., Contribution de VALONAL aux travaux de la DG TREN, Valonal, 2001
[OLES 98] OLESEN G., VIKKELSO A., Financial analysis of the integrationof renewables in electricity supply, final report, Joule-Program, European Commission, 1998 (cordis.lu)
[POLI 00] POLITO Paola, Institutional and legal aspects regulating wood energy activities in European countries, FAO, Rome, 2000.
[RAMA 96] RAMAGE, J., SCURLOCK, J, BIOMASS in RENEWABLE ENERGY. Power for a sustainable future, edited by G. Boyle, Oxfor University Press & The Open University, Oxford, 1996, pp 137-182
[RUYCK 97] DE RUYCK J., De VUB biomassa-vergassingscentrale in de startblokken, in: Energie en milieu, 4 juli 1997, pp 78-182.
[SAVA 02] SAVAT P., From innovation to operational assistance; vision d'Electrabel sur la biomasse énergie, LABORELEC, 19/11/2002.
[SCHE 00] SCHENKEL Y., GUYOT M., Standardisation of solid biofuels in Belgium, Centre wallon de Recherches Agronomiques de Gembloux (CRA) 2000.
[SINS 01] SINSTZOFF I., MARTIN J., MENU J.F., TEMMERMAN M., THIRY J., TYTECA D., DE RAEDT W., CASELLA E. CEULEMANS R., DUBUISSON X., JOSSART J.M., LEDENT, WOODSUSTAIN, contributions of wood energy to sustainable

Project CP/23 - “Renewable Energy Evolution in Belgium 1974 - 2025”
SPSD II - Part I - Sustainable production and consumption patterns – Energy 112/140
development in Belgium, SSTC, Brussels, June 2001. Synthesis report, http://www.belspo.be/belspo/home/publ/pub_ostc/CG2131/rCG25s_en.pdf . (Full report, WOODSUSTAIN : Contributions des filières bois-énergie au développement durable en Belgique, available at: http://www.belspo.be/belspo/home/publ/pub_ostc/CG2131/rCG25_fr.pdf )
[SORG 97] SORGHAL, Evolution of rape in Belgium and its utilisation as biofuel, BIOBASE, 1997
[SUR 01] SURAUD M., La biomasse: activité alternative au developpement des zones rurales, Master in European Studies, Université Catholique de Louvain, 2001.
[VANH 95] VANHOOF B., Energy from biomass in Belgium : an assesment of the possibilities, VITO, Energy division, 1995.
[VDB 00] Van den BROEK, R., Sustainability of biomass electricity systems, Uitgeverij Eburon, Delft, 2000
[VTT 2002] VTT Technical Research Centre of Finland, Review of Finnish biomass gasification technologies, OPET Finland. Available at: http://www.tekes.fi/opet/pdf/OPET_Report4_2002.pdf
[WALK 80] WALKER G., Stirling engines, Oxford science publications, 1980, New York

Project CP/23 - “Renewable Energy Evolution in Belgium 1974 - 2025”
SPSD II - Part I - Sustainable production and consumption patterns – Energy 113/140
Annex A : Fiscal deductions in 1983 – 1989 for the energy sector
Figure 41 shows the evolution and composition of fiscal deductions for the energy sector as a whole in the period 1983 - 1989. The repartition of this type of support is the sector with the most consistent and significant reductions, with fossil fuel investments also playing a relatively significant role. Deductions for renewable energy investments have show n to be mainly for biomass, although solar and hydro have also benefited to a small extent from this scheme.
0
20
40
60
80
100
1983 1984 1985 1986 1987 1988 1989
M€
Biomass Fossil Auxiliairy technologies & others Solar RUE Waste
Figure 41 : Fiscal Deductions according to energy sector (1983-1989)

Project CP/23 - “Renewable Energy Evolution in Belgium 1974 - 2025”
SPSD II - Part I - Sustainable production and consumption patterns – Energy 114/140

Project CP/23 - “Renewable Energy Evolution in Belgium 1974 - 2025”
SPSD II - Part I - Sustainable production and consumption patterns – Energy 115/140
Annex B : Selection of regional R&D, investment subsidies and related programmes
Flanders
On 19 December 1991 the Flemish regional government approved the Flemish Impulse programme on Energy Technology (VLIET), for the 4-year period 1992-1995. A budget of 19.8 M€ (800 million BEF) was reserved in the framework of the Fund for Industrial Research in Flanders (FIOV), with the goal of strengthening the base of energy technology research in Flanders. The programme officially started in October 1992. By the end of the programme in 1995, of the 2/3 of the allocated support budget approved (13.1 M€), 35% was granted to projects with renewable energies (approx. 4.6 M€).
20%
15%
35%
10%
20%
Heating & ventilation of buildings
Rational use of energy industrialthermal processes
Renewable energy
Electrical traction & transformation
Combustion energies & hybridaction
Figure 42 : Split -up of the budget of the Fund for Industrial Research in Flanders
A sub-programme for energy policy studies (budget 1.98 M€) was envisaged for 1996, however, due to the lack of energy policy priorities in the Flemish region, the call for projects was postponed from 1996 to 1998, together with the second call for energy research projects under the second Flemish Impulse programme on Energy Technology (VLIETbis). In the second call (VLIETbis), the sub-programme for energy policy studies was reactivated and approved in April 1998, with 12 of 34 project applications approved to a total project support of 1.98 M€ (~ 80 MBEF). Under this programme, only 1 project focussed on renewable energy (wind), the remaining projects focussing on RUE.
In terms of industrial research programmes under VLIETbis, approved in July 1998, 16 (4 of which in renewable energy) of 24 project applications were selected for a total support budget of 4.58 M€ (184.9 MBEF).
Thus the total spending from 1994-1999 under the VLIET, VLIETbis and energy policy programmes (in 2001€) amount to almost 24 M€, though no separate figures are available for support to renewable energy technologies.
There was no third call in the VLIET programme. At the end of 1998, a new policy preparation programme, “Programme Beleidsgericht Onderzoek”, was launched with a total budget of 6.57 M€ (265 MBEF), targeting researchers in Flemish universities, Engineering schools and scientific research institutes. In the energy field, focus was directed towards the legal and financial framework for a liberalised electricity market.

Project CP/23 - “Renewable Energy Evolution in Belgium 1974 - 2025”
SPSD II - Part I - Sustainable production and consumption patterns – Energy 116/140
Walloon Region
A number of renewable energy support measures exist in the Walloon region, including schemes for directing public investment to renewable energy as well as regulatory measures for the private sector. An overview of budget commitments for renewable energy and the energy sector as a whole for the 20-year period 1981-2000 is shown in Figure 43. The total budget for actions in energy for 1981-2000 was approximately 240 M€, of which 18 M€ (< 8%) was spent on renewable energy actions. The total budget includes money set aside for subsidies, studies, research, development, demonstration, capacity building activities etc. In addition to renewable energy, the programme covers projects in the sectors of rational use of energy, and non-renewable energy sectors.
0
5.000
10.000
15.000
20.000
1981
1982
1983
1984
1985
1986
1987
1988
1989
1990
1991
1992
1993
1994
1995
1996
1997
1998
1999
2000
Year
Amou
nt (
nom
inal
) (k
€)
Total All Energy Total Renewable Energy
Figure 43 : Budgets for actions in the energy sector in Walloon Region
Brussels Capital Region
The total budget allocated over the period 1991-2002 by the Brussels Capital region for actions in rational use of energy came to approximately 18.8 M€, of which roughly 14.6 M€ was actually attributed to projects. An overview of budget commitments for rational use of energy for the period 1991-2002 is shown in Figure 44 below. The figure indicates that there is more efficient use of the budget in recent years compared to the beginning of the programme. There is no indication as to the repartition of the budget for renewable energy actions, but it would be expected that this would be minimal. The total budget includes money set aside for subsidies, studies, RD&D, capacity building, overheads etc.

Project CP/23 - “Renewable Energy Evolution in Belgium 1974 - 2025”
SPSD II - Part I - Sustainable production and consumption patterns – Energy 117/140
0
200
400
600
800
1.000
1.200
1.400
1.600
1.800
2.000
1991 1992 1993 1994 1995 1996 1997 1998 1999 2000 2001 2002
Year
k€
Budget allocated Budget actually attributed
Figure 44 : Public budget for energy policy activities in Brussels-Capital region

Project CP/23 - “Renewable Energy Evolution in Belgium 1974 - 2025”
SPSD II - Part I - Sustainable production and consumption patterns – Energy 118/140
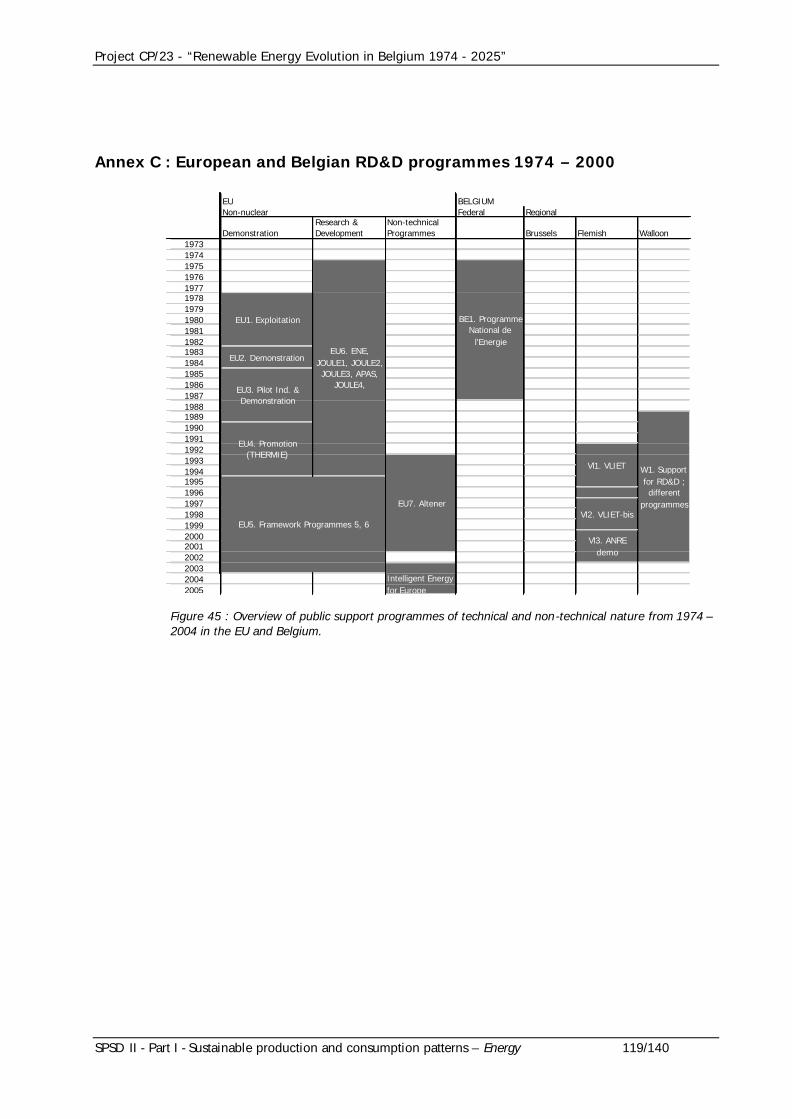
Project CP/23 - “Renewable Energy Evolution in Belgium 1974 - 2025”
SPSD II - Part I - Sustainable production and consumption patterns – Energy 119/140
Annex C : European and Belgian RD&D programmes 1974 – 2000
EU BELGIUMNon-nuclear Federal Regional
DemonstrationResearch & Development
Non-technical Programmes Brussels Flemish Walloon
197319741975197619771978197919801981198219831984198519861987198819891990199119921993199419951996199719981999200020012002200320042005
W1. Support for RD&D ; different
programmes
Vl3. ANRE demo
EU7. Altener
BE1. Programme National de
l'Energie
Vl1. VLIET
Vl2. VLIET-bis
EU3. Pilot Ind. & Demonstration
EU4. Promotion (THERMIE)
EU6. ENE, JOULE1, JOULE2, JOULE3, APAS,
JOULE4,
EU5. Framework Programmes 5, 6
EU1. Exploitation
EU2. Demonstration
Intelligent Energy for Europe
Figure 45 : Overview of public support programmes of technical and non-technical nature from 1974 – 2004 in the EU and Belgium.
Project CP/23 - “Renewable Energy Evolution in Belgium 1974 - 2025”
SPSD II - Part I - Sustainable production and consumption patterns – Energy 120/140

Project CP/23 - “Renewable Energy Evolution in Belgium 1974 - 2025”
SPSD II - Part I - Sustainable production and consumption patterns – Energy 121/140
Annex D : National policies of interest in the EU-15 and IEA member states
D1. Austria: Biomass district heating deployment (BMDH)
Policy Objectives
The deployment of the BMDH was a result of both local initiatives and public policy. The objectives of this initiative are therefore considered at two levels. At the local level (the forerunner of the initiative) the objective was three-fold: environmental protection, enhanced heating comfort, and sustainable local development. At the public policy level, the main objective was to support agriculture by giving farmers a new source of income. In a later phase of deployment, environmental motives (climate change and renewable energy targets) were cited as additional objectives.
Design and Development
The deployment of BMDH started as a bottom-up process, thus at the outset there was no planned technology-deployment policy and strategy. Individual farmers, supported by a regional development agency, developed the idea and realised the first projects, whose success created general interest. Policy support subsequently arose, mainly as a reaction to the bottom-up development that was already occurring.
The introduction of BMDH was not managed at a national level but at the level of the federal states (Länder), and there was therefore no systematic programme design and strategy across states. However, the design of different state programmes followed the same general lines, involving:
§ Creation of a subsidy scheme for BMDH investments
§ Provision of funding for 1 or 2 persons to act as facilitators and help farmers to set up their projects
Although programme management was done at the provincial level, the national ministry of agriculture provided significant financial resources for the programme. The main policy mechanism was the provision of investment subsidies, in the form of soft loans and direct financial subsidies, with a corresponding net cash value of about 50% of total investment cost.
Funds provided by the federal ministry were complemented by almost equal amounts by the federal provinces. National funds (federal ministry) provided for the programme grew progressively with the demand. The total funding of 23.4 M€ provided in 1999 was composed of 11 M€ from the federal ministry, 7.3 M€ from the federal states and 5.1 M€ from the European Union. These subsidies were only available for farmers. Commercial operators e.g. sawmill owners could only receive subsidy via other sources of funding, such as the 30% subsidy available through the environmental fund of the environment ministry. Another indirect financial support was the reduced level of VAT applied on the primary resource, wood – 10% VAT compared to 20% VAT generally.
Another important feature of the programme was the funding of facilitators who promoted the initiative and provided administrative and managerial assistance to project developers in all stages of project development.
Although R&D was not part of the state deployment, it proved to be an important factor contributing the overall programme development. R&D policy support was provided at the national level and only informally connected to the state-level deployment programmes. One R&D programme for industry provided 50% support for R&D in SMEs. Long-term R&D programmes of the then ministry of science and research also provided funding for R&D. National funds for biomass research during the 1990s amounted to around 5 M€/year.

Project CP/23 - “Renewable Energy Evolution in Belgium 1974 - 2025”
SPSD II - Part I - Sustainable production and consumption patterns – Energy 122/140
Actors & Participants
A description of the main actors and participants in the programme, and their roles are defined in the following table.
Table 18 : Main actors and participants in the Austrian BMDH initiative
Actor/participant Characteristics and Role
Local promoters
Farmers
Typically highly motivated, well-respected young residents of the community.
§ Motivate village and get consensus in the village to realise the project.
§ Develop and operate the BMDH.
Targets/recipients of government funding for BMDH implementation.
Focal point of given federal state
Can be agricultural chamber, state energy agency, consultant, state civil servant.
§ Assists local promoters in all aspects of project development: feasibility studies, administrative procedures for obtaining subsidy, advice on creating co-operative, developing project, customer contracts.
§ Acts as a point of contact between technology supplier and users.
§ Promoted the initiative amongst village mayors in the state.
§ Played key role in ex ante and ex post project evaluation.
State and federal officials
Responsible for subsidies.
Federal state politicians Provision of financial resources in accordance with rapidly expanding market
Planners Small companies of few employees and large project portfolio. Conducted the design of BMDH systems.
Research bodies & industry
Improved combustion technology by reacting flexibly to sudden demand created by BMDH for reliable and environmentally sound combustion systems.
Monitoring, evaluation, results
Monitoring and evaluation was done primarily at the project level. Here, a key role was played by the focal points who performed an in-depth evaluation of each project before submitting it for subsidy approval. They also conducted ex post evaluation by maintaining contact with individual plant operators such as via annual meetings.
On the other hand, there was no regular evaluation at the programme level, namely with regards to the federal subsidy programme. The first evaluation for the national level was only made 10 years after the start of the programme. A number of state level evaluations were also made following this.
At the state level, the disaggregated and independent nature of the programmes meant that there was no consistent monitoring and evaluation of the overall process, nor of the focal points who played a critical role in deployment and the overall success of the programme. These deficiencies in the monitoring and evaluation process were identified as sources of inefficiency in overall programme effectiveness, but which, fortunately, in the end were not detrimental to its success.
In terms of results, the programme is seen as successful from the point of view of technology implementation. By 2000, more than 500 BMDH plants were implemented in Austria. Although, the overall energy contribution of these plants remains relatively small, the programme helped to create a positive image of biomass heating, with reported high levels of customer satisfaction.

Project CP/23 - “Renewable Energy Evolution in Belgium 1974 - 2025”
SPSD II - Part I - Sustainable production and consumption patterns – Energy 123/140
Development of mature plant technology is also identified as a success, although emphasis is placed on the importance of achieving this in a timely manner (as was not necessarily the case in the programme) so as to enhance deployment efficiency.
The main factors of success identified for the programme were:
§ Provision of significant subsidies
§ Significant bottom-up interest to initiate and realise projects
§ Provision of focal points for assistance in project development
§ Abundance of cheap biomass resources in Austria
D2. France: Wood-based heating systems in the region Rhône-Alpes
Policy Objectives
The objective of the regional programme is to encourage effective management and use of natural energy resources, as well as general environmental improvement, through the increased deployment of wood-based heating systems for individual and collective and district heating.
There is no quantitative target for the programme.
Design and Development
The Rhône-Alpes region has supported the use of wood-based heating systems for over 20 years via regional subsidies [RAEE 2003]. In 1994 the Agence de l’Environnement et de la Maîtrise de l’Energie (ADEME) implemented a first national support programme for wood energy usage, the “Plan Bois”, for the period 1994-1999. The programme aims for the development of wood heating systems and in its first stage involved 11 regions, enabling the realisation of 190 heating systems. The programme was renewed for the period 2000-2006 under the name of “Bois-Energie”, this time involving all regions. In some regions, such as the Rhône-Alpes, the programme of ADEME is further enhanced trough a State-Region Plan Contract (Contrats de Plan Etat -Regions) in which further subsidies are given by the region in question [ADEME website].
ADEME sets maximum levels of support for investments in wood-based systems depending on the sector in which the investment is to be done, and whether it is a demonstration project or more established technology.
Table 19 : Maximum levels of support offered by ADEME for wood-based heating systems [Source: ADEME website]
Sector Project type Maximum aid
Industrial heaters
Demonstration
Other
30% (40% SME)
15%
Individual systems & districy heating
Demonstration
Other
40%
30%
The design of the State-Region contract in the Rhône-Alpes region is an equal contribution of each partner to the financing of wood-based heating projects for individual and collective and district heating systems.
With the regional aid, subsidies may therefore be up to 60 %. In addition to regional and national aid, some departments of the region may provide additional funding, bringing the maximum level of aid to about 80 % [RAEE 2003].
The investment subsidy scheme is supported by information dissemination and awareness activities.

Project CP/23 - “Renewable Energy Evolution in Belgium 1974 - 2025”
SPSD II - Part I - Sustainable production and consumption patterns – Energy 124/140
Actors & Participants
The main sources of the financial support are the Agence de l’Environnement et de la Maîtrise de l’Energie (ADEME) at the national level, and the Rhône-Alpes regional government.
Rhônalpénergie-Environnement (RAEE) also plays a supportive role in this scheme as it actively promotes the scheme through the co-ordination of information and awareness programmes by local associations and by assisting districts in their choice and usage of different energy sources, and in the implementation of energy policies and programmes.
Monitoring, evaluation, results
There is no quantitative target at regional level, and there does not appear to be a defined system of programme evaluation. However, the regional government is able to monitor the level of implementation through the number of projects it finances. Moreover, ADEME keeps an inventory of the installations financed under its programmes.
Results gathered by ADEME [ADEME 2002] show however that there has been a significant increase in the implementation of individual, collective and district wood-based heating systems in the Rhône-Alpes since the start of the first programme “Plan Bois” and even more so under the new “Bois-Energie” programme, with the combination of regional aids.
0
10
20
30
40
50
60
1981 1984 1986 1991 1993 1995 1997 1999 2001
Figure 46: Evolution of implementation of heaters in Rhône-Alpes with national programmes (“Plan Bois” 1994-1999, “Energie-Bois” 2000-2006) and regional aids (Source: [ADEME 2002]) expressed
At the end of 2002, 210 non-industrial heating systems had been implemented – 78 collective public systems, 66 collective private systems, and 66 individual systems – the majority of which during the period 1998-2002 as can be seen from the diagram above. The total capacity by end-2002 was 68 MW, corresponding to a primary energy savings of 14,000 tonnes oil equivalent, and a carbon dioxide savings of 12,500 tC [ADEME 2002]. A further 140 projects were underway of >60 MW capacity and corresponding to a primary energ y savings of 12,000 tonnes oil equivalent, and a carbon dioxide savings of 10,000 tC
It is important to note the significance of the additional support providad at regional level in achieving the above results.

Project CP/23 - “Renewable Energy Evolution in Belgium 1974 - 2025”
SPSD II - Part I - Sustainable production and consumption patterns – Energy 125/140
To end-2002, the contribution of the region to the financing of collective projects (private and public) has been slightly superior to that provided by ADEME, and with respect to individual heating systems, regional aid has accounted for more than 25% of the 1M€ of investments made in the sector.
The positive trend of implementation is expected to continue to the end of the programme in 2004.
D3. Germany: PV market deployment programme
Policy Objectives
The underlying aim of the German government is to incre ase the proportion of electricity generated from renewable energy sources in the final national electricity consumption in 2010, and to decrease the country’s carbon dioxide emissions. Targets identified are a doubling of the share of renewables in electrical power generation from 5% in 1999 to 10% in 2010 [IEA PVPS, 2003a], and decreasing CO2 emissions by 25% by 2005 [WEISS 2002].
The specific combined target for PV is to achieve an additional installed capacity of 300 MWp by end-2003.
Design and Development
The main policy programmes for supporting the deployment of PV technology in Germany are the 100,000 Roof PV programme, and the Renewable Energy Law (EEG).
The predecessor to the 100,000 Roof PV programme was the 1,000 Roof PV programme of 1991 – the first major solar installation initiative worldwide. Under the 1,000 Solar Roofs Programme, the federal government and some federal states granted a fixed sum per kW installed PV power, or an investment subsidy. The 1,000 Solar Roofs Programme provided rebates for up to 60% of PV system costs, and by the end of the programme in 1995, a total of 2,250 systems were installed on roofs of private houses, totalling about 5.25 MWp. The Programme led to the optimisation of system components, increased installation know-how, scientific analysis of monitoring data and regulations for grid connection.
The 100,000 Roof PV programme was implemented on 01 Jan. 1999, with the goal of installing 300 MWp grid-connected PV by end-2003 over a period of 4 years, as shown in the table below [WEISS 2002]:
Table 20 : German targets for additional grid-connected PV capacity under the 100,000 Solar Roofs Programme
Target 1999 2000 2001 2002 2003
Additional capacity (MWp) 10 50 65 80 95
Cumulated additional capacity (MWp)
10 60 125 205 300
The programme supports the installation or extension of grid-connected PV systems with a minimal peak nominal power of 1 kWp. Financial support is granted via the provision of low interest loans issued by the “Kreditanstalt für Wiederaufbau” (KfW), the state development bank of the Federal Government. Low interest loans (rate of 1.9% (Nov. 2002) [KfW 2002]) are provided to investors in PV systems – private individuals, independent professionals and small and medium enterprises. The financing share per project is shown in the following table:
Table 21 : German Loans for PV systems under the 100,000 Solar Roofs Programme (Source: [KfW 2003])
Installed capacity (kWp) Loan amount (€/kWp)
For first 5 kWp 6,230
For share of capacity >5 kWp 3,115
Project CP/23 - “Renewable Energy Evolution in Belgium 1974 - 2025”
SPSD II - Part I - Sustainable production and consumption patterns – Energy 126/140
The possible share of financing is up to 100% up to a maximum of 500,000 €. Funds under the 100,000 Solar Roofs Programme may be cumulated with funds with public authorities, upon which the loan amount is reduced by the amount granted (in loans, subsidies etc.) through other public sources.
The maximum loan repayment period is 10 years, with no down-payment required and no interest payments for up to 2 years during the start-up phase.
The financing package corresponds to a subsidy of approximately 20% [REIN 2002]. On 23 rd June 2003, on the expectation that the 300 MWp programme target would soon be reached, the KfW announced a deadline for the loan programme as 30th June 2003.
The Renewable Energy Sources Act (Erneuerbare Energien Gesetz (EEG)), in effect since April 2001, is an updated and improved version of Germany’s feed-in law (Stromeinspeisungsgesetz für Erneuerbare Energien (StrEG), in effect since January 1991). Although the previous StrEG was important for the development of the wind energy sector, it did not provide sufficient tariffs to significantly stimulate the PV market. Under the EEG, the compensation tariff paid to electricity generated from PV was increased nearly 6-fold compared to the old feed-in law, to 0.99 DEM/kWh (~0.51 €/kWh), over a period of 20 years. From 2002, the tariff declines by 5% each year to encourage cost reductions (tariff in 2002 is 0.94 DEM/kWh or 0.481 €/kWh) [solarserver website]. The programme is set to remain in place until 1 year after Germany’s installed PV capacity reaches 350 MW, that is 300 MW of additional capacity with respect to the capacity installed at the time of writing of the EEG (50 MW). This is in accordance with the goal of the 100,000 Solar Roofs Programme. However, the EEG foresees the implementation of a follow-up compensation scheme – the new compensation scheme has been adopted since 27 Nov. 2003 [BMU website].
The EEG also stipulates priority access and purchase obligation for electricity generated renewable sources, according to the stipulated tariffs.
Actors & Participants
In the 100,000 Solar Roofs Programme, the KfW (German Credit Institution for Reconstruction) (an executing institution of the federal government) is the responsible governmental authority for providing loans, administered and granted through local credit institutions. Applications for the loan are therefore submitted to the applicant’s main bank and filed with a credit institution of the borrower’s choice.
Under the EEG, it is the grid operators who, under obligation, pay the preferential PV tariffs, and these costs are eventually passed on the consumer.
Monitoring, evaluation, results
Under the 100,000 Solar Roofs programme, PV projects are evaluated at the moment of loan application by the credit institution granting the loan, who ensure that eligibility criteria are met, that stipulations concerning the cumulation of promotional funds are respected, and that funds are used in the intended and proper manner. In this respect, the applicant is obliged to supply the relevant documentation. In particular with respect to proper use of funds – the applicant is required to show proof of implementation, generally immediately after the investment has been made but not later than 9 months after the loan has been made. The data required for monitoring is therefore provided through the application and follow-up procedures.
Under the EEG, the progress achieved in terms of market introduction and cost of development of renewable energy installations (in general) is analysed every two years, with adjustments made to the compensation tariffs where necessary. After the end of the scheme, the government will implement a follow-up compensation scheme based on the results of programme evaluation and market conditions.
In a report by the KfW, the total volume of loans granted by Nov. 2002, under the 100,000 Solar Roofs programme, reached approximately 1 billion €, financing a nominal solar PV output of 190 MW. The power generated is capable of meeting the energy needs of 50,000 private households and enables a carbon dioxide reduction of approximately 100,000 tons/year [KfW 2002].
In terms of the EEG, statistics for the annual amount of kWh generated by PV systems and fed into the grid are not transparent. The table below is based on the official statistics edited by the Union of
Project CP/23 - “Renewable Energy Evolution in Belgium 1974 - 2025”
SPSD II - Part I - Sustainable production and consumption patterns – Energy 127/140
German grid operators (VDN, Verband der Netzbetreiber) [VDN 03a, VDN 03b]. The VDN publishes annual results. These results are shown for the period 2000-2002 in the table below, together with the total compensation cost (end-user levy), determined from own calculations.
Table 22 : PV-generated electricity and end-user costs under the feed-in tariff system, EEG.
Year [units]
PV electricity fed into the grid
[GWh]
Total payments for PV feed-in tariffs
[M €]
Electricity* consumption
[GWh]
End-user levy for PV feed-in tariff**
[€ ct/kWh]
2000 38 19.367 459551 0.0042
2001 60 30.414 458115 0.0066
2002 148 72.768 468321 0.0155 * This is the total annual consumption defined in the law for the calculation of renewables cost; it is the net non-renewable electricity consumption ** Own calculation: total payments for PV feed-in tariffs divided by final consumption
The total amount of electricity generated by grid connected PV systems in the year 2002 was 148.1 million kWh, according to VDN statistics. This would mean a share of about 0.025% of the total electricity consumption. The cost for the payment of high feed-in tariffs for PV power is divided over all end users. The table shows that the additional PV spending of € 72.768 million in 2002 are paid by a surplus cost of 0.0155 €c/kWh or 1.55 €c/MWh on the end consumer rates.
It can be concluded that the combination of the 100,000 Solar Roofs programme and the EEG has largely contributed to the increased grid-connected roof PV capacity seen over the period 1999-2003, as shown in Table 23.
Table 23 : Additional installed grid-connected PV capacity under the 100,000 Solar Roofs Programme [IEA PVPS, 2003a]
1999 2000 2001 2002 2003 Total End-2002
Target additional capacity (MWp)
10 50 65 80 95 205
PV capacity approved for finance (MWp)
8.9 36.6 76.4 78.3 N.A. 200.2
PV systems approved for finance (number)
3,522 7,824 19,325 15,228 45,899
After the expiration of the 100,000 Roofs Program in June 2003, and after months of discussions, the federal Ministry for the Environment and the Ministry of Economics agreed in Nov. 2003 on a new provisional feed-in law for PV systems, entering into force from January 1st, 2004, in order to avoid market disruption. On Dec. 19, 2003, the German parliament passed the new provisional Renewable Energy Sources Act (Zweite Gesetz zur Änderung des Erneuerbare-Energien-Gesetzes (EEG-Änderungsgesetz)), which deals only with the new feed-in tariffs for PV. PV feed-in tariffs needed to be increased to compensate for the expired 100,000 Roofs Program support. The base feed-in tariff will be 45.7 €c/kWh, with a supplement accorded based on mounting category and installed power (see Table 24).
As before, an annual reduction of the feed-in tariff with 5% is specified, e.g. in 2005 the base tariff will be 43.3 € ct/kWh.
Table 24 : PV feed-in tariffs by installed power category and mounting type
PV feed-in tariff incl. supplements [€c/kWh]
Mounting category / Power < 30 kWp 30 – 100 kWp > 100 kWp
ground mounted 45.7 45.7 45.7

Project CP/23 - “Renewable Energy Evolution in Belgium 1974 - 2025”
SPSD II - Part I - Sustainable production and consumption patterns – Energy 128/140
roof mounted 57.4 62.4 54
façade systems 62.4 59.6 59
Apart from these new feed-in tariffs, the restrictions 5 MWp limitation for a single PV system has been removed, and the limit of 100 kWp for PV systems on undeveloped areas has been removed. There is also no longer a cap on the total installed PV system capacity to be obtained through this measure.
D4. Germany: SolarBau – energy efficiency & solar energy in commercial building sector
Policy Objectives
The SolarBau programme was initiated in 1995 by the Federal Ministry of Education and Research (BMBF) and since 1998 carried out by the Federal Ministry of Economy and Technology (BMWi).
SolarBau is part of the 4th German Energy Research and Development Programme, and is one of the main activities in the framework of rational use of energy. The programme aims to pave the way for the take up of energy savings and the utilisation of solar energy in non-residential buildings. It also aims to develop and prepare technical and scientific background information for input in designing future legal measures such as the German energy saving ordinance for limiting consumption in the building sector.
The general objective is to demonstrate a series of pilot projects with total primary energy demand for heating, cooling, lighting purposes below 100 kWh/(m²a), including a space heating demand of less than 40 kWh/(m²a).
Design and Development
SolarBau supports the planning and evaluation of demonstration projects. Different, project -specific teams work independently on a demonstration project from the planning to the evaluation stage.
The programme consists of demonstration of up t o 25 pilot buildings and an accompanying evaluation and information programme called SolarBau: MONITOR. SolarBau’s basic concept was developed and designed by a specifically set-up expert group in close co-operation with the responsible ministries. The group consisted of 5 representatives from: university research, private research, architects/engineers, and ministry and project management organisation.
SolarBau is funded under the 4th German Energy Research and Development Programme. In the demonstration part, funding is only provided for the design of prototype buildings and for monitoring activities after construction. Complementary activities directed at the production of new innovative components are also funded according to R&D framework condition. No investment subsidies are provided, thus all design solutions are implemented under normal economic boundary conditions.
The accompanying SolarBau: MONITOR programme is directed towards evaluation and information and is based on co-operation between partners during all project phases. SolarBau: MONITOR uses the findings of the individual demonstration projects, and thus the output of the various project teams. It provides a central interface for documentation and analyses of the SolarBau projects. The contents of SolarBau: MONITOR will also contribute to new teaching materials for university courses.
Actors & Participants
The main actors with a role in the programme came from various branches of research, industry and public bodies. Participation in the programme was based on competence and experience of the participant, as well as his willingness to contribute to the accompanying SolarBau: MONITOR programme. The main actors and roles are shown in the table below.
Table 25 : Main actors and roles in the SolarBau programme
Organisation Role
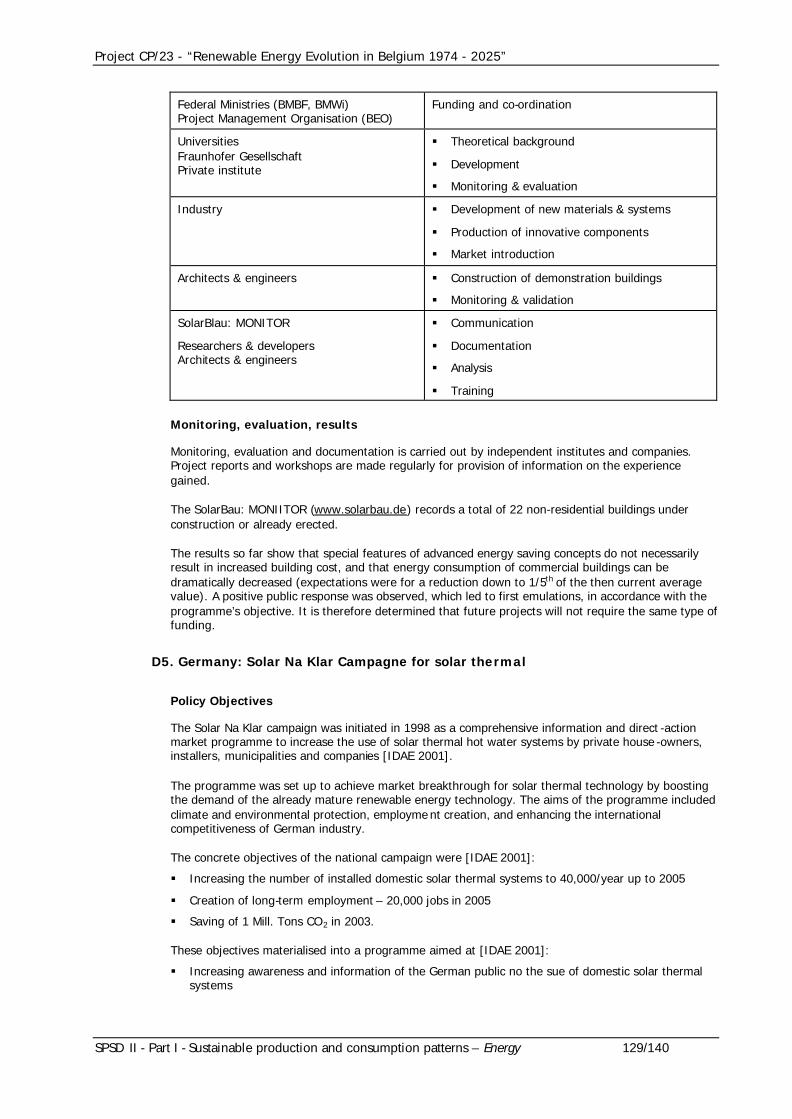
Project CP/23 - “Renewable Energy Evolution in Belgium 1974 - 2025”
SPSD II - Part I - Sustainable production and consumption patterns – Energy 129/140
Federal Ministries (BMBF, BMWi) Project Management Organisation (BEO)
Funding and co-ordination
Universities Fraunhofer Gesellschaft Private institute
§ Theoretical background
§ Development
§ Monitoring & evaluation
Industry § Development of new materials & systems
§ Production of innovative components
§ Market introduction
Architects & engineers § Construction of demonstration buildings
§ Monitoring & validation
SolarBlau: MONITOR
Researchers & developers Architects & engineers
§ Communication
§ Documentation
§ Analysis
§ Training
Monitoring, evaluation, results
Monitoring, evaluation and documentation is carried out by independent institutes and companies. Project reports and workshops are made regularly for provision of information on the experience gained.
The SolarBau: MONIITOR (www.solarbau.de) records a total of 22 non-residential buildings under construction or already erected.
The results so far show that special features of advanced energy saving concepts do not necessarily result in increased building cost, and that energy consumption of commercial buildings can be dramatically decreased (expectations were for a reduction down to 1/5th of the then current average value). A positive public response was observed, which led to first emulations, in accordance with the programme’s objective. It is therefore determined that future projects will not require the same type of funding.
D5. Germany: Solar Na Klar Campagne for solar thermal
Policy Objectives
The Solar Na Klar campaign was initiated in 1998 as a comprehensive information and direct -action market programme to increase the use of solar thermal hot water systems by private house -owners, installers, municipalities and companies [IDAE 2001].
The programme was set up to achieve market breakthrough for solar thermal technology by boosting the demand of the already mature renewable energy technology. The aims of the programme included climate and environmental protection, employme nt creation, and enhancing the international competitiveness of German industry.
The concrete objectives of the national campaign were [IDAE 2001]:
§ Increasing the number of installed domestic solar thermal systems to 40,000/year up to 2005
§ Creation of long-term employment – 20,000 jobs in 2005
§ Saving of 1 Mill. Tons CO2 in 2003.
These objectives materialised into a programme aimed at [IDAE 2001]:
§ Increasing awareness and information of the German public no the sue of domestic solar thermal systems

Project CP/23 - “Renewable Energy Evolution in Belgium 1974 - 2025”
SPSD II - Part I - Sustainable production and consumption patterns – Energy 130/140
§ Bridging the gap between favourable perception of solar energy and actual readiness to invest
§ Motivating installers to develop the solar thermal market
§ Giving consumers access to installers registered in the campaign
§ Supporting the start-up and running of regional solar campaigns.
Design and Development
After an initial 1-year preparation phase (Sep. 1997 – Sep. 1998), the BAUM (German Environmental Management Association) launched the Solar Na Klar programme in 1998. The programme essentially consisted of a wide dissemination campaign through the use of mass and specialised media, as well as complementary material. The campaign plan was developed by BAUM together with a steering committee consisting of representatives from solar energy technology and supply industries, building industry, environmental NGOs, as well as communication agencies and the regional steering board.
The communication strategy was founded on 3 major axes:
§ Public programme: for house and building owners with comprehensive, free information materials on solar heat
§ Expert programme: for solar manufacturers, installers, engineers and architects
§ Regional programme: to link and co-operate with regional and local solar initiatives.
Dissemination activities included regular reports and press releases for publication via the general and trade press, as well as the use of television, radio and Internet. Testimonials of well-known persons such as from government, sports, entertainment sectors were obtained to arouse public interest and enhance the impact on the general population. The campaign was also presented at several events, such as trade and consumer fairs.
In relation to the public programme, a variety of support materials, such as consumer brochures, were also made and a strong infrastructure established for supporting the various dissemination activities. At the expert level, efforts were directed towards increasing the level of information, training and interest of installers and other professionals, e.g. through sales folders, installer hotlines etc. Finally, at regional levels, the campaign strengthened links with existing initiatives, at local and regional levels, and to this end developed practical guidelines “Solar-na-klar – Regional”.
The overall budget of the programme amounted to about 5.25 M€, with contributions from both private and public sources, outline in the table below.
Table 26 : Financial contributions to the German Sola Na Klar programme [IDAE 2001]
Organisation Amount (M€)
Federal Foundation for the Environment (BDU)
2
Solar industry companies 0.65
The 16 Federal States of Germany 0.6
Federal Ministry of the Environment (BMU) 0.25
Ruhrgas AG 0.75
Allianz Environmental Foundation 1
TOTAL 5.25
Actors & Participants
The programme was initiated by BAUM (German Environmental Management Association), who is the formal project co-ordinator and campaign manager. The campaign management is carried out with the participation and assistance of a Steering Committee consisting of associations from different social-economic sectors: BAUM, National Installers Association Sanitary Heating Climate (ZVSHK), German Association for Solar Energy (DFS), German Society for Solar Energy (DGS), Federal Association for
Project CP/23 - “Renewable Energy Evolution in Belgium 1974 - 2025”
SPSD II - Part I - Sustainable production and consumption patterns – Energy 131/140
solar Energy (BSE), Association of German Architects (BDA), German Ring for Nature Protection (DNR). The Steering Committee participates both in the management and monitoring of the actions. It is responsible for all decisions concerning the details of the campaign and its adaptation where necessary.
In terms of governmental participation, the parties involved are the DBU (German (Federal) Foundation for the Environment), the BMU (Federal Ministry of Environment), together with all 16 Member States of the German Federal Republic.
Monitoring, evaluation, results
The campaign results are assessed continuously by the “Solar-na-klar” team, and evaluated within the Steering Committee, who is responsible for taking decisions on the details of the campaign and it adaptation where deemed necessary [IDAE 2001].
An external evaluation of the programme, by the Federal Environmental Agency (UBA), was started in February 2001. The results of this evaluation will be fed into the extension of the campaign.
The direct impact of the campaign on the development of solar sales and the market in general is difficult to assess, however it is clear that the programme has had an marked influence on the increased German solar market recorded during 1999-2001. For 2000, the following direct actions executed in the campaign, were identified [IDAE 2001]:
§ 340 million contacts in newspapers and magazines.
§ 20 TV-and 10 broadcast -programs. TV: 3,9 million spectators.
§ More than 160,000 brochures distributed to interested customers (total).
§ 98,000 call centre contacts by the end of 2000.
§ 120,000 hits on www.solar-na-klar.de (2000).
§ 7,000 registered craftsmen (> 50% of total suppliers of heating installations in Germany).
§ Co-operation with more than 100 local solar initiatives.
The campaign is regarded as successful in that it linked the supply and demand sides of the German solar heat market, and initiated and supported training and qualification for the supply side.
The following success factors have been identified:
§ Kick-start financing by the DBU
§ Broad participation – 10,000 partners from large cross-section of society
§ Co-ordination body: Professional body with dedicated full time staff, motivated, impartial
§ Continuous evaluation and flexibility in adaptation
D6. Germany: Wind power for grid connection : the 250 MW wind programme
Policy Objectives
The main policy objective of the 250 MW programme (initially the “100 MW wind” programme) was to increase the deployment of wind power in Germany and to obtain statistically verifiable performance data on the practical operation of wind turbines in Germany. This objective was to be realised through the expansion of the total wind power in Germany to 250 MW, at a wind speed of 10 m/s.
The specific goals of the funding measure were to stimulate wind turbine manufacturing and technology development industries in Germany, so as to improve efficiency and economic aspects of wind energy and establish an inland energy market (not in existence before 1990).
The “250 MW wind” programme can be seen to be one of several measures having the general goals of:
§ Conservation of natural resources

Project CP/23 - “Renewable Energy Evolution in Belgium 1974 - 2025”
SPSD II - Part I - Sustainable production and consumption patterns – Energy 132/140
§ Improvement of German security of supply
§ Environmental and climate change protection
§ Increasing the share of renewable electricity generation in the national energy balance
§ Strengthening the international position of German energy technology industry
Design and Development
The initial “100 MW wind” programme was launched on the basis of an expert study “Experimental Programme Wind” commissioned in 1988 by the former Federal Ministry for Research and Technology (BMFT), represented by the Project Management Organisation BEO (Research Centre, Jülich). Among the main objectives of the study were the estimation of the demand for a broad experimental wind energy programme of ~100 MWe, the ability of such a programme to deliver R&D findings justifying BMFT funding, and the definition of R&D targets, and strategies (including financial means) for obtaining them as quickly as possible.
The results and recommendations of the expert study were integrated into the design of the final programme, launched in June 1989. In view of the high response to the BMFT’s call for the programme was increased in capacity from 100 MWe to 250 MWe in February 1991.
The programme has been progressively modified over the years to adapt to changes in relevant legislation, for example the Electricity Feed Law. The total running time of the programme was planned for 15 years – 5 years for the implementation phase, and 10 years for observation of operational performance.
The main financial strategy used was the provision of subsidies for wind turbine operators on the basis of electricity production (feed-in tariff), together with an allowance of access of operators to special loans with reduced interest rate. Accumulation with different support mechanisms was allowed. Other features of the strategic implementation included obligatory reporting by operators of operating results and their continuous collaboration (financially-tied) in the evaluation programme.
The funding was provided via the Federal research budget. Commercial operators were eligible for a subsidy of 0.06 or 0.08 DEM/kWh (approximately 0.03 and 0.04 €/kWh respectively7), depending on whether electricity is fed into the grid or consumed by the turbine owner himself. Grants were limited to a maximum of 25% of turbine costs. Non-commercial operators had the option to choose an investment subsidy limited to a maximum of 90,000 DEM (~46,000 €). In addition, system of tariffs paid by the utilities was implemented under the Electricity Feed in Law (Jan. 1991 – Mar. 2000) or the Renewable Energy Law (since Apr. 2000) – refer to the table below.
Table 27 : Tariffs paid by utilities for electricity from wind, according to legislation in place
Year 1991 1992 1993 1994 1995 1996 1997 1998 1999 2000
DEM/ kWh
0.166 0.165 0.166 0.169 0.173 0.172 0.172 0.168 0.165 0.161
€c/ kWh
8.49 8.45 8.47 8.66 8.84 8.80 8.77 8.58 8.45 8.25
The Renewable energy law (April 2000) fixes the compensation rate at 0/178 DEM/kWh for a minimum 5-year period. The funding measure was limited to a total capacity of 250 MW, at wind speed of 10 m/s, which corresponds to a total rated capacity of about 360 MW.
The “250 MW wind” is accompanied by a “Scientific Measurement and Evaluation Programme”, whose function is to acquire statistically relevant data on wind turbine operation in Germany. Through this programme, performance data from all funded wind turbines over a 10-year period are collected by the operators (this is a condition for the operator to receive funding) and evaluated.
The amount of financial support is estimated to be approximately 320 Million DEM to be spent by the Federal Government up to 2006. This does not include the costs for the “Scientific Measurement and Evaluation Programme”, which is estimated to be about 50 Million DEM.
7 Conversion rate used is that which existed at the date of transition to the Euro: 1 DEM = 0.511292 EUR

Project CP/23 - “Renewable Energy Evolution in Belgium 1974 - 2025”
SPSD II - Part I - Sustainable production and consumption patterns – Energy 133/140
Actors & Participants
The “250 MW wind” programme and the accompanying “Scientific Measurement and Evaluation Programme” was carried out by 3 main actors:
§ The Federal Ministry for Research and Technology (BMFT) (1989-1994) and its successors, the Federal Ministry for Education, Science, Research and Technology (BMBF) (1994-1998) and the Federal Ministry for Economics and Technology(BMWi) (since 1998)
§ The Project Management Organisation BEO, from Jülich Research Centre
§ The Institute of Solar Energy Supply technology (ISET), in Kasel
Other relevant players included investors and turbine operators, as well as turbine manufacturers.
The experimental programme “100/250 MW wind” was implemented by the Project Management Organisation BEO on behalf of the relevant Federal ministries (detailed above). The “Scientific Measurement and Evaluation Programme” is being carried out by ISET, under contract to the Jülich Research Centre.
Monitoring, evaluation, results
One of the main goals of the programme was to acquire statistically relevant data on wind turbine operation in Germany. The planning phase of the main programme therefore included an intensive evaluation programme - the “Scientific and Evaluation Programme”. Through this programme, performance data from all funded wind turbines over a 10-year period are collected and evaluated with respect to specific areas, such as wind resource, turbine performance, reliability, and economic aspects.
As a funding condition, participants are required to maintain a log-book for each funded turbine and make specific records, relating to technical data of each turbine, energy production & consumption, malfunctions & maintenance, and operating costs.
The monitoring and evaluation process is conducted by ISET & the Research Centre Jülich, with the assistance of localised subcontractors. There is continuous in-depth communication between the partners during all project phases.
During the programme, the specific electricity generation from wind increased to an average 2000 full load hours/year (KWh/kW) (reported situation in Sep. 2001). Expectations on installed capacities, market situation and total electricity contribution from wind have been exceeded, and the inland trade of wind turbines is developing independently of the “250 MW wind” programme. In June 2000, installed wind power capacity in Germany exceeded the 5,000 MW level. The Electricity Feed in Law has contributed significantly to these achievements and now in its revised form – the Renewable Energy Law (EEG) – acts as a driving force for investors.
The contribution of wind electricity generation to Germany’s net electricity consumption has increased from about 0% in 1989 to almost 2% in 2000. The export of wind turbines from Germany has increased continuously to about 10% ((reported situation in Sep. 2001) as a result of the success on the domestic market and the reputation of these technologies. In terms of employment, the “250 MW wind” programme has contributed to job creation – the wind energy industry in Germany accounts for approximately 15,000 jobs (reported situation in Sep. 2001).
The monitoring programme is deemed a very useful tool for evaluating programme results, and has revealed the following (reported situation in Sep. 2001):
§ Overall improvement in state-of-the-art wind energy technology
§ Increase in wind turbine availability to 98%
§ Increase in know -how in operating hours and maintenance
§ Public acceptance ca, be discussed on-site
§ The programme has significantly contributed to the international breakthrough of wind power.

Project CP/23 - “Renewable Energy Evolution in Belgium 1974 - 2025”
SPSD II - Part I - Sustainable production and consumption patterns – Energy 134/140
D7. Japan PV: PV power generation systems – from R&D to deployment
Policy Objectives
The overall objective is to reduce the country’s dependency on external energy sources, to diversify energy sources and to contribute to global environmental improvement. A specific objective for PV was set out in 1998 in a revised “Long –term Energy Supply/Demand Outlook”, with the target of 5000 MW installed capacity by 2010.
Design and Development
The R&D and Deployment programmes are in fact run under separate programmes but with the view to ensuring continuous exchange of knowledge and developments so that both programmes reinforce each other.
Different targets and processes are outlined for each of these programmes. The R&D programme budget is 100% government -funded. The government provides official subsidies to New Energy and Industrial Technology development Organisation (NEDO) who is responsible for conducting the R&D with the private sector. Several sub-programmes are run under the R&D programme. These are aimed at: reducing manufacturing costs, reducing raw material costs, increasing conversion efficiency and reducing technology costs, development of advanced, low -cost manufacturing methods.
The target of the Deployment programme is the establishment of a new PV market and demonstration of system durability. To this end, subsidy programmes are established for initiatives and demonstration projects in PV carried out by private companies and local governments, as well as for PV owners in the residential sector.
Projects are planned and designed following a formal hearing involving the various actors of the supply sector. During the execution of the project there is a process of consumer feedback upon which the project is flexibly modified.
Actors & Participants
The chief agency directing both programmes is the Japanese Ministry of International Trade and Industry (MIT), who is responsible for national energy policy and industrial technology policy. Both programmes are conducted with the involvement and co-operation of a cross-section of key actors from both private and public sectors
The R&D programme initially started in 1974 as part of the “Sunshine Project”. Since 1993 it has been under the direction of the “New Sunshine Program (NSS)”. The programme is run out of the Agency of Industrial Science and Technology, which is responsible for long-term planning budget compilation and overall R&D co-ordination. R&D projects are conducted by the New Energy and Industrial Technology development Organisation (NEDO), which consigns projects to the private sector and co-operates with universities and research institutes. In the private sector, the PV Power Generation Technology Research Association (PVTEC) has been formed to undertake co-operative R&D.
The Deployment programme is run out of the New Energy Policy Division, Coal and New Energy Department of the Agency of Natural Resources and Energy, which is in charge of promotional policy, budget compilation and overall co-ordination of deployment. The New Energy Foundation (NEF) carries out subsidy programmes for the residential sector – the major deployment field – while NEDO conducts various model projects and field test programmes for the industrial sector and local governments. In the private sector, solar cell and housing manufacturers have established the Japan Photovoltaic Energy Association (JPEA) for public relations and dissemination activities in co-operation with the government.
Monitoring, evaluation, results
The Master Plan for the R&D programme under the Agency of Industrial Science is scheduled and evaluated by the Industrial Technology Council. Each programme and sub-programme of the Master Plan is periodically evaluated and the ensuing schedule revised if necessary. An evaluation council was subsequently established to take over the evaluation function. This council consists of neutral experts

Project CP/23 - “Renewable Energy Evolution in Belgium 1974 - 2025”
SPSD II - Part I - Sustainable production and consumption patterns – Energy 135/140
from a cross-section of sectors: academia, technology, mass media…The evaluation is conducted in a systematic manner with respect to identified areas of project design, operation and results, which can serve as indicators for project effectiveness, including: objective, target, schedule, need for government participation, R&D operation structure, specific achievements, application/promotion/public relations. The results of the evaluation are used to decide on project continuation. In the case of continuation, a new Master Plan is re-scheduled taking into account the remarks of the evaluation council.
Success in achieving the overall target of 5000 MW in 2010 can only be seen in 2010, however, it is clear that the PV capac ity has seen steady, enhanced growth since implementation of the programme.
Table 28 : Cumulative installed PV capacity in Japan (Source: [IEA PVPS, 2003b])
Total cumulative installed PV power (MWp)
1992 1993 1994 1995 1996 1997 1998 1999 2000 2001 2002
19 24.3 31.2 43.4 59.6 91.3 133.4 208.6 330.2 452.8 636.8
The important feature of the programme is not the significant budget, but the preparation of future mass deployment following achievement of the target. The 5000 MW target is not necessarily seen as the goal itself but as a target in the process towards mass deployment.
The R&D programme has resulted in decreased PV system cost and as a consequence has contributed to the Deployment programme for full-scale promotion. The programmes have contributed largely to Japan’s status as having the largest PV installed capacity in the world.
Success factors for the R&D sector include:
§ Continuous & consistent planning & administration of the programme conducted by government, enabling private sector, academia, national institutes to focussed on their particular area of expertise
§ Significant official budget
§ Appropriate evaluation of projects, with flexibility for modification
The most successful programme of in the Deployment programme is the residential programme. Subsidy programmes were used to establish the new market, which competes on the basis of electricity price. In the residential sector, over 10,000 units have been installed annually with the help of subsidies, and it is expected that residential PV will someday become conventional. The success factors for this are:
§ Economies of scale in production, resulting in price reductions
§ System of surplus electricity purchase by electricity companies established with equivalent surplus and demand power prices
§ Increased awareness of environmental issues increasing willingness to pay (even with subsidies, PV cost still relatively high)
§ Licensing of architecturally-integrated PV modules as architectural materials by the Building Standard Law – facilitating housing manufacturer sales.
In general, one of the key success factors in deployment is seen to be the co-operation amongst the various sectors concerned: government, solar cell and housing manufacturers, electricity companies…
D8. Spain: Solar Ordinance Barcelona
Policy Objectives
The aim of the Barcelona Ordinance is to increase the implementation of solar thermal systems by regulating the implementation of low-temperature systems for collecting and using active solar energy for sanitary hot water production in buildings within the municipality of Barcelona [BEA website].

Project CP/23 - “Renewable Energy Evolution in Belgium 1974 - 2025”
SPSD II - Part I - Sustainable production and consumption patterns – Energy 136/140
Design and Development
The process of establishment of a Solar Ordinance for Barcelona was started by the Sustainable City Councillor of Barcelona who was inspired by the Berlin Solar Ordinance Draft presented at the 4 th European Conference on Architecture (26-29 Mar. 1996). The Sustainable City Councillor started preliminary discussions with interested individuals, organisations (professional, NGO etc.) and public officials to explore the feasibility of implementing such an Ordinance in Barcelona. The Sustainable City Councillor also informed and discussed the concept with the Mayor of Barcelona, and the Urban Planning Commission. The series of consultations led to the adoption of a resolution by the Barcelona Civic Table on Energy to work on the development of Solar Ordinance for Barcelona. Following a series of consultations on policy design with the main players in the solar energy sector, a draft policy document was submitted for political discussion and was adopted in Feb. 1999. An open public consultation was then conducted, the results of which were largely integrated and the final text [PUIG html].
The solar Ordinance was approved by the Barcelona City Council in July 1999 and entered into force on 1 August 2000 – the 1 year period given for officials to take the necessary steps to enable the implementation of the Ordinance in the City.
Under the Ordinance, all new buildings or buildings undergoing major refurbishment are obliged to install solar energy collectors for the heating of sanitary hot water in residential, institutional, and commercial and in some cases industrial buildings. The Ordinance is also applicable to installations for the heating of water in vessels of heated covered swimming pools (volume > 100 m³). In these cases the contribution of the solar installation must be at least 60% of annual water heating energy demand.
The obligation lies on the developer/promoter of construction, on the owner of the building affected or the professional who conducts the relevant works.
Applications for building licence or environmental licence must include the basic project of the installation, with the appropriate analyses and calculation to show fulfilment of the Ordinance.
The obligation is accompanied by penalties for non-fulfilment.
Actors & Participants
The main actor who inspired the policy process was the Sustainable City Councillor of Barcelona. At the government level, the Mayor of Barcelona also played an important role with respect to political ambition for developing such a policy. In terms of actual policy development the main actors of the solar energy industry – environmental organisations, solar energy businesses, solar energy technicians etc. – were also central players, and their involvement in the process also enhanced acceptability by the industry. The involvement of the public in the consultation process also enhanced its acceptability.
The target group of the solar Ordinance is developers/promoters of construction, owners of new buildings or those for refurbishment, engineers, architects etc.
Monitoring, evaluation, results
The Barcelona Energy Agency is responsible for the continuous monitoring and evaluation of the programme in order to promote its effective implementation.
Penalties are imposed for the non-fulfilment of the requirements of the Ordinance. The penalties can be up to (approximately in €) 60,000 € depending on the seriousness of the infringement.
After the Ordinance became active in August 2000, within 1 year the total amount of square meters of solar thermal applications quadrupled, signifying a saving of 2,838 tons CO2. Observations of the solar thermal market in the 2 years following the implementation of the programme are given in the tables below.

Project CP/23 - “Renewable Energy Evolution in Belgium 1974 - 2025”
SPSD II - Part I - Sustainable production and consumption patterns – Energy 137/140
Table 29 : Installed solar collector surface in the City of Barcelona (1995-2001) [PUIG ppt]
Year 1995 1998 1999 2000 2001
Collector surface (m²) 700 1181 1350 1632 6321
Table 30 : Installed solar collector surface by building type, City of Barcelona (2001-2002)
Dec. 2001 Jun. 2002
Domestic 3145 6425
Hotels 1745 2114
Sports facilities 972 1458
Hospitals 307 349
Other 152 421
TOTAL 6321 10768
An evaluation of the implementation of the Ordinance (situation reported Feb. 2003) shows that since its entry into force, the number of licences requested for solar panel installation make up a surface area of 14,028 m² of solar panels compared to 1,650 m² before the start of the programme. This is estimated to be an equivalent energy saving of 40,400 GJ/year, and avoided CO2 emissions of 1,973 ton CO2/year
Public awareness was increased as a result of the policy development process. After the adoption of the Solar Ordinance, visits by citizens to the Renewable Energy Information Centre doubled. Another interesting outcome has been that houses equipped with solar thermal installations became relatively more valuable. A campaign is now being organised to replicate the project, this time with the aim of involving all municipalities of Catalunia and supported by the Regional Government. So far, 4 more municipalities have approved the solar ordinance based on the one in Barcelona [Soltherm website].
D9. Sweden: Market transformation – heat pumps
Although heat pumps are not considered in this study as a technology as such, the Swedish approach on technology procurement are examplary and interesting to be mentioned in this study.
Policy Objectives
The objective of the programme was to increase the market deployment of heat pumps in the residential sector by encouraging the development of reliable, cheaper and improved small power heat pumps for use in detached houses.
Design and Development
The technology procurement for heat pumps was started by the Swedish National Board for Industrial and Technical Development (NUTEK) in 1993 as a market transformation programme for domestic heating. Heat pumps are a relatively well-known product in Sweden, however, performance problems experienced in the mid-1980s resulted in the eventual collapse of the market. In the 1990s there were very few heat pumps for small single family houses, with electricity needs for heating and hot water in the range of 20,000 kWh.
A technology procurement scheme thus sought to address the market barriers (lack of confidence, insufficiently adapted technology) by encouraging the development of the type of pump having the required performance characteristics, and via information dissemination and other market activities to encourage consumer awareness and confidence. In the scheme, potential purchasers (purchaser group) and energy experts were brought together to draft the required energy efficiency performance parameters and other requirements of the heat pumps, which would be developed via a competition by manufacturers willing to participate. The purchaser group also guaranteed the purchase of at least
Project CP/23 - “Renewable Energy Evolution in Belgium 1974 - 2025”
SPSD II - Part I - Sustainable production and consumption patterns – Energy 138/140
2,000 units of the winning model. This is equivalent o about 1 year’s sales in Sweden, thus acting as an encouragement for the manufacturers to participate.
The project ran from Dec. 1993 – Sep. 1995. The procurement programme was supported by a package of activities for supporting the market penetration of the winning heat pumps. These included regional and local campaigns, involving information dissemination, positive labelling for on-spec products, consumer advice facilities, education, trade exhibitions etc.
Actors & Participants
The financial support for the programme came from the Swedish National Board for Industrial and Technical Development (NUTEK). NUTEK also provided significant technical support - NUTEK’s knowledge of the heat pump sector and the stock of existing knowledge in the sector was important for the success of the programme.
The working group responsible for drafting the requirements of heat pump consisted of potential purchasers – single-family house owners (including members from other Nordic countries) – and energy experts. The manufacturer market for heat pumps in the category related to the procurement programme is dominated by 15 manufacturers (90% market share), the other actors being the utilities, heating, water and sanitary consultants, and installation companies.
Monitoring, evaluation, results
The programme finished in 1996. It resulted in an energy efficient heat pump at a low cost (30% cheaper) for the small power classes. The estimated energy savings from the heat pump as at least 8,000 kWh per year. All proposed systems were carefully tested, and market pricing and pump efficiency carefully monitored.
The programme succeeded in restoring and improving the reputability of the heat pump – the main barrier for its dissemination. The new heat pumps have been on the market since end-1995. In less than 1 year, sales exceeded the initial target of 2,000 units and at the end of 1996 were reported to have at least doubled that amount. There was also a large growth in interest in Swedish heat pumps in other countries, and there have been exports to other Nordic countries, Switzerland, Holland…There has been significant increase in manufacturers’ turnover, which has resulted in investment in additional production capacity and significant increase in employment in the concerned companies.
The programme resulted in increased sales on the domestic market and favourable export prospects, motivating manufacturers to continue further development. The majority of producers can now provide the same efficiency level as in the procurement programme. Furthermore, more than 75% of new residential buildings – both multi-family and detached houses – are equipped with a heat pump. Increased sales volume has resulted in economies of scale and price reductions. One year after the end of the programme, energy saving from heat pump use is estimated at 30-40 GWh/year.
The technology procurement project has been claimed to result in Sweden becoming the leading country in the liquid/water heat pump market.
D10. United Kingdom: Tradable green certificates market mechanism for green electricity
Policy Objectives
The objective of the mechanism is to achieve 10% of the UK's electricity should be supplied from renewable sources by 2010.
Design and Development
The mechanism used towards achieving the goal is a green certificates trading mechanism, called the Renewables Obligation Certificates System (ROCS). The Obligation is enforced by an order (Statutory Instrument) made under the terms of the Utilities Act 2000.
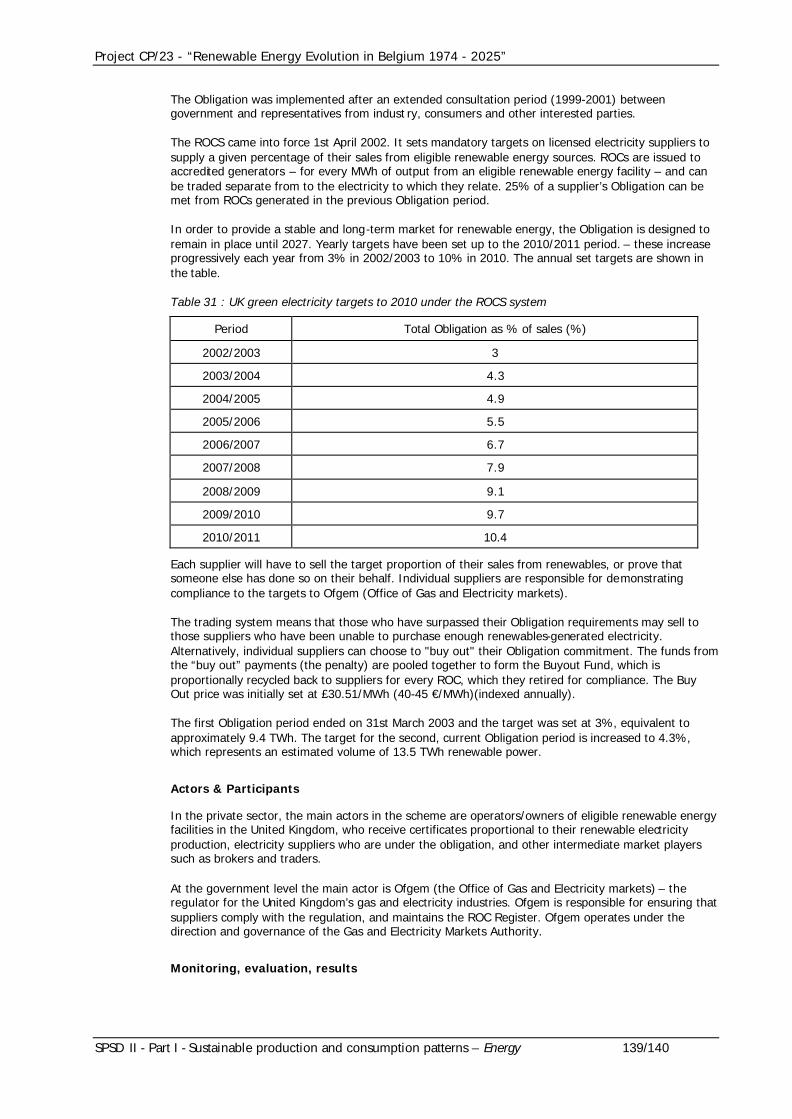
Project CP/23 - “Renewable Energy Evolution in Belgium 1974 - 2025”
SPSD II - Part I - Sustainable production and consumption patterns – Energy 139/140
The Obligation was implemented after an extended consultation period (1999-2001) between government and representatives from indust ry, consumers and other interested parties.
The ROCS came into force 1st April 2002. It sets mandatory targets on licensed electricity suppliers to supply a given percentage of their sales from eligible renewable energy sources. ROCs are issued to accredited generators – for every MWh of output from an eligible renewable energy facility – and can be traded separate from to the electricity to which they relate. 25% of a supplier’s Obligation can be met from ROCs generated in the previous Obligation period.
In order to provide a stable and long-term market for renewable energy, the Obligation is designed to remain in place until 2027. Yearly targets have been set up to the 2010/2011 period. – these increase progressively each year from 3% in 2002/2003 to 10% in 2010. The annual set targets are shown in the table.
Table 31 : UK green electricity targets to 2010 under the ROCS system
Period Total Obligation as % of sales (%)
2002/2003 3
2003/2004 4.3
2004/2005 4.9
2005/2006 5.5
2006/2007 6.7
2007/2008 7.9
2008/2009 9.1
2009/2010 9.7
2010/2011 10.4
Each supplier will have to sell the target proportion of their sales from renewables, or prove that someone else has done so on their behalf. Individual suppliers are responsible for demonstrating compliance to the targets to Ofgem (Office of Gas and Electricity markets).
The trading system means that those who have surpassed their Obligation requirements may sell to those suppliers who have been unable to purchase enough renewables-generated electricity. Alternatively, individual suppliers can choose to "buy out" their Obligation commitment. The funds from the “buy out” payments (the penalty) are pooled together to form the Buyout Fund, which is proportionally recycled back to suppliers for every ROC, which they retired for compliance. The Buy Out price was initially set at £30.51/MWh (40-45 €/MWh)(indexed annually).
The first Obligation period ended on 31st March 2003 and the target was set at 3%, equivalent to approximately 9.4 TWh. The target for the second, current Obligation period is increased to 4.3%, which represents an estimated volume of 13.5 TWh renewable power.
Actors & Participants
In the private sector, the main actors in the scheme are operators/owners of eligible renewable energy facilities in the United Kingdom, who receive certificates proportional to their renewable electricity production, electricity suppliers who are under the obligation, and other intermediate market players such as brokers and traders.
At the government level the main actor is Ofgem (the Office of Gas and Electricity markets) – the regulator for the United Kingdom’s gas and electricity industries. Ofgem is responsible for ensuring that suppliers comply with the regulation, and maintains the ROC Register. Ofgem operates under the direction and governance of the Gas and Electricity Markets Authority.
Monitoring, evaluation, results

Project CP/23 - “Renewable Energy Evolution in Belgium 1974 - 2025”
SPSD II - Part I - Sustainable production and consumption patterns – Energy 140/140
As previously stated the system is monitored by the government via Ofgem (the Office of Gas and Electricity markets), who maintains a register of ROCS certificates and who is responsible for ensuring compliance on the part of the electricity suppliers.
The following tables show the total generating capacity for which ROCS certificates have been granted, and the number of certificates issued, as of 2 Dec. 2003.
Table 32 : Total accredited generation facilities for the ROCS UK (incl. Scotland) (Status 2/12/1003) (Source: [OFGEM 2003]
Total installed generating capacity (kW)
Number of stations
Co-firing of biomass with fossil fuel 1,204,856 25
Landfill gas 565,570 250
Biomass 158,102 13
Sewage gas 51,136 58
Biomass and waste using ACT 1,785 2
On-shore wind 563,667 96
Off-shore wind 63,800 3
Hydro <20 MW DNC 350,016 92
Micro hydro 10,793 32
TOTAL 2,969,725 571
Table 33 : ROCS issued to date (incl. Scotland) (Status 2/12/1003) (Source: [OFGEM 2003]
Technology TOTAL (incl. Scotland) (MWh)
Co-firing of biomass with fossil fuel 0.58
Landfill gas 3.92
Biomass 0.91
Sewage gas 0.26
Biomass and waste using ACT 0.00
On-shore wind 1.46
Off-shore wind 0.00
Hydro <20 MW DNC 0.79
Micro hydro 0.05
TOTAL 7.98
The results of the first compliance period show that the market is short of green certificates, and may remain so for the coming years [NAT website]. Observations thus far are that the majority of stand-alone trades (i.e. the ROCs certificates if sold by itself as opposed to being part of a bundled transaction together with the physical power, and possibly other incentive systems, such as embedded grid benefits) have been above the buy-out price.
Although the scheme is too young to be able to make definitive conclusions concerning the effectiveness of the ROCS green certificates system, it is clear that the market push provided by the ROCs obligation together with the attractive prices for the certificates – which are predicted to rise even further in the coming years [PLATTS 2003] – should encourage more developers to put forward renewable electricity projects.