Spring/Summer 2012 National Weather Service Quad · PDF fileMild Winter Leads to Record Warm...
12
Record breaking temperatures were seen across much of the Midwest during the month of March. These warm tempera- tures contributed to the warmest March on record for the contig- uous United States, a record that dates back to 1895. More than 15,000 warm temperature rec- ords were broken during the month of March. The average temperature for the United States in March was 51.1°F, which was 8.6 degrees above the 20 th century average for March and 0.5°F warmer than the previous warmest March in 1910. Twenty five states had their warmest March (Continued on page 2) Warmest March on Record Tim Gross The National Weather Service realizes there is a long road ahead of us until we are truly a Weather -Ready Nation. In fact, building a Weather-Ready Nation requires the action of every person and community. When we see devas- tating tornadoes, windstorms, floods, hurricanes, wild fires, and winter storms, the NWS’ chal- lenge, along with their emergen- cy management and media part- ners, looms large. But I believe that each and every person in Iowa, Illinois, and north eastern Missouri can be a powerful force when it comes to severe weather- readiness. The NWS lives and breathes the force of nature every day. From fair weather forecasts to the tire- less support provided during emergency situations, the NWS Warmest March on Record 1 Weather Ready Nation 1 Dual Polarization Radar 3 Radar Hardware Changes 3 New Fischer-Porter Automated Rain Gauges Installed 4 WxCODER 5 The Power of None: Why Zeros Matter 6 What is Metadata? 7 Summer Safety and Awareness 8 Mild Winter Leads to Record Warm Spring 2012 10 River Forecast Webpage Enhance- ment 11 Inside This Issue: Weather Home Companion is a semiannual publication of the National Weather Service office in the Quad Cities. Weather Ready Nation Steve Kuhl Spring/Summer 2012 Volume 9, Issue 1 National Weather Service Quad Cities IA/IL Weather Home Companion never bows to the weather, no matter how severe. When we combine two things – an empowered public and the continued operational improve- ments made under the NWS Weather-Ready Nation initia- tive – we can transform the way the country responds to severe weather and preparedness. This graphic shows statewide temperature rankings for March 2012, based on 118 years of data. States in red had the warmest March temper- atures on record.
Transcript of Spring/Summer 2012 National Weather Service Quad · PDF fileMild Winter Leads to Record Warm...

Record breaking temperatures
were seen across much of the
Midwest during the month of
March These warm tempera-
tures contributed to the warmest
March on record for the contig-
uous United States a record that
dates back to 1895 More than
15000 warm temperature rec-
ords were broken during the
month of March
The average temperature for the
United States in March was
511degF which was 86 degrees
above the 20th century average
for March and 05degF warmer
than the previous warmest
March in 1910 Twenty five
states had their warmest March
(Continued on page 2)
Warmest March on Record Tim Gross
The National Weather Service
realizes there is a long road ahead
of us until we are truly a Weather
-Ready Nation In fact building
a Weather-Ready Nation requires
the action of every person and
community When we see devas-
tating tornadoes windstorms
floods hurricanes wild fires and
winter storms the NWSrsquo chal-
lenge along with their emergen-
cy management and media part-
ners looms large But I believe
that each and every person in
Iowa Illinois and north eastern
Missouri can be a powerful force
when it comes to severe weather-
readiness
The NWS lives and breathes the
force of nature every day From
fair weather forecasts to the tire-
less support provided during
emergency situations the NWS
Warmest March on
Record
1
Weather Ready
Nation
1
Dual Polarization
Radar
3
Radar Hardware
Changes
3
New Fischer-Porter
Automated Rain
Gauges Installed
4
WxCODER 5
The Power of None
Why Zeros Matter
6
What is Metadata 7
Summer Safety and
Awareness
8
Mild Winter Leads to
Record Warm Spring
2012
10
River Forecast
Webpage Enhance-
ment
11
Inside This Issue
Weather Home Companion
is a semiannual publication
of the National Weather
Service office in the Quad
Cities
Weather Ready Nation Steve Kuhl
SpringSummer 2012
Volume 9 Issue 1 National Weather Service Quad Cities IAIL
Weather Home Companion
never bows to the weather no
matter how severe
When we combine two things ndash
an empowered public and the
continued operational improve-
ments made under the NWS
Weather-Ready Nation initia-
tive ndash we can transform the way
the country responds to severe
weather and preparedness
This graphic shows statewide temperature rankings for March 2012
based on 118 years of data States in red had the warmest March temper-
atures on record
Page 2 Weather Home Companion Volume 9 Issue 1
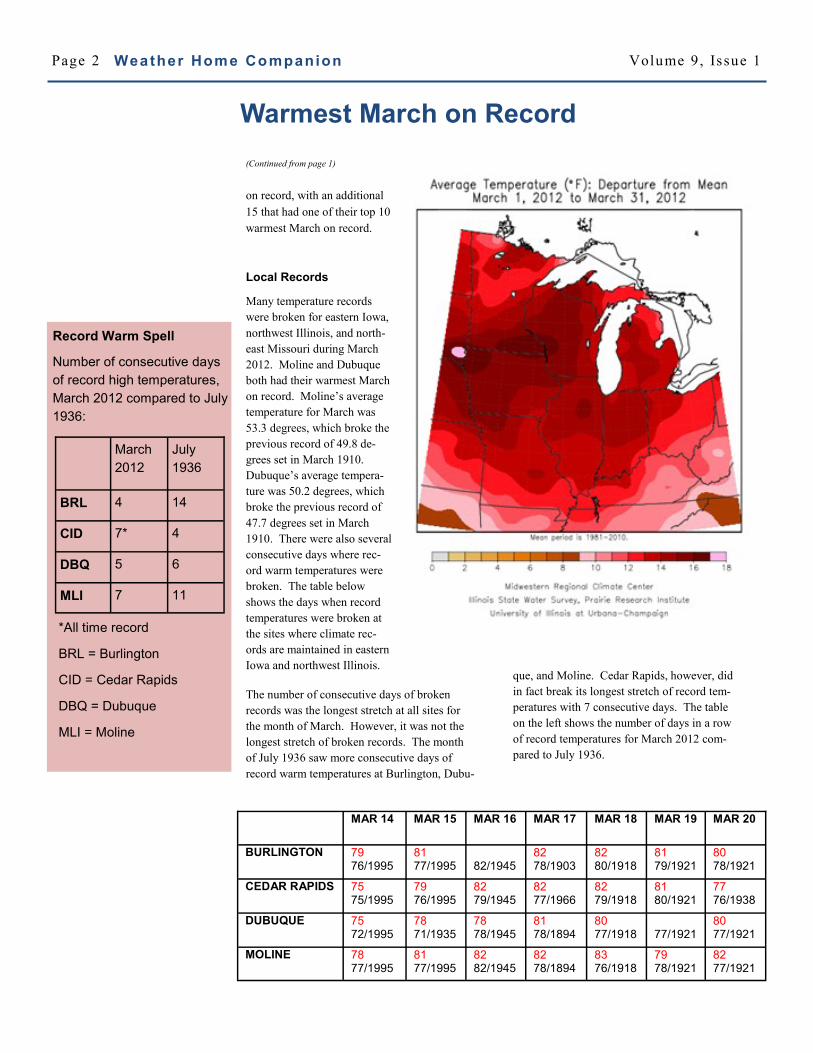
on record with an additional
15 that had one of their top 10
warmest March on record
Local Records
Many temperature records
were broken for eastern Iowa
northwest Illinois and north-
east Missouri during March
2012 Moline and Dubuque
both had their warmest March
on record Molinersquos average
temperature for March was
533 degrees which broke the
previous record of 498 de-
grees set in March 1910
Dubuquersquos average tempera-
ture was 502 degrees which
broke the previous record of
477 degrees set in March
1910 There were also several
consecutive days where rec-
ord warm temperatures were
broken The table below
shows the days when record
temperatures were broken at
the sites where climate rec-
ords are maintained in eastern
Iowa and northwest Illinois
The number of consecutive days of broken
records was the longest stretch at all sites for
the month of March However it was not the
longest stretch of broken records The month
of July 1936 saw more consecutive days of
record warm temperatures at Burlington Dubu-
(Continued from page 1)
Warmest March on Record
MAR 14 MAR 15 MAR 16 MAR 17 MAR 18 MAR 19 MAR 20
BURLINGTON 79 761995
81 771995
821945
82 781903
82 801918
81 791921
80 781921
CEDAR RAPIDS 75 751995
79 761995
82 791945
82 771966
82 791918
81 801921
77 761938
DUBUQUE 75 721995
78 711935
78 781945
81 781894
80 771918
771921
80 771921
MOLINE 78 771995
81 771995
82 821945
82 781894
83 761918
79 781921
82 771921
que and Moline Cedar Rapids however did
in fact break its longest stretch of record tem-
peratures with 7 consecutive days The table
on the left shows the number of days in a row
of record temperatures for March 2012 com-
pared to July 1936
March
2012
July
1936
BRL 4 14
CID 7 4
DBQ 5 6
MLI 7 11
Record Warm Spell
Number of consecutive days
of record high temperatures
March 2012 compared to July
1936
All time record
BRL = Burlington
CID = Cedar Rapids
DBQ = Dubuque
MLI = Moline
Page 3 Weather Home Companion Volume 9 Issue 1
the radar should improve the NWSrsquo ability to issue flash flood warnings more accurately
The time it took to complete the Dual-Pol modification was 6 days
Dual Polarization Radar Andy Ervin
The NWS Quad Citiesrsquoradar
was upgraded this past March
to include the ability to view
both horizontal and vertical
shapes of objects it detects
This technology commonly
called ldquoDual-Polrdquo will provide
new radar information For
meteorologists this will be a
great tool to help determine
rain vs hail rain vs snow and
even verify a tornadorsquos exist-
ence In addition it will help
with estimating rainfall
amounts and determine when
hail or snow is mixed with the
rain Rainfall estimates from
Dual-Pol radars account for
snow and hail within an event
and help to more correctly produce estimates of
how much rainfall occurred This will improve
the NWSrsquo ability to issue flash flood warnings
more accurately
A fun and informative NWS internet video is
available which explains the upgrade to our radar
system Please take a few minutes to type this
into a web browser or if yoursquore viewing this
article online click on the following link
wwwyoutubecomwatchv=tX6LH_l3P3Y
Illustration of the dual polarity of microwaves energy transmitted and
received by a dual pol doppler radar In dual polarity the energy is
emitted in both vertical and horizontal orientation helping the radar
better determine the shape and characteristics of meteorological
phenomena such as rain snow and hail
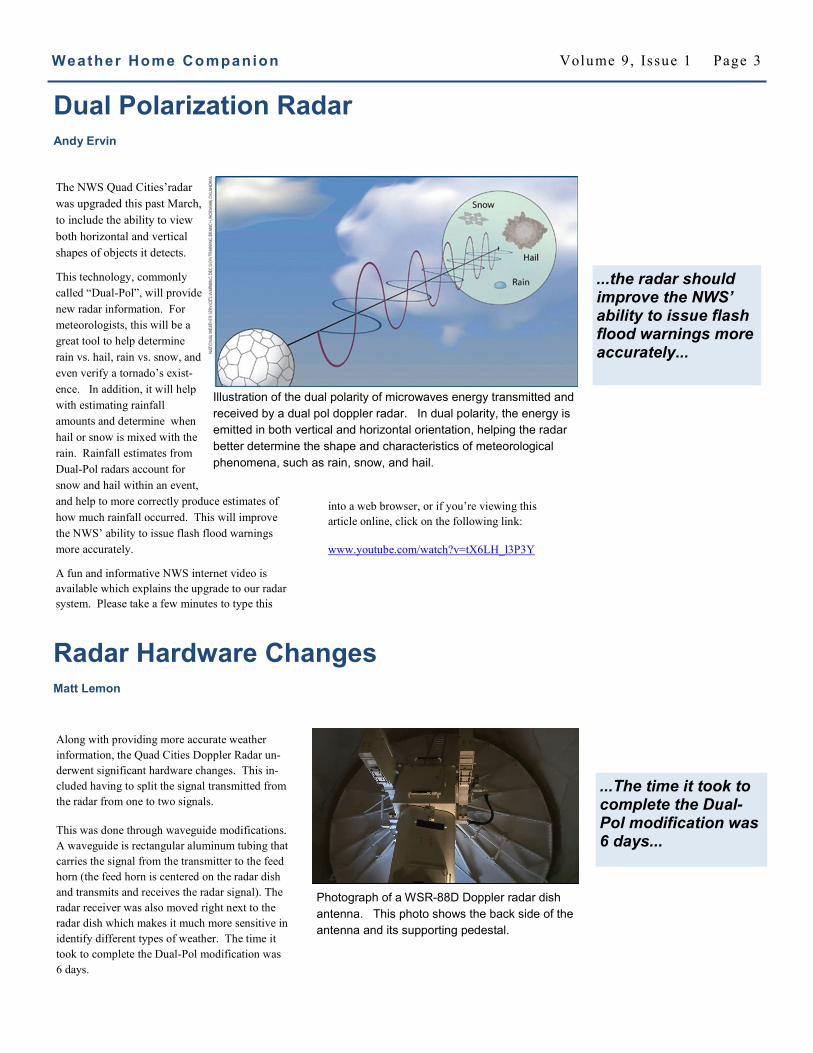
Radar Hardware Changes Matt Lemon
Along with providing more accurate weather
information the Quad Cities Doppler Radar un-
derwent significant hardware changes This in-
cluded having to split the signal transmitted from
the radar from one to two signals
This was done through waveguide modifications
A waveguide is rectangular aluminum tubing that
carries the signal from the transmitter to the feed
horn (the feed horn is centered on the radar dish
and transmits and receives the radar signal) The
radar receiver was also moved right next to the
radar dish which makes it much more sensitive in
identify different types of weather The time it
took to complete the Dual-Pol modification was
6 days
Photograph of a WSR-88D Doppler radar dish
antenna This photo shows the back side of the
antenna and its supporting pedestal
Page 4 Weather Home Companion Volume 9 Issue 1
COOP NEWS
New Generation Fischer-Porter
Automated Rain Gauges Installed Tom Olsen
During the last few months the 1950s
era tape-fed automated rain gauges
(photograph on the right) were re-
placed with a new generation electron-
ic gauge (below right) Currently the
National Weather Service in the Quad
Cities is responsible for maintaining
22 of these automated systems
Improvements
The new system uses a 12 volt battery
instead of a 6 volt battery and its accu-
racy will improve measuring rain
from the nearest 010 inches to the
nearest 0005 inches
New Procedures
Instead of removing the tape and mail-
ing it to our office after each month
observers will download the data onto
a USB Flash Drive (See photo on page
5) They can then send us the data one
of two ways First the most cost effi-
cient way is by emailing us the data
from the USB drive The second way
is by mailing us the USB drive in pre-
paid envelopes After we have down-
loaded the data at our office we will
mail back the USB Flash Drive in time
for observers to download the data for
the next month These two options will
be covered more during our installa-
tion and training date
(Continued on page 5)
Accuracy will improve measuring rain from the nearest 10 to the nearest 005 inches
Current Fischer-Porter Recording Gauge
New FPR-E Recording Gauge
Page 5 Weather Home Companion Volume 9 Issue 1
Tom Olsen
WxCODER is the official web-based entry system
for the National Weather Servicersquos Cooperative
Observer Program Combined with IV-ROCS or
Interactive Voice Remote Observation Collec-
tion System (pronounced ldquoivy rocksrdquo) the tele-
phone entry system WxCODER offers the means
for daily entry of weather records for COOP vol-
unteers WxCODER is sponsored by the National
Oceanic and Atmospheric Administration
(NOAA) through the National Weather Service
the Regional Climate Center Program and the
National Climatic Data Center
Highlights of the System
Improved real-time quality control of obser-
vations minimizing errors Eliminates the need to send in paper observa-
tion forms each month Interfaces with the IV-ROCS telephone sys-
tem for backup purposes If you are going to
be out of town and dont want to have your
backup observers logging into your account
(or if your internet connection is down) IV-
ROCS would be used to relay the observa-
tions and the data would be imported into
WXCODER for you Within five minutes your observation is re-
ceived by the NWS office and the River Fore-
cast Center for input into River Flood fore-
casting Transmitting Observations Several techniques are available for you to send
your daily observations For those of you who
currently do not do this we would greatly appreci-
ate it if you would begin sending your weather data
daily Daily reports are used for river forecasting
and for composing summaries for external distribu-
tion like the media
IV-ROCS is an automated telephone system that
allows you to enter your observed data The system
codes the observations and they are transmitted to
the NWS for relay around the network
(Continued on page 6)
Note If you are a Coopera-tive Weather Observer not currently using WXCoder or IV-ROCS telephone system and are interested in using it please send an e-mail to
thomasolsennoaagov
please be sure to include your Station Name Station Number and a phone number to contact you
Installation
The installation time break-down at each site
was as follows
bull Swap out set up and recalibrate 2 hours
bull Capture new metadata 30 minutes
bull Train the observer 30 minutes
-Thanks
(Continued from page 4)
New Generation Fischer-Porter
Automated Rain Gauges Installed
Flash Port Drive on the new FPR-E
Recording Gauge
Page 6 Weather Home Companion Volume 9 Issue 1
WxCODER
WXCODER uses a computer with internet
access for entering data onto a special home
page This system also has quality control to
avoid observation errors (eg low temperature
warmer than high temperature) The WXCOD-
ER system allows you to print your B-91 form
directly from the WXCODER page
If you are an observers and do not have access
to any of the above you may phone in observa-
tions to us using our 800 number
Regardless of how you send your ob-servations there are some things to keep in mind
Do not send in your observation more
than a half hour before your coded ob-
servation time If you do then your ob-
servation will not be recognized by our
computer
(Continued from page 5) Please use the correct value for trace
For IV-ROCS press the (star) key at the
prompt For WXCODER enter a T at
the appropriate prompt
Please use the correct value for below
zero temperatures For IV-ROCS users
this is coded by pressing the star key be-
fore the number (eg 18 for a tempera-
ture of -18 degrees) In WXCODER
enter the value using a negative sign
If no precipitation is reported do not
include a precipitation type code How-
ever go ahead and send the precipitation
amount of 000
Report the precipitation type code
(Applies to IV-ROCS) If more than two
precipitation types are observed you will
be asked one at a time Any code values
of 5 through 9 will prompt the system to
ask you to enter a snowfall value
The Power of None Why Zeros Matter Terry Simmons Zero that little character that looks like an ldquoOrdquo
is a powerhouse when it comes to a weather
observation When observers discover a dry
rain gage they may think there is nothing to
report After all nothing has no quantitative
value Nada implies no importance Therefore
the observer may surmise that leaving a blank
space in the observing form is the same thing
as reporting a zero because nothing was there
Cooperative weather observations are a com-
modity with immediate and long term value
Recordings of temperature and precipitation
may be used by insurance agents construction
and utility companies researchers and many
others Years later researchers may use coop
observations to study climate trends The blank
that seems reasonable today may make no
sense to someone looking at the weather obser-
vation in a different place or time Did the ob-
server forget to fill in this column Was some-
thing wrong with the equipment Was there
precipitation or not A zero removes doubt
Who would care about a day with no rain
Those who care about drought do Drought is a
prolonged dry period in a natural climate cycle
In agricultural communities drought is one of
many natural threats Drought affects the grow-
ing season water management stream flow
and navigation and drought also has the poten-
tial to impact people in metropolitan areas In
extreme conditions drought may lead to popu-
lation displacement water and food shortages
and long term environmental economic and
health impacts
According to Illinois State Climatologist Jim
Angel ldquoreporting zeroes is critical for monitor-
(Continued on page 7)
WXCODER has quality control to avoid observation errors
The blank that seems reasonable to-day may make no sense to someone looking at the weather observation in a different place or time
Page 7 Weather Home Companion Volume 9 Issue 1
ing and researching drought
conditions more so than
trends Thatrsquos because drought
is the one thing where you need
positive proof that it did not
rain You canrsquot make assump-
tions based on a lack of re-
portsrdquo
Zero is a meaningful value and
important report for climate
Documenting how widespread
dry conditions have become is
just one part of a regional
drought early warning system
(Continued from page 6)
The Power of None Why Zeros Matter
More information on drought is available at
wwwdroughtgov
What is Metadata Terry Simmons
I know the weather information record-ed on coop forms is considered data but what is metadata Metadata is basically data about data It is
structured information to describe the charac-
teristics physical attributes contents and the
location of data resources In essence metadata
answers questions related to who what when
where why and how of data being document-
ed
Where is metadata Metadata information is documented in a man-
ner similar to resource information found in
card catalogs at libraries or archival databases
at museums Weather water and climate
metadata and resource information is stored at
the National Climatic Data Center the US
Geological Service the Geospatial Data Clear-
inghouse and other locations
Why create metadata
Metadata help verify site-specific information
It can contain descriptions photos dates or
point of reference that can be stored and man-
aged in a database There are thousands of
weather observing sites across the nation and
each one has documentation to indicate where
it is located when the site was established
what type of data are provided and the time
these data are collected
Who cares about metadata
Scientists and researchers interested in weather
and climate care about metadata Metadata
provide valuable hints about how what and
why something may occur - kind of like using
clues to conduct a CSI-type investigation for
weather and climate Metadata can be used to
assess whether observations from different
locations can be compared identify how data
are gathered and help determine what conclu-
sions can be justified
Why use metadata
Metadata allow people to determine whether
the resources are likely to be useful to them
Metadata from a coop site can tell researchers
how long observations have been recorded at a
particular location whether the source of the
weather observation is an individual or institu-
tion and the type of data reported Metadata
describe characteristics of the observing site
such as terrain and exposure (ie mostly level
farmland or sparsely wooded suburban setting) (Continued on page 8)
helliprdquodrought is one thing where you need positive proof that it did not rainrdquo
hellipmetadata answers questions related to who what when where why and how of data being docu-mented
Page 8 Weather Home Companion Volume 9 Issue 1
document the location of equipment and de-
scribe the direction and distance to any obstruc-
tions Metadata also provide details on the type
of equipment used to take the measurement the
time the observation is to be taken and how the
observation is transferred to the weather office
(ie a daily phone call computer entry or a
paper form which is mailed to the office at the
end of the month)
When are metadata compiled Before metadata are compiled a need for data
must be documented For example when a new
weather observing site is proposed a technician
may visit the location to document latitude
longitude and elevation and determine whether
there is a suitable place without obstructions for
equipment The information gathered would
then be shared with other individuals such as a
state climatologist or a hydrologist at a river
forecast center who also decide whether data
from the proposed location would satisfy their
needs It is helpful when the proposed site is in a
(Continued from page 7) data sparse region but not as helpful when there
are already several data sources in the vicinity
Are metadata updated
Metadata can be created and maintained either
by automated information processing or by
manual work For sites that are already estab-
lished a technician may periodically review
metadata and document changes in the database
Occasionally the technician may travel to the
site with a GPS device to check the latitude and
longitude take photos and make certain equip-
ment exposure is still good
Why would it be necessary to check the exposure at a coop site Exposure is checked mainly to reveal the source
of data discrepancies Things change and if a
coop site has been in one location for many
years the trees which were small when the site
was established may be large enough to shade
the sensors new buildings may be closer to the
equipment now or some of the previous ob-
structions may be gone
What is Metadata
Summer Safety and Awareness Sara Schultz
As summer comes into full swing in the upcom-
ing months so does the active weather and heat
You want to be prepared not only for dangerous
weather such as flash floods tornadoes light-
ning and winds but for warmer temperatures
and the sun A hot dry summer day can be just
as dangerous and deadly as severe weather
The National Weather Service during the sum-
mer will issue different products for heat Fore-
casters decide whether or not to issue heat prod-
ucts based on upcoming weather conditions and
the heat index The heat index is when the rela-
tive humidity is factored into the actual air tem-
perature and is a measure of how it affects the
body
Just like a thunderstorm needs the proper fuel to
sustain (water vapor) so does the human body
Certain foods and drinks will hinder body func-
tions and can make it difficult to do even basic
tasks
Dehydration and heat-related illnesses are a big
factor during the summer and precautions need
to be taken to avoid them One of the main
things to remember when is to stay well hydrat-
ed Make sure to drink plenty of water and keep
caffeine and alcohol consumption low Alcohol
can dehydrate the body since it is a diuretic and
increases urination which makes you lose more
water electrolytes and minerals than you would
normally Not being aware of weather condi-
tions outdoors can lead to heat cramps heat
exhaustion and heat stroke
For more information and tips on preventing heat-related illnesses contact your local American Red Cross or visit wwwnyredcrossorgnd=summer_heat_safety_guide
hellipMetadata also pro-vide details on the type of equipmenthellip time of observationhellip and how the observa-tion is transferred to the weather office
Page 9 Weather Home Companion Volume 9 Issue 1
Summer Safety and Awareness (continued from page 8)
National Weather Service Heat Related Products
Heat Outlook issued when the potential for excessive heat exists in the next
3-7 days
Heat Advisory issued when heat indices are greater than 100degF for 1 to 2 days
along with a nighttime low temperatures greater than 75degF
Excessive Heat Watch issued when conditions are favorable for an excessive heat event
in the next 12-48 hours with heat indices greater than 105degF
during the day combined with nighttime low temperatures of
80deg F or higher for 2 consecutive days
Excessive Heat Warning issued when excessive heat event is expected in the next 12
hours with heat indices at least 105degF for more than 3 hours per
day for 2 consecutive days or heat indices greater than 115degF
for any period of time
Information on heat-related products can be found at wwwnwsnoaagovomheatindexshtml
Page 10 Weather Home Companion Volume 9 Issue 1
Mild Winter Leads to Record Warm
Spring 2012 David Sheets
Mild Winter The winter season of 2011-2012 was
notably warm and mild across eastern
Iowa northwest Illinois and far north-
east Missouri The average temperature
for the months of December January
and February was around 6 degrees
above normal at both Moline and Dubu-
que
The season also had well below normal
snowfall totals as shown in the graph in
the middle to the right Snowfall totals
at Dubuque and Moline were roughly 10
to 16 inches below normal
This mild weather broke a five year
stretch of colder than normal winter
seasons The last time the region had a
warmer than normal winter was during
the 2006-2007 season
Record Warm Spring
The mild weather continued into the
spring months of 2012 At both Moline
and Dubuque temperatures averaged
nearly 7 degrees above normal in
March April and May This set a record
for the warmest spring at both sites At
the Quad City International Airport in
Moline the average temperature was
573 which exceeded the old record of
564 degrees set in spring 1977
While March was by far the most excep-
tionally warm month (see ldquoWarmest
March on Recordrdquo in this issue) April
and May were also warm but to a lesser
extent As can be seen in the table on
the left March was around 14 degrees
above normal while April was around 1
above and May around 4 above at both
Moline and Dubuque
Will the Warmth Continue The latest outlook for June from the
NWSrsquo Climate Prediction Center sug-
gest the warm weather will continue It
indicates there is a 40 percent chance of
above normal temperatures for the
month Through the rest of the summer
season however it appears too close to
call with equal chances for above nor-
mal near normal or below normal tem-
peratures
Monthly Average Temperatures
Dubuque Average Departure March 502 +148 April 489 +07 May 631 +43
Moline Average Departure March 533 +142 April 524 +10 May 618 +44
Page 11 Weather Home Companion Volume 9 Issue 1
River Forecast Webpage Enhancements Maren Stoflet
Several enhancements have recently
been made for accessing the National
Weather Service river level and fore-
cast information on the web These
enhancements include a Google Maps
based interface that allows easier nav-
igation for your area of interest and
quicker access to view the latest river
stages and forecast river stages at each
location
In another effort the NWS Quad Cit-
ies and the Iowa Flood Center (IFC) at
The University of Iowa have part-
nered again to make flood inundation
maps more accessible As a result of
this partnership Cedar River flood
inundation maps for the Cedar Rapids
area are now available on the National
Weather Service website
Flood inundation maps can be a help-
ful tool to visualize the potential ex-
tent of flooding at various river levels
These detailed maps provide infor-
mation that can assist in planning and
mitigation decisions as well as enable
communities and individuals to make
informed decisions about their flood
risks
The Cedar River inundation maps for
the Cedar Rapids area are available in
addition to the already available Iowa
River flood inundation maps for the
Iowa City area Check them both out
at
waterweathergovahps
inundationphp
Flood inundation map of the
Cedar River in Cedar Rapids
Iowa This map recently joined
the Iowa River in Iowa City on the
web with detailed flood data
Google-based web interface map of river and forecast in-
formation for eastern Iowa and northwest Illinois Each
green dot allows access to the latest river stages and fore-
casts for those locations
This web interface can be found at this address waterweathergovahps2indexphpwfo=dvn
Smart phone users may
find more information via
the above link
Editor David Sheets
davidsheetsnoaagov
Contributors
Andy Ervin Senior
Forecaster
Tim Gross Meteorologist
Intern
Steve Kuhl Meteorologist-in-
Charge
Matt Lemon Electronics
Technician
Tom Olsen Hydro-
meteorological Technician
Sara Schultz Student
Trainee
Terry Simmons Data
Acquisition Program Manager
Maren Stoflet Hydrology
Program Manager
NWS Quad Cities
9050 Harrison Street
Davenport IA 52806
Inside this issue
Warmest March on Record
Weather-Ready Nation
Dual Polarization Radar
Radar Hardware Changes
New Fischer-Porter Automated Rain Gauges Installed
WxCODER
The Power of None Why Zeros Matter
What is Metadata
Summer Safety and Awareness
Mild Winter Leads to Record Warm Spring 2012
River Forecast Webpage Enhancements
NWS Quad Cities 9050 Harrison Street Davenport IA 52806 Phone (563) 386-3976 On the web weathergovquadcities
Page 2 Weather Home Companion Volume 9 Issue 1
on record with an additional
15 that had one of their top 10
warmest March on record
Local Records
Many temperature records
were broken for eastern Iowa
northwest Illinois and north-
east Missouri during March
2012 Moline and Dubuque
both had their warmest March
on record Molinersquos average
temperature for March was
533 degrees which broke the
previous record of 498 de-
grees set in March 1910
Dubuquersquos average tempera-
ture was 502 degrees which
broke the previous record of
477 degrees set in March
1910 There were also several
consecutive days where rec-
ord warm temperatures were
broken The table below
shows the days when record
temperatures were broken at
the sites where climate rec-
ords are maintained in eastern
Iowa and northwest Illinois
The number of consecutive days of broken
records was the longest stretch at all sites for
the month of March However it was not the
longest stretch of broken records The month
of July 1936 saw more consecutive days of
record warm temperatures at Burlington Dubu-
(Continued from page 1)
Warmest March on Record
MAR 14 MAR 15 MAR 16 MAR 17 MAR 18 MAR 19 MAR 20
BURLINGTON 79 761995
81 771995
821945
82 781903
82 801918
81 791921
80 781921
CEDAR RAPIDS 75 751995
79 761995
82 791945
82 771966
82 791918
81 801921
77 761938
DUBUQUE 75 721995
78 711935
78 781945
81 781894
80 771918
771921
80 771921
MOLINE 78 771995
81 771995
82 821945
82 781894
83 761918
79 781921
82 771921
que and Moline Cedar Rapids however did
in fact break its longest stretch of record tem-
peratures with 7 consecutive days The table
on the left shows the number of days in a row
of record temperatures for March 2012 com-
pared to July 1936
March
2012
July
1936
BRL 4 14
CID 7 4
DBQ 5 6
MLI 7 11
Record Warm Spell
Number of consecutive days
of record high temperatures
March 2012 compared to July
1936
All time record
BRL = Burlington
CID = Cedar Rapids
DBQ = Dubuque
MLI = Moline
Page 3 Weather Home Companion Volume 9 Issue 1
the radar should improve the NWSrsquo ability to issue flash flood warnings more accurately
The time it took to complete the Dual-Pol modification was 6 days
Dual Polarization Radar Andy Ervin
The NWS Quad Citiesrsquoradar
was upgraded this past March
to include the ability to view
both horizontal and vertical
shapes of objects it detects
This technology commonly
called ldquoDual-Polrdquo will provide
new radar information For
meteorologists this will be a
great tool to help determine
rain vs hail rain vs snow and
even verify a tornadorsquos exist-
ence In addition it will help
with estimating rainfall
amounts and determine when
hail or snow is mixed with the
rain Rainfall estimates from
Dual-Pol radars account for
snow and hail within an event
and help to more correctly produce estimates of
how much rainfall occurred This will improve
the NWSrsquo ability to issue flash flood warnings
more accurately
A fun and informative NWS internet video is
available which explains the upgrade to our radar
system Please take a few minutes to type this
into a web browser or if yoursquore viewing this
article online click on the following link
wwwyoutubecomwatchv=tX6LH_l3P3Y
Illustration of the dual polarity of microwaves energy transmitted and
received by a dual pol doppler radar In dual polarity the energy is
emitted in both vertical and horizontal orientation helping the radar
better determine the shape and characteristics of meteorological
phenomena such as rain snow and hail
Radar Hardware Changes Matt Lemon
Along with providing more accurate weather
information the Quad Cities Doppler Radar un-
derwent significant hardware changes This in-
cluded having to split the signal transmitted from
the radar from one to two signals
This was done through waveguide modifications
A waveguide is rectangular aluminum tubing that
carries the signal from the transmitter to the feed
horn (the feed horn is centered on the radar dish
and transmits and receives the radar signal) The
radar receiver was also moved right next to the
radar dish which makes it much more sensitive in
identify different types of weather The time it
took to complete the Dual-Pol modification was
6 days
Photograph of a WSR-88D Doppler radar dish
antenna This photo shows the back side of the
antenna and its supporting pedestal
Page 4 Weather Home Companion Volume 9 Issue 1
COOP NEWS
New Generation Fischer-Porter
Automated Rain Gauges Installed Tom Olsen
During the last few months the 1950s
era tape-fed automated rain gauges
(photograph on the right) were re-
placed with a new generation electron-
ic gauge (below right) Currently the
National Weather Service in the Quad
Cities is responsible for maintaining
22 of these automated systems
Improvements
The new system uses a 12 volt battery
instead of a 6 volt battery and its accu-
racy will improve measuring rain
from the nearest 010 inches to the
nearest 0005 inches
New Procedures
Instead of removing the tape and mail-
ing it to our office after each month
observers will download the data onto
a USB Flash Drive (See photo on page
5) They can then send us the data one
of two ways First the most cost effi-
cient way is by emailing us the data
from the USB drive The second way
is by mailing us the USB drive in pre-
paid envelopes After we have down-
loaded the data at our office we will
mail back the USB Flash Drive in time
for observers to download the data for
the next month These two options will
be covered more during our installa-
tion and training date
(Continued on page 5)
Accuracy will improve measuring rain from the nearest 10 to the nearest 005 inches
Current Fischer-Porter Recording Gauge
New FPR-E Recording Gauge
Page 5 Weather Home Companion Volume 9 Issue 1
Tom Olsen
WxCODER is the official web-based entry system
for the National Weather Servicersquos Cooperative
Observer Program Combined with IV-ROCS or
Interactive Voice Remote Observation Collec-
tion System (pronounced ldquoivy rocksrdquo) the tele-
phone entry system WxCODER offers the means
for daily entry of weather records for COOP vol-
unteers WxCODER is sponsored by the National
Oceanic and Atmospheric Administration
(NOAA) through the National Weather Service
the Regional Climate Center Program and the
National Climatic Data Center
Highlights of the System
Improved real-time quality control of obser-
vations minimizing errors Eliminates the need to send in paper observa-
tion forms each month Interfaces with the IV-ROCS telephone sys-
tem for backup purposes If you are going to
be out of town and dont want to have your
backup observers logging into your account
(or if your internet connection is down) IV-
ROCS would be used to relay the observa-
tions and the data would be imported into
WXCODER for you Within five minutes your observation is re-
ceived by the NWS office and the River Fore-
cast Center for input into River Flood fore-
casting Transmitting Observations Several techniques are available for you to send
your daily observations For those of you who
currently do not do this we would greatly appreci-
ate it if you would begin sending your weather data
daily Daily reports are used for river forecasting
and for composing summaries for external distribu-
tion like the media
IV-ROCS is an automated telephone system that
allows you to enter your observed data The system
codes the observations and they are transmitted to
the NWS for relay around the network
(Continued on page 6)
Note If you are a Coopera-tive Weather Observer not currently using WXCoder or IV-ROCS telephone system and are interested in using it please send an e-mail to
thomasolsennoaagov
please be sure to include your Station Name Station Number and a phone number to contact you
Installation
The installation time break-down at each site
was as follows
bull Swap out set up and recalibrate 2 hours
bull Capture new metadata 30 minutes
bull Train the observer 30 minutes
-Thanks
(Continued from page 4)
New Generation Fischer-Porter
Automated Rain Gauges Installed
Flash Port Drive on the new FPR-E
Recording Gauge
Page 6 Weather Home Companion Volume 9 Issue 1
WxCODER
WXCODER uses a computer with internet
access for entering data onto a special home
page This system also has quality control to
avoid observation errors (eg low temperature
warmer than high temperature) The WXCOD-
ER system allows you to print your B-91 form
directly from the WXCODER page
If you are an observers and do not have access
to any of the above you may phone in observa-
tions to us using our 800 number
Regardless of how you send your ob-servations there are some things to keep in mind
Do not send in your observation more
than a half hour before your coded ob-
servation time If you do then your ob-
servation will not be recognized by our
computer
(Continued from page 5) Please use the correct value for trace
For IV-ROCS press the (star) key at the
prompt For WXCODER enter a T at
the appropriate prompt
Please use the correct value for below
zero temperatures For IV-ROCS users
this is coded by pressing the star key be-
fore the number (eg 18 for a tempera-
ture of -18 degrees) In WXCODER
enter the value using a negative sign
If no precipitation is reported do not
include a precipitation type code How-
ever go ahead and send the precipitation
amount of 000
Report the precipitation type code
(Applies to IV-ROCS) If more than two
precipitation types are observed you will
be asked one at a time Any code values
of 5 through 9 will prompt the system to
ask you to enter a snowfall value
The Power of None Why Zeros Matter Terry Simmons Zero that little character that looks like an ldquoOrdquo
is a powerhouse when it comes to a weather
observation When observers discover a dry
rain gage they may think there is nothing to
report After all nothing has no quantitative
value Nada implies no importance Therefore
the observer may surmise that leaving a blank
space in the observing form is the same thing
as reporting a zero because nothing was there
Cooperative weather observations are a com-
modity with immediate and long term value
Recordings of temperature and precipitation
may be used by insurance agents construction
and utility companies researchers and many
others Years later researchers may use coop
observations to study climate trends The blank
that seems reasonable today may make no
sense to someone looking at the weather obser-
vation in a different place or time Did the ob-
server forget to fill in this column Was some-
thing wrong with the equipment Was there
precipitation or not A zero removes doubt
Who would care about a day with no rain
Those who care about drought do Drought is a
prolonged dry period in a natural climate cycle
In agricultural communities drought is one of
many natural threats Drought affects the grow-
ing season water management stream flow
and navigation and drought also has the poten-
tial to impact people in metropolitan areas In
extreme conditions drought may lead to popu-
lation displacement water and food shortages
and long term environmental economic and
health impacts
According to Illinois State Climatologist Jim
Angel ldquoreporting zeroes is critical for monitor-
(Continued on page 7)
WXCODER has quality control to avoid observation errors
The blank that seems reasonable to-day may make no sense to someone looking at the weather observation in a different place or time
Page 7 Weather Home Companion Volume 9 Issue 1
ing and researching drought
conditions more so than
trends Thatrsquos because drought
is the one thing where you need
positive proof that it did not
rain You canrsquot make assump-
tions based on a lack of re-
portsrdquo
Zero is a meaningful value and
important report for climate
Documenting how widespread
dry conditions have become is
just one part of a regional
drought early warning system
(Continued from page 6)
The Power of None Why Zeros Matter
More information on drought is available at
wwwdroughtgov
What is Metadata Terry Simmons
I know the weather information record-ed on coop forms is considered data but what is metadata Metadata is basically data about data It is
structured information to describe the charac-
teristics physical attributes contents and the
location of data resources In essence metadata
answers questions related to who what when
where why and how of data being document-
ed
Where is metadata Metadata information is documented in a man-
ner similar to resource information found in
card catalogs at libraries or archival databases
at museums Weather water and climate
metadata and resource information is stored at
the National Climatic Data Center the US
Geological Service the Geospatial Data Clear-
inghouse and other locations
Why create metadata
Metadata help verify site-specific information
It can contain descriptions photos dates or
point of reference that can be stored and man-
aged in a database There are thousands of
weather observing sites across the nation and
each one has documentation to indicate where
it is located when the site was established
what type of data are provided and the time
these data are collected
Who cares about metadata
Scientists and researchers interested in weather
and climate care about metadata Metadata
provide valuable hints about how what and
why something may occur - kind of like using
clues to conduct a CSI-type investigation for
weather and climate Metadata can be used to
assess whether observations from different
locations can be compared identify how data
are gathered and help determine what conclu-
sions can be justified
Why use metadata
Metadata allow people to determine whether
the resources are likely to be useful to them
Metadata from a coop site can tell researchers
how long observations have been recorded at a
particular location whether the source of the
weather observation is an individual or institu-
tion and the type of data reported Metadata
describe characteristics of the observing site
such as terrain and exposure (ie mostly level
farmland or sparsely wooded suburban setting) (Continued on page 8)
helliprdquodrought is one thing where you need positive proof that it did not rainrdquo
hellipmetadata answers questions related to who what when where why and how of data being docu-mented
Page 8 Weather Home Companion Volume 9 Issue 1
document the location of equipment and de-
scribe the direction and distance to any obstruc-
tions Metadata also provide details on the type
of equipment used to take the measurement the
time the observation is to be taken and how the
observation is transferred to the weather office
(ie a daily phone call computer entry or a
paper form which is mailed to the office at the
end of the month)
When are metadata compiled Before metadata are compiled a need for data
must be documented For example when a new
weather observing site is proposed a technician
may visit the location to document latitude
longitude and elevation and determine whether
there is a suitable place without obstructions for
equipment The information gathered would
then be shared with other individuals such as a
state climatologist or a hydrologist at a river
forecast center who also decide whether data
from the proposed location would satisfy their
needs It is helpful when the proposed site is in a
(Continued from page 7) data sparse region but not as helpful when there
are already several data sources in the vicinity
Are metadata updated
Metadata can be created and maintained either
by automated information processing or by
manual work For sites that are already estab-
lished a technician may periodically review
metadata and document changes in the database
Occasionally the technician may travel to the
site with a GPS device to check the latitude and
longitude take photos and make certain equip-
ment exposure is still good
Why would it be necessary to check the exposure at a coop site Exposure is checked mainly to reveal the source
of data discrepancies Things change and if a
coop site has been in one location for many
years the trees which were small when the site
was established may be large enough to shade
the sensors new buildings may be closer to the
equipment now or some of the previous ob-
structions may be gone
What is Metadata
Summer Safety and Awareness Sara Schultz
As summer comes into full swing in the upcom-
ing months so does the active weather and heat
You want to be prepared not only for dangerous
weather such as flash floods tornadoes light-
ning and winds but for warmer temperatures
and the sun A hot dry summer day can be just
as dangerous and deadly as severe weather
The National Weather Service during the sum-
mer will issue different products for heat Fore-
casters decide whether or not to issue heat prod-
ucts based on upcoming weather conditions and
the heat index The heat index is when the rela-
tive humidity is factored into the actual air tem-
perature and is a measure of how it affects the
body
Just like a thunderstorm needs the proper fuel to
sustain (water vapor) so does the human body
Certain foods and drinks will hinder body func-
tions and can make it difficult to do even basic
tasks
Dehydration and heat-related illnesses are a big
factor during the summer and precautions need
to be taken to avoid them One of the main
things to remember when is to stay well hydrat-
ed Make sure to drink plenty of water and keep
caffeine and alcohol consumption low Alcohol
can dehydrate the body since it is a diuretic and
increases urination which makes you lose more
water electrolytes and minerals than you would
normally Not being aware of weather condi-
tions outdoors can lead to heat cramps heat
exhaustion and heat stroke
For more information and tips on preventing heat-related illnesses contact your local American Red Cross or visit wwwnyredcrossorgnd=summer_heat_safety_guide
hellipMetadata also pro-vide details on the type of equipmenthellip time of observationhellip and how the observa-tion is transferred to the weather office
Page 9 Weather Home Companion Volume 9 Issue 1
Summer Safety and Awareness (continued from page 8)
National Weather Service Heat Related Products
Heat Outlook issued when the potential for excessive heat exists in the next
3-7 days
Heat Advisory issued when heat indices are greater than 100degF for 1 to 2 days
along with a nighttime low temperatures greater than 75degF
Excessive Heat Watch issued when conditions are favorable for an excessive heat event
in the next 12-48 hours with heat indices greater than 105degF
during the day combined with nighttime low temperatures of
80deg F or higher for 2 consecutive days
Excessive Heat Warning issued when excessive heat event is expected in the next 12
hours with heat indices at least 105degF for more than 3 hours per
day for 2 consecutive days or heat indices greater than 115degF
for any period of time
Information on heat-related products can be found at wwwnwsnoaagovomheatindexshtml
Page 10 Weather Home Companion Volume 9 Issue 1
Mild Winter Leads to Record Warm
Spring 2012 David Sheets
Mild Winter The winter season of 2011-2012 was
notably warm and mild across eastern
Iowa northwest Illinois and far north-
east Missouri The average temperature
for the months of December January
and February was around 6 degrees
above normal at both Moline and Dubu-
que
The season also had well below normal
snowfall totals as shown in the graph in
the middle to the right Snowfall totals
at Dubuque and Moline were roughly 10
to 16 inches below normal
This mild weather broke a five year
stretch of colder than normal winter
seasons The last time the region had a
warmer than normal winter was during
the 2006-2007 season
Record Warm Spring
The mild weather continued into the
spring months of 2012 At both Moline
and Dubuque temperatures averaged
nearly 7 degrees above normal in
March April and May This set a record
for the warmest spring at both sites At
the Quad City International Airport in
Moline the average temperature was
573 which exceeded the old record of
564 degrees set in spring 1977
While March was by far the most excep-
tionally warm month (see ldquoWarmest
March on Recordrdquo in this issue) April
and May were also warm but to a lesser
extent As can be seen in the table on
the left March was around 14 degrees
above normal while April was around 1
above and May around 4 above at both
Moline and Dubuque
Will the Warmth Continue The latest outlook for June from the
NWSrsquo Climate Prediction Center sug-
gest the warm weather will continue It
indicates there is a 40 percent chance of
above normal temperatures for the
month Through the rest of the summer
season however it appears too close to
call with equal chances for above nor-
mal near normal or below normal tem-
peratures
Monthly Average Temperatures
Dubuque Average Departure March 502 +148 April 489 +07 May 631 +43
Moline Average Departure March 533 +142 April 524 +10 May 618 +44
Page 11 Weather Home Companion Volume 9 Issue 1
River Forecast Webpage Enhancements Maren Stoflet
Several enhancements have recently
been made for accessing the National
Weather Service river level and fore-
cast information on the web These
enhancements include a Google Maps
based interface that allows easier nav-
igation for your area of interest and
quicker access to view the latest river
stages and forecast river stages at each
location
In another effort the NWS Quad Cit-
ies and the Iowa Flood Center (IFC) at
The University of Iowa have part-
nered again to make flood inundation
maps more accessible As a result of
this partnership Cedar River flood
inundation maps for the Cedar Rapids
area are now available on the National
Weather Service website
Flood inundation maps can be a help-
ful tool to visualize the potential ex-
tent of flooding at various river levels
These detailed maps provide infor-
mation that can assist in planning and
mitigation decisions as well as enable
communities and individuals to make
informed decisions about their flood
risks
The Cedar River inundation maps for
the Cedar Rapids area are available in
addition to the already available Iowa
River flood inundation maps for the
Iowa City area Check them both out
at
waterweathergovahps
inundationphp
Flood inundation map of the
Cedar River in Cedar Rapids
Iowa This map recently joined
the Iowa River in Iowa City on the
web with detailed flood data
Google-based web interface map of river and forecast in-
formation for eastern Iowa and northwest Illinois Each
green dot allows access to the latest river stages and fore-
casts for those locations
This web interface can be found at this address waterweathergovahps2indexphpwfo=dvn
Smart phone users may
find more information via
the above link
Editor David Sheets
davidsheetsnoaagov
Contributors
Andy Ervin Senior
Forecaster
Tim Gross Meteorologist
Intern
Steve Kuhl Meteorologist-in-
Charge
Matt Lemon Electronics
Technician
Tom Olsen Hydro-
meteorological Technician
Sara Schultz Student
Trainee
Terry Simmons Data
Acquisition Program Manager
Maren Stoflet Hydrology
Program Manager
NWS Quad Cities
9050 Harrison Street
Davenport IA 52806
Inside this issue
Warmest March on Record
Weather-Ready Nation
Dual Polarization Radar
Radar Hardware Changes
New Fischer-Porter Automated Rain Gauges Installed
WxCODER
The Power of None Why Zeros Matter
What is Metadata
Summer Safety and Awareness
Mild Winter Leads to Record Warm Spring 2012
River Forecast Webpage Enhancements
NWS Quad Cities 9050 Harrison Street Davenport IA 52806 Phone (563) 386-3976 On the web weathergovquadcities
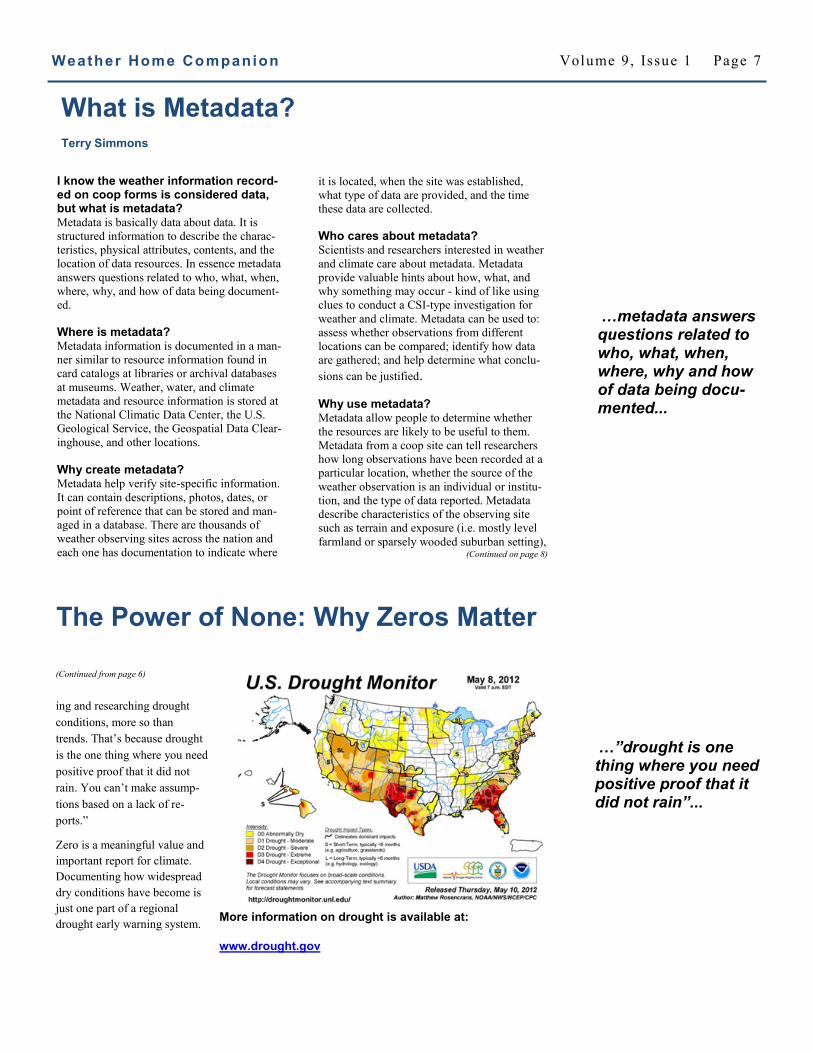
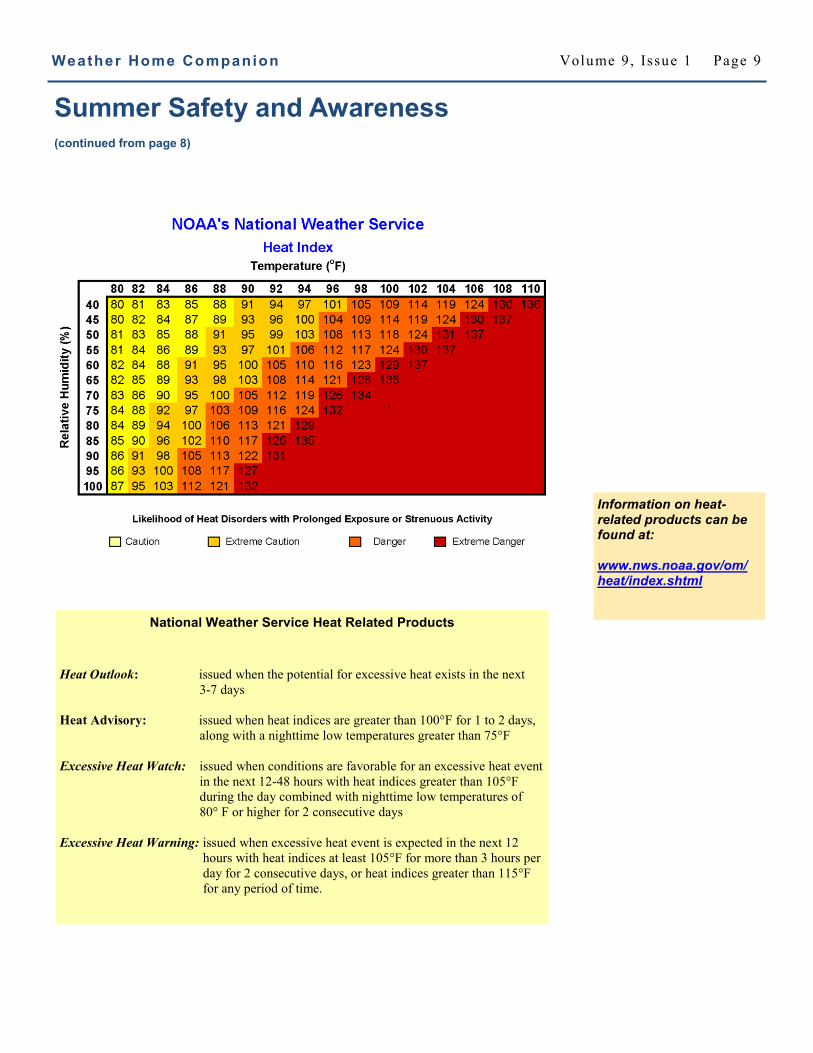
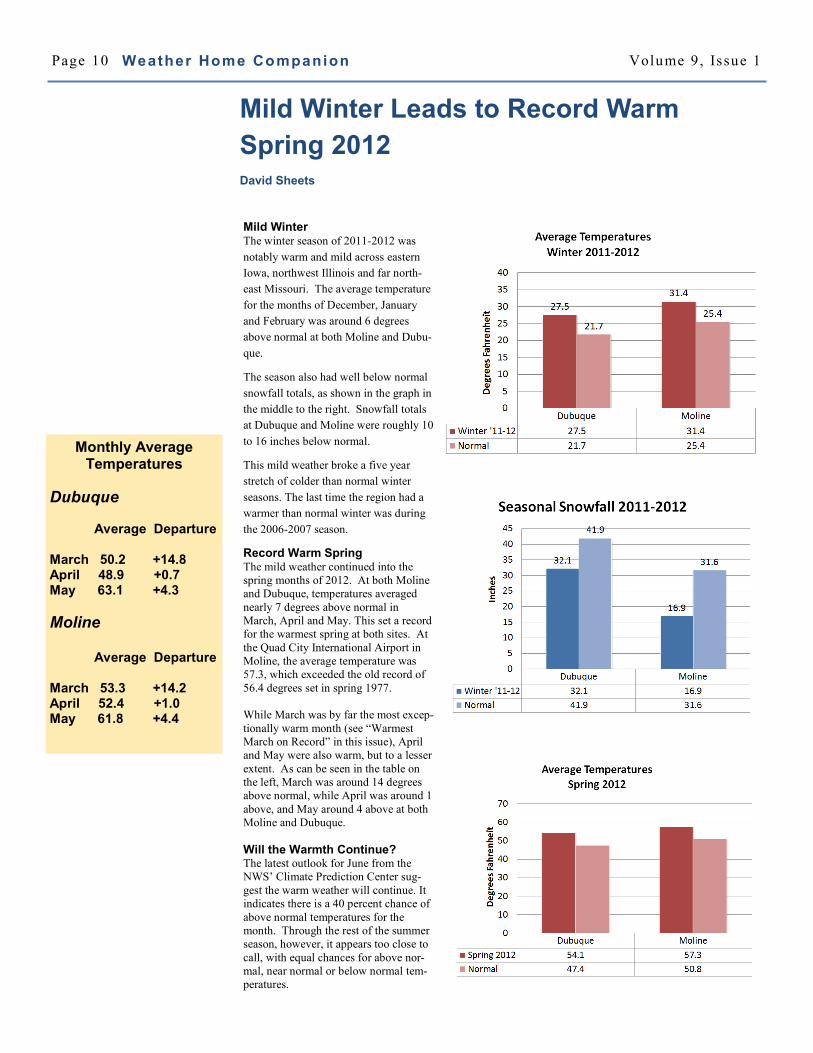