Spring (77386) Homes Sales Report - September 2016
10
The Home Sales Real Estate Report Spring TX | 77386 | September, 2016 Average Sold Price / Median Sold Price – Month By Month Average Price Per Square Foot – Month By Month Average Days On Market – Month By Month Months Supply of For Sale Inventory – Month By Month 9000 Forest Crossing Drive | The Woodlands TX | 281-367-3531 281-367-3531
-
Upload
ken-brand -
Category
Real Estate
-
view
22 -
download
1
Transcript of Spring (77386) Homes Sales Report - September 2016

TheHomeSalesRealEstateReportSpringTX|77386|September,2016AverageSoldPrice/MedianSoldPrice–MonthByMonthAveragePricePerSquareFoot–MonthByMonthAverageDaysOnMarket–MonthByMonthMonthsSupplyofForSaleInventory–MonthByMonth
9000 Forest Crossing Drive | The Woodlands TX | 281-367-3531
281-367-3531

KEY INFORMATION
2 Years (Monthly) 08/01/14 - 08/31/16
Market Dynamics BHGRE Gary GreeneSold Average vs. Median Price
Monthly % Total % Change
9.870.14
Monthly Change
871.93Median
Total ChangeAverage 372.66 8,943.91 3.34
20,926.260.41
ZIP Codes:All
Bathrooms:Single-Family: (Free Standing, Patio Home) Sq Ft:
HAR AllAll AllAllAll Lot Size:Bedrooms:Property Types:
77386
2 Years (Monthly) Construction Type:Price:Period:MLS:
09/09/16BrokerMetrics®Information not guaranteed. © 2006 - 2016 Terradatum and its suppliers and licensors (http://www.terradatum.com/metrics/licensors).
© 2016 - 2017 Houston Association of Realtors Certain information contained herein is derived from information which is the licensed property of, and copyrighted by, Houston Association of Realtors
1 of 2

BHGRE Gary Greene
2 Years (Monthly) 08/01/14 - 08/31/16
Market DynamicsSold Average vs. Median Price
Time Period # Properties Sold Sold Average $ Sold Median $ Sold Avg DOMAverage $ - Median $ Median $ as % of Average $142Aug-16 295,055 84.3248,750 46,305 60134Jul-16 272,973 85.1232,200 40,773 56150Jun-16 278,558 82.5229,728 48,830 69123May-16 267,010 85.8229,000 38,010 56124Apr-16 281,770 87.0245,000 36,770 62109Mar-16 275,141 81.4224,000 51,141 49
89Feb-16 248,573 79.7198,000 50,573 5572Jan-16 269,004 76.5205,750 63,254 68
121Dec-15 281,984 93.3263,190 18,794 5281Nov-15 246,735 79.8197,000 49,735 5899Oct-15 257,684 79.5205,000 52,684 56
107Sep-15 273,669 85.9235,000 38,669 54133Aug-15 282,538 81.4229,900 52,638 43137Jul-15 304,688 78.0237,500 67,188 44130Jun-15 284,805 84.2239,750 45,055 55110May-15 312,791 74.6233,275 79,516 50105Apr-15 279,577 77.4216,500 63,077 52
98Mar-15 270,553 79.3214,500 56,053 5085Feb-15 262,715 83.0218,000 44,715 5846Jan-15 249,092 78.5195,500 53,592 4699Dec-14 247,055 85.0209,990 37,065 5290Nov-14 248,031 77.8193,000 55,031 48
117Oct-14 262,930 74.6196,244 66,686 39118Sep-14 272,149 79.6216,700 55,449 41145Aug-14 290,104 86.2250,000 40,104 37
© 2016 - 2017 Houston Association of Realtors Certain information contained herein is derived from information which is the licensed property of, and copyrighted by, Houston Association of Realtors
2 09/09/162 ofBrokerMetrics®Information not guaranteed. © 2006 - 2016 Terradatum and its suppliers and licensors (http://www.terradatum.com/metrics/licensors).

Market DynamicsAverage $/SQFT (FS, Sold)
2 Years (Monthly) 08/01/14 - 08/31/16
BHGRE Gary Greene
Price:
-0.07
AllAll All
0.12-2.16
Property Types:HAR
Sold $/SQFTFor Sale $/SQFT
MLS: All
0.12
Bathrooms:
-0.09
All
2.832.91
Construction Type:
Total Change
Sq Ft:
Monthly Change
2 Years (Monthly)
ZIP Codes:
All
-1.80
Lot Size:Period:
Monthly %
Bedrooms:
KEY INFORMATION
Total % Change
Single-Family: (Free Standing, Patio Home)77386
09/09/16BrokerMetrics®Information not guaranteed. © 2006 - 2016 Terradatum and its suppliers and licensors (http://www.terradatum.com/metrics/licensors).
© 2016 - 2017 Houston Association of Realtors Certain information contained herein is derived from information which is the licensed property of, and copyrighted by, Houston Association of Realtors
1 of 2

Average $/SQFT (FS, Sold)2 Years (Monthly) 08/01/14 - 08/31/16
Market Dynamics BHGRE Gary Greene
#
FOR SALE
SQFTPeriod$/Avg
SQFTTime
Avg $
UNDER CONTRACT
# Avg $Avg
SQFT$/
SQFT
SOLD EXPIRED NEW LISTINGS
# # #Avg $ Avg $ Avg $Avg
SQFT$/
SQFTAvg
SQFT$/
SQFTAvg
SQFT$/
SQFT
118Aug-16 607 3,090364,105 128 292,076 2,732 107 142 67 165295,055 329,952 332,0872,737 108 2,967 110 2,847 117116Jul-16 633 3,059355,737 135 294,127 2,681 110 134 56 171272,973 343,883 304,8112,626 104 3,013 114 2,765 110117Jun-16 658 3,071359,328 142 307,760 2,723 113 150 54 216278,558 364,382 298,8512,603 107 3,154 116 2,789 107119May-16 650 3,066365,806 154 296,565 2,648 112 123 54 202267,010 374,391 327,3992,577 104 3,102 121 2,857 115118Apr-16 613 3,054361,104 119 269,092 2,590 104 124 46 214281,770 384,682 327,6782,681 105 3,210 120 2,817 116117Mar-16 581 3,071361,160 131 279,313 2,603 107 109 51 193275,141 431,568 311,4592,611 105 3,424 125 2,789 112119Feb-16 562 3,060364,003 120 284,246 2,548 112 89 54 158248,573 384,036 315,0302,382 104 3,109 124 2,826 111119Jan-16 539 3,036361,979 88 271,102 2,502 108 72 47 140269,004 350,108 301,2572,612 103 3,046 115 2,720 111121Dec-15 548 3,087375,259 83 280,311 2,635 106 121 66 98281,984 446,139 306,6542,718 104 3,291 136 2,725 113121Nov-15 597 3,089375,801 89 290,393 2,702 107 81 58 121246,735 395,143 344,2742,436 101 3,089 128 2,958 116120Oct-15 621 3,016361,883 100 254,131 2,423 105 99 45 142257,684 369,336 327,9482,557 101 3,209 115 2,856 115119Sep-15 652 3,040363,518 105 286,899 2,720 105 107 68 168273,669 422,484 316,7432,664 103 3,368 125 2,804 113120Aug-15 645 3,027363,023 109 259,292 2,451 106 133 52 177282,538 424,730 307,8612,604 108 3,348 127 2,741 112120Jul-15 622 3,054367,256 120 306,963 2,739 112 137 34 216304,688 351,146 299,6512,824 108 3,063 115 2,677 111120Jun-15 583 3,121375,052 129 303,244 2,728 111 130 48 190284,805 329,762 331,5712,657 107 3,061 108 2,833 117120May-15 563 3,171381,829 123 296,176 2,697 110 110 47 186312,791 486,871 332,9492,883 108 3,661 133 2,914 114120Apr-15 538 3,175382,286 118 298,770 2,712 110 105 43 196279,577 404,043 306,2822,590 108 3,374 120 2,814 109124Mar-15 497 3,180392,735 127 298,951 2,645 113 98 28 176270,553 413,710 353,6442,641 102 3,130 132 2,962 119121Feb-15 426 3,183386,651 83 275,772 2,676 103 85 22 119262,715 403,474 340,8112,582 102 3,397 119 2,981 114120Jan-15 416 3,095372,965 87 252,521 2,462 103 46 22 146249,092 410,333 306,1152,463 101 3,286 125 2,767 111121Dec-14 383 3,136379,972 71 272,011 2,605 104 99 42 89247,055 375,135 288,7082,494 99 3,156 119 2,695 107120Nov-14 402 3,097370,667 79 262,085 2,537 103 90 29 92248,031 292,042 294,6962,434 102 2,868 102 2,702 109118Oct-14 452 3,052360,396 103 250,694 2,466 102 117 39 118262,930 389,271 294,5342,539 104 3,290 118 2,692 110118Sep-14 482 3,027357,418 111 271,883 2,497 109 118 37 140272,149 377,096 294,4942,651 103 3,262 116 2,658 111118Aug-14 499 3,035356,720 122 279,333 2,643 106 145 35 160290,104 367,955 303,9552,817 103 2,995 123 2,748 111
© 2016 - 2017 Houston Association of Realtors Certain information contained herein is derived from information which is the licensed property of, and copyrighted by, Houston Association of Realtors
2 09/09/162 ofBrokerMetrics®Information not guaranteed. © 2006 - 2016 Terradatum and its suppliers and licensors (http://www.terradatum.com/metrics/licensors).
BHGRE Gary GreeneMarket Dynamics
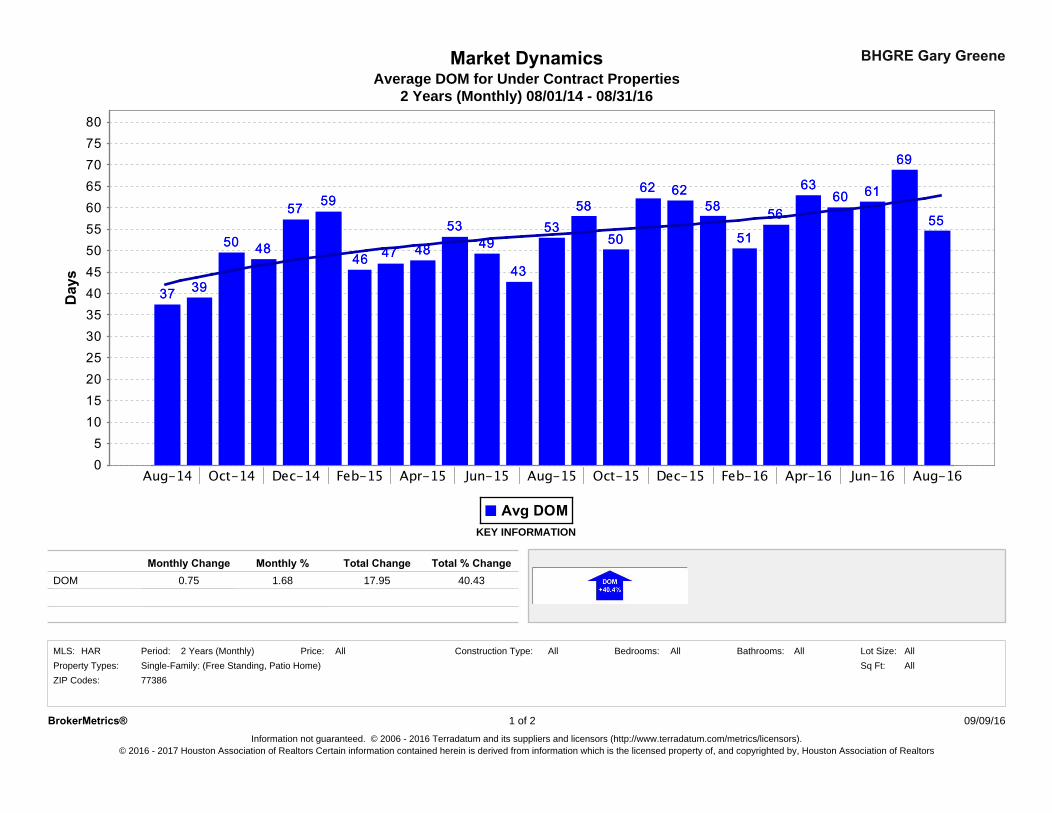
2 Years (Monthly) 08/01/14 - 08/31/16Average DOM for Under Contract Properties
Monthly %0.75
77386
Total % Change
Sq Ft:Bathrooms:All All
DOM
Construction Type:
ZIP Codes:
Period:Property Types:
17.95 40.43Monthly Change
1.68
Lot Size:All
KEY INFORMATION
Single-Family: (Free Standing, Patio Home) AllHAR AllBedrooms:
Total Change
AllMLS: Price:2 Years (Monthly)
Information not guaranteed. © 2006 - 2016 Terradatum and its suppliers and licensors (http://www.terradatum.com/metrics/licensors).
BrokerMetrics® 1 of 2
© 2016 - 2017 Houston Association of Realtors Certain information contained herein is derived from information which is the licensed property of, and copyrighted by, Houston Association of Realtors
09/09/16

Average DOM for Under Contract PropertiesMarket Dynamics BHGRE Gary Greene
2 Years (Monthly) 08/01/14 - 08/31/16
Period Avg DOM Avg CDOMContract# UnderTime
55Aug-16 7512869Jul-16 9113561Jun-16 9114260May-16 8215463Apr-16 7711956Mar-16 7813151Feb-16 6812058Jan-16 918862Dec-15 868362Nov-15 808950Oct-15 6610058Sep-15 10310553Aug-15 7210943Jul-15 6612049Jun-15 7012953May-15 6712348Apr-15 6111847Mar-15 5412746Feb-15 658359Jan-15 758757Dec-14 847148Nov-14 617950Oct-14 5610339Sep-14 4211137Aug-14 47122
2
© 2016 - 2017 Houston Association of Realtors Certain information contained herein is derived from information which is the licensed property of, and copyrighted by, Houston Association of Realtors
09/09/16Information not guaranteed. © 2006 - 2016 Terradatum and its suppliers and licensors (http://www.terradatum.com/metrics/licensors).
BrokerMetrics® 2 of
l Page 1 9000 Forest Crossing, The Woodlands, Texas 77381 Office: 281.367.3531 or 800.932.7253
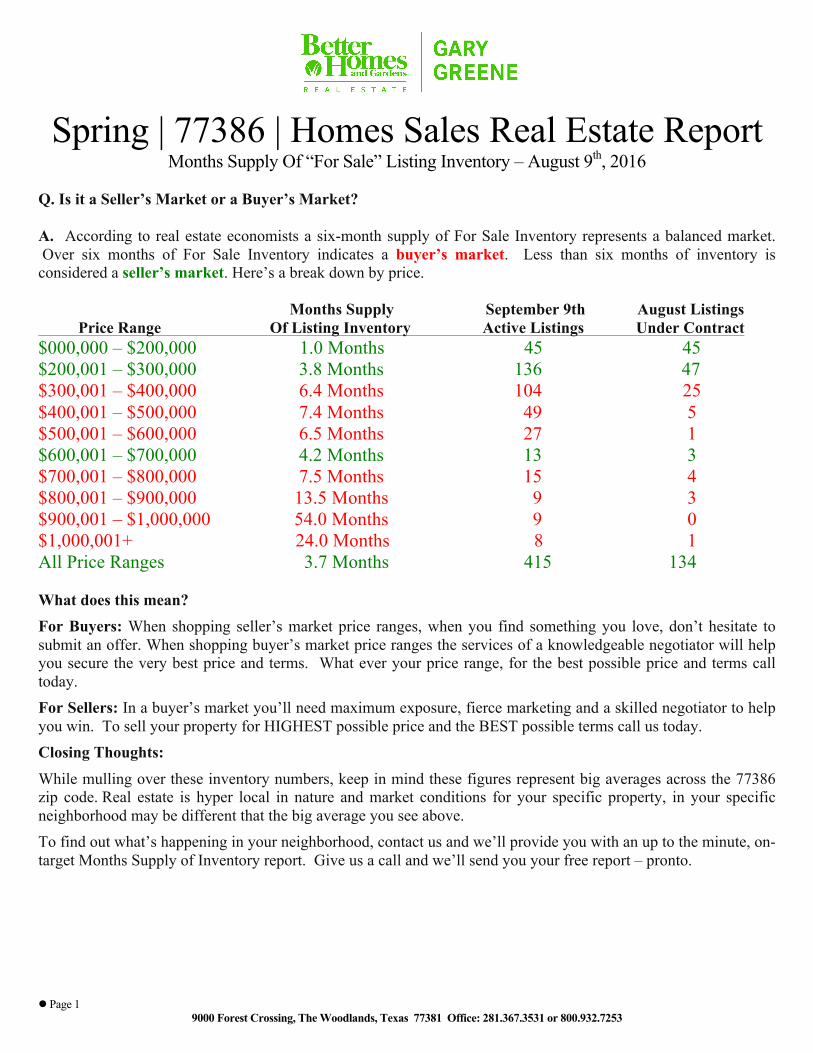
Spring | 77386 | Homes Sales Real Estate Report
Months Supply Of “For Sale” Listing Inventory – August 9th, 2016 Q. Is it a Seller’s Market or a Buyer’s Market? A. According to real estate economists a six-month supply of For Sale Inventory represents a balanced market. Over six months of For Sale Inventory indicates a buyer’s market. Less than six months of inventory is considered a seller’s market. Here’s a break down by price. Months Supply September 9th August Listings Price Range Of Listing Inventory Active Listings Under Contract $000,000 – $200,000 1.0 Months 45 45 $200,001 – $300,000 3.8 Months 136 47 $300,001 – $400,000 6.4 Months 104 25 $400,001 – $500,000 7.4 Months 49 5 $500,001 – $600,000 6.5 Months 27 1 $600,001 – $700,000 4.2 Months 13 3 $700,001 – $800,000 7.5 Months 15 4 $800,001 – $900,000 13.5 Months 9 3 $900,001 – $1,000,000 54.0 Months 9 0 $1,000,001+ 24.0 Months 8 1 All Price Ranges 3.7 Months 415 134 What does this mean? For Buyers: When shopping seller’s market price ranges, when you find something you love, don’t hesitate to submit an offer. When shopping buyer’s market price ranges the services of a knowledgeable negotiator will help you secure the very best price and terms. What ever your price range, for the best possible price and terms call today. For Sellers: In a buyer’s market you’ll need maximum exposure, fierce marketing and a skilled negotiator to help you win. To sell your property for HIGHEST possible price and the BEST possible terms call us today. Closing Thoughts:
While mulling over these inventory numbers, keep in mind these figures represent big averages across the 77386 zip code. Real estate is hyper local in nature and market conditions for your specific property, in your specific neighborhood may be different that the big average you see above. To find out what’s happening in your neighborhood, contact us and we’ll provide you with an up to the minute, on-target Months Supply of Inventory report. Give us a call and we’ll send you your free report – pronto.

Months Supply of Inventory (Sold Calculation)Market Dynamics
2 Years (Monthly) 08/01/14 - 08/31/16
BHGRE Gary Greene
ZIP Codes:
15.08
Price:HAR Bedrooms:Period:
Monthly %MSI-Sold
2 Years (Monthly)
77386
0.63
Single-Family: (Free Standing, Patio Home)
Total % Change
Property Types:
KEY INFORMATION
AllAll Lot Size:All
0.52Monthly Change
0.02Total Change
Sq Ft:AllAll Bathrooms:MLS: AllConstruction Type:
Information not guaranteed. © 2006 - 2016 Terradatum and its suppliers and licensors (http://www.terradatum.com/metrics/licensors).
BrokerMetrics® 1 of 2
© 2016 - 2017 Houston Association of Realtors Certain information contained herein is derived from information which is the licensed property of, and copyrighted by, Houston Association of Realtors
09/09/16
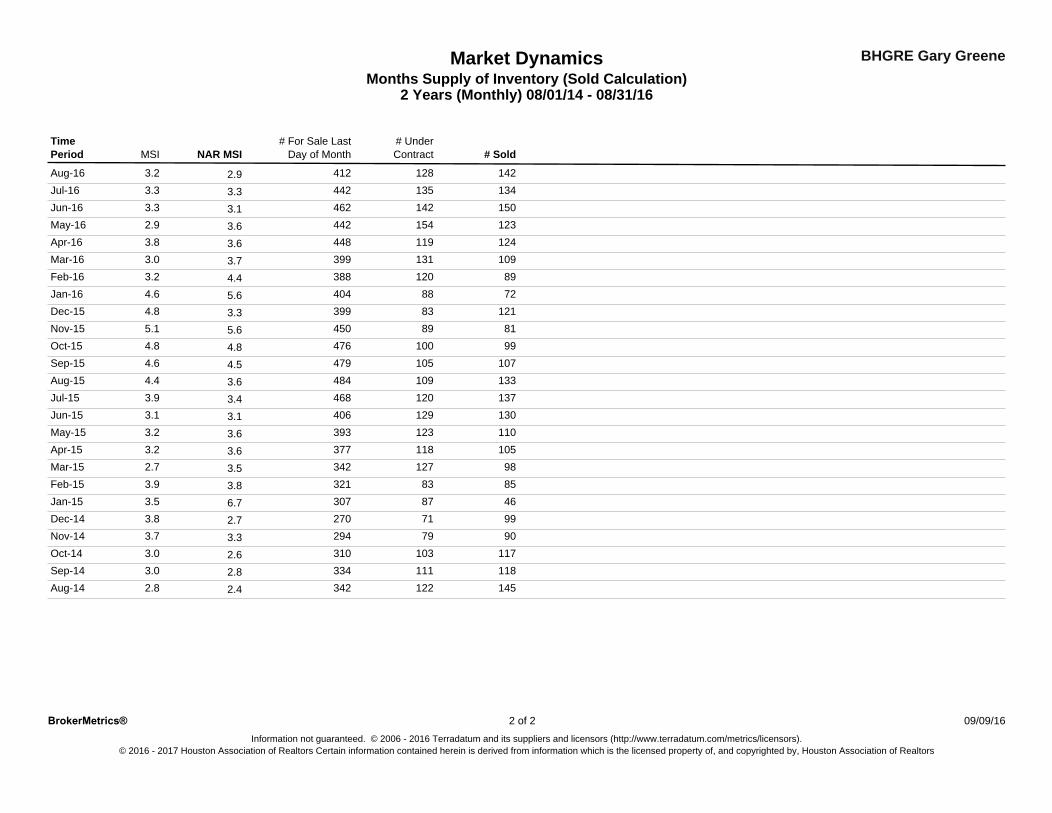
BHGRE Gary GreeneMarket DynamicsMonths Supply of Inventory (Sold Calculation)
2 Years (Monthly) 08/01/14 - 08/31/16
Period NAR MSI # SoldMSI# For Sale Last
Day of Month# UnderContract
Time
2.9Aug-16 128 1424123.2
3.3Jul-16 135 1344423.3
3.1Jun-16 142 1504623.3
3.6May-16 154 1234422.9
3.6Apr-16 119 1244483.8
3.7Mar-16 131 1093993.0
4.4Feb-16 120 893883.2
5.6Jan-16 88 724044.6
3.3Dec-15 83 1213994.8
5.6Nov-15 89 814505.1
4.8Oct-15 100 994764.8
4.5Sep-15 105 1074794.6
3.6Aug-15 109 1334844.4
3.4Jul-15 120 1374683.9
3.1Jun-15 129 1304063.1
3.6May-15 123 1103933.2
3.6Apr-15 118 1053773.2
3.5Mar-15 127 983422.7
3.8Feb-15 83 853213.9
6.7Jan-15 87 463073.5
2.7Dec-14 71 992703.8
3.3Nov-14 79 902943.7
2.6Oct-14 103 1173103.0
2.8Sep-14 111 1183343.0
2.4Aug-14 122 1453422.8
2
© 2016 - 2017 Houston Association of Realtors Certain information contained herein is derived from information which is the licensed property of, and copyrighted by, Houston Association of Realtors
09/09/16Information not guaranteed. © 2006 - 2016 Terradatum and its suppliers and licensors (http://www.terradatum.com/metrics/licensors).
BrokerMetrics® 2 of