SPRING 2014 EXAM CFEFD Foundations in CFE Exam CASE STUDY
67
SPRING 2014 EXAM CFEFD Foundations in CFE Exam CASE STUDY CFEFD afternoon
Transcript of SPRING 2014 EXAM CFEFD Foundations in CFE Exam CASE STUDY

SPRING 2014
EXAM CFEFD
Foundations in CFE Exam
CASE STUDY
CFEFD afternoon

1
EDUCATION AND EXAMINATION COMMITTEE OF THE
SOCIETY OF ACTUARIES
FOUNDATIONS OF CFE
CASE STUDY
RPPC Dynasty Corporation: A Box Full of Growth Copyright 2013 Society of Actuaries The Education and Examination Committee provides study notes to persons preparing for the examinations of the Society of Actuaries. They are intended to acquaint candidates with some of the theoretical and practical considerations involved in the various subjects. While varying opinions are presented where appropriate, limits on the length of the material and other considerations sometimes prevent the inclusion of all possible opinions. These study notes do not, however, represent any official opinion, interpretations or endorsement of the Society of Actuaries or its Education and Examination Committee. The Society is grateful to the authors for their contributions in preparing the study notes.

2
The following Standard Normal Table should be used as needed for any Case Study questions requiring it:

3
Table of Contents Sections 1 RPPC Dynasty Corporation 2 Blue Jay Air 3 Blue Jay Tire Co 4 Frenz Corporation 5 Blue Ocean Corporation 6 Big Ben Bank 7 Darwin Life Insurance Company Disclaimer The companies and events depicted in this Case Study are fictitious. Any similarity to any event, corporation, organization and person living or dead is merely coincidental. Some narrative material utilizes real locations and real news organizations to make the Case Study seem real. The Associated Press, Wall Street Journal, Standard & Poor’s, A.M. Best and others used in this context have never actually commented on any of the fictitious companies.

4
RPPC Dynasty Corporation: A BOX FULL OF GROWTH 1 RPPC Dynasty Corporation RPPC Dynasty Corporation To: Strategic Review Team Re: Enclosed Packet Strategic Review Team, Enclosed in the following packet is an overview of RPPC Dynasty and its subsidiaries. The corporate team has gathered financial and strategic information that should provide a good starting point for your more detailed site reviews in the coming weeks. Each subsidiary has also provided communications they deemed of strategic importantance, either regarding current strategies or possible future endeavors. Do not hesitate to ask the corporate team or key subsidiary contacts for further information as you conduct your review. They have committed to making responding to your questions a priority during your onsite visits. Thank you for your efforts, Gilroy Clyde

5
1.1 RPPC Dynasty Corporation History RPPC Dynasty was established in 2000 with head offices in Bermuda by four founding partners. The corporation’s name is derived from the four founder’s surnames - Ruiz, Putin, Patel and Chan. They had ambitious goals to grow the corporation to become its namesake – a business dynasty respected throughout the world. From the beginning, and still to this day, the focus has been to meet the needs of a globally mobile clientele. The corporation holds a diverse group of businesses. The business roots began with the coffee shop; owned and operated by the Ruiz family since 1990. The apparel shop began in 1995, also family-owned and operated by the Chan family. In 2000, Mr. Ruiz and Mrs. Chan formed a partnership. Soon thereafter, two other entrepreneurs were brought in to expand the brand. In 2001, with the guidance of Mr. Patel, a Bank group was formed. In 2005, due to the influence of the mariner background of Mrs. Putin, a P&C Insurer corporation was acquired. This P&C group is a leader in personal and commercial marine insurance. In 2008, the crisis presented an opportunity to obtain a life insurance group to expand the wealth management capabilities of the bank operations. In 2010, an Airline was bought to appeal to the growing global mobility of the group’s clientele. The Airline has been put through a restructuring initiative to be fitted into the group’s vision. A Tire Company was added to create vertical integration with the Airline. 1.2 RPPC Dynasty Corporation Overview Mission Provide high quality and uniquely tailored service to families or businesses that are globally active. Our family is your family, come experience our difference that is so familiar to you!! Vision To provide our customer the comfort of a family friend when they are away from home. We are your family away from home!!

6
Executive Team CEO – Mr. Gilroy Clyde (since inception) CFO – Mr. Houben Huang (5 yrs) CRO – Mrs. Julia Reich (recently appointed) COO – Miss Jane Mulroney (since incorporation + default CRO) Quick Strategy Overview by Business Line Airline New customer focus; market expansion into international routes Tire Niche; failing; need investment or will be sold Coffee Market leader; cash cow; growth focused P&C Cash cow; niche (Marine (UK), Pet (Canada), Liability, Commercial, Catastrophic);
looking to expand to the US Bank Customer-oriented wealth management focus; growth by M&A integration Insurance Long-term interest risk (VA, LCOI); regulatory changes Governance RPPC has the following Executive Committees:
1. Operation’s Committee 2. Audit Committee 3. Finance Committee 4. Risk Committee 5. Compliance & Legal Committee
Cost of Capital – RPPC and Peer Industries
RPPC
Dynasty Omega Airline Tasty Coffee
Reliable Insurance
Too Big
Bank
Expected Return on Debt 8% 10% 7% 6% 3%
Expected Return on Equity 14% 12% 13% 11% 12%
Debt-to-Value Ratio 40% 65% 50% 40% 60%
Tax Rate for Conglomerate RPPC’s current tax rate is 35%.

7
1.3 RPPC Risk Management Framework
Vision Statement
We are exposed to a variety of risks that are inherent in carrying out our business activities. Having an integrated and disciplined approach to risk management is key to the success of our business. In order to achieve prudent and measured risk-taking that aligns with our business strategy, we are guided by a risk management framework that is embedded in our daily business activities and planning process. Strengths and Value Drivers • A Risk Appetite that shapes business strategies and is integrated into our decision-making
processes. Risk management is considered a profit-generating activity. We believe preventing our organization from the experiencing the loss inflicted on our competitors is as beneficial as creating new profit streams from new arenas.
• A unified and strong risk culture that is embedded across the enterprise. This leads to a consensus opinion on the value and purpose of risk management.
Challenges • Continued volatility in global economic conditions, causing heightened marketplace
uncertainty. This is both a risk as well as an opportunity.
Our Priorities • Broaden and strengthen risk capabilities, including enhancing our stress testing functions to
deliver better insights to both our risk and business groups. We believe strongly in assessing risk through a variety of lenses, not simply looking at past performance.
Our Path to Differentiation • Within our independent oversight framework and the limits of our risk appetite, contribute
to the enterprise’s customer focus. • Ensure that risk awareness is pervasive throughout the organization at all levels and all
functions • Ensure that the risk-reward trade-off is applied effectively and consistently in all levels of
decision-making.
Key Objectives and Recent Achievements
A key objective is to continue embedding our strong risk culture across the enterprise, including newly acquired businesses: • Emphasize and ensure that risk management is a process of continual improvement at RPCC
Dynasty. • Reinforce our risk independence and our three-lines-of-defense approach to managing risk
across the enterprise.

8
Recent Achievements Achieved the roll-out of our five-step message on our value-based approach to enterprise risk management: • Understand and manage • Protect our reputation • Diversify; limit tail risk • Maintain strong capital and liquidity • Optimize Risk-Return Established and formalized the role of Risk Champion to ensure strengthened engagement between the office of the CRO and Business operating groups.
Value-Based Enterprise Risk Framework
RPPC risk governance has three pillars. I. The first line of defense at RPPC is the Business operating groups, which are
responsible for ensuring that products and services adhere to the approval process and profit guidelines of their businesses. Their mandate is to pursue suitable business opportunities within the Risk Appetite, and to adopt strategies and practices to optimize return on capital employed. RPPC officers must act within delegated risk-taking authority and must have effective processes and controls in place to enable the businesses to operate within their delegated risk authorities and limits.
II. The second line of defense is the office of the CRO, along with Enterprise Risk Officers (ERO’s) and Subject Matter Experts (SME’s) as assigned for specific risk categories or subcategories. These provide oversight, challenge and independent assessment of risk.
III. The third line of defense is the Corporate Audit Division which in conducting the internal audit process will provide assessment as to the effectiveness of internal control including control, risk management and governance processes that support the Enterprise, its objectives and the Board of Directors’ discharge of its responsibilities
The CEO is responsible for the business operating groups (the first line of defense). The second line is made up risk officers (ERO’s and SME’s) who work collaboratively with the business operating groups and are engaged through corporate policies that support ERM & Portfolio Management (EPM). These risk officers are governed by the CRO and the risk management

9
committee. The second line has a direct line to the Board and therefore meets “in camera” with the Board. The third line, the Audit officers, also has an “in camera” with the Board.
RPCC Board Board Risk Committee CEO Board Audit Committee
Risk Management Committee
Operating Groups
ERM & Portfolio Management
ERO's and SME's
Corporate Audit Group
• Capital Management • Reputational Risk • Operational Risk
1st line of defense
2nd line of defense
2nd line of defense 3rd line of defense
Risk Culture
Every employee is responsible for risk management at RPPC. The three lines of defense model promotes engagement and dialogue between the Business Operating Groups (first line) and the risk office (second line) within the protocols of the Corporate policies that support EPM. The key facilitator of this engagement process is the Risk Champion. The role of the Risk Champion is critical to ensuring that there is buy-in to the process among both business managers and risk officers alike, and ultimately to the success of enterprise risk management (ERM). This engagement is central to a value-based ERM approach as it promotes understanding and alignment with our risk appetite leading to sound decision making. In support of an overarching goal of continual improvement, the company has two human resource corporate policies that improve risk management:
(1) Two-way rotation policy (TWRP): allows employees to rotate between risk roles and business management roles;
(2) Continued professional development policy (CPDP): obligates employees to attend training on risk management principles and techniques at least once every two years.

10
Risk Principles
All material risks to which the enterprise is exposed are identified, measured, managed, monitored and reported. Risk awareness must be demonstrated to drive all decision making within the enterprise. For any risk, a risk based approach is used to calculate its reported Economic Capital. Economic Capital is used to measure and aggregate all risks.
Risk Appetite
The Risk Appetite is at the center of our value-based enterprise risk management approach. The clear communication of risk appetite at all levels within each line of business is critical to effective risk-taking in decision making. This is achieved with business-specific risk appetite statements that are aligned with the RPPC risk appetite statement approved by our Board of Directors. The following RPPC Risk Appetite Statement is a clear articulation of the value creation principles of RPPC. The Board of Directors of RPPC and its executive officers declare that the business operating groups with the support of risk officers will:
• Not take risks that are opaque, not well understood or that cannot be well managed. • Identify and quantify low probability tail events. • Limit exposure to low probability tail event risks that could jeopardize RPPC’s credit
rating, capital position or reputation. • Subject all new products or services to a rigorous review and approval process. • Ensure that the performance management system incorporates risk measures. • Protect and enhance the RPPC brand by exceeding expectation in the products and
services that we deliver to our clients. • Promote focused differentiation on products and services that leverage RPPC’s core
competencies to build client trust and to surpass expectations. • Maintain strong capital and liquidity and funding positions that exceed regulatory
requirements. • Maintain compliance standards, controls and practices that prevent regulatory
exposures that could adversely affect our reputation. Incentive Compensation and Risk Appetite The business management of RPPC is governed by Key Performance Indicators (KPI) and Key Risk Indicators (KRI). All officers of the company will have their compensation dependent on the following:

11
• For any risk, the return on its economic capital must exceed the cost of the capital acquired to fund that risk. The CEO of each business operating group must identify and report KPI that indicate that this requirement is being met.
• The payback period on capital invested in a business operating group must not exceed 10 years from the date that capital is first employed. Each operating group CEO must report KRI that indicate for the aggregate of all risk underwritten, that if the business group were to suffer one 1-in-100 year tail event that the capital thereafter would still be able to withstand another 1-in-100 year tail event (essentially twice the 1-in-100 year event’s loss). This is referred to as redundant capital and is critical to RPPC’s market discipline because client relationship management and sustainability is promoted over price leadership.
• Through the identification of KPI and KRI, the business management indicates whether the risk being underwritten is within the group’s risk appetite. The KPI and KRI are recommended by the business CEO and are approved by a Risk Appetite Consensus Meeting that includes the business executives, CRO, the appropriate risk and business Subject Matter Experts (SME’s).
When reporting business plans and KPI, the financial projection must be based on a complete business cycle inclusive of severe market conditions rather than simply best estimate assumptions. When reporting KRI, scenario results and any stress testing must be demonstrated in the context of the business and directly related to its business driver. Such KRI value-based results must be reported, well understood and actioned at all levels of management within each business group. Scenarios and stress tests are based on transparent deterministic scenarios recommended by the Business and approved by the Risk team. Only actual past events are deemed relevant in communicating the financial impact of a KRI. Severity is assessed when economic events or business impact are greater than three standard deviations from the average.
Risk Review and Approval Policy
This policy outlines the procedures for the development, review, and approval of new products and services within the RPPC conglomerate. The policy is important because it balances the goal of delivering new products in a timely and efficient manner with the need to manage pricing and product development risk. Pricing and product development risk is the risk of financial and/or reputational loss as a result of the unexpected performance of a product or where the costs incurred are greater than those assumed in the pricing of the product.

12
This policy requires the establishment of product pricing guidelines that describe profit targets for RPPC and performance metrics that must be calculated for all new products and services. This policy also requires the establishment of a product pricing committee that meets periodically to examine the profitability of current and future sales as compared to the product pricing guidelines. This policy involves the following stages:
Feasibility – For all new products and services, a report assessing the feasibility of the new product or service must be created. This report will provide high-level business rationale and risk assessment for the product or service, and must be presented to the product pricing committee before any further development is undertaken. In this phase, all key stakeholders must be identified and interviewed, and any key issues would be identified and further information may be required before proceeding with development. Product Assessment – All aspects of the product design must be assessed including the marketing analysis and supporting research, the distribution plan, pricing estimates, sales projections, risk adjusted return on capital, and tax implications. Risk Assessment – All aspects of the risks of the product or service must be assessed, including exposures and ratings as compared to the risk appetite statement. The assessment should also include a summary of the appropriate procedures and controls to be implemented, or already in place, that are required to manage the new product or service once it is launched. Sign-off and Approval – Sign-off and approval of the new product or service is required by the office of the CRO, the product pricing committee, and the operational head of the business unit. This approval is gained through initial feasibility study and the product and risk assessments and any resulting subsequent discussion and analysis. Documentation – An official record must be kept of the feasibility study, product and risk assessments, and the approval and sign-off forms. These could be reviewed the internal audit function, external auditors, or regulators as evidence of appropriate due diligence and compliance with internal procedures, as well as providing the rationale for the assessments and decision making.
Role of Risk Champion The Risk Champion is a critical role which facilitates the Risk Review and Approval Process (RRAP). The Risk Champion is responsible for identifying the relevant business managers, risk managers and SME’s which are needed to complete the required risk assessment and risk analysis. In this way, the Risk Champion serves the role of arbitrator for finding the appropriate forum to resolve areas of dispute between the business and the risk review. The purpose of fostering dialogue and collaboration is to build and maintain the buy-in of all stakeholders throughout the RRAP. The Risk Champion is the key communication bridge between the first line and the second line of defense in the risk framework.

13
Risk Monitoring
There are three disciplines to the risk monitoring approach: - Post implementation review - Risk based capital assessment - Stress testing Post implementation review is the core discipline within the engagement approach that embodies our three lines of defense model. Whenever a business operating group has launched an initiative, the group business managers are obligated to develop and report Key Performance Indicators (KPI) and Key Risk Indicators (KRI) that are specifically related to the initiative and that speak directly to the risk appetite of the enterprise. The assessment of risk based capital within an Economic Capital framework is one of the key metrics in the measurement and communication of any risk taken on. Economic capital is determined by the Risk Management Committee and is underpinned by the Redundant Capital philosophy. Capital is determined to withstand one 1-in-100 year event, after which the capital position is still sufficient to meet another 1-in-100 year event (essentially twice the 1-in-100 year event’s loss). Economic capital is also compared with regulatory capital to ensure compliance. Allied with the Economic Capital framework, strong risk management and good business management relies on identifying “what-ifs”. Stress testing is the use of historical extreme economic events and/or periods of poor market conditions to quantify and to communicate the impact on the financial results of a given business operation. Scenarios based on historical events are easy to communicate and to get engagement when assessing value-based impact.

14
Risk Management Models
There are several models used by risk management at the conglomerate level due to RPPC’s diverse industries. Information from these models are shared with the appropriate businesses:
• Inflation model – The inflation model is a robust model due to its many needs. Not only is general inflation information needed for the financial products, but inflation of specific commodities must be modeled as well. The inflation rates for fuel, general consumer goods, and specific raw materials are modeled across the countries in which the specific businesses are located.
• Interest Rate model – This model is especially important for the financial businesses. • Foreign Currency model – The foreign exchange rate has a large impact, not only on the
bank and insurance operations, but also on the consumer goods sold across international borders, such as coffee.
• Economic model – More general than the interest rate and foreign currency models, this model is used to predict demand for RPPC’s diverse consumer goods and services as well as predicting the state of the market for the financial products.
• Liquidity model – All of the diverse industries could experience liquidity crunches of some form or another, although it is not expected that they would all be 100% correlated. This model is intended to give RPPC an idea of liquidity needs under various scenarios, both economy-wide and business-specific.
• Financial Projection model – This models the anticipated 5-year plan of the conglomerate and reports out key financial data.
• Economic Capital model – This model calculates the loss due to a 1-in-100 year tail event. Economic capital is determined at the conglomerate level but may not be explicitly calculated at lower levels of the organization.

15
2 Blue Jay Air Other services are customer-oriented. The airline industry is increasingly anti-consumer. It’s become a real hassle to travel. That is our opportunity - as long as we are given a chance to compete fairly. 2.1 Background Blue Jay Air was originally incorporated in the United States in the early 1970s. It was a small local commercial passenger carrier, operating only in the Eastern region of the United States. Its target market was high-end business clientele located in major cities along the east coast of the United States. Since then, Blue Jay had gone through three mergers and two significant acquisitions over the last 30 years. The company had transformed from a focused high-end regional company to an expanded price-competitive commercial carrier, covering the full geographical region of United States as well as major cities in Canada. During the past 30 years, the airline industry had gone through several significant cyclical business cycles, with each earning cycle trending lower than the preceding cycle, which resulted in significant pressure on the business margins and profits. In addition, with the deregulation in the airline industry during the Carter administration, the number of commercial carriers had exploded exponentially, thereby materially decreasing the consumer prices and reducing the service level of the airline industry. Due to reduced margins, most companies had severely curbed operating costs by reducing staff levels or restraining salary increases. As a result, labor disputes and disruptions had become a major concern in the industry. The negative impact on the industry was compounded with an aging workforce and insufficient training for the new staff especially for the pilots. Frequency of accident occurrences had trended upwards due to lack of qualified manpower and insufficient compensation level. Despite all the perils in the industry, Blue Jay Air was resilient in surfing the destructive waves through different reorganization and restructuring efforts. The latest acquisition by RPPC was viewed positively by shareholders and investors. In 2010, the Wall Street Journal quoted that “the takeover is a step forward for the Blue Jay Air”. John Feather, who has over 20 years of airline experience, is viewed as a “turnaround” CEO by the industry. Thus the parent company has high expectations of John’s new strategic vision. 2.2 Strategies Blue Jay Air’s new strategic vision is to become the most customer-oriented airline company in the world, providing the best services to the marketplace. Comfort, punctuality and safety are the three important virtues that the company has adopted. Thus the number one priority for Blue Jay is to rebrand the company and image. In order to successfully rebrand the company, the company has done an extensive study on its customer base and identified its customers.

16
John believes that understanding and knowing the customers is an important step to improve profitability for the company in the long run. Based on the customer base study, the company found that more than 55% of its customers are travelling for business reasons. This finding could stem from the fact that the company was originally a commercial passenger carrier catering to business travelers and so its relationship with the business community was deep-rooted. In fact, the expansion to leisure travel over the last 15 years did not increase the profit margin as the number of business travelers decline from over 80% to 55% due to reduced services. The rebranding and the change of business model may improve the company’s profitability over time. At the time of acquisition, the company reconsidered its market operations including the expansion to international operations due to increased demand for international travel caused by globalization of the business world. In order to make this strategy possible, the company has been negotiating with several international airport authorities in several European and Asian financial centers and major cities over the last two years to secure a boarding space. Some of these negotiations are close to fruition. Cost control is a key element in this industry. Labor relationship management is a key cost control element for Blue Jay Air as the labor force is not currently unionized. Blue Jay requires an effective management team that will foster a cultural change without damaging the relationship with the employees and will ensure that their needs are addressed to reduce the desire to unionize. In the past few decades, the company has implemented profit sharing schemes, regular salary scale and benefits review, frequent employee networking events, employee suggestion boxes and an employee diversity team to foster communication and pay equity between management and regular staff. These efforts have been working as unionization has not materialized. Thus, the company would like to maintain its current employee relationship strategy. The only caveat is that in order to stay competitive, the company has to continue taking significant expense control measures particularly in the areas of staff count, staff expenses and information technology expenditures. As a result, the company has started to cut back on most training programs, except the current pilot and safety training programs in order to foster our vision of being the “safest” airline in the industry. The company also imposes tougher standards to qualify for the “top-scaled commercial pilot” category in order to ensure Blue Jay pilots are of highest quality. 2.3 Risk Management Blue Jay Air, being a highly leveraged capital intensive company, has significant exposure to interest rate volatility. Ability to raise debt and servicing those debts are crucial to the survival of the company. Therefore, a key risk management objective is to maintain the credit rating of the company within the investment grade categories, i.e., BBB- or higher. Since acquired by RPPC Dynasty, Blue Jay Air has established a risk management committee headed by a well-known risk manager, Jim Peters. Jim was formerly the Chief Risk Officer (CRO)

17
of a major Canadian bank and he was recruited by John under the recommendation from Howard Creston, former CRO of RPPC Dynasty. Jim was a hedge fund manager before he became the CRO of the bank and thus he was extensive knowledge in implementing risk management strategies. Over the last two years, Jim has put together a dynamically hedged portfolio that handles the commodity exposures that the company has been facing as well as the interest rate risks. In addition, Jim has established a Treasury role under the risk management committee to centralize the long-term and short-term fund raising activities of the company and deal with the liquidity and credit risks of the company. This role was headed by Elaine Saunders who was a former Treasurer of a New York-based investment bank. Elaine has a significant network with venture capitalists, pension fund managers, and private equity fund managers. Elaine has also worked in the investor relations area of a major US commercial bank and thus has dealt with credit rating agencies such as Standard & Poor’s, Moody’s, A.M. Best, and Fitch. Over the last two years, she has implemented a liquidity model and a credit model to monitor the company’s ongoing liquidity and credit needs. The Risk Management roles and functions are still in the process of refinement and adjustments. The staffing requirement in these areas is highly specialized so it will take time to establish a full staff complement. As a result, the staff workload is currently intensive and turnover rate is slightly higher than the other areas. 2.4 Operations Planes The current fleet of planes is starting to age and is not suitable for international flights. In order to implement an international expansion strategy, the company will have to order or lease planes with updated features such as Wi-Fi, expanded business classes, flat beds, bars, additional safety features etc., to be delivered over the next few years. These planes are catered for added comfort, safety and shorter flight time. They are the ideal planes for international travel. However, the costs of these new planes are significant and will require capital injection or debt guarantees from RPPC Dynasty as Blue Jay Air alone cannot bear these costs without jeopardizing the credit rating of the company. Even for the short haul planes, the current fleet requires updates such as Wi-Fi capability, individual TV screens and more fuel-efficient engines to provide additional comfort for business travelers. This again will require additional funding and support from the parent company, RPPC Dynasty. (See exhibit 4 for more information.)

18
Loyalty Program As part of the change in marketing strategy, a business travel loyalty program is being considered to encourage frequent business travels. Blue Jay Air is considering progressive bonus point systems as flight frequency increases over a short period of time. In addition, Blue Jay Air would like to expand its reward systems by partnering with other business partners and its affiliated companies. This will substantially increase the incentive of business travels by business executives. For example, Blue Jay Air is partnering the loyalty card with Big Ben Bank’s bank credit and debit cards to introduce a combined credit card with an “enhanced air points” reward system. This partnership should further increase the value of the loyalty program. A modification to the existing application form is required to accommodate the expansion of this new enhanced loyalty program. The current application form is an online form which is an electronic version of a paper form. The paper form is currently five pages long with 30 different questions related to the customers’ personal information and preferences. The customer data is crucial for current and future marketing analysis. However, the current completion rate is much lower than the target rate due to the extensive information requested. Booking System enhancements With the technological advancement over the last few decades, Blue Jay Air is considering to revamp its booking system to enhance its internet booking capability as well as introducing different mobile phone apps for the major mobile phone systems. The new system will also automatically link up with the loyalty system and credit cards for ease of use of loyalty points. It will include tracking of flight schedules, weather systems, time zones, and other pertinent information. It will incorporate many added features that will make business travel enjoyable. Business Lounges Blue Jay Air will renovate all its business lounges in major cities to enhance its business travel strategy to stay competitive. New business lounges will offer free Wi-Fi, free internet access and amenities such as gourmet Frenz coffee and specialty teas, snacks, massage chairs with music selection and flat beds. The goal is to make business travelers as comfortable as possible while waiting for their flights. Baggage and Baggage System Blue Jay Air will incorporate a charge for each piece of luggage being checked in since most business travelers do not check in their luggage and as a response to their competitors’ pricing. Free luggage check-in is no longer available except for international flights for which Blue Jay Air

19
will reduce its free luggage check-in policy from two pieces to one piece with no change to the current weight limit. The current Baggage Tracking system seems to be adequate and Blue Jay Air has no plan to upgrade its systems. Other Cost Measures Blue Jay Air has decided to discontinue its travel agency programs with different travel agencies as part of the continuing effort to keep the company as cost efficient as possible. Instead the company will establish direct business relationships with its business client base. Blue Jay Air will negotiate direct contractual arrangements with its business clients in order to customize client needs and leverage long-term client business relationships. A referral program will also be offered to its business clients in order to expand its customer base in the most direct and efficient manner. This referral program will be combined with the loyalty program to optimize value for existing customers. 2.5 Miscellaneous Financial Statements Detailed financial statements are shown in Section 2.6, Exhibits 1 to 3. Strategic Information: Fleet Upgrade Proposals Research into leasing vs. buying the new international planes, as well as cost of upgrading current fleet, is shown in Section 2.6, Exhibit 4. Strategic Models used by Blue Jay Air Black-Scholes Hedging Model Jim Peters, as part of Blue Jay Air’s risk management, has put together a dynamically hedged portfolio that handles the commodity exposures that the company has been facing as well as the interest rate risks. He uses Black-Scholes models in this hedging work. Loyalty Program Model To properly account for the potential costs of the new loyalty program, a statistical regression model has been created to show the correlation between frequency of travel and passenger revenue vs. current loyalty program benefits. From there, the enhanced business loyalty program results have been extrapolated.

20
2.6 Blue Jay Air Exhibits
Exhibit 1 Blue Jay Air Corporation
NON-CONSOLIDATED STATEMENTS OF OPERATIONS (US Dollars in millions)
Fiscal Year Ended
Dec 31, 2012
Dec 31, 2011
Dec 31, 2010
Operating revenues:
Passenger 1,074 864 702 Other 207 105 74 Total revenues 1,281 969 776 Operating expenses:
Aircraft fuel 401 325 268 Wages, salaries and benefits 251 194 149 Capacity purchase agreements 120 106 105 Airport and navigation fees 110 95 90 Depreciation, amortization & impairment 67 72 80 Aircraft maintenance 77 78 79 Sales & Distribution costs 51 92 98 Aircraft rent 34 34 34 Food, beverages and supplies 29 27 28 Communications and Information technology 23 19 19 Other 13 12 11 Total operating expenses 1,176 1,054 961 Net Operating income 105 (85) (185) Non-operating income (expenses)
Foreign exchange gain(loss) 11 (5) (8) Interest income 5 5 4 Interest expense (31) (34) (40) Interest capitalized 2 1 0 Net financing expense relating to employee benefits (2) (2) (2) Loss on financial instruments recorded at fair value (3) (7) (10) Other (1) (2) (2) Total non-operating expense (19) (44) (58) Income (loss) before income taxes
86
(129)
(243)
Income taxes (30) 45 85 Net income (loss) 56 (84) (158)

21
EXHIBIT 2
Blue Jay Air Corporation NON-CONSOLIDATED STATEMENT OF FINANCIAL POSITION
(US Dollars in millions)
Fiscal Year Ended
Dec 31, 2012
Dec 31, 2011
Dec 31, 2010
ASSETS Current: Cash and Cash equivalents 136 140 88 Short-term investments 83 75 111 Total cash & Short-term investments 219 215 199 Restricted cash 15 7 6 Accounts receivable 127 68 95 Aircraft fuel inventory 48 29 15 Spare parts and supplies inventory 33 20 8 Prepaid expenses & other current assets 70 50 17 Total current assets 293 174 141 Property and equipment
474
509
558
Intangible assets 21 21 31 Goodwill 31 31 31 Deposit and other assets 1 2 5 Total assets 1,039 952 965 LIABILITIES
Current: Account payable & accrued liabilities 70 107 95 Advance ticket sales 181 124 160 Current portion of long-term debt & finance leases 61 59 51 Total current liabilities 312 290 306 Long-term debt and finance leases 320 370 398 Pension & other benefit liabilities 580 556 541 Maintenance provisions 60 55 50 Other long-term liabilities 43 48 53 Total liabilities 1,315 1,319 1,348 EQUITY
Shareholders’ equity Share capital 90 90 90 Contributed surplus 45 10 10 Deficit (411) (467) (383) Total shareholders’ equity (276) (367) (283) Total liabilities & equity
1,039
952
965

22
EXHIBIT 3 Blue Jay Air Corporation
NON-CONSOLIDATED STATEMENT OF CASH FLOW (US Dollars in millions)
Fiscal Year Ended
Dec 31, 2012
Dec 31, 2011
Dec 31, 2010
Cash Flows from (used for) Operating:
Net income (loss) 56 (84) (158) Adjustments to reconcile to net cash from operations: Adjust for non-cash items: Depreciation, amortization & impairment 67 72 80 Fuel & other derivatives (6) (6) (2) Adjust for Changes in non-cash working capital items: Change in inventories (32) (26) 11 Change in account receivable (59) 27 10 Change in Account Payable (37) 12 5 Change in advance ticket sales 57 (36) (40) Change in pension & other benefit liabilities 24 15 13 Change in maintenance provisions 5 5 (1) Other (20) (33) 38 Net cash flow from operating activities 54 (54) (44) Financing
Proceeds from borrowings 125 45 30 Reduction of long-term debt obligations (104) (46) (8) Reduction of finance lease obligations & Distributions related to aircraft special purpose leasing entities
(74) (24) (14)
Contributed Surplus 35 0 0 Net cash flows used in financing activities (18) (25) 8 Investing
Short-term investments (8) 36 (11) Additions to property, equipment & intangible assets (36) (15) (4) Proceeds from sale of assets 4 2 15 Foreign exchange gain(loss) (3) 1 8 Other 2 2 4 Net cash flows used in investing activities (40) 26 12 Decrease in cash & cash equivalents
(4)
(53)
(24)
Cash & cash equivalents, beginning of year 147 94 70 Cash & cash equivalents, end of year 151 147 94

23
EXHIBIT 4 Fleet Upgrade Proposals
4.1 Lease Proposal for International Plane Fleet Lease term: 5 years Initial Five-year Lease Expenditure: $500M Additional Annual Expenses beyond those included in Lease Expenditure: $60M Annual Expected Revenue from New Route (First 5 Years): $270M 4.2 Purchase Proposal for International Plane Fleet Initial Purchase Price: $1.75B Annual Projected Maintenance Costs of New Fleet: $2M Additional Annual Expenses beyond those included in Purchase/Maintenance: $60M Annual Expected Revenue from New Route (First 5 Years): $270M Annual Depreciation for Fleet: $100M 4.3 Upgrade of Current Fleet Proposal Initial Upgrade Expenditure: $100M Favorable State Additional Revenue: $18M first year, growing at 2% thereafter Probability of Favorable State: 60% Unfavorable State Additional Revenue: $0M all years Probability of Unfavorable State: 40%

24
3 Blue Jay Tire Co 3.1 Background Early History The Durable Tire Corporation (also referred to as Durable) has been operating in Canada since 1920. The company has a small and loyal customer base in rural areas. The high quality product proved to be very well suited to the rugged Canadian frontier. Durable built farming-related vehicle and small plane tires intended for dirt roads or off-road on farms and small community towns. Durable also manufactured specialty tires sold in niche markets. The company founders, the Eastern family, were originally farmers. The Easterns always focused on providing the best quality tires that would live up to the family name and brand. When the family patriarch passed away in 2000, the family decided to sell its interest in the company. The company was acquired by Blue Jay Air (BJA). BJA had been one of the Durable’s clients for specialty tires in small aircrafts that flew in the Northern reaches of Canada. Under BJA since 2001 Under BJA management, Durable Tire was re-branded for broader appeal. The BJA group felt that it could leverage the capabilities of the manufacturing process to develop a broader range of tires. The tire company re-branded within the BJA group to become Blue Jay Tire (BJT). In 2001, the BJA team put in place a 5-year plan to expand the sales and distribution reach into commercial vehicles across the USA. The BJA management team increased its focus and oversight towards the BJT venture and its ever-improving financial results as Blue Jay Air’s struggles worsened due to increased competition and squeezed margins. In 2006, having successfully met and surpassed the 5-year plan objectives set out in 2001, the BJA board directed BJT to pursue an even more ambitious growth strategy . With funding, BJT purchased two manufacturing plants in the southern USA and re-fitted the operation with direction from their Canadian operations. An executive team under the banner of Blue Jay Tire USA (BJT-USA) was setup by the BJA board. This company operated with oversight from its Canadian head office. BJT-USA engineers were asked to set targets at double their pre-acquisition production levels or about triple the level of the Canadian manufacturing plant. BJT-USA surpassed it sale targets each and every year from 2006-2012. BJT-USA, despite its size, achieved a 3rd place market position in tire sales for compact cars and small SUV vehicles in the southern U.S.A. By 2010 BJT dominated the earnings of the Blue Jays Air group. BJT in early 2010 accounted for 20% of the revenue and an astounding 80% of the profit of the Airline group. BJT

25
management was heralded by the executive team, the board and its shareholders as the “star” of the Airline group. Financials Detailed 5 year financial statements are shown in Section 3.4, Exhibits 1 to 3. 3.2 Risk Factors The following risk factor excerpts are taken from the 2012 Annual Report: Commodity Risk Although there is a large amount of synthetic rubber used in the manufacturing process, the company still depends a great deal on natural rubber. Typically that is sourced in countries somewhat less stable than the developed world. Natural rubber production is subject to weather related risks. In the Tire Industry rubber represents 52% of total manufacturing purchases. A $0.10 per kilogram increase in natural rubber prices would lead to an estimated $10M increase in manufacturing costs. BJT has maintained the same supplier for over 30 years. The relationship is very strong and BJT benefits from stable pricing. In the past decade, BJT has achieved the lowest prices on its commodity purchases because its growth strategy has also benefited the supplier. Volume discounts have been passed on to BJT in the form of better pricing. For BJT rubber now represents only 48% of company purchases down from 60% at the start of the millennium. Commodity risk is considered to be lower for BJT than its competitors. Manufacturing Risk The process of making tires involves chemicals and flammable ingredients. This poses concerns for the workers, and the risk of fire is large. In addition, the size of the finished product increases the risk of worker disabilities. A lost-time injury is defined as an occurrence that resulted in a fatality, permanent disability or time lost from work of one day/shift or more. The Lost Time Injury Frequency Rate (LTIFR), the number of lost-time injuries per million hours worked, is calculated as:
LTIFR = Number of lost-time injuries x 1,000,000 Total hours worked in accounting period
Overall, the BJT manufacturing plants have reported a LTIFR of between 2.16 and 2.69 in recent years. This compares reasonably well to the industry average of 2.38. In particular, the LTIFR for the Canadian BJT plant has had best in class safety records at less than 2.0 since inter-company surveys began. In comparison, the U.S. plants have been between 2.56 to 2.99 since being acquired by BJT.

26
The manufacturing process had been established by the company founders and has had proven success over many decades. The same process and standards are used in both Canadian and U.S. plants. The core competencies for quality assurance are in the people who manage the process and the culture of quality management is passed on within the operations team from experienced staff to new associates. Quality management is considered by Executive Management to be a grass-roots competency of the company. Manufacturing risk is currently considered to be below or at industry standards. Management focus recently has been to return to the historical Canadian operational level of 1.92. A program recently implemented invites retired Canadian and former BJT plant operators to conduct quality management training for existing staff. Labor Risk Tire manufacturing plants typically have unionized labor forces. The company might face contentious labor issues in a number of manufacturing plants with unionized labor. Historically, the Canadian operation has not had unionized labor. However 35% of the employees working in the two U.S. plants are union members. The current union contract expires in 2014. After normalizing for standard of living differentials between geographical locations, the labor cost in the Canadian operation is 20% lower than similar operations in the U.S. There has not been any disruption in the workforce at any of the plants. Labor risk is currently considered by Executive Management to be low. However, the number of staff that elect for union representation has been increasing. Legal Risk The possibility of class-action lawsuits exists, particularly in the US. A large risk stems from the chances of paying out large claims and/or having wide-spread product recalls. BJT has not experienced any litigation action in its history. Distributor Risk BJT sells almost all of its tires through independent distributors. BJT has long standing relationships with several Canadian car dealerships as their sole or primary tire supplier. Insurance Risk The key risks in a tire operation are Property & Casualty, Product liability and Product recall. Some companies use a captive insurance company to handle this exposure. Historically BJT has retained its entire Property & Casualty insurance risk. The board has requested a feasibility report to examine the solution to effectively mitigate this exposure.

27
Environmental Risk Tires are an easy target for environmental groups. Billions of tires are produced each year and billions are discarded. The materials to produce tires and the manufacturing process can be the subject of environmental concerns. BJT maintains a recycling plant for the rubber in its discarded tires. This plant is only able to support operations in Canada due partly to subsidies available from the Canadian government. Efforts in the U.S. for a similar plant are not likely to be economical. Environmental risk is considered to be low due to operation size and overall market share. Economic Risk The number of miles driven has a large impact on the demand for tires. The state of the world economy has a direct impact on the company’s ability to grow and expand. BJT has chosen to target compact cars and small SUVs, which experienced increased sales during the financial crisis (2008 – 2010). It is anticipated that the increased gasoline prices will continue the trend towards the small vehicles. This strategy has been proven to be effective as a counter-cyclical impact on sales. BJT experienced market share growth from 5% to 8% during the financial crisis. Economic risk for BJT is considered medium. Reputational Risk One of the company’s primary strengths is its brand name. BJT must constantly assure that its products are of the highest quality and invest in research & development to continually improve its products. BJT has growing brand awareness within the U.S. market. BJT uses social media monitoring tools to assess its brand awareness. Brand awareness is considered to be a critical determinant of BJT’s growing presence in its chosen target market. BJT monitors 5 media channels for their positive/negative ratio.
Media channel Positive/negative ratio Blog 1.8 Internet Forum 2.0 Newspaper 2.3 Online newspaper 2.2 Associated Press (AP) Newswire 3.7 All media combined 2.2
If the outlier of 3.7 corresponding to the AP Newswire is omitted, then the average positive/negative ratio is 2.1 with a standard deviation of 0.2. Pro-BJT information is generally about twice as persuasive as con-BJT messages. The ratio has grown from 1.8 to 2.2 since BJT began monitoring its brand. This is held to be a sign of BJT’s growing reputation in its chosen market. Reputational risk is considered to be low.

28
Political Risk The company is exposed to political risk through import/export quotas and price controls. The North American Free Trade Agreement (NAFTA) between U.S.A., Canada and Mexico gave birth to the U.S. operations of BJT. BJT is exposed to future changes in this agreement. During the crisis, U.S. interest lobby groups demanded stronger nationalist policies. There continues to be strong political support for NAFTA, in the current US administration. However, were political leadership to change in the U.S. and the poor economic growth to persist, NAFTA might be revisited. The supply chain is also exposed to political risk due to the geographical location of the suppliers, which are primarily in Malaysia. Political risk is considered a medium risk for BJT as a small Canadian firm operating in the U.S. Currency Risk Manufacturing costs and the revenue generated are in different currencies resulting in a possible loss. BJT Canadian operations and sales are in Canadian dollars and the U.S operations and sales are in U.S. dollars. 85% of the raw materials are sourced from Malaysia. 3.3 Recall Recent Tire Recall Issue Below are the headline news article and a series of emails uncovered by the investigative journalist that led to the recent tire recall. Blue Jay Tire quality or quantity, you decide by Jennifer Truth Smallville, Arizona (Associated Press – August 2nd 2013): The Blue Jay Tire Co (BJT) reported in May 2013 that a tire defect which caused a single car accident was an isolated incident. Bradley Johnson, CEO, issued a statement saying “Blue Jay Tire has a long history of manufacturing excellence but on behalf of our employees we extend our condolences to the Franklin family for their loss. We regret that a BJT tire was responsible for this accident. On behalf of our engineers, line managers and production team, I can assure the Franklin and any family in the USA that we do everything in our power to ensure our tires are the highest quality on the road”. The tire involved on the day in May, was the RU42WD model. Over 40 million of these tires have been sold in the USA. The official report on the accident disclosed that the defective tires exploded causing a sudden loss of driver control.

29
In July, this reporter uncovered a number of email records related to RU42WD tires in BJT’s manufacturing process. In an email dated Aug 8th 2009, the BJT (Canada) head engineer, Paul Gosling indicated reservation with the speed of the production line resulting in uneven rubber density to a BJT (USA) executive, Jack Tavares. The follow-up responses indicate that some corrective action was taken to redress the situation. When contacted, the BJT (USA) head engineer, Chris Carpenter, at the time reported to this paper: “The production process always ran within its design limits. But we did notice tire density variations. We never did test the possible impact of low density tires on automobiles travelling at speed. Instead we relied on the fact that the tire thread wear tests were always within the tolerances commonly used by all tire companies at the time”. Chris Carpenter now works for a rival firm. BJT (USA) refused to comment when contacted about these internal memos and the comments of Mr. Carpenter. Below are the series of emails that were uncovered by AP journalists: From: Paul Gosling To: Jack Tavares Date: August 8, 2009 Subject: Sticky valves and rubber density on tires Jack – After visiting ET-USA plant, I did not feel that enough Quality Assurance is in place. In general, I think production is too fast to match demand and not enough checks are being made. Specifically, I have noticed two items: sticky valves on model RU42WR and uneven rubber density on RU42WD. I recommend the line managers to monitor these issues more closely and to tighten the allowed defects – even though this may slow production – so as to correct these issues. Although the valve is more of a nuisance, the density is more of a safety issue, but to be clear, the low density areas are still within prescribed density limits – there are just some noticeable variations within the tires. I will keep you posted. Paul Gosling Head Engineer Blue Jay Tire (Canada) From: Jack Tavares To: Paul Gosling Date: August 12, 2009 Subject: RE: Sticky valves and rubber density on tires Paul Good catch – I will follow up with Chris regarding both RU42WR and RU42WD.

30
Hope you enjoyed your visit Jack Tavares Chief Risk Officer Blue Jay Tire (USA) From: Chris Carpenter To: Jack Tavares Date: September 9, 2009 Subject: Tire production Jack This is to summarize our calls over the past month. I think we have both issues solved: as I mentioned on the phone, the sticky values on RU42WR were easily fixed by increasing the lubricant on the silicon machine. RU42WD required more effort and took longer. We discovered a small inconsistency on the centrifuge console. My staff recalibrated it and we have eliminated the density issue. We also increased our spec inspections from 1-in-200 to 1-in-20 until we were confident the fix took. We are back up to regular production levels again. We are actually considering increasing the product speed. Thanks again, Chris Chris Carpenter Head Engineer Blue Jay Tire (USA)

31
3.4 Blue Jay Tire Exhibits EXHIBIT 1
Blue Jay Tire Corporation NON-CONSOLIDATED STATEMENTS OF OPERATIONS
(US Dollars in millions) FISCAL YEAR ending 12/31/YYYY 2012 2011 2010 2009 2008 2007 Total Gross Sales 23,463 21,928 20,494 19,153 17,900 8,967 Cost of Sales (1) Cost of Raw Materials (3,519) (3,289) (3,074) (2,873) (2,685) (1,345) Production Costs (2) (6,570) (6,798) (6,558) (6,704) (6,086) (2,869) Depreciation & Amortization (1,500) (1,500) (1,500) (1,500) (500) (500) Shipping Costs (3,754) (2,960) (2,254) (1,628) (1,074) (314) Other (409) (514) (605) (683) (751) (377) Total Costs of Sales (15,753) (15,061) (13,991) (13,388) (11,096) (5,405) Net Revenue 7,711 6,867 6,503 5,765 6,804 3,562 Operating Expenses Research Development 939 1,096 1,230 1,341 1,432 807 Selling General & Administrative (3) 4,981 4,609 4,265 3,947 3,652 1,811 Non-Recurring (4) 323 398 295 23 27 173 Foreign Exchange Gain(Loss) 11 (6) (8) 15 20 14 Other (5) 60 49 50 100 27 10 Total Operating Expenses 6,314 6,147 5,832 5,425 5,158 2,815 Operating Income or Loss 1,397 720 671 340 1,646 746 Income from Continuing Operations Total Other Income/Expenses Net (6) 3,659 1,982 2,501 1,940 1,439 1,673 Earnings Before Interest & Taxes 5,056 2,702 3,172 2,280 3,085 2,419 Interest Expenses 1,801 1,765 1,457 1,165 880 350 Income Before Taxes 3,254 938 1,715 1,115 2,205 2,069 Income Taxes 651 188 343 223 441 414 Net Income from Continuing Ops 2,604 750 1,372 892 1,765 1,655
Notes: (1) Includes cost of material & production with overhead (2) Includes salaries & overheads directly related to production (3) Includes salaries other than production related (4) Includes operational process upgrades (5) Predominantly injury claims (6) Performance of the tire warranty program and Sales from travel & restaurant guide books

32
EXHIBIT 2 Blue Jay Tire Corporation
NON-CONSOLIDATED STATEMENT OF FINANCIAL POSITION (US Dollars in millions)
FISCAL YEAR ending 12/31/YYYY 2012 2011 2010 2009 2008 2007 ASSETS Current Assets Cash and Cash Equivalents 5,413 1,294 1,185 1,087 996 489 Short Term Investments 2,457 8,154 8,023 6,205 193 5,113 Receivables 2,095 995 913 851 754 322 Inventory 607 598 532 576 582 2,815 Total Current Assets 10,572 11,041 10,654 8,719 2,525 6,296 Long Term Investments 21,689 16,236 8,213 2,008 93 4,509 Property Plant and Equipment 20,500 22,000 23,500 25,000 26,500 8,000 Accumulated Amortization - 200 400 - - - Intangible Assets 2,500 2,500 2,500 2,500 2,500 500 Other Assets 1,005 755 431 375 369 178 TOTAL ASSETS 56,266 52,732 45,698 38,601 31,986 19,483 LIABILITIES and EQUITY Current Liabilities Accounts payable 109 41 42 35 23 15 Short/Current Term Debt 5,550 6,400 5,000 5,000 4,500 - Other Current Liabilities 40 23 22 29 30 17 Total Current Liabilities 5,699 6,464 5,064 5,064 4,553 32 Long Term Debt 28,476 26,890 22,142 16,298 11,097 5,000 Other Liabilities 450 340 200 316 300 178 TOTAL LIABILITIES 34,625 33,694 27,406 21,678 15,950 5,210 Equity Retained Earnings 16,641 14,038 13,292 11,923 11,036 9,273 Capital 5,000 5,000 5,000 5,000 5,000 5,000 TOTAL EQUITY 21,641 19,038 18,292 16,923 16,036 14,273 TOTAL LIABILITIES and EQUITY 56,266 52,732 45,698 38,601 31,986 19,483

33
EXHIBIT 3 Blue Jay Tire Corporation
NON-CONSOLIDATED STATEMENT OF CASH FLOW (US Dollars in millions)
FISCAL YEAR ending 12/31/YYYY 2012 2011 2010 2009 2008 2007 Net Income 2,603 746 1,369 887 1,763 1,653 Operating Activities, Cash Flows Provided By or Used In Depreciation 1,500 1,500 1,500 1,500 500 500 Amortization of deferred expenses 200 200 200 0 0 0 Adjustments To Net Income: Changes In Accounts Receivables (1,100) (82) (62) (97) (432) (72) Changes In Liabilities/Account Payables 68 (1) 7 12 8 10 Changes In Inventories (9) (66) 44 6 (210) (66) Changes In Other Operating Activities 0 0 (600) 0 0 0
Total Cash Flow From Operating Activities 3,262 2,297 2,458 2,308 1,629 2,025 Investing Activities, Cash Flows Provided By or Used In Capital Expenditures 0 0 0 0 (21,000) 0 Investments 5,697 (131) (1,818) (6,012) 4,920 (2,113) Foreign exchange gain(loss) 0 0 0 0 0 0 Other Cash flows from Investing Activities (5,703) (8,347) (6,261) (1,921) 4,225 (687)
Total Cash Flow From Investing Activities (6) (8,478) (8,079) (7,933) (11,855) (2,800) Financing Activities, Cash Flows Provided By or Used In Dividends Paid 0 0 0 0 0 0 Sale Purchase of Stock 0 0 0 0 0 0 Net Borrowings 736 6,148 5,844 5,701 10,597 719 Other Cash Flows from Financing Activities 127 141 (123) 15 135 45
Total Cash Flow From Financing Activities 863 6,289 5,721 5,716 10,732 764 Cash & cash equivalents, beginning of year
1,294
1,186
1,087
996
489
500
Cash & cash equivalents, end of year 5,413 1,294 1,186 1,087 996 489 Change In Cash and Cash Equivalents 4,118 108 99 91 507 (11)

34
4 Frenz Corporation 4.1 Background Frenz Corporation (referred to “Frenz” from here on) is a wholly owned subsidiary of RRPC Dynasty. It is a global premier roaster, marketer and retailer of specialty coffee in the European and American countries, incorporating in Belgium. It has operations in most major cities of Europe and America, including all developed countries and some developing countries. In addition to company-operated stores, Frenz also sells a variety of coffee and tea products and licenses its trademarks through many other channels such as licensed stores, groceries, private clubs, hotels, cruise ships and national foodservice accounts. Frenz is one of the most recognized and respected brands in the “premier” coffee houses as well as a household brand in the developed world. Its main competitors in the coffee houses market include Starbucks, McDonald’s, Douwe Egberts, Delta Cafés, Genovese Coffee, and Markus Coffee. Its household brand’s main competitors include Nescafè, Folgers, Maxwell House, Jacobs, Douwe Egberts, and Starbucks. Thus, two of its main objectives are to maintain its competitive standing as well as continue its disciplined expansion of the store base, primarily focused on growth in developing countries. Mission Statement Frenz’s mission statement is: One person, one cup, one community, one world. We care about our family. This mission statement focuses on our objective of being the most recognizable coffee brand in the world. Board of Directors Frenz’s Board consists of 8 members. Three board members are Chief Executive Officers or Board Chairmen in leading public companies in Belgium, two are Board members of the holding company and the remaining Board members are executive officers of Frenz. More information on committee structure is included in Section 4.4, Exhibit 1. In recent years RPPC Dynasty Corporation, the holding company of Frenz, has adopted a global company risk management mandate in order to ensure consistent and unified risk management policies, strategies and processes among the conglomerate groups of companies. In conjunction with the new mandate, Dynasty recently hired a Global Chief Risk Officer to oversee implementation. In response to the new risk management strategy, Frenz’s Board hired an experienced Chief Risk Officer, Robert Kaplan, to develop the risk management strategies for Frenz and to ensure that these

35
strategies fit in Dynasty’s global risk management mandate. Robert Kaplan’s responsibilities include proper integration of risk management strategies and policies with the global strategies and policies, smooth and controlled implementation of these strategies, and cultivation of an acceptable risk management culture for Frenz facilitating its ultimate goal of becoming the top coffee company in the world. With this new mandate the Board members have some disagreements as to which Board Committee should be given the responsibility of overseeing the work of Robert Kaplan. Some Board members believe that the Audit Committee’s role should be expanded to oversee this new risk management mandate. Some Board Committee members believe that this new mandate involves significant strategic changes and should be the Executive Committee’s role. Some believe that it should be the role of Related Party and Conduct Review Committee Role’s as the strategies will involve significant related party transactions. The Board of Directors has requested Robert Kaplan consult with the Global Chief Risk Officer and provide a recommendation. Market Strategies
Frenz is dominant in the high-end specialty coffee market, especially through its premier coffee house outlet which has over a 55% market share in all developed countries. However, its market shares in the developing countries and household coffee constitute only about 5% and 16%, respectively. There is significant growth potential in these countries where the customer base is still expanding and there is a chance to increase market share without the pressure to take customers from competitors. Frenz’s current market strategies are as follows:
• Continue its dominant market position in the coffee houses by organic expansion of its company-operated coffee houses in the developed countries through building more of these company-operated coffee houses in financial districts and high socio-economic areas;
• Further nurture relationships with and loyalty from other distributors such as high-end hotels, private clubs, universities, cruise-liners and upscale grocery and retail outlets such as bookstores and department stores;
• Expand into more developing countries through acquisition of local coffee house chains, franchising, and organic growth into more cities and financial districts of the developing countries especially the fast growing Asian market;
• Target local advertising in certain countries to expand its household brand recognition as well as add more endorsements with certain significant events such as the World Cup, the Olympics, the World Exhibition, and events of religious significance.
• Maintain a significant budget devoted to Frenz’s renowned marketing capability, which due to investments over many years has achieved significant economies of scale;
• Further enhance the company’s ability to quickly develop and roll out new and innovative products, which helps defend against potential coffee substitutes as well as serving to further differentiate Frenz from its competitors;

36
Frenz is also exploring vertical integration by owning and controlling its sources of key ingredients such as coffee beans plantations and tea plantations in order to enhance its quality control as well as developing its own niche products. Risk Profiles
Frenz faces significant supply-chain risks such as commodity price risks and shipping costs and demand risks such as significant competitive pressures and change in consumer markets. It also faces operation risks, litigation and reputational risks and other market risks which include foreign currency exchange risk, equity security prices, and interest rates. It also faces staff turnover, litigation and reputational risks. Each of these risks is described in detail in the Section 4.4, Exhibit 2. Financial Statements Detailed financial statements are shown in Section 4.4, Exhibits 3 and 4. 4.2 Growth Growth is never easy as the following examples of external and internal growth pains illustrate. External Challenges During the financial crisis in 2008, Frenz suffered significant losses due to the reduced market demand as well as significant investment losses. Some Board members were unhappy with the geographical market concentration which caused Frenz’s losses. The Marketing Vice President, Anthony Pirot is being empowered to implement the recent market strategic goals set by the Board. Anthony Pirot’s first priority is to expand into the fast growing Asian market. Anthony Pirot currently leads a team of twenty experienced and mature marketing staff whose experience is predominantly targeting the higher socio-economic clientele in the developed countries in Europe and the United States. Internal Challenges This expansion strategy will require significant capital. The new Chief Risk Officer, Robert Kaplan, is uneasy with the expansion strategy as cash flow in Frenz will be greatly strained without additional debt financing. Growth Strategies Anthony is expanding Frenz’s product lines such as the super-premium coffee market, bubble teas, specialty fruit drinks, and mixed coffee and tea drinks that have given Frenz a reputation as a product innovator in the market. To this end, Frenz is exploring offering coffee made from exotic coffee beans and special tea leaves. There are very few areas that can produce such high–quality premium coffee beans. The best coffee beans are from Costa Rica, the Finca Palmilera, but they are very expensive. However, through market research Frenz has determined that its customers often cannot distinguish

37
between the premier super-premium coffee bean, Costa Rica Finca Palmilera, and its cousin the Vietombia Finca Palmilera, whose popularity is not as great, but whose flavor is considered comparable to Costa Rica Finca Palmilera. The Asian country of Vietombia is the largest producer of Vietombia Finca Palmilera. Although Vietombia is a major producer of coffee, its domestic consumption is very small. Vietombia has a growing, export-driven economy. The historical statistics on Vietombia are summarized in Section 4.4, Exhibit 5a. Despite Vietombia’s increased participation in international trade, 10 years ago Vietombia put in place a policy to peg its currency to that of its neighboring countries. The effect of this has been to effectively deflate the value of Vietombia’s currency, the Rubiaceae, and as a consequence bolster Vietombia’s export-driven economy. Independent economic analysis has suggested the deflation of Vietombia’s currency has been instrumental to the growth of the Vietombia economy. However, the banking system in Vietombia has been slow in modernizing, and all domestic banks primarily engage in domestic thrift activity, and as a consequence their risk management and hedging programs are in their early stages. Further, the central banking system performs largely a symbolic role. As a result of Vietombia government’s eagerness to stabilize its economy, the government is willing to give an exclusive dealership of the premium coffee beans produced there to Frenz provided Frenz sets up exclusive production facility for these super-premium coffee beans in Vietombia. This presents a significant opportunity for Frenz to gain favorable access to its key ingredient not easily duplicated by competitors, to reduce its reliance on other coffee suppliers, and to control costs as well as influence and control the quality of future coffee bean production. However, this vertical integration strategy presents significant upfront cost requirements which may substantially increase the company’s leverage ratio and lower the overall credit rating for Frenz. Details of the deal are given in Section 4.4, Exhibit 5b.

38
4.4 Frenz Exhibits EXHIBIT 1
Frenz Corporation Board of Directors There are no family relationships among any of Frenz’s directors or executive officers. The mandate of the Board is to supervise management of the business and affairs of Frenz on a broad scale rather than daily management. Its responsibilities include approving strategic goals and objectives, review of operations, disclosure and communication policies, oversight of financial reporting and other internal controls, corporate governance, Director orientation and education, senior management compensation and oversight, and Director nomination, compensation and assessment.
In order to ensure that the responsibility is carried out on a cohesive manner, the Board has established the following sub-committees to aid in carrying out its responsibilities:
• Executive Committee – The Executive Committee has and may exercise all or any of the powers vested in and exercisable by the Board, including approval of the annual strategic plan.
• Audit Committee – The primary mandate of the Audit Committee is to review Frenz’s financial statements and public disclosure documents containing financial information and to report on such review to the Board, to be satisfied that adequate procedures are in place for the review of Frenz’s public disclosure documents that contain financial information, to oversee the work and review the independence of the external auditors, and to review any evaluation of Frenz’s internal control over financial reporting.
• Compensation Committee – The Compensation Committee’s primary mandate is to approve compensation policies and guidelines for Frenz employees, to approve compensation arrangements for Frenz executives, to recommend to the Board compensation arrangements for the Directors and to oversee the management of incentive compensation plans, and to review succession plans for senior management.
• Related Party and Conduct Review Committee – The primary mandate of the Related Party and Conduct Review Committee is to recommend to the Board procedures for the consideration and approval of transactions with related parties of Frenz and to review and, if deemed appropriate, to approve such transactions.
• The Governance and Nominating Committee – The primary mandate of the Governance and Nominating Committee is to oversee Frenz’s approach to governance issues, to recommend to the Board corporate governance practices consistent with Frenz’s commitment to high standards of corporate governance, to assess the effectiveness of the Board of Directors, of Committees of the Board and of the Directors, and to recommend to the Board candidates for election as Directors and for appointment to Board Committees. This Committee is also responsible in recommending the Board on the “Code of Business Conduct and Ethics” policies to ensure and maintain a culture of integrity throughout the company. This Code is applicable to Frenz Directors, officers and employees.

39
EXHIBIT 2 Risk Profiles
Supply-Chain Risks
Commodity price risk is the primary supply-chain risk for Frenz. Price volatility of key ingredients such as green coffee, tea leaves and dairy products, etc. presents a substantial exposure to the stability of the product prices as well as profit margins. This is mitigated somewhat by the ability to keep coffee and tea for long periods of time, thus reducing storage costs.
In addition, oil prices also have a direct impact on shipping costs. Frenz incurs substantial shipping costs in transporting the key ingredients to its worldwide retail outlets. Therefore, oil price increases over recent years have eroded Frenz’s profit margin.
Supply and price can be affected by multiple factors in the producing countries, including weather, political and economic conditions. Price for coffee is also impacted by trading activities in the Arabica coffee futures market, including hedge funds and commodity index funds.
Furthermore, green coffee prices may be affected by actions of certain organizations and associations that have historically attempted to influence prices of green coffee through agreements establishing export quotas, increased tariffs, embargoes, customs restrictions or by restricting coffee supplies. Similar influence also exists for prices of tea leaves.
Relationships with the producers (coffee, tea & diary), outside trading companies, suppliers and exporters are also pertinent in assessing the risk of non-delivery on purchase commitments and quality of ingredients delivered.
Demand Risks
Competition can be fierce as the capital required to enter the industry is low. The company is facing competition not only from the specialty beverage shops such as Starbucks, Timothy’s, Second Cup etc., but also from quick-service restaurants such as McDonald’s, donut shops such as Tim Hortons, dessert shops, high-end restaurants and other specialty retailers, etc. Thus the need for the company to keep expanding and differentiating its product lines and to venture into unfamiliar territories is becoming inevitable.
Customer loyalty is pertinent in this trade. As a result, the company will continue to expand its popular loyalty card program, which has been effective in preventing other companies from stealing away Frenz’s customers, to include products from other sister companies in the conglomerate group.
Adverse economic conditions may cause declines in general consumer demands for these high-end products, driving the increase in costs and pressure for reduced quality of products, which in turn, may increase impacts from negative publicity.

40
Adverse impacts resulting from negative publicity regarding business practices or health effects of consuming products, etc., may lead to reduction in demand and profitability and to increase in litigation.
Supply-Demand Risk Model
Due to risks on both the supply and demand sides of the operation, Frenz developed a supply-demand economic model to evaluate its business strategy and risk profile. This model is not as detailed as the economic models RPPC runs for conglomerate reporting. It is intended to be a simplified, more intuitive model that can aid Frenz in its ongoing operations and strategy without the complex interrelationships and assumptions of RPPC’s model.
Operational Risks
As Frenz is facing expansion, risks are associated with each expansion plan that it is exploring. Implementation of these plans can be very challenging and risky as these plans are disruptions to the ongoing business.
Delays in store openings for reasons beyond control, exposure to increased construction costs associated with new store openings and lack of desirable real estate locations availability would also negativity impact the net revenues and profit margins.
The degree to which Frenz enters into, maintains, develops, and is able to negotiate appropriate terms and conditions and to which it can enforce commercial and other agreements could have significant impact on company financing and operation.
Loss of key personnel, difficulties in recruiting and retaining qualified personnel, labor discord, political instability and natural disasters could cause significant business interruption which, in turn, adversely impacts the business and financial results.
Adverse public or medical opinions about health effects, food tampering, food contamination, and regional or global health pandemics could severely and adversely impact the company’s business.
Due to Frenz’s heavy reliance on information technology, any material failure, inadequacy, interruption or security failure of the technology could harm the ability to effectively operate the business. Litigation and Reputation Risks
Success depends substantially on the value of the brands especially in the specialty business. Thus the company has to maintain quality of product and be able to consistently deliver positive consumer experience and engage in corporate social responsibility programs to enhance the company reputation. Brand value is based, in part, on consumer perceptions on a variety of subjective

41
qualities. Even isolated business incidents that erode consumer trust, such as contaminated food or privacy breaches can significantly reduce brand value, particularly if the incidents receive considerable publicity or result in litigation.
Reputation may be harmed by actions taken by third parties that are outside of the company’s control. Third parties may include business partners, licensee and partnership relationships, suppliers, vendors and any business associates that the company has engaged in past or current dealings. Proper handling of customers’ complaints is very important in protecting the company’s reputation and preventing potential litigation. Foreign Currency Risk Because Frenz has operations in many different countries, currency exchange risk exists as the risk of having differing currencies generated from revenue and expense sides. Currency volatility has caused significant costs in operation due to timing differences. Equity Security Risk Frenz has investments in equity markets and equity market volatility has caused significant impacts on the investment margins of Frenz. Interest Rate Risk Frenz has significant debt issuances and also has investments in bond markets. Therefore, interest rate volatility has caused significant impacts on the investment margins of Frenz. Liquidity Risk In order to maintain the company’s growth rate, Frenz is now facing increasing liquidity risks.

42
EXHIBIT 3 Financial Statements and Supplementary Data
Frenz Corporation Ltd. CONSOLIDATED STATEMENTS OF EARNINGS
(In millions, except per share data)
Fiscal Year Ended Dec 31, 2012 Dec 31, 2011 Dec 31, 2010 Dec 31, 2009 Dec 31, 2008 Net revenues:
Company-operated stores $ 960 $ 890 $ 650 $ 400 $1,360 Licensed stores 100 85 50 45 200 CPG, foodservice and other 106 88 60 100 100 Total net revenues 1,166 1,063 760 545 1,660 Cost of sales including occupancy costs 495 445 375 255 760 Store operating expenses 366 355 320 300 400 Other operating expenses 40 29 25 20 100 Depreciation/ amortization expenses 52 51 50 50 50 General & administrative expenses 65 56 30 28 80 Restructuring charges 0 53 100 200 0 Total operating expenses 1,018 989 900 853 1,390 Gain on sale of properties 30 0 0 0 0 Income from equity investments 18 15 10 (175) 125 Operating income 196 89 (130) (483) 395 Interest income and other, net 11 5 5 4 10 Interest expense (3) (3) (3) (3) (4) Earnings before income taxes 204 91 (128) (482) 401 Income taxes (63) (28) 14 144 (121) Net earnings (loss) $141 $63 $(114) $(338) $280 Earnings per share—basic $0.28 $0.13 $(0.07) $(0.68) $0.56 Cash dividends declared per share $0.005 - - - $0.01 Cash Dividends Paid $2.52 - - - $5.00

43
EXHIBIT 4 Frenz Corporation Ltd.
CONSOLIDATED BALANCE SHEETS (In millions, except per share data)
Fiscal Year Ended Dec 31, 2012 Dec 31, 2011 Dec 31, 2010 Dec 31, 2009 Dec 31, 2008 ASSETS
Current assets:
Cash and cash equivalents $138 $116 $90 $20 $200
Short-term investments —available-for-sale securities
85 24 15 5 100
Short-term investments —trading securities 5 5 2 2 15
Accounts receivable, net 60 30 35 30 40
Inventories 96 54 70 160 95
Prepaid expenses & current assets 16 16 20 15 30
Deferred income taxes, net 23 30 35 40 50
Total current assets 423 275 267 272 530
Long-term investments —available-for-sale securities
10
19
10
5
30
Equity and cost investments 37 34 15 8 50
Property, plant and equipment, net 235 245 205 200 300
Goodwill 25 25 25 25 35
Other intangible assets 5 5 5 5 15
Other assets 44 23 5 25 30
Total Assets $779 $626 $532 $540 $990
LIABILITIES AND EQUITY
Current liabilities:
Accounts payable $24 $28 $35 $40 $50
Accrued compensation & related cost 36 40 35 10 50
Accrued occupancy costs 15 17 20 15 20
Accrued taxes 10 10 5 2 10
Insurance reserves 15 15 15 15 15
Other accrued liabilities 32 26 22 15 25
Deferred revenue 43 41 40 25 60
Total current liabilities 175 177 172 122 230
Long-term debt 120 110 95 55 55
Other long-term liabilities 52 45 38 22 92
Total liabilities $347 $332 $305 $199 $377
Shareholders’ equity:
Common stock ($0.001 par value) —authorized, 500 shares; issued & o/s
$0.5
$0.5
$0.5
$0.5
$0.5
Additional paid-in capital 44.8 44.8 44.8 44.8 0.3
Other additional paid-in-capital 34 34 34 34 4
Retained earnings 347 209 146 260 598
Accum. other comprehensive income 5 6 2 2 10
Total shareholders’ equity $432 $294 $227 $341 $613
TOTAL LIABILIATIES AND EQUITY
$779
$626
$532
$540
$990
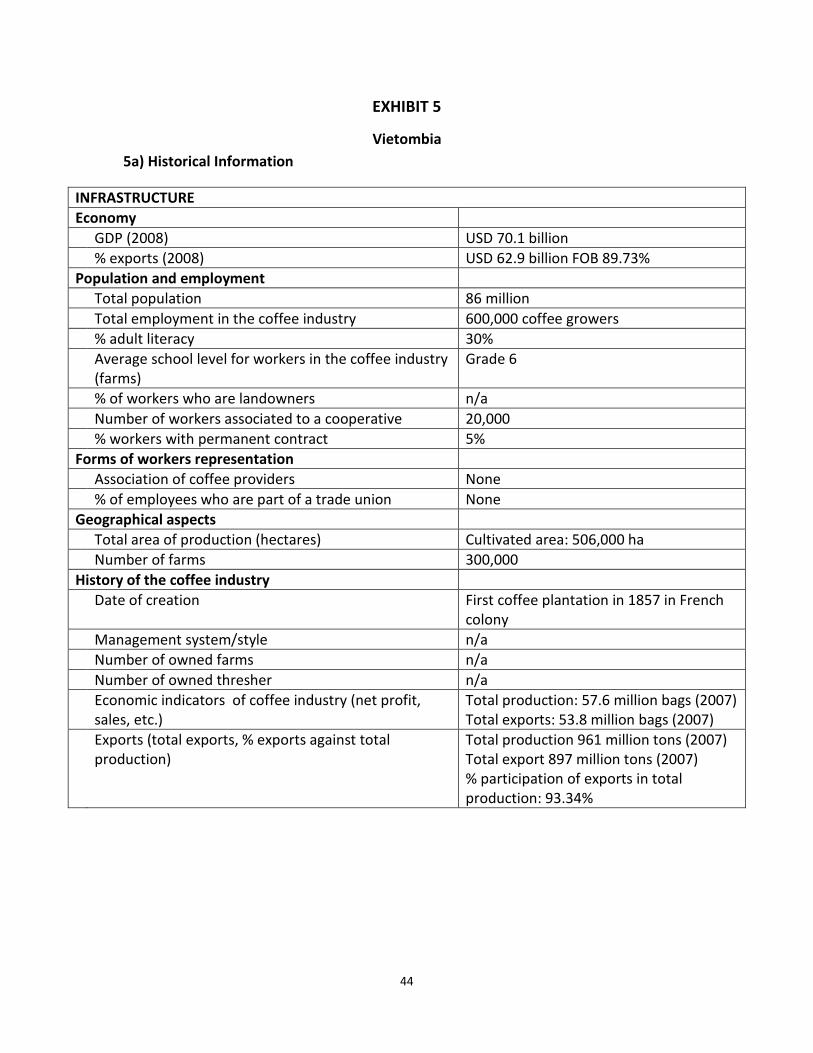
44
EXHIBIT 5
Vietombia 5a) Historical Information
INFRASTRUCTURE Economy GDP (2008) USD 70.1 billion % exports (2008) USD 62.9 billion FOB 89.73% Population and employment Total population 86 million Total employment in the coffee industry 600,000 coffee growers % adult literacy 30% Average school level for workers in the coffee industry
(farms) Grade 6
% of workers who are landowners n/a Number of workers associated to a cooperative 20,000 % workers with permanent contract 5% Forms of workers representation Association of coffee providers None % of employees who are part of a trade union None Geographical aspects Total area of production (hectares) Cultivated area: 506,000 ha Number of farms 300,000 History of the coffee industry Date of creation First coffee plantation in 1857 in French
colony Management system/style n/a Number of owned farms n/a Number of owned thresher n/a Economic indicators of coffee industry (net profit,
sales, etc.) Total production: 57.6 million bags (2007) Total exports: 53.8 million bags (2007)
Exports (total exports, % exports against total production)
Total production 961 million tons (2007) Total export 897 million tons (2007) % participation of exports in total production: 93.34%

45
5b) Vietombia Proposal - Exclusive production agreement with government of Vietombia - Gives Frenz rights to purchase all coffee grown in Vietombia - Frenz must build production facility in Vietombia, but would own and run the facility - Potential competitive advantage due to exclusive supply of high quality coffee beans
Initial Cost 100M Additional expected annual net earnings from exclusive beans 10M Current Cost of Debt for Frenz (net of tax) 7% Risk of Losses from Coffee Price Fluctuation Percentile Current Loss Loss with Vietombia Deal 99 100 60 98 85 50 95 50 30 90 25 15

46
5 Blue Ocean P&C Company 5.1 Background Mission Our mission is to strengthen the brand identity as a dominant innovator in the UK market and maximize sustainable long-term growth in shareholder value. History RPPC Dynasty acquired Blue Ocean, the 5th largest property and casualty insurance company in the United Kingdom (UK), in 2009. This acquisition gave RPPC access to Blue Ocean’s lucrative insurance market in the UK and continental Europe. Products include marine, property catastrophe and retrocession. Since then, Blue Ocean continued to expand and develop its insurance businesses worldwide. In September 2011, Blue Ocean began writing Pet and Travel insurance business in North America. As of the beginning of 2012, the capital base was $1.5 billion. Rating Guided by experienced management and backed by an impressive team of underwriters, actuaries and catastrophe risk modellers, Blue Ocean earned an A.M. Best rating of A (Excellent) and quickly established itself as a market leader. Management team
CEOEdward Blue
CFOMichael Tan
EVP Chief Actuary
EVP CLO
EVP CRO
EVP Business Ops
EVP CAO
Anne Green Jerome Black Geoff Olive Andrew Grey Michelle Rouge Strategy The traditional business arena for Blue Ocean has been the marine insurance market. This focus has been very successful in the company’s traditional geographical market, the United Kingdom. Currently, Blue Ocean has a 2% market share in the entire Atlantic Ocean region thanks to its success in the UK market. Its exposure to loss is proportional to its market share.

47
With the post-acquisition expansion into a new region, the company management team decided to expand its focus into Pet and Travel Insurance. In keeping with its mission to be an innovative leader, the executive is also considering an offering within the emerging Renewable Energy sector. Within the Pet and Travel insurance lines, the goal is to establish a dominant market share. The financial goals are to generate as much profit and premium from this new risk arena as currently in the core Marine business. Financial Summary 2012 Premium income(millions) 2012 reported profit (millions) Marine 250 18.0 Pet 50 1.5 Travel 100 4.0 Projected 2013 Financials (in millions) Premium Income Claims Profit Marine 320 250 25.0 Pet 65 52 5.0 Travel 120 90 17.0 Blue Ocean’s hurdle rate is 12%. It defines its ROE as Expected Profit/Required Capital. Blue Ocean’s corporate tax rate is 35%. Blue Ocean Required Capital Blue Ocean calculates the required capital for each line of business separately. Required capital for each line of business is calculated as VaR 99 – VaR 95. Expected Loss Distributions by Line of Business (in millions) Percentile Marine Claims Pet Claims Travel Claims 50.0% 250 52 90 75.0% 275 58 95 90.0% 550 100 130 95.0% 800 125 150 99.0% 1,000 150 163 99.5% 1,150 165 175 99.9% 1,400 175 180

48
5.2 Opportunity Renewable Energy Insurance Business profile Renewable energy and its associated technologies are an emerging industry. There are considerable uncertainties for companies operating in this industry to predict their income generation capabilities. There are two key sources of uncertainty: 1) the productivity of a given technology to generate given units of energy, and 2) market price of selling units. The intended focus of our insurance solution for this industry is to offer protection on the income generated by energy suppliers. The renewable energy lines of business are segmented into:
1. Types a. Solar b. Wind c. Water
2. Commercial and personal Overview of Solar Personal Energy Insurance The target homeowner for this insurance program has over 1,000 sq. ft. available roof space for mounting solar panels. The typical client has purchased solar panels that can generate between 7,000 to 12,000 khw of energy per year; and depending on the cost of the panels can be enticed into a fixed contract to sell the energy generated for between 30c to 60c per khw (c = cents). A solar personal contract would either guarantee the number of units that are generated (7000 khw), or the sale price per unit (30-60c), or both (4000 khw sold at 40c). In exchange Blue Ocean would receive the actual units of energy generated and would sell them in the energy market via electrical companies. Some of the electric companies would be either privately owned or government regulated or run by the state department. There is a trend in North America for families to purchase their own personal solar grids. Our five year plan is to become the face of the insurance to this group. Main Risk Factors: Weather Mechanics Default rate Energy conversion ratio Counterparty
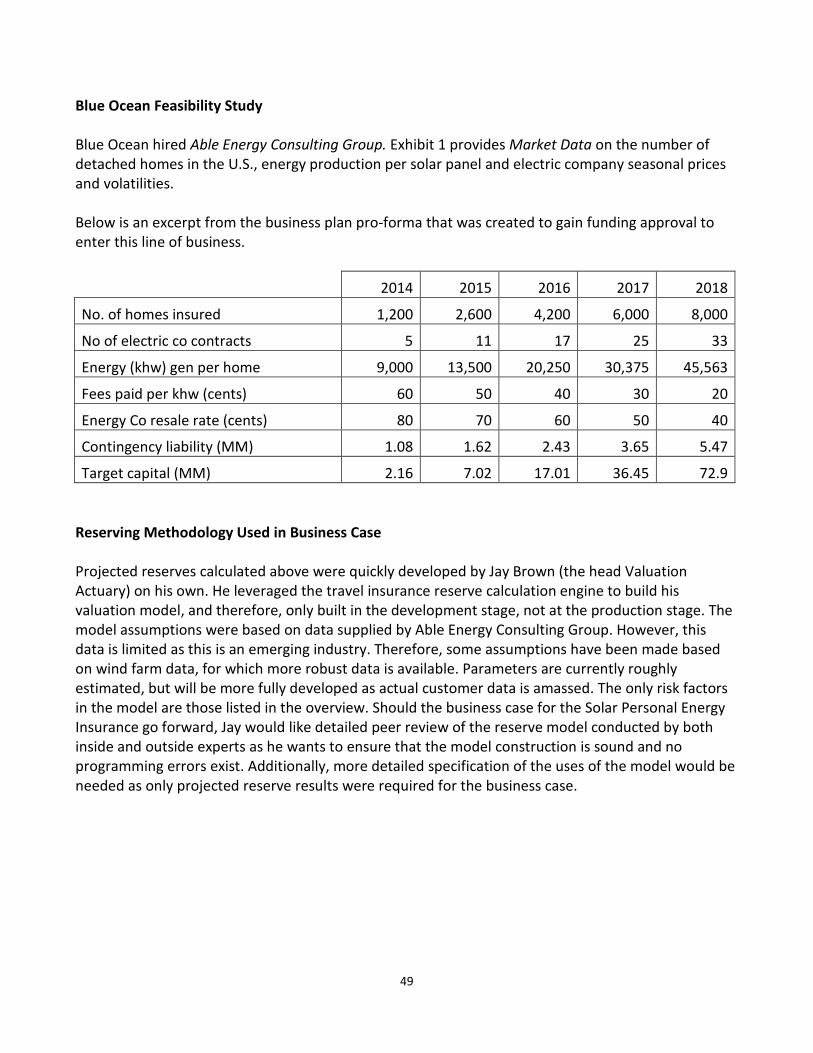
49
Blue Ocean Feasibility Study Blue Ocean hired Able Energy Consulting Group. Exhibit 1 provides Market Data on the number of detached homes in the U.S., energy production per solar panel and electric company seasonal prices and volatilities. Below is an excerpt from the business plan pro-forma that was created to gain funding approval to enter this line of business.
2014 2015 2016 2017 2018
No. of homes insured 1,200 2,600 4,200 6,000 8,000
No of electric co contracts 5 11 17 25 33
Energy (khw) gen per home 9,000 13,500 20,250 30,375 45,563
Fees paid per khw (cents) 60 50 40 30 20
Energy Co resale rate (cents) 80 70 60 50 40
Contingency liability (MM) 1.08 1.62 2.43 3.65 5.47
Target capital (MM) 2.16 7.02 17.01 36.45 72.9 Reserving Methodology Used in Business Case Projected reserves calculated above were quickly developed by Jay Brown (the head Valuation Actuary) on his own. He leveraged the travel insurance reserve calculation engine to build his valuation model, and therefore, only built in the development stage, not at the production stage. The model assumptions were based on data supplied by Able Energy Consulting Group. However, this data is limited as this is an emerging industry. Therefore, some assumptions have been made based on wind farm data, for which more robust data is available. Parameters are currently roughly estimated, but will be more fully developed as actual customer data is amassed. The only risk factors in the model are those listed in the overview. Should the business case for the Solar Personal Energy Insurance go forward, Jay would like detailed peer review of the reserve model conducted by both inside and outside experts as he wants to ensure that the model construction is sound and no programming errors exist. Additionally, more detailed specification of the uses of the model would be needed as only projected reserve results were required for the business case.

50
5.3 Solar Energy Statistics
SOLAR ENERGY STATISTICS (SOUTHERN USA) Year 2000 2001 2002 2003 2004 2005 Weather Related Number of Rainy days 71 84 79 67 76 97
Number of severe weather (storms) 19 27 9 29 31 67 Political Support States with energy rebate programs 1 1 1 2 2 3
% of voters considered candidates record on environmental issue 1% 1% 2% 3% 5% 10%
Manufacturing Base
Number of panel provider companies 0 1 4 8 10 15
Number of panel manufacturers 1 1 2 3 3 4
Cost of photovoltaic cells (key component) 113 103 90 70 66 63
Energy production capacity 10sq.ft.panel (KwH) 426 679 893 951 1235 1678
Components reported defective as rate per active units 10% 10% 9% 8% 10% 7%
Consumer Reports
Cost of 10khw panel system (USD 000's) 125 110 105 95 90 85
Number of homes with more than 1000 sq. ft. roof 45,129 55,891 67,901 75,462 105,087 129,971
Electric Company Solar energy usage
Average purchase rate for solar energy per khw (cents) 70 85 57 87 80 105
% of Total grid energy that is Solar powered 1% 2% 1% 3% 3% 5%
Able Energy Consulting Group copyright 2011

51
SOLAR ENERGY STATISTICS (SOUTHERN USA)
Year 2006 2007 2008 2009 2010
Weather Related
Number of Rainy days 84 83 79 81 77
Number of severe weather (storms) 39 14 37 40 35 Political Support
States with energy rebate programs 3 6 6 7 7
% of voters considered candidates record on environmental issue 12% 13% 15% 17% 20%
Manufacturing Base
Number of panel provider companies 20 22 23 25 27
Number of panel manufacturers 5 5 5 6 7
Cost of photovoltaic cells (key component) 62 50 49 47 45
Energy production capacity 10sq.ft.panel (KwH) 1931 2391 2538 2897 3256
Components reported defective as rate per active units 6% 8% 6% 5% 4%
Consumer Reports
Cost of 10khw panel system (USD 000's) 80 75 70 65 60
Number of homes with more than 1000 sq. ft. roof 145,923 170,798 189,321 190,908 195,133
Electric Company Solar energy usage
Average purchase rate for solar energy per khw (cents) 88 65 81 85 77
% of Total grid energy that is Solar powered 5% 5% 6% 6% 7%
Able Energy Consulting Group copyright 2011

52
6 Big Ben Bank 6.1 Overview The banking group was formed in 2001 under the directorship of Mr. Patel. Mr. Patel gained his wealth as a self-directed fund manager using fundamental asset selection and key insights into the business models of his investments. The initial focus of Mr. Patel’s banking group was finding best in class funds for its high net worth clients. Mr. Patel’s fund management business was formed in 1990 and its success was primarily built within European financial centers. The key growth differentiator in the initial years was primarily an existing network of relationships in Mr. Patel’s fund management business circle. This circle had significant wealth and the Assets Under Management (AUM). The banking group grew quickly. However, the financial crisis presented some unexpected challenges. The AUM fell dramatically and some of the investors experienced hardships in their own businesses. The fund performance was dramatically negative and the subsequent increase in redemptions severely impacted overall AUM and forced a revision in the strategic approach. The executive group following strong direction from the four partners has been asked to re-engineer the business focus away from fund performance towards holistic wealth management and financial planning. As a result, the holding company decided to acquire an insurance group in 2009. Revised strategy Our vision is to be the wealth management solutions provider that defines great client experience by integrating and strengthening our wealth management and insurance offerings and building global platforms for new growth. Our path to differentiation is to deliver a personalized and unique financial planning experience to our clients by building a culture of innovation. Products / Services Since inception the critical profit driver has been the excess of the MER (management expense ratio) charged on the AUM over the operational costs of fulfilling the fund management mandate. Big Ben Bank is a world leader in the ETF market, and has a strong brand and a loyal investor base. But MERs for ETF’s are coming under increased downward pressure as more competitors come into this fund arena.

53
Traditional personal and commercial banking has been a lower but significant component of the revenue pie. The operational model is primarily online rather than physical branches. In particular, the approach was meant to meet the needs of a globally mobile clientele. Fund transfer and foreign exchange transactions were once the majority of transactions but the travelers’ check business is slowing. Transfers and transactions are now dominated by an ultra-high limit VISA card program. Foreign exchange transactions and “best rates” are an attractive feature of the VISA program. Foreign exchange risk exposures are currently managed through a third-party. The banking group currently has no capital markets capabilities. The physical distribution model is almost non-existent and cannot support broad-based banking but expertise exists on emerging technologies and connectivity with a time-critical customer base. Risk Management Big Ben Bank has from the beginning prided itself on a strong risk culture and risk management has proved its worth during the financial crisis. The bank group remains a highly capitalized organization. The product set has previously been admittedly vanilla and the product development approach and policies reflect a strong governance mindset. With a greater focus on innovation-based solutions and wealth management solutions intertwined with the Insurance group, the risk management function will need to evolve and adapt its strengths to a more agile environment. The Executive mindset has been to increase focus on the financial planning sales approach, to leverage the wealth management capabilities within insurance contracts and to formulate a one-stop shopping interface to our globally mobile clientele. The key is still our private club; our brand; our family!! Regulatory Challenges The Basel Committee issued in December 2010 the Basel III rules text, which presents the details of global regulatory standards on bank capital adequacy and liquidity agreed by the Governors and Heads of Supervision, and endorsed by the G20 Leaders at their November 2010 Seoul summit. The rules text presents the details of the Basel III Framework, which covers both micro-prudential and macro-prudential elements. The Framework sets out higher and better-quality capital, better risk coverage, the introduction of a leverage ratio as a backstop to the risk-based requirement, measures to promote the build-up of capital that can be drawn down in periods of stress, and the introduction of two global liquidity standards.

54
Through authorities provided in the Dodd-Frank Act, the Federal Reserve Board (FRB) regulates at the holding company level a number of companies that are primarily life insurers. The Dodd-Frank Act also authorized the FRB to supervise nonbank financial companies designated as systemically important by the Financial Stability Oversight Council (FSOC), some of which may be insurers. In addition, Section 171 (the Collins Amendment) of the Dodd-Frank Act authorizes the FRB to establish capital standards for these insurance companies. The FRB exercised these new authorities on June 7 2012, issuing three proposed rules which collectively implement Basel III capital standards and Section 171 of the Dodd-Frank Act.

55
6.2 Big Ben Bank Exhibits
EXHIBIT 1 Big Ben Bank Financial Data
I. Year End Balance Sheet Percent of Portfolio Assets 2012 Liabilities 2012 Treasury / Agency 40% Deposits 50% Sovereign Treasury (Government X) 50% Borrowed funds 10% Corporate > B+ 10% Equities 40% Total Dollar 7.5 Billion Total Dollar 7.5 Billion II. Liquidity Risk Policy The following data are the 3 liquidity measures the bank had used to monitor their liquidity exposures for the past 5 years. Measure 2008 2009 2010 2011 2012 Liquidity Index (%) 80% 82% 83% 86% 90% Financing Gap ($mm) $1,500mm $1,050mm $1,150mm $800mm -$500mm Net Liquidity ($mm) -$1,250mm -$750mm -$250mm $500mm $1,200mm The bank also has a liquidity crisis plan that outlined the roles and responsibilities of each executive during a liquidity crisis. Furthermore, the plan also defined a mandatory decision-making process and communications that need to take place during the crisis. The plan also defined the criteria to trigger the liquidity crisis plan. These are the only measures or tools the bank used to manage and monitor their liquidity risk up to this point. The bank came out from 2008 financial crisis unscratched. The bank stayed solvent and did not have severe liquidity problem and the executives of the bank are very happy with the performance of the bank after looking at these historical measures and comfortable with the current liquidity risk mitigation policy. III. Investment Limits and triggers Criteria Instructions Limit per issuer Fixed Income Permitted 5% of portfolio MV Real Estates Not Permitted n/a Equities Not Permitted n/a Derivatives Not Permitted n/a FI Category Limit (% of portfolio Market Value) Treasury / Agency 100% Sovereign Treasury 100% Corporate / Credit <= B+ 0% Corporate / Credit > B+ 50%

56
7 Darwin Life Insurance Company 7.1 Background Darwin Life is a mid-size life insurer headquartered in Albuquerque, New Mexico with an increasing presence in the domestic U.S. market. Life sales are distributed primarily through an agency system and annuity sales are distributed primarily through financial institutional channels (e.g., banks and broker-dealers). Darwin has experienced an era of success since embarking on a new strategic direction under new leadership ten years ago, which is tangibly measured by growth in earnings, revenue, and distribution capacity. Recent growth has been fueled by core competencies - distribution relationships and product/service development. Prior to the strategic change, Darwin lacked focus with little to no differentiation, high costs and stagnant sales. Prior management’s view was that the customer was the agent not the policy holders. There was no focus on profitability or growth. Operations lacked discipline with frequent exceptions to administrative and underwriting standards. Products included traditional whole life, level term, and current assumption Universal Life (UL). Although Darwin offered fixed and variable annuities, there was no focus on asset accumulation products, specifically variable annuities, or distribution capacity within the financial institutional markets. Ten years ago, new management shifted strategy to be focused on wealth management and a customer focus targeting middle to upper income individuals, professionals and small business owners with estate planning, tax-deferred accumulation, traditional income preservation and retirement income protection needs. This strategic focus and management’s solid execution through the early 2000’s caught the eye of RPPC Dynasty. RPPC thought Darwin was an attractive property and it became affordable when the market, and financial industry stocks in particular, nose-dived. In hindsight the acquisition was a bargain. At the time there had been much heated debate. Darwin’s focus on wealth management was a great strategic fit with RPPC’s financial division – products, distribution and development. Darwin has had high costs partly due to misaligned resources. Legacy products and systems drained resources. As a result, not enough resources have been devoted to infrastructure or in force management. Resources are devoted to new products and new business and priority placed on customer service and growth in distributions. Dedicated resources to manage in force business have been insufficient. Darwin was slow relative to its peer group in actively managing its spread compression due to low interest rates. Time constraints and lack of expertise in some cutting edge product areas resulted in less-than-effective back end areas including risk mitigation and management operational monitoring and reporting. Greater speed is needed to respond to business problems including risk monitoring and escalation. Operational areas are silo-based resulting in less effective collaboration and cross-functional continuous improvement processes.

57
Darwin is moving towards a disciplined operational focus in underwriting, investments and diversified competitive products. Darwin has solid ratings from every major rating agency – A.M. Best, Standard and Poor’s, Moody’s, Fitch, and Kelly Ratings. 7.2 Product Lines and Distribution Core product segments are universal life, high cash value traditional life and individual variable annuities. Non-core segments include group annuities, individual fixed annuities and term life. Darwin enhanced its universal life products to better suit the consumers' insurance, estate and business planning needs and also introduced UL with secondary guarantees. Darwin has pursued an aggressive organic growth strategy focusing on individual life and individual variable annuities through expanding and enhancing distribution channel and sales growth. Darwin distributes life products primarily through career agents, banks, and direct marketing channels. The traditional agency channel utilizes a variable cost structure with compensation incentives, which promotes strong persistency. Bank-owned life insurance (BOLI) products are marketed through independent marketing organizations that specialize in the BOLI market. In 2008 Darwin expanded annuity distribution into financial institutions. Darwin’s distribution strategy has been to add major new outlets, penetrate existing outlets and to expand the agency distribution by 2-3 regional offices per year. Both the agent and institutional distribution expansions required a significant investment. Agent service remains important. Customer focus creates a change in perspective that is critical in administrative and underwriting practices which translate into consumer value and expected higher profits. A disciplined operation strategy was split into separate operational strategies for pricing, underwriting, investments, financial reporting, claims, reinsurance, technology, corporate governance and risk management. Over the past decade Darwin had become an innovator in service - providing wealth management solutions to individuals - including expertise in design and distribution of tax-sheltered or tax-minimizing strategies such as estate planning and small business owner succession planning. Darwin invested in technology and staff to service both the customer and distribution channels (such as new administrative and reporting platforms), implemented an imaging and automated workflow system, and established a team so that a human answers the phone within 4 rings 95% of the time. This attention on customer focus and attention to service sets them apart from their peer group and supports an aggressive organic growth strategy. Darwin offers a broad array of competitive products with customization for specific distribution channels. Darwin has not pursued a first-to-market strategy but has developed competency to be a fast follower and replicate new product designs in the market. Darwin sometimes lacks the expertise to replicate processes and infrastructure. They have invested heavily in front end distributing, issuing and processing of new business. They have built strong relationships with the

58
agency and institutional distribution channels. Darwin utilizes a variable cost distribution structure and has a growing sales force in geographic breadth and depth. Darwin had tremendous top line growth in its Term, UL and Individual Variable Annuities over the past 5 years. In an industry with flat life sales, Darwin’s life sales grew at a 30% rate. IVA sales for the industry have rebounded since the financial crisis. Darwin had not been a player pre-crisis but since the crisis, IVAs became attractive and reasonable. Pre-crisis companies had aggressively priced products with rich benefits by, in the view of many, taking on too much risk. The crisis resulted in many companies exiting or greatly reducing the benefits. Darwin has taken advantage of the climate by offering modest guarantees for higher fees than were seen pre-crisis. However, distribution has been pushing for incentives that will distinguish Darwin from other IVA writers. Product development has responded over the last few years by greatly extending the guarantee period and offering a great diversity of mutual funds available for all IVA customers (including some unique funds that would be difficult to duplicate if the customers had to invest on their own). 7.3 Financial Analysis Darwin has outperformed the industry over the past 10 years regarding growth in life sales, annuity sales, equity, assets, and distribution capacity. Relative to the industry and similarly rated companies, Darwin unfavorably has higher leverage, lower interest coverage and lower liquidity and favorably has higher return on capital and lower expenses. Relative to its peer group, Darwin has had a lower operating income margin and a lower net income margin, a higher investment yield, a higher expense ratio, higher growth in life insurance inforce, higher growth in equity, and average mortality and persistency. 7.4 The Industry The 55-75 age group has $7 trillion in investable assets and within a decade the 401 (k)/IRA rollover market will exceed $1 trillion per year. The shift from life protection to pre-retirement accumulation to post-retirement income protection and retirement asset management will accelerate. As protection moves from pre-mature death to protection from longevity there are opportunities for companies with product, distribution, and service (trust, process and advice). Variable deferred annuities have transformed from tax-deferred mutual fund investments to guaranteed retirement vehicles. Protection is the differentiator versus other financial services (e.g., 85% of all variable annuity sales have living benefit riders). Successful companies will have well positioned defensible market positions, pricing power, advanced technology and systems to enhance service and process and lower costs, operational efficiencies, experienced management, high-quality financial reporting and corporate governance, strong asset-liability management, investment and risk management, a focused and balanced
59
growth strategy, the ability to innovate products and distribution by partnering with other services (financial planners, estate attorneys, tax experts, and healthcare advisors), and the ability to build customer relationships. 7.5 Investment Policy and Strategy The investment department manages the general account investments. The Chief Investment Officer (CIO) reports to the CFO. Investment policy and strategy is reviewed and approved by an internal management committee consisting of the CEO, CFO, CIO, and SVPs (or VPs) of its major business lines. Internal management committee decisions are subject to review by the board’s investment committee. The internal management committee meets quarterly and is responsible for reviewing investment results and approving the use of new investment instruments. Day-to-day decision-making authority is delegated to the CIO, up to specified limits. The CIO may delegate approval authority to his or her subordinates. Transactions in excess of the CIO’s approval limit require approval by the CEO and CFO. The company’s general account is invested primarily in fixed-income assets. Within the general account, there are separate investment portfolios for each of the main product lines. The corporate surplus (net equity) is allocated proportionally. Individual variable and group annuity investment accounts are held in a separate account (segregated). 7.6 Risk Management Darwin formalized its risk management function with the creation of an ERM Committee in 2007 followed by a new a CRO position and a Risk Management department in 2008. The Committee meets quarterly. The current risk management staff consists of the CRO (Jane Smith), the chief risk management actuary (John Clark), the hedge manager (Tim Jones), and the supporting staff (4 actuaries, 2 CFAs, and 2 CPAs). The purpose of the ERM Committee is to build sustainable competitive advantages by fully integrating risk management into daily business activities and strategic planning. Excerpts from its Charter charge the Committee to: Increase the enterprise’s value through promotion of robust risk management
framework/processes. Align risk preferences, appetite and tolerances with strategy Monitor Darwin‘s overall risk exposure and ensure risks are measured and well-managed. Anticipate risk exposure and recommend action where exposures are deemed excessive or
where opportunities exist for competitive advantages. The Charter also specifies the Committee’s Composition, Authority, Meetings and Responsibilities.

60
Darwin’s risk appetite statement is: I. Capital The probability of a 15 percent loss of Statutory equity in one year is less than
0.5 percent.
II. Earnings The probability of negative GAAP earnings in one year is less than 5 percent.
III. Ratings Maintain an AA financial strength rating. Maintain capital 10% above minimum AA capital requirements. Maintain an A rating on senior unsecured debt.
Risk tolerances are based on estimated impact of quantified risks on statutory capital, since the core mission is policyholder protection. Market risk, credit risk, underwriting risk, operational risk, strategic and liquidity risks are quantified using a variety of metrics to capture multiple perspectives. Credit Risk Darwin only invests in investment grade quality bonds (S&P at or above BBB-). Fixed-income securities in the general account have exposure limits at individual obligor (issuer) and sector levels. Obligor-level limits vary according to asset type and credit quality, as determined by external rating agencies. The investment department monitors compliance of the exposure limits. For each portfolio, there are weighted average credit quality targets. Portfolio credit quality is measured by converting each asset’s external credit rating into a numerical score. Scores are a linear function of credit ratings (AAA = 1, AA = 2, etc.). Sub-category ratings (i.e. + or -) are ignored in the scale. The company prefers to maintain a score below 3.5 for each line of business. Market Risk Semi-annually within each block of business, Darwin measures the effective duration of the assets and liabilities. If the asset and liability durations are further apart than 0.5, the asset portfolio is rebalanced such that its new effective duration equals that of the liabilities. The IVA hedging program uses a semi-static hedge updated for market factors weekly and for in force changes monthly. The key risk measures are the market greeks and Darwin currently hedges delta and rho. The program purchases derivatives so that at least 90% of liability delta and 50% rho are hedged. Existing hedges are not sold if the hedge ratio exceeds these thresholds. Gamma, vega and cross greeks are self-insured due to system complexity, the cost of hedges, the tendency of equity volatility to mean revert and other factors. US GAAP and Statutory reserves, in and of themselves, are not hedged, but it is expected that hedging on economic factors will be sufficient to provide protection on a GAAP and Statutory basis. The hedge program has not yet been integrated into the main legacy system as there is a backlog in getting back-end risk reporting on the system. Currently it is run separately by Tim Jones and his risk management team who develop the necessary assumptions for the hedging models. There has been an effort to integrate the assumption-setting process across product development,

61
financial reporting and risk management, but it is only in the planning stages, as the company culture of silo-based operations has been hard to overcome. The only assumption currently shared across functions is the static policyholder behavior assumption. While hedges are updated weekly, hedge effectiveness, liability attribution, and risk factor calculation are only tested quarterly. Market risk on group annuities with separate accounts and interest rate risk on general account products is currently unhedged. A small portion of the group annuity block has guaranteed minimum death benefits (GMDB) and guaranteed minimum income benefits (GMIB), exposing Darwin to a small amount of unhedged equity risk. However, the risk management team has determined that the capital at risk is within acceptable risk tolerances. Separate account holdings for both IVA and the group annuities are shown in Section 7.8, Exhibit 1. Liquidity Risk The liquidity policy requires Darwin to hold sufficient liquid assets to meet demands for cash in a liquidity crisis. One scenario considers a reputational liquidity crisis where markets continue to operate normally and the liquidity crunch affects only the company. The liquidity stress test anticipates situations where the company’s ability to sell assets to meet cash needs from its liability products is hindered by the market taking advantage of the company during the crisis. Another scenario considers a crisis in which the entire market is not able to sell assets at a reasonable value. Operational Risk The CRO will be responsible for collecting and disseminating risk information. A report will be prepared monthly and distributed to executive management. Risk Management Stress Testing Stochastic testing is supplemented with deterministic scenario-based stress tests, performed annually. Each test is applied as shocks to the model assumptions (for example, mortality, lapse and market assumptions). Interest rates have a floor of 0.10% 7.7 Strategic Considerations ULSG Management accepted a proposal to expand the offering of life insurance products into ULSG (Universal Life w/ Secondary Guarantee), which will appeal to the middle to upper income clientele. Initial effort of product development indicated that the product will produce a 15% IRR, which is above the hurdle rate set by the holding company. The new product design includes

62
general account investments supported by a portfolio of investment grade corporate bonds supplemented by interest derivatives and CDS (credit default swaps) to manage the interest and credit risk. The guaranteed provision is competitively priced using moderate assumptions in the shadow account projections. Product development secured a financial reinsurance agreement to reduce the onerous capital requirement. The newly developed product – ULSG with MVA (market value adjustment) has been modeled using the stochastic models with multiple interest scenarios and dynamic consumer behavior. The result is very promising both in terms of revenue and profit. Product development is now in the process of setting up a comprehensive review from the risk management team’s perspective to investigate the potential risks involved and the magnitude of risk exposures before the product is formally launched. The risk management team will determine if the current model is adequate to capture all the major risk categories and if the additional risk-taking is aligned with corporate risk management strategy and compliant with tolerable risk appetite. Capital Management Darwin does not currently calculate economic capital. Darwin has been working with the consulting firm Consultants R Us (CRS) on capital measurement and management strategies. Under current consideration is a “risk and capital” model that would aid management in gauging the adequacy of overall capitalization of the company and in allocating resultant capital to target lines of business or niche business segments. Darwin wishes to gauge the risk adjusted return on capital (RAROC) by segment to aid in its business planning. In essence, Darwin’s goal is to improve its ability to better manage capital and return. Underlying this goal, CRS advises on three underlying themes: • Capital Productivity • Capital Protection • Capital Adequacy Thought leadership focuses on the notion that there is a trade-off between having enough capital to minimize insurance company failures and having the minimum amount of capital so capital can be deployed. As such, CRS recommended using a risk adjusted return on required capital (RAROC) approach. In essence, this approach considers both how much Darwin is earning on the capital that is committed to the business and how much capital is needed to ensure that policyholders are paid in the event of a stress scenario. CRS argues that RAROC addresses the aforementioned trade-off between capital productivity and capital adequacy. To set a target or requirement for the amount of capital that should be held by an insurance company or group requires a clear vision of the purposes for which capital is held. Effectively defined capital requirements serve several purposes, including, but not limited to: • Providing funds so Darwin is able to honor its obligations during adverse contingent events. • Motivating a company to avoid undesirable levels of risk • Promoting a risk management culture to the extent that capital requirements are a function of actual economic risk

63
Economic capital will be what Darwin requires for ongoing operations and what it must hold in order to gain the necessary confidence of the marketplace, its policyholders, its investors, and its regulatory supervisors. At the same time, the operations of Darwin, after the net effect of all the inherent risks, must yield a rate of return deemed reasonable by the providers of the insurer’s capital.

64
7.8 Darwin Life Exhibits EXHIBIT 1
SEPARATE ACCOUNT HOLDINGS
1a. FIXED INCOME HOLDINGS Group Annuities are invested in the following fixed account portfolio:
Market Value by Key Rate $USD Duration ($Millions)
Total <1 Yr 2 Yr 3 Yr 5 Yr 10 Yr 15 Yr 20 Yr
Treasuries
150.00
150.00
-
-
-
-
-
-
AAA/AA Public Corporates*
100.00
75.00
25.00
-
-
-
-
-
A Public Corporates*
100.00
-
-
-
-
-
100.00
-
BBB Public Corporates*
100.00
-
-
50.00
-
-
50.00
-
High Yield Public Corporates*
150.00
-
-
-
-
-
150.00
-
Govt/Agency MBS Passthroughs
50.00
50.00
-
-
-
-
-
-
High Grade Private Corporate Debt
100.00
-
-
100.00
-
-
-
-
Other Private Debt
250.00
-
-
250.00
-
-
-
-
Total
1,000.00
275.00
25.00
400.00
-
-
300.00
- *Of the above public corporates, 70% are callable.

65
The IVA block is invested in the following fixed account portfolio:
Market Value by Key Rate $USD Duration ($Millions)
Total <1 Yr 2 Yr 3 Yr 5 Yr 10 Yr 15 Yr 20 Yr
Treasuries
187.50
187.50
-
-
-
-
-
-
AAA/AA Public Corporates*
125.00
93.75
31.25
-
-
-
-
-
A Public Corporates*
125.00
-
-
-
-
-
125.00
-
BBB Public Corporates*
125.00
-
-
62.50
-
-
62.50
-
High Yield Public Corporates*
187.50
-
-
-
-
-
187.50
-
Govt/Agency MBS Passthroughs
62.50
62.50
-
-
-
-
-
-
High Grade Private Corporate Debt
125.00
-
-
125.00
-
-
-
-
Other Private Debt
312.50
-
-
312.50
-
-
-
-
Total
1,250.00
343.75
31.25
500.00
-
-
375.00
- *Of the above public corporates, 70% are callable.

66
1b. EQUITY HOLDINGS
IVA Group Annuities
Balanced Fund
15.00 325.00
Bond Fund
25.00 675.00
Emerging Markets
25.00 -
Environmentally Responsible
75.00 55.00
Finance Sector
5.00 -
International
245.00 365.00
Latin America
15.00 -
Money Market
5.00 40.00
Real Estate Sector
10.00 -
Socially Responsible
65.00 45.00
Technology Sector
25.00 -
US Growth Fund
145.00 175.00
US Large Cap
1,645.00 1,110.00
US Mid Cap
450.00 585.00
US Small Cap
530.00 465.00
US Value Fund
95.00 235.00
Total
3,375.00 4,075.00