Spring 2013 Student Performance Analysis - Virginia ... solving systems of two linear equations in...
51
Spring 2013 Student Performance Analysis Algebra I Standards of Learning Presentation may be paused and resumed using the arrow keys or the mouse.
Transcript of Spring 2013 Student Performance Analysis - Virginia ... solving systems of two linear equations in...

Spring 2013 Student Performance Analysis
Algebra I
Standards of Learning
Presentation may be paused and resumed
using the arrow keys or the mouse.

SOL A.1 The student will represent verbal quantitative situations algebraically and evaluate these expressions for given replacement values of the variables.
Representing and Evaluating Expressions
2

Students need additional practice translating expressions.
Select each phrase that verbally translates this algebraic expression:
Suggested Practice for SOL A.1
One fourth times the cube root of x less five. One fourth times the cube root of x less than five. Five subtract one fourth times the cube root of x. Five less than one fourth times the cube root of x.
3

Students need additional practice evaluating expressions with cube roots, square roots, and the square of a number, particularly when the replacement variable has a negative value.
Evaluate the following expressions:
a.
b.
c.
Suggested Practice for SOL A.1
4

Students need additional practice evaluating expressions that contain an absolute value.
Evaluate the following expressions:
a.
b.
Suggested Practice for SOL A.1
5

SOL A.2
The student will perform operations on polynomials, including
a) applying the laws of exponents to perform operations on expressions;
b) adding, subtracting, multiplying, and dividing polynomials; and
c) factoring completely first- and second-degree binomials and trinomials in one or two variables. Graphing calculators will be used as a tool for factoring and for confirming algebraic factorizations.
Performing Operations on Polynomials
6

Students need additional practice applying the laws of exponents to simplify expressions.
Simplify:
a. b.
c. d.
Suggested Practice for SOL A.2a
7
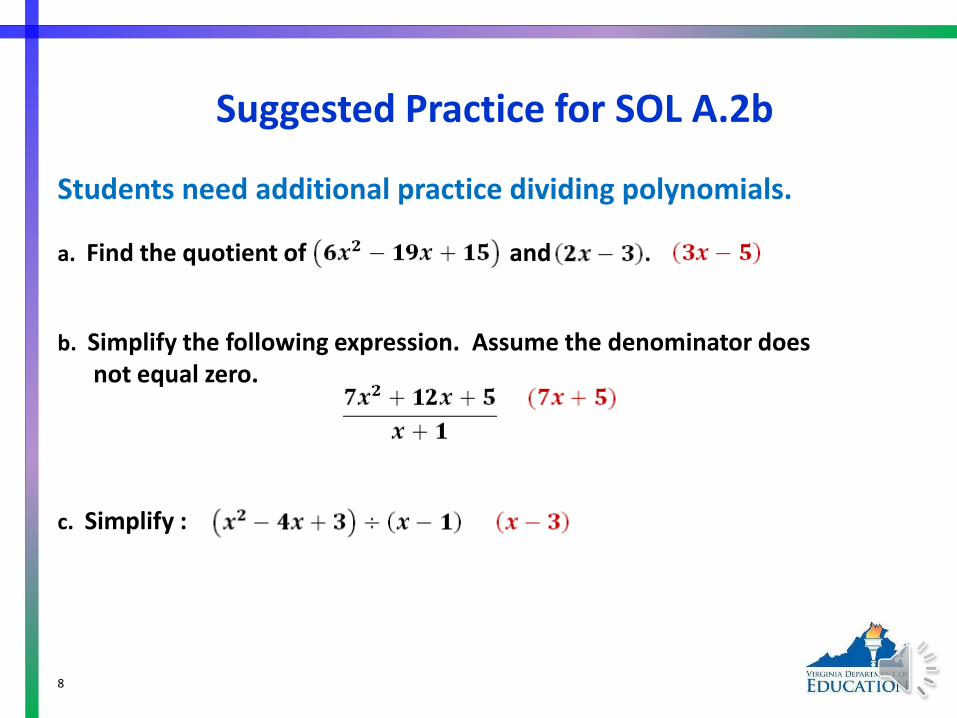
Students need additional practice dividing polynomials.
Suggested Practice for SOL A.2b
a. Find the quotient of and .
b. Simplify the following expression. Assume the denominator does not equal zero.
c. Simplify :
8

Students need additional practice completely factoring polynomials, particularly when there is a greatest common factor.
Identify all of the factors of when it is completely factored.
Suggested Practice for SOL A.2c
9

Suggested Practice for SOL A.2c
Students need additional practice using the x-intercepts from the graphical representation of the polynomial to determine and confirm its factors. Using two of the factors shown, create a possible equation for the graphed relation.
10
SOL A.3
The student will express the square roots and cube roots of
whole numbers and the square root of a monomial algebraic
expression in simplest radical form.
Express Square Roots and Cube Roots in Simplest Radical Form
11

Students need additional practice simplifying the square root of a monomial algebraic expression.
Suggested Practice for SOL A.3
Write each expression in simplest radical form. a. b. c.
12

SOL A.4 The student will solve multistep linear and quadratic equations
in two variables, including
a) solving literal equations (formulas) for a given variable;
b) justifying steps used in simplifying expressions and solving equations, using field properties and axioms of equality that are valid for the set of real numbers and its subsets;
c) solving quadratic equations algebraically and graphically;
d) solving multistep linear equations algebraically and graphically;
e) solving systems of two linear equations in two variables algebraically and graphically; and
f) solving real-world problems involving equations and systems of equations.
Graphing calculators will be used both as a primary tool in solving problems and to
verify algebraic solutions.
Solving Linear and Quadratic Equations
13

Students need additional practice solving literal equations.
The formula for the surface area (S) of a triangular prism is
where h is the height of the prism, p is the perimeter of the base, and B is the area of the base. Solve the equation for the given variable:
a. Solve for h:
b. Solve for B:
Suggested Practice for SOL A.4a
14
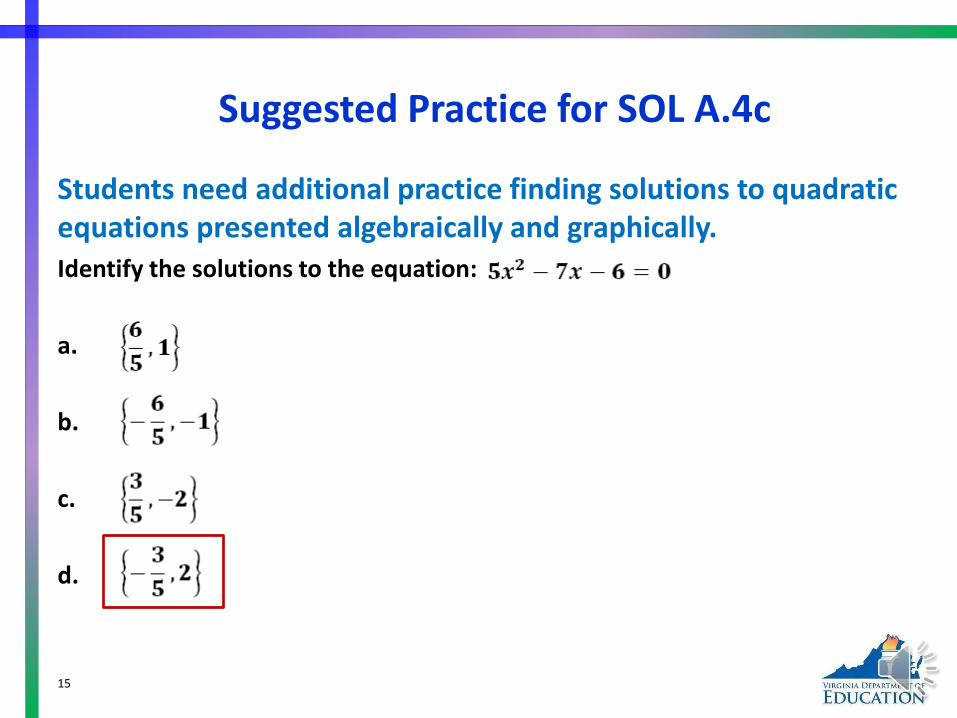
Students need additional practice finding solutions to quadratic equations presented algebraically and graphically. Identify the solutions to the equation:
a.
b.
c.
d.
Suggested Practice for SOL A.4c
15

The graph of is shown.
Plot the solutions to .
Suggested Practice for SOL A.4c
16

Students need additional practice describing solutions to equations that have the following solutions: x=0, an infinite number of real solutions, and no real solutions.
Describe the solution to each equation.
a.
b.
c.
Suggested Practice for SOL A.4d
An infinite number of real solutions
No real solutions
x=0
17

Students need additional practice finding solutions to systems of equations presented algebraically.
1. Which system of equations has no real solution?
a. b.
c. d.
2. What is x-value of the solution to this system of equations?
Suggested Practice for SOL A.4e
x=6
18
SOL A.5
The student will solve multistep linear inequalities in two
variables, including
a) solving multistep linear inequalities algebraically and graphically;
b) justifying steps used in solving inequalities, using axioms of inequality and properties of order that are valid for the set of real numbers and its subsets;
c) solving real-world problems involving inequalities; and
d) solving systems of inequalities.
Solving Multi-Step Inequalities and Systems of Inequalities
19

Students need additional practice solving multistep inequalities.
An inequality is solved as shown.
Between which two steps is an
error made? Explain the error.
Suggested Practice for SOL A.5a
The -3 was not distributed properly to the second term.
20
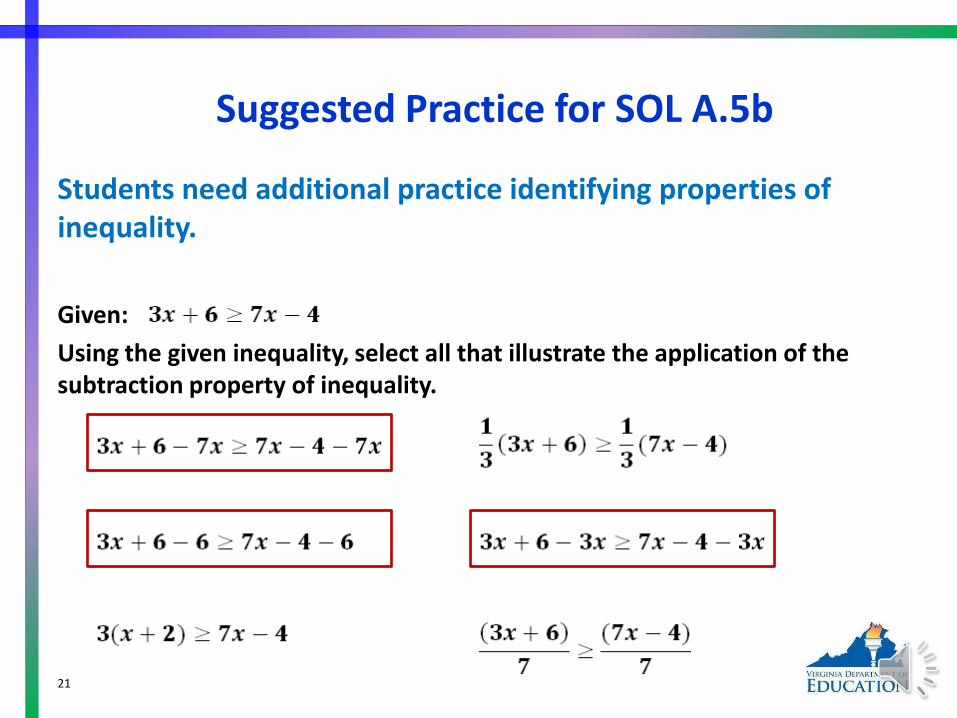
Students need additional practice identifying properties of inequality.
Given:
Using the given inequality, select all that illustrate the application of the subtraction property of inequality.
Suggested Practice for SOL A.5b
21
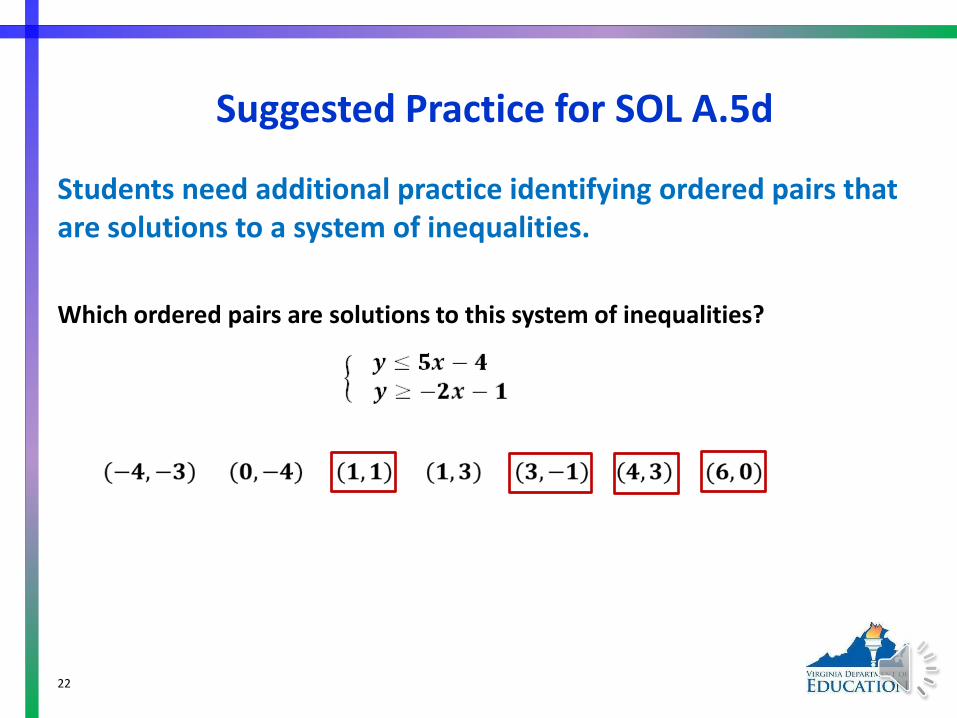
Students need additional practice identifying ordered pairs that are solutions to a system of inequalities.
Which ordered pairs are solutions to this system of inequalities?
Suggested Practice for SOL A.5d
22
SOL A.6
The student will graph linear equations and linear inequalities
in two variables, including
a) determining the slope of a line when given an equation of the line, the graph of the line, or two points on the line. Slope will be described as rate of change and will be positive, negative, zero, or undefined; and
b) writing the equation of a line when given the graph of the line, two points on the line, or the slope and a point on the line.
Determining Slope of a Line
23

Students need additional practice finding slope.
Find the slope, m, of the line represented by the given equation.
a.
b.
c.
Suggested Practice for SOL A.6a
24

Students need additional practice finding slope.
a. Find the slope of the line passing through the points (6,3) and (4,2).
b. Find the slope of the line passing through the point (5,1) with an
x-intercept of 4.
Suggested Practice for SOL A.6a
25

Given:
a. What is the slope of the line represented by this equation?
b. What is the y-intercept of the line represented by this equation (SOL A.7)?
c. Graph the line represented by this equation.
Suggested Practice for SOL A.6
(0,5)
26
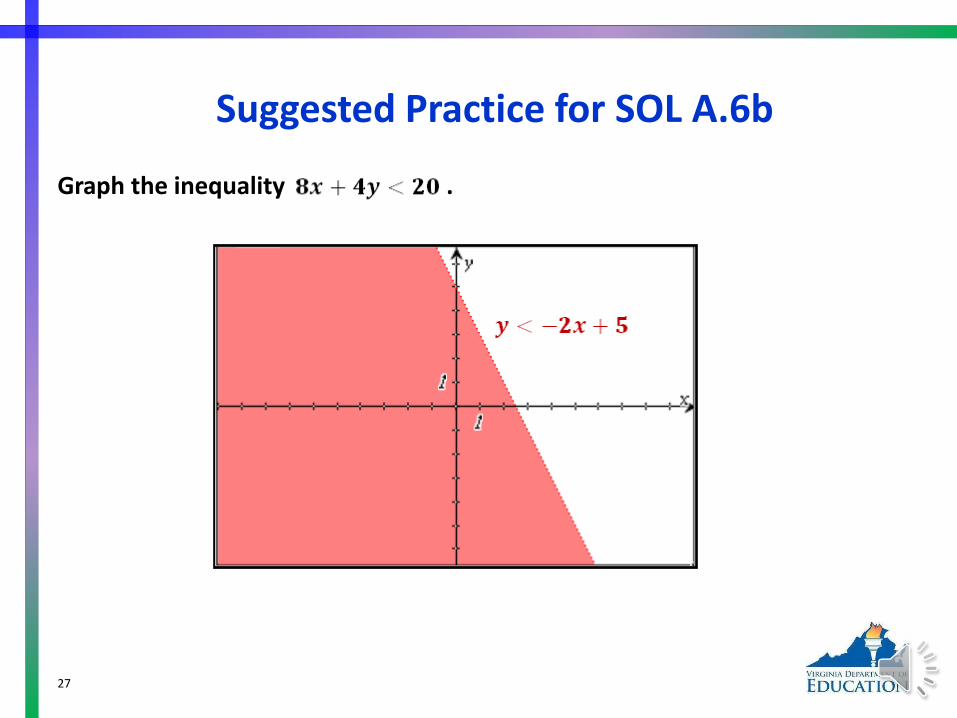
Graph the inequality .
Suggested Practice for SOL A.6b
27

SOL A.7 The student will investigate and analyze function (linear and quadratic) families and their characteristics both algebraically and graphically, including
a) determining whether a relation is a function;
b) domain and range;
c) zeros of a function;
d) x- and y-intercepts;
e) finding the values of a function for elements in its domain; and
f) making connections between and among multiple representations of
g) functions including concrete, verbal, numeric, graphic, and algebraic.
Investigating and Analyzing Functions
28

Students need additional practice identifying the domain and range from a graph.
Suggested Practice for SOL A.7b
What appears to be the range of the relation shown? a. b. c. d.
29

Suggested Practice for SOL A.7b
What appears to be the domain of the relation shown? a. All real numbers greater than -1
b. All real numbers greater than 2
c. All real numbers less than 10
d. All real numbers
30

Students need additional practice finding zeros of linear functions. Graph each function and then plot a point at the location of the zero. a. b. c.
Suggested Practice for SOL A.7c
a b
c
31

Students need additional practice finding zeros of quadratic functions presented algebraically.
Suggested Practice for SOL A.7c
a. What are the zeros of the function ?
b. What are the zeros of the function ?
32
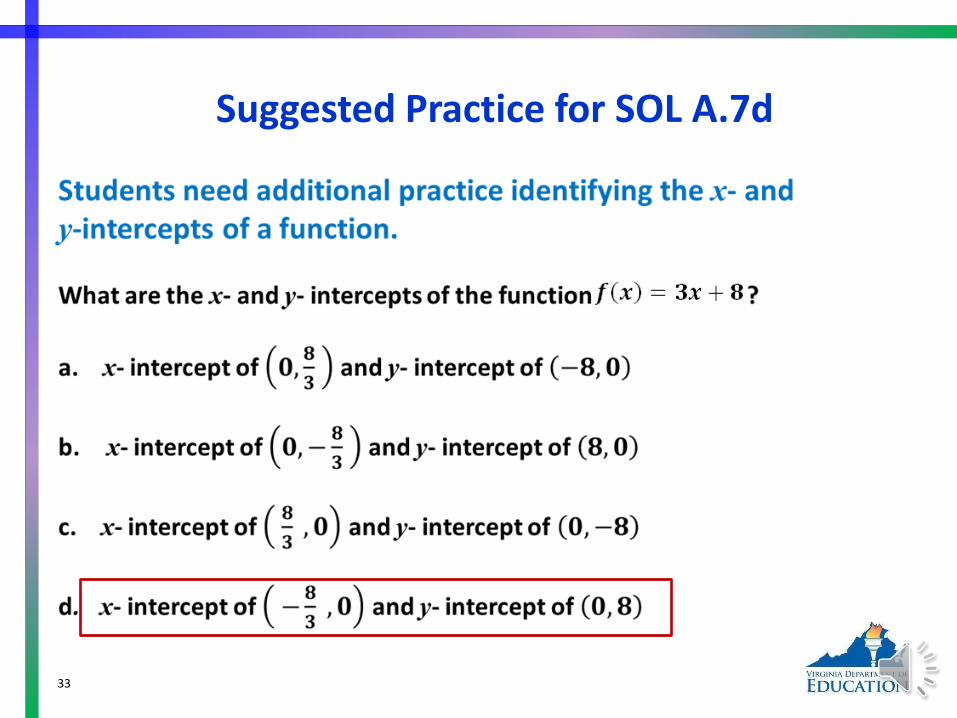
Suggested Practice for SOL A.7d
33

Plot the x- and y-intercepts of the relation shown on the graph.
Suggested Practice for SOL A.7d
The x-intercepts are located at (-2,0) and (6,0) and the y-intercept is located at (0,-3).
34

SOL A.8 The student, given a situation, will analyze a relation to determine whether a direct or inverse variation exists, and represent a direct variation algebraically and graphically and an inverse variation algebraically.
Analyzing Direct and Inverse Variations
35

Suggested Practice for SOL A.8
Students need additional practice selecting ordered pairs from a list to make a relation that is a direct or inverse variation. Given this set of ordered pairs:
a. Select three points that will create a direct variation relation.
b. Select three points that will create an inverse variation relation.
36

Students need additional practice identifying a direct variation equation algebraically and graphically. Identify the equations that represent a direct variation.
Suggested Practice for SOL A.8
37

Identify the graph of a direct variation.
Suggested Practice for SOL A.8
38

SOL A.9 The student, given a set of data, will interpret variation in real-world contexts and calculate and interpret mean absolute deviation, standard deviation, and z-scores.
Interpret Standard Deviation and Z-Scores
39

Students need additional practice performing calculations with statistical information.
a. A data set has a mean of 55 and a standard deviation of 3.5. The z-score for a data point is -1.2. What is the data point?
b. A data set has a standard deviation of 3. The element 16 is an element of a data set, with a z-score of 2.4. What is the mean of the data set?
Suggested Practice for SOL A.9
50.8
8.8
40

Students need additional practice performing calculations with statistical information.
The number of minutes book club students read on Monday night is displayed by the graph. The mean number of minutes for this data set is 21.18, and the standard deviation of the data set is 6.5. The z-score for the data point representing the number of minutes Tim read is 1.25. In which interval does this data point lie?
Suggested Practice for SOL A.9
The interval 25 to 30 minutes. 41
SOL A.10 The student will compare and contrast multiple univariate data sets, using box-and-whisker plots.
Analyzing Box-and-Whisker Plots
42
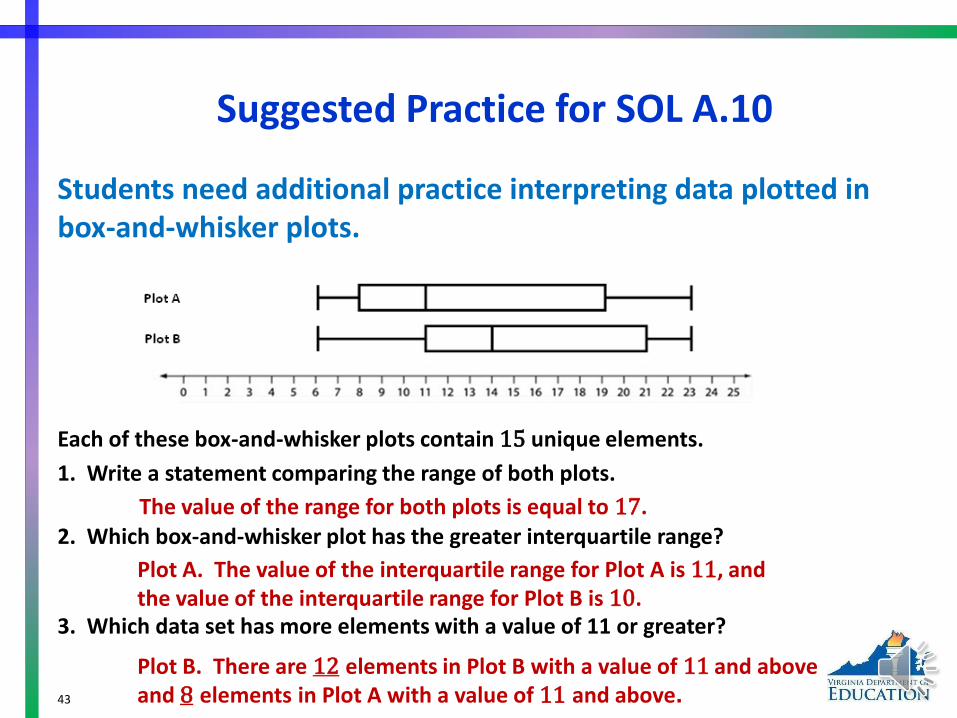
Students need additional practice interpreting data plotted in box-and-whisker plots.
Each of these box-and-whisker plots contain 15 unique elements.
1. Write a statement comparing the range of both plots.
2. Which box-and-whisker plot has the greater interquartile range?
Suggested Practice for SOL A.10
The value of the range for both plots is equal to 17.
Plot A. The value of the interquartile range for Plot A is 11, and the value of the interquartile range for Plot B is 10.
3. Which data set has more elements with a value of 11 or greater?
Plot B. There are 12 elements in Plot B with a value of 11 and above and 8 elements in Plot A with a value of 11 and above. 43

• Plot A represents the total number of songs downloaded by each of 15 students in Mr. Archer’s class during October. Each student in Mr. Archer’s class downloaded a different number of songs from the others. • Plot B represents the total number of songs downloaded by each of 20 students in Mrs. Baker’s class during October. Each student In Mrs. Baker’s class downloaded a different number of songs from the others.
During the month of October, what is the difference between the number of students who downloaded more than 6 songs in Mrs. Baker’s class and the number of students who downloaded more than 6 songs in Mr. Archer’s class?
Suggested Practice for SOL A.10
The difference is 4. There were 15 students who downloaded more than 6 songs in Mrs. Baker’s class, and 11 students who downloaded more than 6 songs in Mr. Archer’s class.
44

Suggested Practice for SOL A.10
This box-and-whisker plot summarizes the number of pieces of pizza each of ten volunteers served at a concession stand one night.
Another volunteer served 16 pieces of pizza that night, and 16 is added to the original data set. A new box-and-whisker plot is drawn. Which two statements comparing the new box-and-whisker plot to the original box-and-whisker plot must be true? The interquartile range of the box-and-whisker plot increases. The range of the box-and-whisker plot increases. The value of the upper extreme increases. The value of the median increases.
45
SOL A.11 The student will collect and analyze data, determine the equation of the curve of best fit in order to make predictions, and solve real-world problems, using mathematical models. Mathematical models will include linear and quadratic functions.
Using the Curve of Best Fit
46

Students need additional practice making predictions using the
linear or quadratic curve of best fit.
This set of ordered pairs shows a relationship between x and y.
a. What is the equation for the quadratic curve of best fit for this set of data?
b. Predict the value of y when x = 8.
Suggested Practice for SOL A.11
200
47

This table shows the value, v, of an account at the end of m months. There was an initial deposit of $50 and no other deposits were made.
If the value of the account continues to increase in the same way, predict the value of the account at the end of 13 months. Use the quadratic curve of best fit to make the prediction.
Suggested Practice for SOL A.11
m,
time in months
v,
value in dollars
0 50
1 129
3 299
5 485
7 687
9 905
48
$1,389.00

The data in the table shows the average United States farm size, in acres, for the years 2000-2007.
Average Farm Size
Using the line of best fit for the data shown in the table, what is the best prediction of the average farm size in the year 2014?
a. 437 acres b. 441 acres c. 447 acres d. 463 acres
Suggested Practice for SOL A.11
Year Average Acres
Per Farm
2000 434
2001 437
2002 436
2003 441
2004 443
2005 444
2006 446
2007 449
49

This concludes the student performance information for the spring 2013 Algebra I SOL test. Additionally, test preparation practice items for Algebra I can be found on the Virginia Department of Education Web site at:
http://www.doe.virginia.gov/testing/sol/practice_items/index.shtml#math
Practice Items
50

For assessment questions, please contact [email protected]
For instruction questions, please contact
Contact Information
51