Spring 2007 For information about citing these materials ... · •Education: Influence hygiene ......
93
MIT OpenCourseWare http://ocw.mit.edu 11.479J / 1.851J Water and Sanitation Infrastructure in Developing Countries Spring 2007 For information about citing these materials or our Terms of Use, visit: http://ocw.mit.edu/terms.
-
Upload
dangkhuong -
Category
Documents
-
view
216 -
download
3
Transcript of Spring 2007 For information about citing these materials ... · •Education: Influence hygiene ......

MIT OpenCourseWare http://ocw.mit.edu
11.479J / 1.851J Water and Sanitation Infrastructure in Developing CountriesSpring 2007
For information about citing these materials or our Terms of Use, visit: http://ocw.mit.edu/terms.
Household Water Treatment and Safe Storage Technologies
Susan Murcott Week 7, 11.479J / 1.851J
March 20, 2007

For more than a decade during the late 80s and 1990s, I worked with Prof. Emeritus Donald Harleman on innovative and low-cost wastewater treatment for the developing world
MIT Master of Engineering
Teams in Brazil
1999, 2000

In 1998, I was an invited guest speaker to the 2nd International Women and Water Conference, Kathmandu, Nepal

I learned about the need for safe and accessible water from these Nepali village women
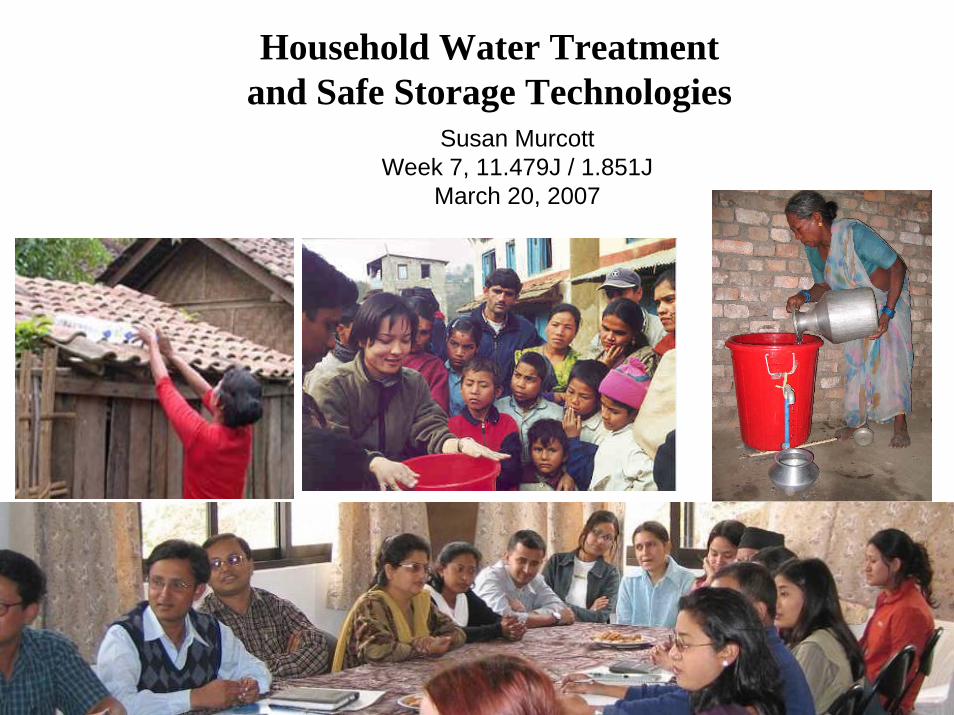
Since 1998, about 20 MIT Since 1998, about 20 MIT student teams have done student teams have done engineering thesis and engineering thesis and MBA projects on household MBA projects on household drinking water treatment drinking water treatment and safe storage (HWTS) and safe storage (HWTS)
Our Group
• Put group photohere

We call this We call this initiativeinitiative
H2OH2O--1B1B
Clean Water Clean Water for 1 Billion for 1 Billion
PeoplePeople

StudentStudent’’s work is primarily s work is primarily fieldfield--based engineering based engineering researchresearch
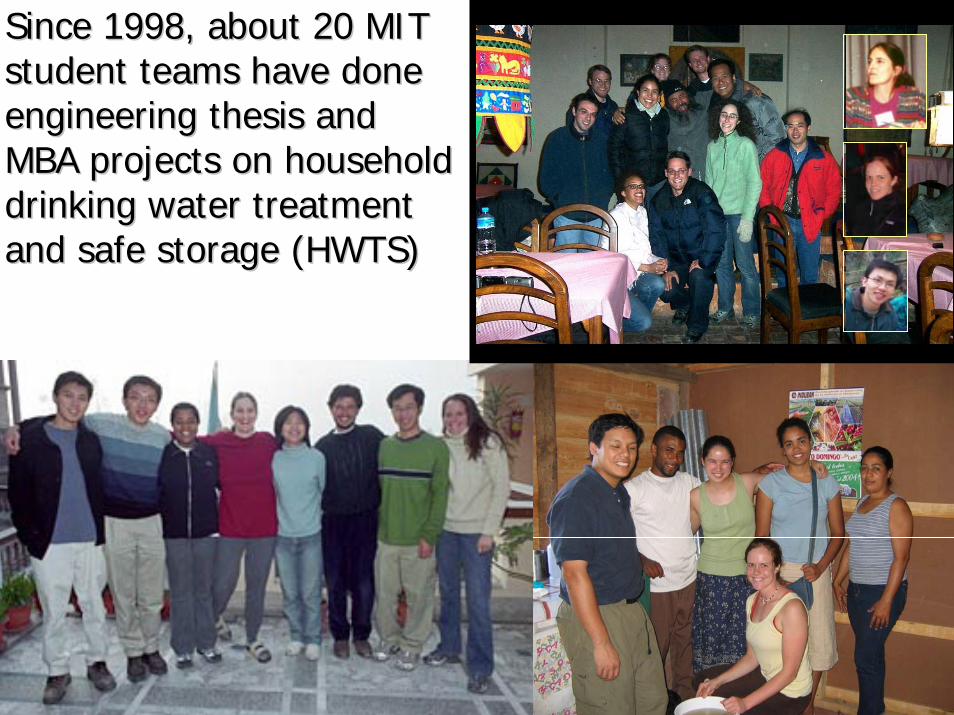
We have worked with We have worked with NGOs, municipal NGOs, municipal governments, research governments, research labs and development labs and development organizationsorganizations
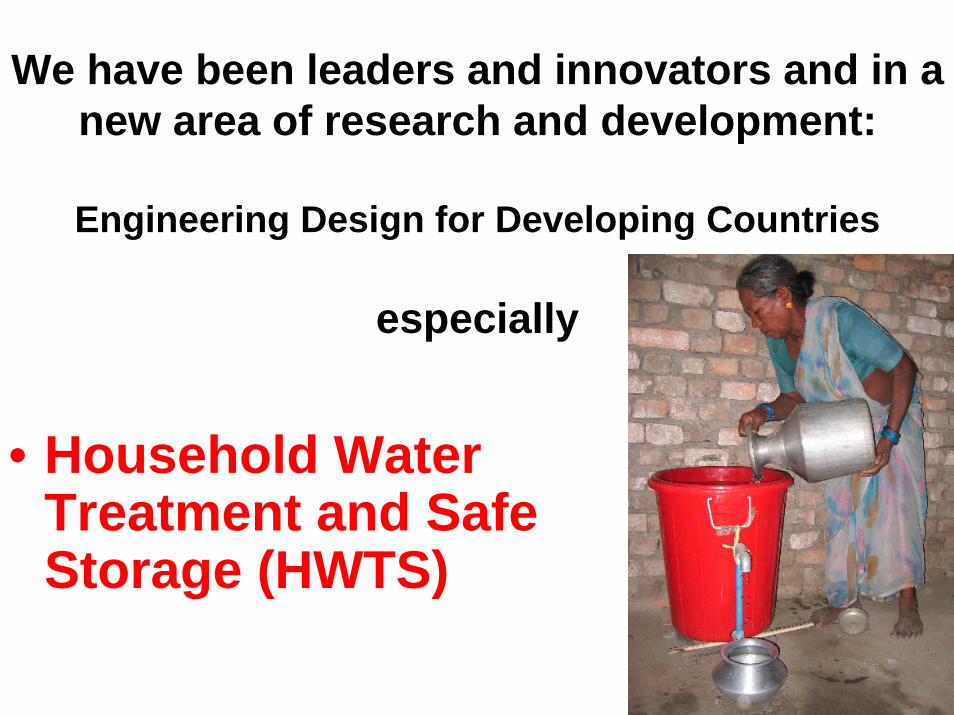
We have been leaders and innovators and in a new area of research and development:
Engineering Design for Developing Countries
especially
• Household Water Treatment and Safe Storage (HWTS)

We have produced a body of material on household water treatment
and safe storage:
Theses, group reports, term papers, PowerPoint presentations, videos, articles,
peer-reviewed publicationsand a Web Site:
• http://web.mit.edu/watsan

Do HWTS Technologies Detract from Ultimate Goal of Universal
Piped Water Provision?

Multiple Barrier Approach: A Watershed Systems-based Approach
to Water Safety• "Securing the microbial safety of drinking water
supplies is based on the use of multiple barriers, from catchment to consumer, to prevent the contamination of drinking water and to reduce contamination to levels not injurious to health. Safety is increased if multiple barriers are in place, including protection of water resources, proper selection and operation of a series of treatment steps and management of distribution systems (piped or otherwise)."
(WHO, GDWQ, 2004)
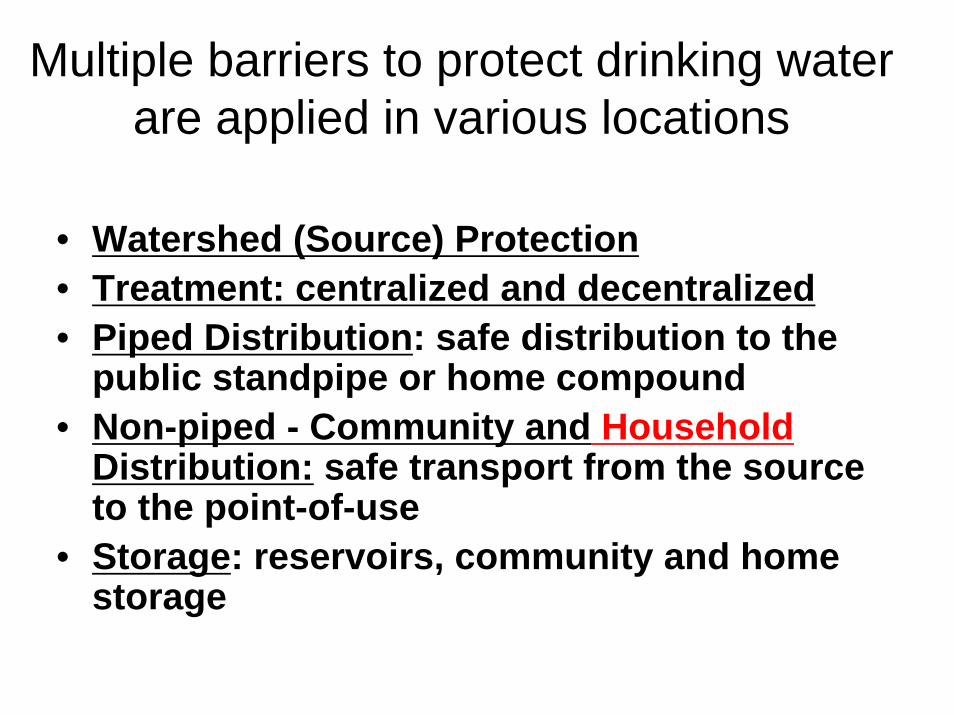
Multiple barriers to protect drinking water are applied in various locations
• Watershed (Source) Protection• Treatment: centralized and decentralized• Piped Distribution: safe distribution to the
public standpipe or home compound• Non-piped - Community and Household
Distribution: safe transport from the source to the point-of-use
• Storage: reservoirs, community and home storage

HWTS Technologies

Examples of Household Safe Storage and Water Treatment Processes and Systems• I. Safe Storage• 1. Plastic or modified clay pot safe storage containers
• II. Disinfection• 2. Boiling• 3. Household chlorination• 4. SODIS and UV disinfection
• III. Particle Removal Technologies• 5. Cloth Filtration• 6. Ceramic Filters
– Candle Filters– Pot Filters
• 7. Biosand Filters• 8. Coagulation/Precipitation Only
• IV. Membrane / Reverse Osmosis• 9. Membrane, Reverse Osmosis, Ultrafiltration, Nanofiltration
• V Combined Systems • 10. Coagulation/Precipitation + Chlorine Disinfection (e.g. PUR) • 11. Filtration + Disinfection + Aesthetics (Hindustan Lever, Pure-it)
• VI. Chemical Removal Systems (not covered in this presentation)

CDC Safe Storage Vessel Characteristics
• Standardized volume (10 - 30 liters), with handles shaped to facilitate transport and use.
• Durable, easy-to-clean material.• Inlet diameter between 6 and 9 cm• Durable spout or spigot allowing a
discharge rate of 1 liter per 15 seconds at outlet.
• Instructions for use, cleaning container and disinfecting its contents permanently attached to vessel.

Disinfection

Household Chlorination• Household Chlorination
using locally produced and distributed chlorine solution.
•Safe Water Storage in plastic containers with narrow mouths, secure lids and dispensing spigots to prevent recontamination.
•Education: Influence hygiene behaviors and increase awareness about the dangers of contaminated water and waterborne disease.
The The ““Safe Water SystemSafe Water System”” ApproachApproach

Safe Water System Products

Pros and Cons of Household Chlorination / “Safe Water System” Approach
• PROS• Applied properly and
with a water that is not excessively turbid, this provides a safe, disinfected water supply
• Residual chlorine is simply measured
• Clinically proven• Inexpensive
• CONS• Chlorine taste and smell• Some customers only use
it sporadically, like “medicine” or just for their young children
• Must wait 30 minutes before drinking treated water
• Chlorine availability• Storage issues
Cost = about $7 to $10 per family per yearCost = about $7 to $10 per family per year

Solar Disinfection
(SODIS)
Image removed due to copyright restrictions.

What is SODIS?• PET plastic bottles exposed to
solar radiation for 1-2 days to disinfect drinking water
• Variations:– Exposure time– Clear, black or reflective
surface

SODIS
• SODIS was invented by Prof. A. Acra et al. of American University of Beirut, Lebanon in 1982.
• Researchers at the Swiss Federal Institute of Environmental Science and Technology (ETH-EAWAG/SANDEC) took up extensive studies of SODIS beginning in 1991.
• MIT students have investigated SODIS in Nepal and Haiti since 1999.


Pros and Cons of Solar Disinfection
• PROS• Scientifically proven• Highly effective
against a wide range of microbial contaminants
• PET plastic bottles widely available
• CONS• User acceptance and
sustained behavior change?
• Weather dependency• Must expose bottles
1 day for safe water• Users in hot climates
may reject hot water Cost = about $1 per family per year

UV Lamp Disinfection
Photographs removed due to copyright restrictions.
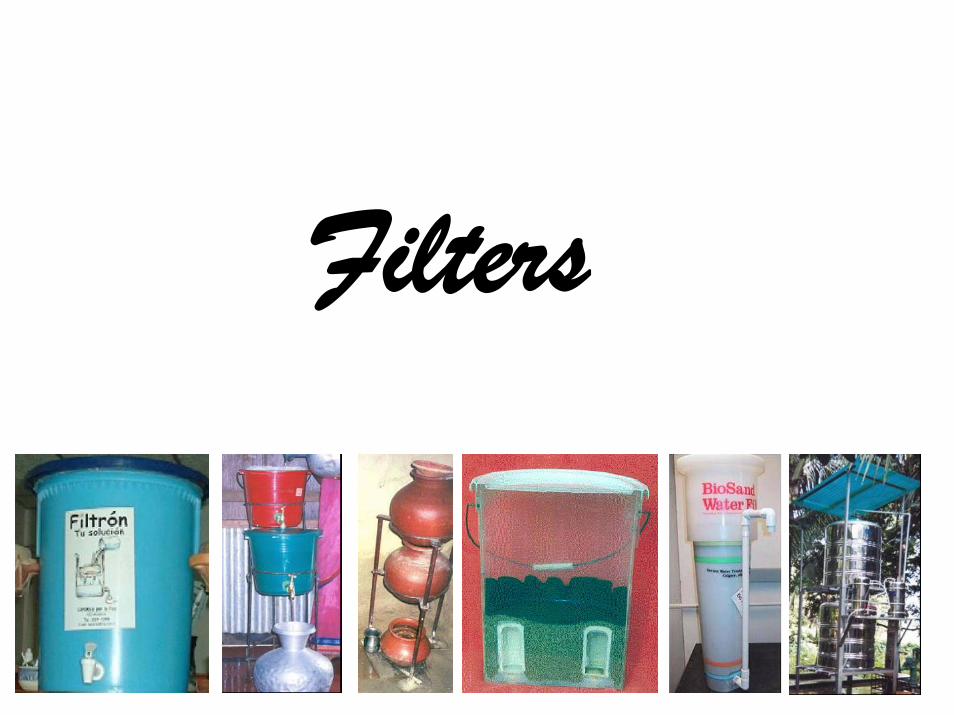
Filters
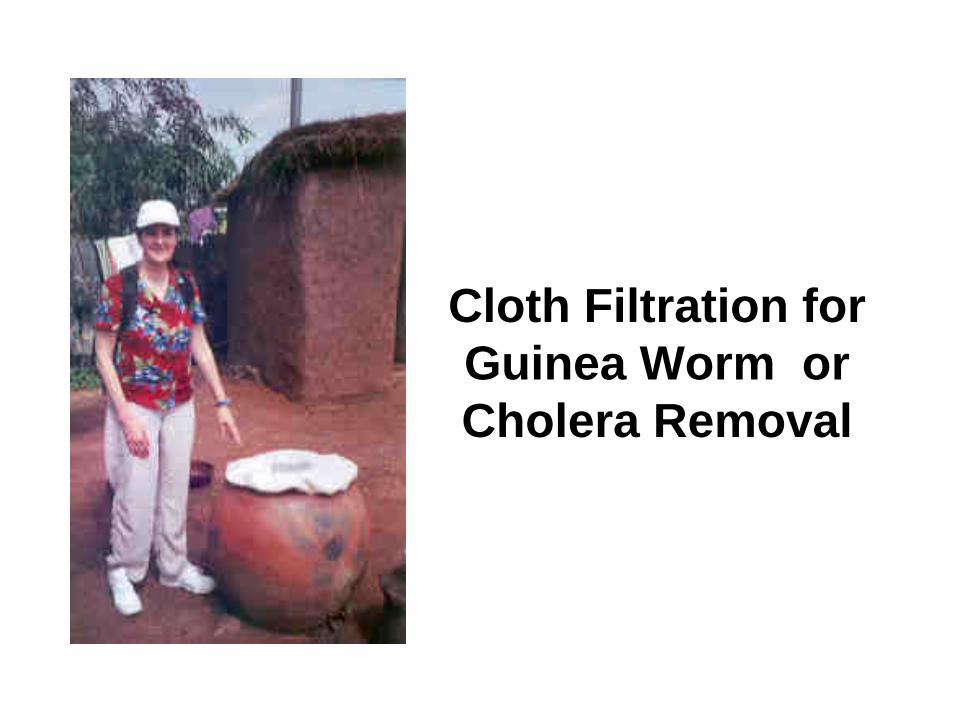
Cloth Filtration for Guinea Worm or Cholera Removal

Pros and Cons of Cloth Filters
• PROS
• Effective at removal of guinea worm
• Simple and readily available
• CONS• Must be kept clean so
as not to be a source of other microbial contamination
• Does not address other possible contaminants of concern
Cost = $0.10 – 1.00

Ceramic Filters
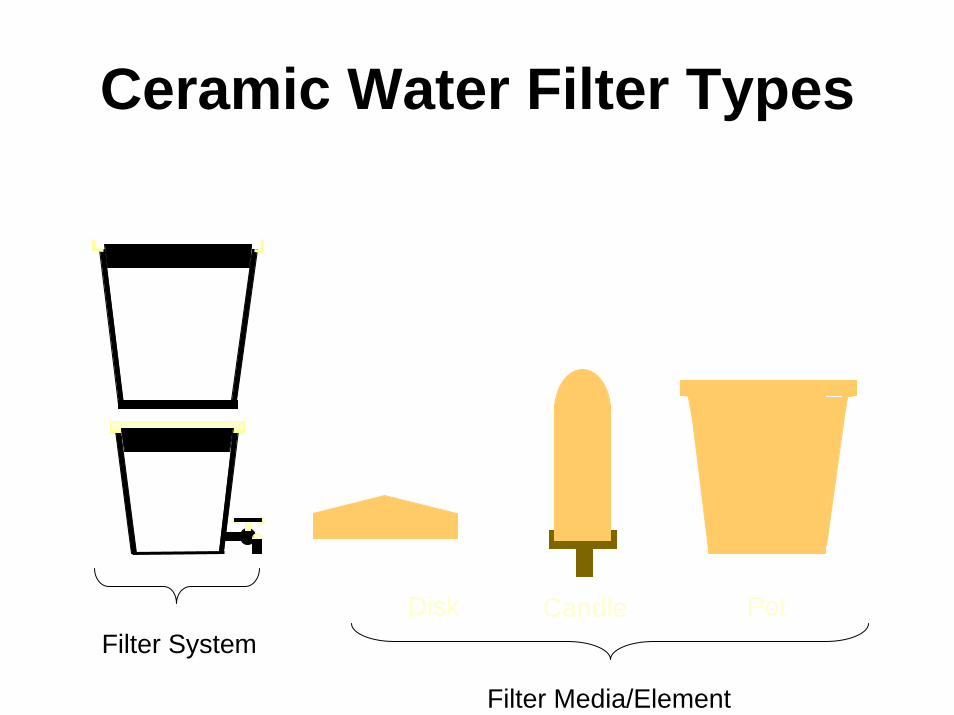
Ceramic Water Filter Types
Disk Candle Pot
Filter Media/Element
Filter System
Pros and Cons of Ceramic Filters
• PROS• About 90 – 99% removal
of bacteria• Can be constructed of
local materials (clay, sand, concrete, plastic) by local producers and create local jobs
• CONS• Requires regular cleaning
once filter becomes clogged
• Flow rates are slow and may not provide sufficient water quantity
• Ceramics can break if handled improperly
Cost = about $5 Cost = about $5 -- $40$40

Biosand Filters
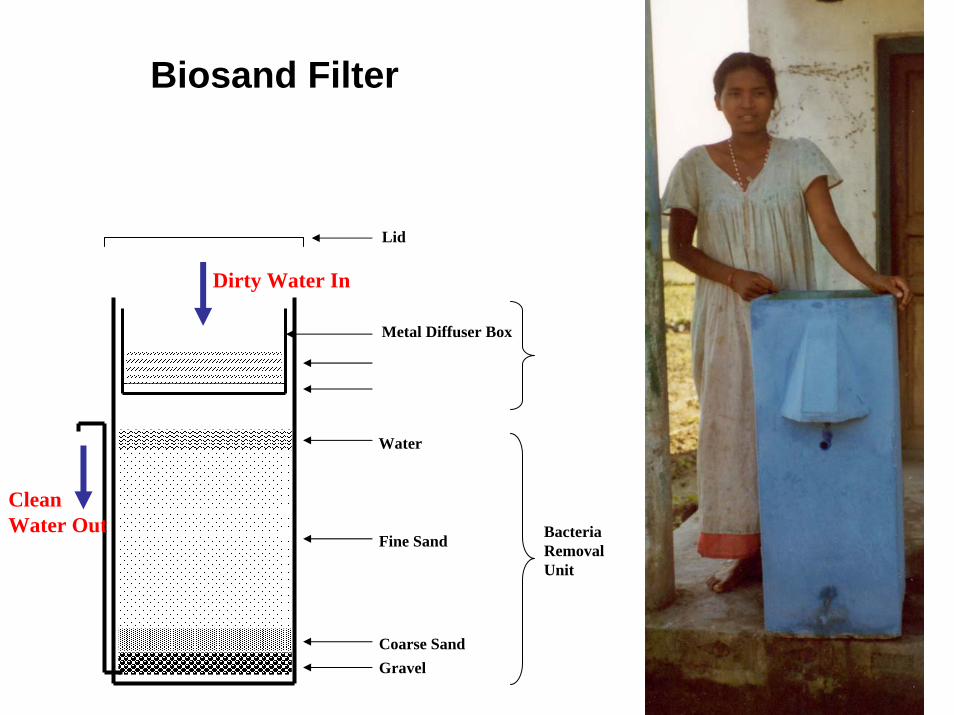
Biosand Filter
Gravel
Fine Sand
Coarse Sand
Water
Metal Diffuser Box
Lid
Bacteria Removal Unit
Dirty Water In
Clean Water Out

Pros and Cons of Biosand Filters
• PROS• About 90 – 99% removal
of bacteria• Can be constructed of
local materials (clay, sand, concrete, plastic) by local producers
• Can create local jobs• High flow rate compared
to many other household systems
• Extremely durable
• CONS• Requires proper
maintenance• Does not provide safe
water protection in the first 1-2 weeks of use, while the biological layer develops
• Must be properly maintained by cleaning about once per month
• Does not provide safe water directly after regular cleaning
Cost = about $15 - $75 depending on size and materials

Coagulation

Jar Testing of Coagulants – a standard approach using a flocculator is shown
Photo: Frederick Chagnon, 2003)

Manual Coagulation (with Alum)
5 g 7.5 ml
500 ml
Applying 40 mg/l dose
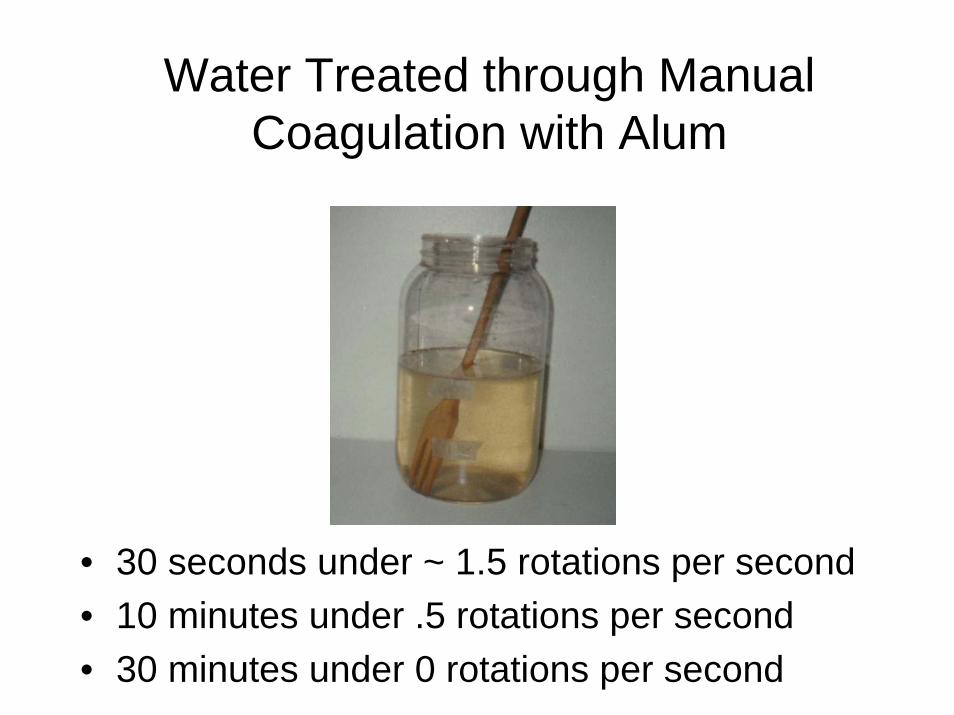
• 30 seconds under ~ 1.5 rotations per second• 10 minutes under .5 rotations per second• 30 minutes under 0 rotations per second
Water Treated through Manual Coagulation with Alum

Water Treated through Manual Coagulation with Alum
Settling Time
0 min
Raw Water Settling Time
30 minCoagulation
Regime

Membrane Processes

Membrane & Reverse Osmosis
•Many types of membranes exist: micro-filtration, electrodialysis, ultra-filtration, nanofiltration
•Membranes are able to reject or select passage of certain dissolved species
•Reverse Osmosis is a pressure-driven process that retains ions and passes water. Pressure exceeds the osmotic pressure of the salts against a semi-permeable membrane, forcing pure water through and leaving salts behind
•RO is commonly used in the water industry for desalination or treating brackish water
•Membranes can also remove particulates, color, trihalomethanes, and some inorganics(hardness)

TTY QUAN (Beijing, China)
# Type Cost Cost US$RMB
1 Polypropylene 20 2
2 GAC 30 3
3 Carbon Block 30 3
4 Softener 80 8
5 R/O
6 Volcanic Minerals
7 GAC
Retail Cost = RMB 2,980 (US$300)
Image removed due to copyright restrictions.

Combined Treatments

Coagulation-Disinfection ProductPROSPROS
Combines turbidity removal with microbial disinfectionMeasurable chlorine residualSimple to useVisually impressive improvement in water clarity. Clinically proven
CONSComparatively expensiveCustomers use it sporadically as “medicine” and/or only for young childrenIssues with user acceptance Available in limited number of countries
Cost = about $0.05/sachet or Cost = about $0.05/sachet or about $80/year per family about $80/year per family depending on usedepending on use
Image removed due to copyright restrictions.

Drinking Water SamplesDam Spring Lake Treated
Turbidity (NTU)
1850 55 37 1

Some HWTS Cost Data
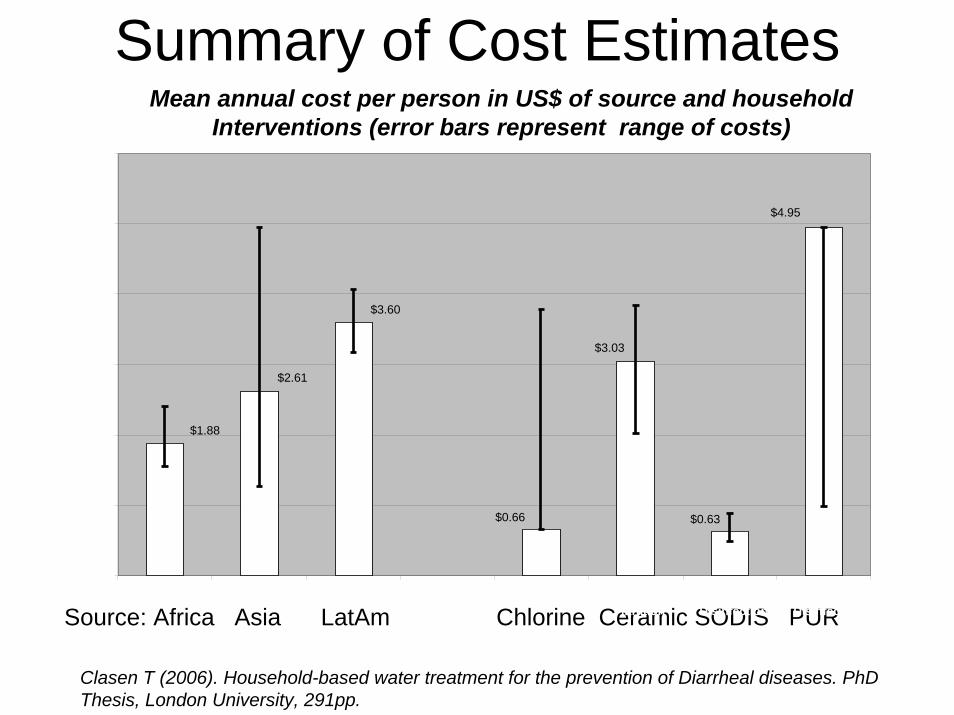
Summary of Cost EstimatesMean annual cost per person in US$ of source and household
Interventions (error bars represent range of costs)
Clasen T (2006). Household-based water treatment for the prevention of Diarrheal diseases. PhD Thesis, London University, 291pp.
Source: Africa Asia LatAm Chlorine Ceramic SODIS PUR
$0.66
$1.88
$2.61
$3.60
$3.03
$0.63
$4.95
$-
$1.00
$2.00
$3.00
$4.00
$5.00
$6.00
Source-Africa Source-Asia Source-LA&C Chlorination CeramicFiltration
SolarDisinfection
Flocculation-Disinfection
System
Cos
t

Retail Prices of HWTS in Ghana HWTS Systems US$
1. Safe Storage -Modified Clay Pot w/ 1/2 “brass tap (40L)
$8
2. Safe Storage - plastic vessel w/tap (50 L) $83. Ceramic Pot Filter $124. Nnsupa Candle Filter $255. Biosand Filter w/ KanchanTM style plastic bucket (50 L)
$14
6. SODIS ≈$1/year7. Household Chlorination8. PUR
≈$4/year5¢/sachet

Status of HWTS Implementation

Summary Statistics on HWTS Mapping
• 36 respondents from implementing organizations to date representing > ½ of the Network’s 70+ members
• 52 countries with HWTS projects • 9 HWTS technologies

Implementation Organization Survey• Current Version: 1
• Length: 4 pages
• Target: HWTS Implementation Organizations
• Time Required: 30 Minutes
• http://www.who.int/household_water/implementation/en/
Image removed due to copyright restrictions.

HWTS Survey Responses -Organization Types
34 Organizations
InternationalOrg
29%
Academic Institution
5%
Other7%
NGO37%
Private Sector-Commercial
15%
Public Sector-Gov’t7%

Survey Responses – Focus of Activities
Focus of HWTS activities (34 organizations)
26
15 17
7
17 1711 9
5
05
1015202530
OtG
Impl
emen
tatio
n Adv
ocac
y
Edu
c-Tr
aini
ng
Fund
ing
Res
earc
h
Prod
uctD
evel
Info
Exch
ange
Supp
lier-
Tech
Mat
Che
m
Oth
er

Additional Components of Program
Additional Components of Program/Enterprise (34 Organizations)
9
29
20
7
8
4
4
0 5 10 15 20 25 30 35
ImpStorageVessel
EducationHWTS
HygieneInstr
SanitationInterv
WaterSupplyInterv
RainwaterHarvest
Other

Method of Implementation
Method of Implementation (34 Organizations)
9
17
22
16
14
12
0 5 10 15 20 25
PublicSector
Voluntary-Charitable
SocialMktg
CommMobilization
TrainingOtherOrgs
Commercial
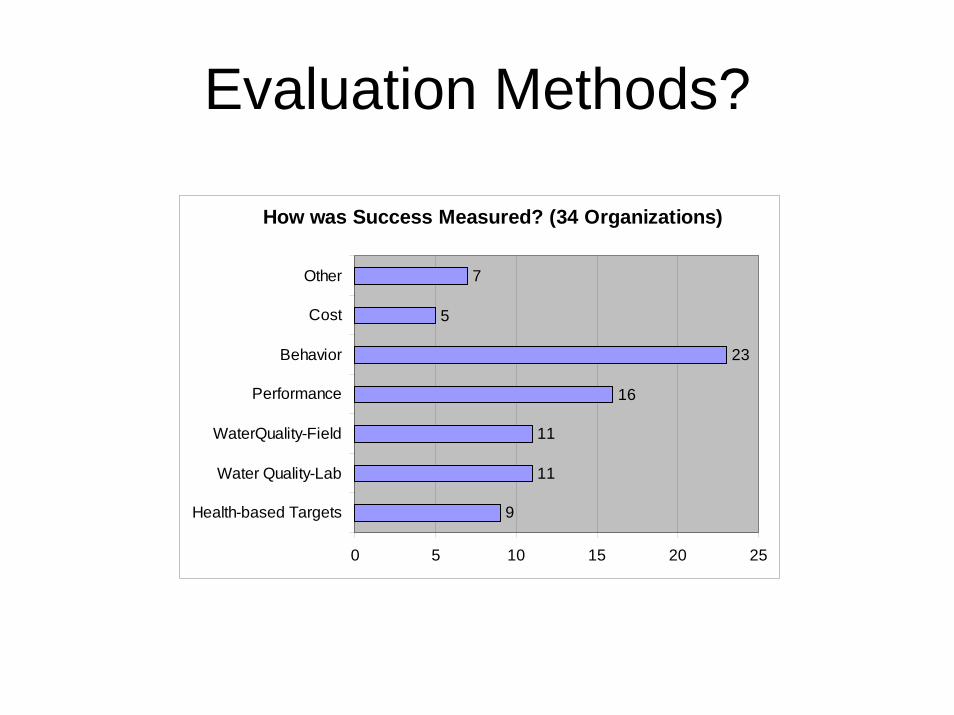
Evaluation Methods?
How was Success Measured? (34 Organizations)
9
11
11
16
23
5
7
0 5 10 15 20 25
Health-based Targets
Water Quality-Lab
WaterQuality-Field
Performance
Behavior
Cost
Other


16 Safe Storage Countries
• Afghanistan• Burkina Faso• Guyana• Haiti• India• Kenya• Madagascar• Malawi
• Mozambique• Myanmar• Nigeria• Rwanda• Uganda• United Republic of
Tanzania• Uzbekistan• Zambia


8 Boiling Countries
• Bolivia• Brazil• Ecuador• El Salvador• Guatemala• Honduras• Nicaragua• Zambia
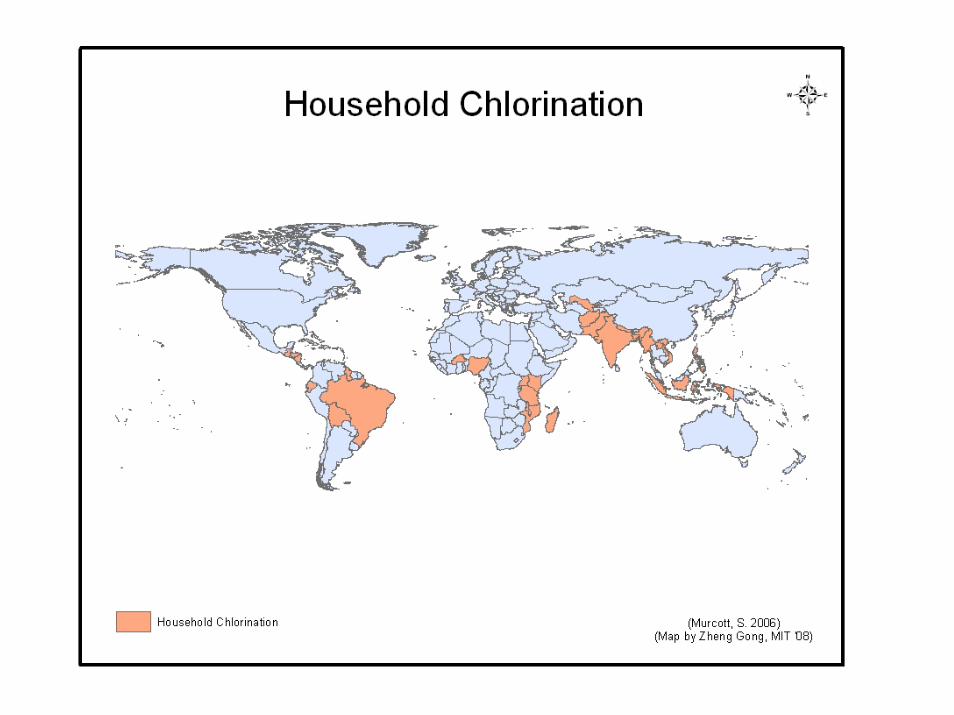

29 Household Chlorination Countries
• Afghanistan,• Bangladesh, • Bolivia, • Brazil, • Burkina Faso,• Ecuador, • El Salvador,• Guatemala, • Guyana, • Haiti, • Honduras, • India, • Indonesia,
• Kenya,• Lao• Madagascar,• Malawi, • Mozambique,• Myanmar, • Nepal, • Nigeria, • Pakistan, • Philippines, • Rwanda, • Tanzania, • Uganda, • Uzbekistan, • Vietnam

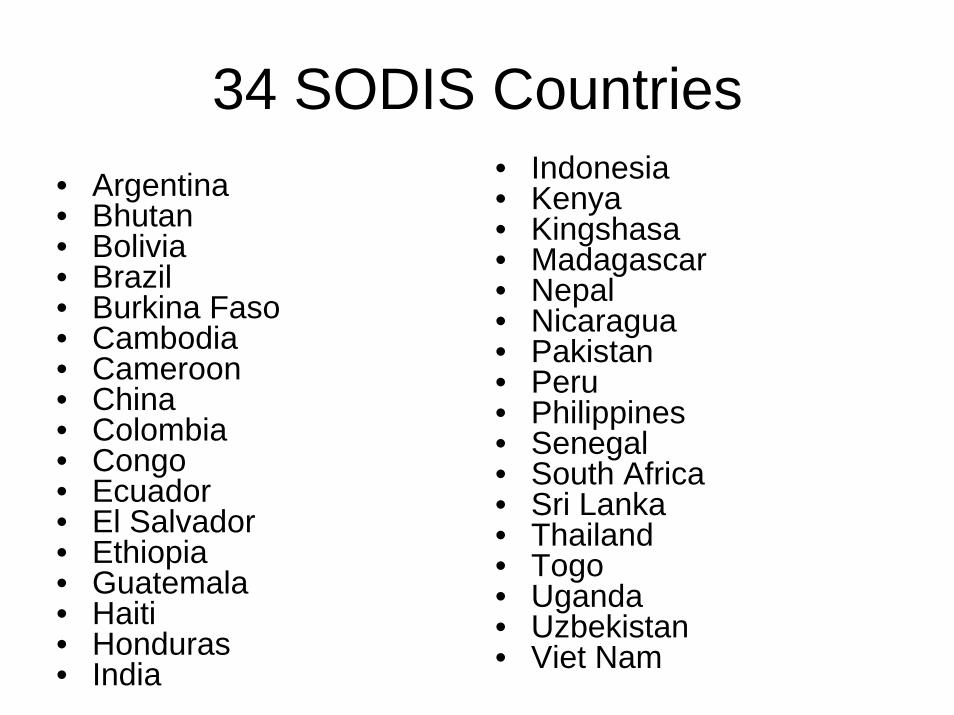
34 SODIS Countries• Argentina• Bhutan• Bolivia• Brazil• Burkina Faso• Cambodia• Cameroon• China• Colombia• Congo• Ecuador• El Salvador• Ethiopia• Guatemala• Haiti• Honduras• India
• Indonesia• Kenya• Kingshasa• Madagascar• Nepal• Nicaragua• Pakistan• Peru• Philippines• Senegal• South Africa• Sri Lanka• Thailand• Togo• Uganda• Uzbekistan• Viet Nam


8 Ceramic Pot Countries
• Cambodia• Ecuador• Ghana• India• Nepal• Nicaragua• Thailand• Vietnam


20 Ceramic Candle Filter Countries
• Bolivia• Brazil• Cambodia• China• Colombia• Dominican Republic• Guatemala• Guyana• Haiti• India
• Japan• Korea• Peru• Sierra Leone• South Africa• Sri Lanka• Switzerland• United Kingdom• United States• Zimbabwe
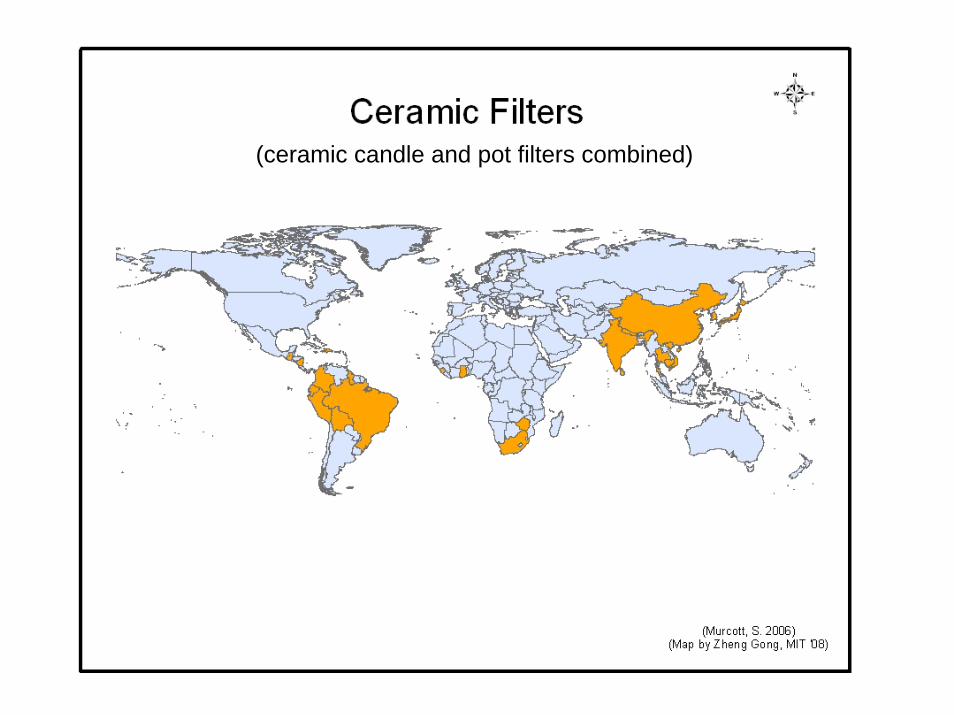
(ceramic candle and pot filters combined)

23 Ceramic Filter Countries –All Types
• Bolivia• Brazil• Cambodia• China• Colombia• Dominican Republic• Ecuador• Ghana• Guatemala• Guyana• Haiti• India
• Japan• Korea• Nepal• Nicaragua• Peru• Sierra Leone• South Africa• Sri Lanka• Thailand, • Vietnam• Zimbabwe


25 Biosand Filter Countries
• Brazil,• Cambodia,• Dominican Republic• Ecuador, • El Salvador,• Ethiopia, • Ghana, • Guatemala, • Haiti, • Honduras, • India, • Indonesia
• Kenya, • Lao PDR,• Madagascar,• Mexico,• Mozambique, • Nepal, • Nicaragua, • Nigeria, • Pakistan, • Peru, • Tanzania, • Uganda, • Vietnam
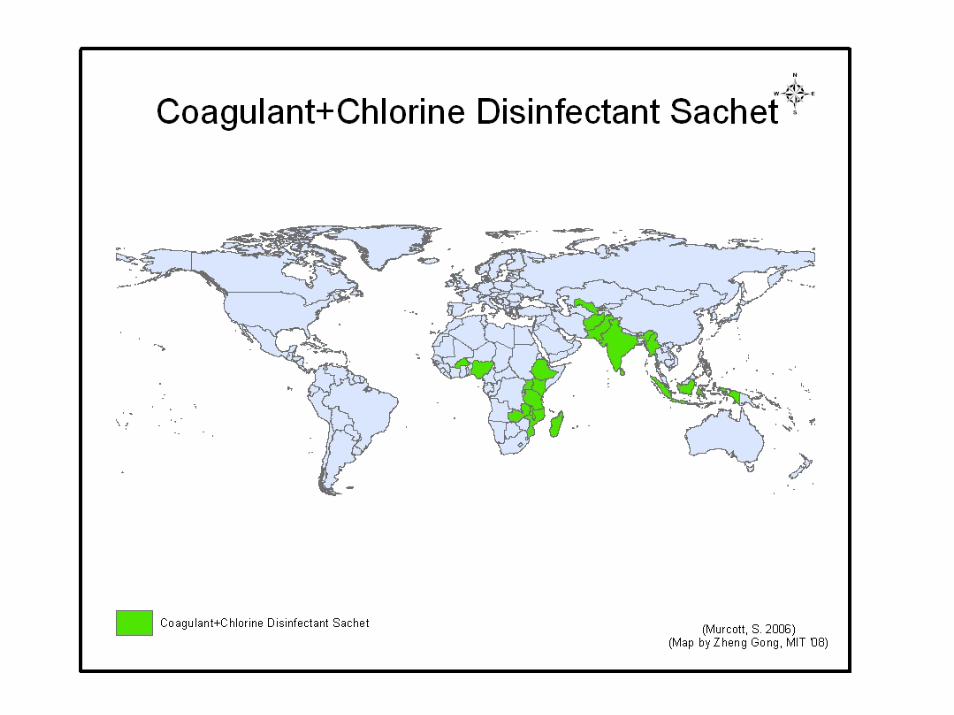

19 Coagulation + Chlorine Disinfection Sachet Countries
• Afghanistan• Burkina Faso• Ethiopia• Haiti• India• Indonesia• Kenya• Madagascar• Malawi• Mozambique
• Myanmar• Nigeria• Pakistan• Rwanda• Sri Lanka• Uganda• United Republic of
Tanzania• Uzbekistan• Zambia

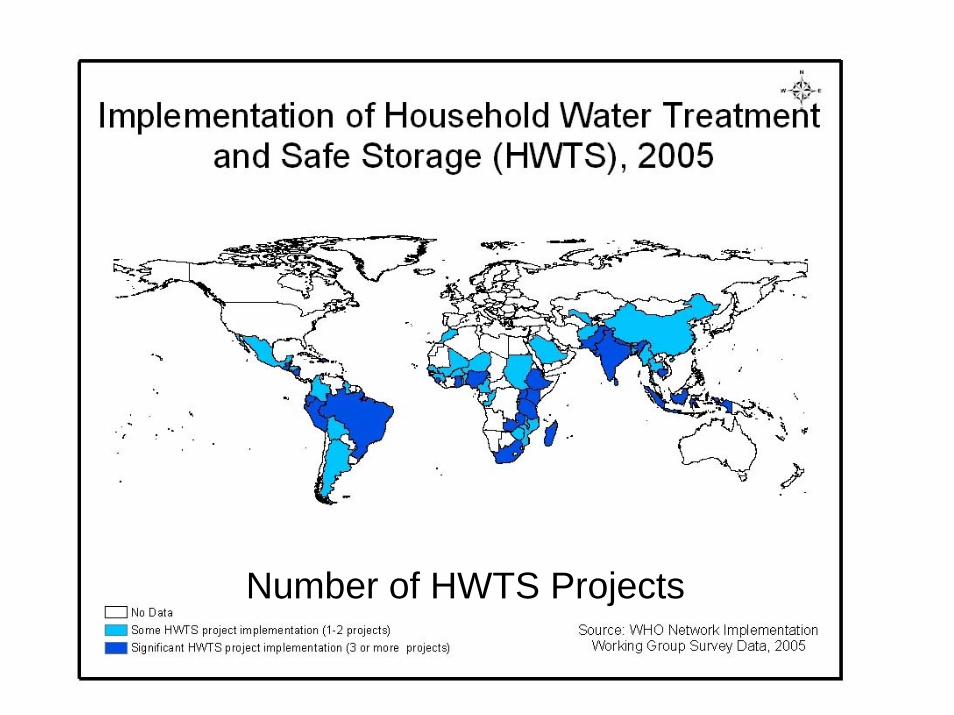
Number of HWTS Projects


EXCERPT Daily and Long-Term Behavioral
and “Sustained Use” Targets in Implementing, Scaling up, Monitoring and Evaluating
Household Water Treatment and Safe Storage Technologies
Susan MurcottMassachusetts Institute of Technology
Civil and Environmental Engineering DepartmentQuito Ecuador
October 5, 2005

Definitions – Targets or “Meta-indicators” of Household Drinking
Water Treatment and Safe Storage (HWTS) Behavior
• Daily Behavioral HWTS Targets: Short-term, day-to-day behaviors related to household drinking water treatment and safe storage activities. These targets/indicators are focused on “behavior in the present.”
• Long-Term Behavioral HWTS Targets = “Extent of Coverage/Use/Sustained Use” = Long-term behaviors (month/months, year/years) related to household drinking water treatment and safe storage activities. These targets/indicators are focused on “behavior over time.”

Monitoring Daily Behavioral Targets
Based on discussions at a lunch meeting at WHO Network Bangkok Conference
(Maria Elena Figueroa, June 2005)

Consistent Water TreatmentDefinition Measurement Data Source(i) Household has treated
water for drinking every day. Treatment may or may not occur every day. Frequency of treatment will depend on type of technology used and number of household members
(ii) All members in the household drink this treated water.
From total households in the implementation area get all 3 measurements if time and resources allow:
(i) Number of households that report having treated water for drinking in the house.
(ii) Number of households that show treated water in the house.
(iii) Number of households with a negative test for E.Coli in their treated water, OR positive test for chlorine residual among those using household chlorination
Household-based data; preferably population-based survey.
Data will include:(i) self-reported information; (ii) direct observation at
end of survey(iii) tests for water safety

Safe StorageDefinition Measurement Data Source4 scenarios are:(i) Household stores water in
a narrow-mouth container. It is covered with a hard cap or lid, not a cloth (cloth can get into water re-contaminating it) w/tap.
(ii) Household has a wide-mouth container that has a hard cover with a tap.
(iii) Household uses a jerry can with tap and tap is of hard material
(iv) Household stores water in SODIS bottle or covered water filter that has a tap
From total households in study area:
Number of households that have any of the 4 possible scenarios of safe water storage
Household-based data; preferably population-based survey.
Data will include:(i) self-reported
information; (ii) direct
observation at end of survey

Proper Management (serving water)Definition Measurement Data Source(i) Ideal scenario:Water is served directly
from the container without the use of a ladle or cup that is introduced into the water;
(ii) Less ideal scenario:Water is served using a
dedicated ladle or a cup with a handle that is stored in a fixed place out of reach of children and covered from dust and hands.
From total households in study area:
(i) Number of households that serve water directly from the container without using any device to draw water from the container;
(ii) Number of households that serve water using a ladle or a cup with a handle without touching the water, AND ladle or cup is stored in a fixed place out of reach of children and covered from dust and hands.
Household-based data; preferably population-based survey.
Data will include:direct observation
at end of survey
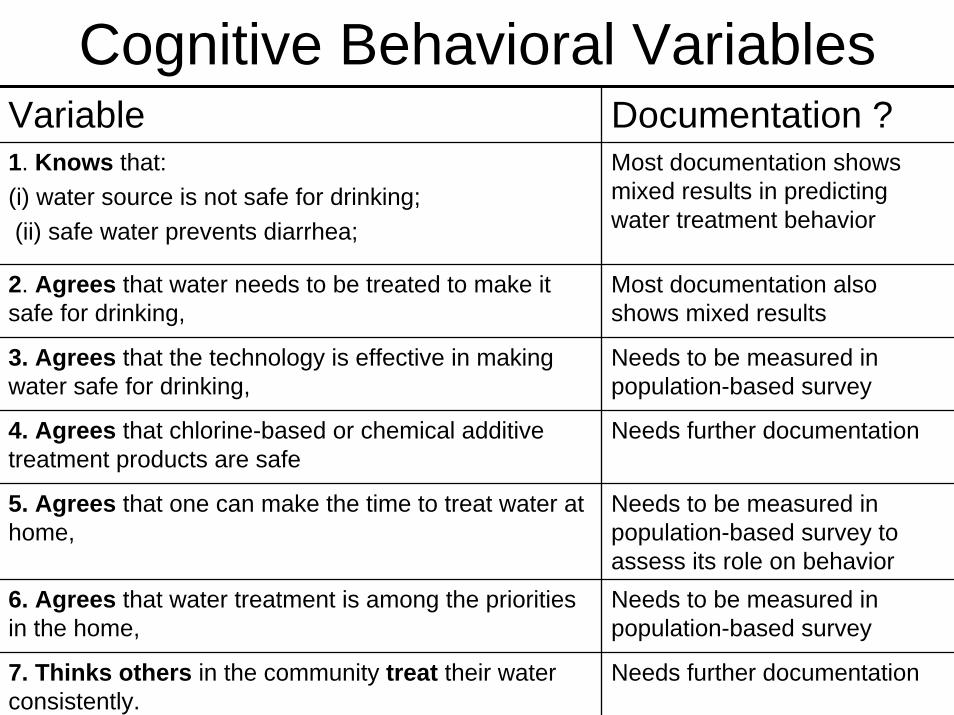
Cognitive Behavioral VariablesVariable Documentation ?1. Knows that:(i) water source is not safe for drinking;(ii) safe water prevents diarrhea;
Most documentation shows mixed results in predicting water treatment behavior
2. Agrees that water needs to be treated to make it safe for drinking,
Most documentation also shows mixed results
3. Agrees that the technology is effective in making water safe for drinking,
Needs to be measured in population-based survey
4. Agrees that chlorine-based or chemical additive treatment products are safe
Needs further documentation
5. Agrees that one can make the time to treat water at home,
Needs to be measured in population-based survey to assess its role on behavior
6. Agrees that water treatment is among the priorities in the home,
Needs to be measured in population-based survey
7. Thinks others in the community treat their water consistently.
Needs further documentation

Emotional –Behavioral Variables
Variable Documentation?
Has confidence in treating water Needs further documentation in population-based surveys
Likes the taste of treated water Needs further documentation in population-based surveys
Feels good (sense of satisfaction) by providing treated water for all members in the household,
Not yet documented

Social Interaction – Behavioral Variables
Variable Documentation
Others have recommended to treat water at home
Some intervention studies have started to use this variable but it needs to be further documented to understand its role in predicting behavior
Advocates water treatment to others in the community,
Not yet documented

Monitoring Long-term Behavioral Targets
“Extent of Coverage”“Impact”
“Use/Sustained Use”

Acceptance Level (Example from KWAHO, 2004)Item Value Percent
Total target households 20,000
Number households reached/trained 9,000/20,000 45%(out of total target households)
Regular users (out of household 8.000/9,000 88%reached/trained)Irregular users (our of households 110/9,000 3%reached/trained)Non-users (out of households 780/9,000 9%reached/trained)Overall acceptance level 8,000/20,000 40%
Acceptance level (out of number of 8,000/9,000 89%households reached/trained)

Market Penetration• Market penetration (for one-time purchase HWTS units)
= total number of units of product sold total population of the given country
• Market penetration (for recurrent purchase HWTS products)
= (total # units sold) / (total # units for 1 year’s safe water)total population in the given country
• Example: Assume 1.8 M bottle of chlorine are sold in Zambia in 1 year. It takes 12 bottles per year to provide safe water for one household (based on volume of bottle, concentration, etc). Population of Zambia = 10 M, therefore:
Market penetration = 1.8 M / 12 = 0.01510 M
(From email exchanges – Susan Murcott and Rob Quick)

Adoption and Sustained Use
• Rate of Adoption (ROA) = # people using HWTS system after 1 month# people originally receiving HTWS
• Rate of Sustained Use (ROSU) = # people using HWTS system after 1 year
• # people originally receiving HWTS system
• What is the ROA of your organization’s intervention?
• What is the ROSU of your organization’s intervention?
(From Implementation Organization “Long Survey” applied in Kenya by Baffrey,R. and Murcott,S. June, 2005)