Spread Too Thin: The Effects of Teacher Specialization on ...
32
VERSION: October 2021 EdWorkingPaper No. 21-477 Spread Too Thin: The Effects of Teacher Specialization on Student Achievement Although the majority of elementary school teachers are in self-contained classrooms and teach all major subjects, a growing number of teachers specialize in teaching fewer subjects to higher numbers of students. We use administrative data from Indiana to estimate the effect of teacher specialization on teacher and school effectiveness in elementary schools. We find that teacher specialization leads to lower teaching effectiveness in math and reading, and the negative effects are larger when teaching students who are more likely to experience difficulties in school. Moreover, we find no evidence that increasing the proportion of teacher specialists at the school level generates improvements in indicators of school quality. Suggested citation: Hwang, NaYoung, and Brian Kisida. (2021). Spread Too Thin: The Effects of Teacher Specialization on Student Achievement. (EdWorkingPaper: 21-477). Retrieved from Annenberg Institute at Brown University: https://- doi.org/10.26300/616s-he51 NaYoung Hwang University of Missouri Brian Kisida University of Missouri
Transcript of Spread Too Thin: The Effects of Teacher Specialization on ...

VERSION: October 2021
EdWorkingPaper No. 21-477
Spread Too Thin: The Effects of Teacher
Specialization on Student Achievement
Although the majority of elementary school teachers are in self-contained classrooms and teach all major
subjects, a growing number of teachers specialize in teaching fewer subjects to higher numbers of students.
We use administrative data from Indiana to estimate the effect of teacher specialization on teacher and school
effectiveness in elementary schools. We find that teacher specialization leads to lower teaching effectiveness in
math and reading, and the negative effects are larger when teaching students who are more likely to
experience difficulties in school. Moreover, we find no evidence that increasing the proportion of teacher
specialists at the school level generates improvements in indicators of school quality.
Suggested citation: Hwang, NaYoung, and Brian Kisida. (2021). Spread Too Thin: The Effects of Teacher Specialization on Student
Achievement. (EdWorkingPaper: 21-477). Retrieved from Annenberg Institute at Brown University: https://-
doi.org/10.26300/616s-he51
NaYoung Hwang
University of Missouri
Brian Kisida
University of Missouri

1
Spread Too Thin:
The Effect of Teacher Specialization on Student Achievement1
NaYoung Hwang
Brian Kisida
Truman School of Government & Public Affairs
University of Missouri
October 2021
Abstract
Although the majority of elementary school teachers are in self-contained classrooms and teach
all major subjects, a growing number of teachers specialize in teaching fewer subjects to higher
numbers of students. We use administrative data from Indiana to estimate the effect of teacher
specialization on teacher and school effectiveness in elementary schools. We find that teacher
specialization leads to lower teaching effectiveness in math and reading, and the negative effects
are larger when teaching students who are more likely to experience difficulties in school.
Moreover, we find no evidence that increasing the proportion of teacher specialists at the school
level generates improvements in indicators of school quality.
Keywords: teacher specialization, student-teacher relationship, teaching effectiveness
1 Acknowledgements: We are grateful to Mark Berends and Roberto Penaloza for supporting this project and the
Indiana Department of Education for providing access to data. We also thank Cory Koedel for comments on an
earlier manuscript. All errors our own.

2
1. Introduction
The majority of U.S. elementary school students learn in self-contained classrooms where
one teacher covers all major subjects, whereas secondary school students learn from subject-area
specialists who cover fewer subjects. Yet, elementary school teachers typically have expertise in
some subjects over others (Cohen et al., 2018; Goldhaber et al, 2013), and a teacher’s content
knowledge in a particular area predicts higher student achievement (Ball et al., 2008; Campbell
et al., 2014). Thus, subject-area specialization has the potential to increase teacher and school
effectiveness by leveraging and developing a teacher’s subject expertise (Condie et al, 2011;
Jacob & Rockoff, 2011).
Although subject-area specialization in elementary schools is conceptually appealing
along some dimensions, it does not come without tradeoffs. From the perspective of teacher
effectiveness, one potential negative consequence is increased student/teacher ratios and the
corresponding weaking of student-teacher relationships. Unlike self-contained classrooms that
enable teachers to cultivate strong relationships by focusing on fewer students and spending
more time with them, subject-area specialization spreads teachers across more students (Bastian
& Fortner, 2020). Because strong student-teacher relationships are an important ingredient in
positive student growth (Hegde & Cassiday, 2004), the benefits of specialization may not
outweigh the advantages of learning from a general classroom teacher.
Educators and policymakers have weighed the benefits and drawbacks of teacher
specialization in elementary schools for a century (Ackerlund, 1959; Lobdell & Van Ness, 1963;
Parker et al., 2017), yet there remains little empirical evidence on this understudied topic. While
evidence of differential effectiveness across subjects supports subject area teacher specialization
(Condie et al, 2011; Jacob & Rockoff, 2011) recent research suggests that specialization can lead
to lower teaching effectiveness (Fryer, 2018; Bastian & Fortner, 2018).
Our study brings new evidence to the thin body of literature and provides important
policy implications. Using longitudinal administrative data from the Indiana Department of
Education (IDOE) covering the 2010-11 to 2016-17 school years, we begin by documenting
school and teacher characteristics that are associated with teachers becoming specialists. Next,
because we observe the same teachers at different points in time in both general and specialized
roles, we test whether subject area teacher specialization (i.e., teaching only one or two subjects
in a given year) increases or decreases math and reading teaching effectiveness. We complement

3
this investigation by considering if the effectiveness of specialists is heterogenous across
different student populations. Finally, because specialization could improve total school
outcomes independent of the impact of specialization on an individual teacher’s average
effectiveness, we explore the net effect of teacher specialization on school improvement across a
range of student outcomes, including student achievement, absences, and disciplinary infractions.
We find few differences across schools with higher or lower rates of teacher
specialization. Counterintuitively, teachers with low value-added scores and teachers considered
not highly qualified by Indiana’s Department of Education are more likely to become specialists.
For individual teachers, we find clear evidence that they perform worse in specialized teaching
roles relative to general roles as measured by their impacts on student achievement in math and
reading. Moreover, reductions in teaching effectiveness are greater for students who are more
likely to face difficulties in school (i.e., low-achieving students, students who are eligible for free
or reduced-price lunch, English language learners, and students who are enrolled in special
education). From the perspective of total school performance, we find no evidence that schools
that increase the proportion of teachers working as specialists experience improvement in student
achievement, absences, or disciplinary infractions.
2. Background on Teacher Specialization
Discussion regarding the potential benefits of elementary school teacher specialization
dates back for more than a century. Though the percent of elementary schools that implement
teacher specialization has varied widely over time (Lobdell & Van Ness, 1963; Hood, 2010), an
increasing number of elementary schools assign teachers to fewer subjects and a greater number
of students (Gewertz, 2014; Hood, 2010; Parker et al., 2017). In the mid-1990s, only 5% of
elementary schools implemented teacher specialization, but that number rose to 20% by the end
of the 2000s across U.S. school districts (Hood, 2010).
This growing interest in elementary school teacher specialization is closely linked with
demand for quality teachers. A large body of studies confirm that teacher quality plays a critical
role in student learning and development (e.g., Chetty, Friedman, & Rockoff, 2014; Jennings &
Greenberg, 2009), yet the quality and supply of teachers in the U.S. workforce has been a
concern over the past several decades (Corcoran et al., 2004; Hanushek & Pace, 1995).
Two lines of emerging literature provide compelling evidence that supports the
advantages of teacher specialization. One line of research demonstrates that a teacher’s

4
effectiveness varies across subjects. Although a highly effective teacher in one subject tends to
be also highly effective in other subjects, teachers are more effective in some subjects than others
(Condie et al., 2011; Cohen et al., 2018). This suggests that assigning teachers to subjects based
on their comparative advantages may enhance student learning.
Another hypothesized advantage of specialization is that it should reduce teacher
preparation and training burdens. Scholars also show that teaching the same grade repeatedly
helps teachers develop their expertise faster (Ost, 2014; Blazar, 2015), whereas teaching multiple
grades and managing wider ranges of content preparation hampers their effectiveness (Bastian &
Janda, 2018). Because teacher specialization enables teachers to spend more time on a narrower
range of content, teacher specialization can also expedite teachers’ preparation and professional
development by allowing teachers to devote their time to a smaller number of subjects. Teachers
report that preparing and teaching fewer subjects reduces stress and increases their job
satisfaction (Strohl et al., 2014).
Despite theory and evidence suggesting teacher specialization is a promising strategy to
increase teacher effectiveness, assigning teachers to fewer subjects may come with unintended
consequences. Teachers are responsible for teaching more students, making it more difficult for
them to learn each individual students’ strengths and weaknesses, special circumstances, and
needs (Ackerlund, 1959; Culyer, 1984; Vidergor & Gordon, 2015). This lack of student-teacher
familiarity likely provides challenging environments for students to build attachment with
teachers and develop a sense of school belonging (Allen et al., 2018; Bouchard & Berg, 2017).
Research consistently shows that establishing strong relationship with teachers play an important
role in student development by increasing school engagement and connectiveness, particularly in
early stages of schooling (Curby et al., 2009; O’Connor & McCartney, 2007; Wu et al., 2010)
For parents, not having a single teacher may make it more difficult to communicate regarding the
progress of their child’s development and learning.
Given these considerations, teacher specialization may have more adverse effects on
students from vulnerable populations. Although relationships with teachers influence the
learning of all students, the opportunities to build relationships with teachers can play a greater
role for students who face more challenges in schools (Hamre & Pianta, 2005; Meehan et al.,
2003). For example, if students from low-income families have relatively fewer educational
resources and support at home, strong bindings with teachers may help offset these

5
disadvantages (Liew et al., 2010; Murray & Malmgren, 2005). Similarly, academically
struggling students likely face greater difficulties if they study with teachers who do not spend
enough time with them to know their learning styles and tailor instruction to their particular
needs (Liew et al., 2010).
Although discussions regarding the pros and cons of teacher specialization are far from
new, rigorous and systematic empirical evidence on the effects of teacher effectiveness and
school improvement is rare. Two recent studies suggest the costs of teacher specialization
outweigh the benefits. Research from a randomized control trial involving 46 schools in Houston
Independent School District (HISD), where students are predominantly from racial/ethnic
minority and low-income families, finds that teacher specialization has adverse effects on
average academic achievement and behavioral outcomes (Fryer, 2018). Specifically, students in
treatment schools encouraged to adopt specialization experienced a 0.11 SD decrease in a
combined index of math and reading test scores, and were more likely to be suspended and
accrue absences.
Related research examining data from North Carolina’s elementary schools also found
discouraging results (Bastian & Fortner, 2018). Though they found that more effective teachers
(i.e., as measured by value-added scores and principal evaluations) were more likely to be
specialists, teachers were less effective in math (-0.04 SD) and reading (-0.01 SD) when they
taught one or two subjects than when they taught more subjects. Moreover, the North Carolina
study found no evidence that increased levels of specialization and school effectiveness.
Using data covering the universe of public elementary schools in Indiana across seven
years, we contribute to this growing literature in several important ways. First, we identify
factors that predict which school and teacher characteristics predict teacher specialization. Next,
we employ teacher fixed effects models to reveal the effect of teacher specialization on teaching
effectiveness overall and across student subgroups. Finally, we examine the net effect of teacher
specialization on school-level student achievement, absences, and discipline rates, and explore
potential heterogeneous effects across different levels of student achievement, student poverty,
and minority student rates.
3. Data and Sample
6
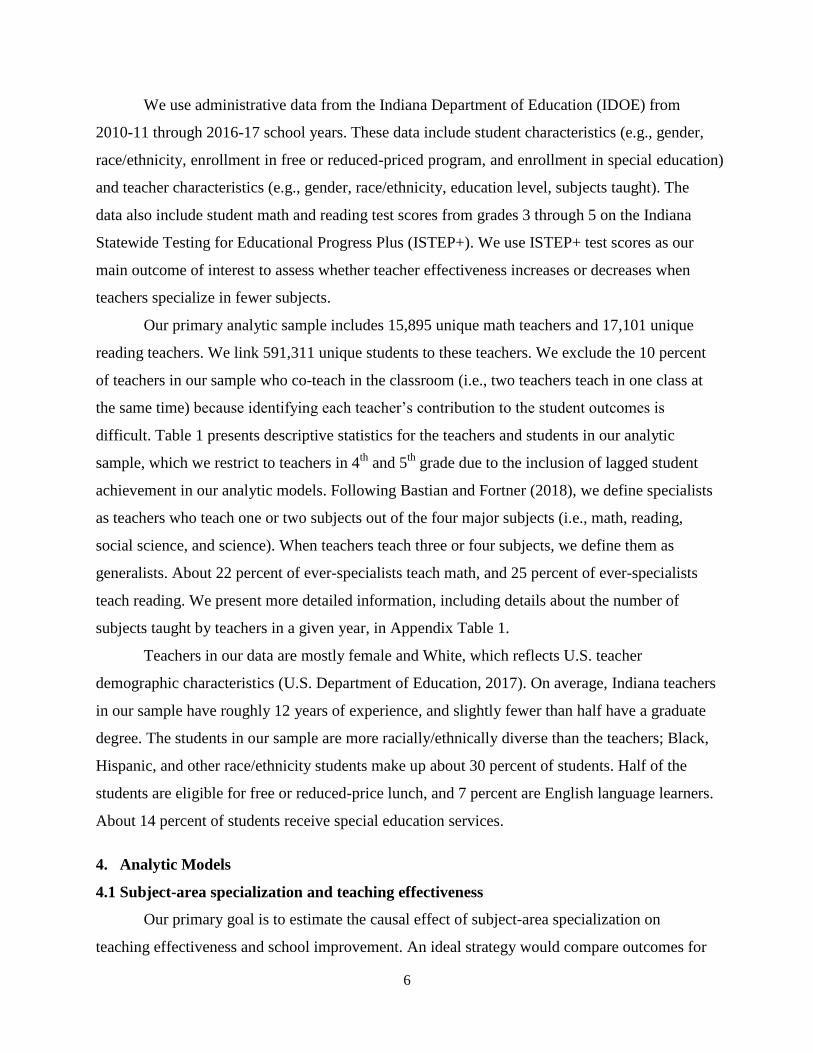
We use administrative data from the Indiana Department of Education (IDOE) from
2010-11 through 2016-17 school years. These data include student characteristics (e.g., gender,
race/ethnicity, enrollment in free or reduced-priced program, and enrollment in special education)
and teacher characteristics (e.g., gender, race/ethnicity, education level, subjects taught). The
data also include student math and reading test scores from grades 3 through 5 on the Indiana
Statewide Testing for Educational Progress Plus (ISTEP+). We use ISTEP+ test scores as our
main outcome of interest to assess whether teacher effectiveness increases or decreases when
teachers specialize in fewer subjects.
Our primary analytic sample includes 15,895 unique math teachers and 17,101 unique
reading teachers. We link 591,311 unique students to these teachers. We exclude the 10 percent
of teachers in our sample who co-teach in the classroom (i.e., two teachers teach in one class at
the same time) because identifying each teacher’s contribution to the student outcomes is
difficult. Table 1 presents descriptive statistics for the teachers and students in our analytic
sample, which we restrict to teachers in 4th
and 5th
grade due to the inclusion of lagged student
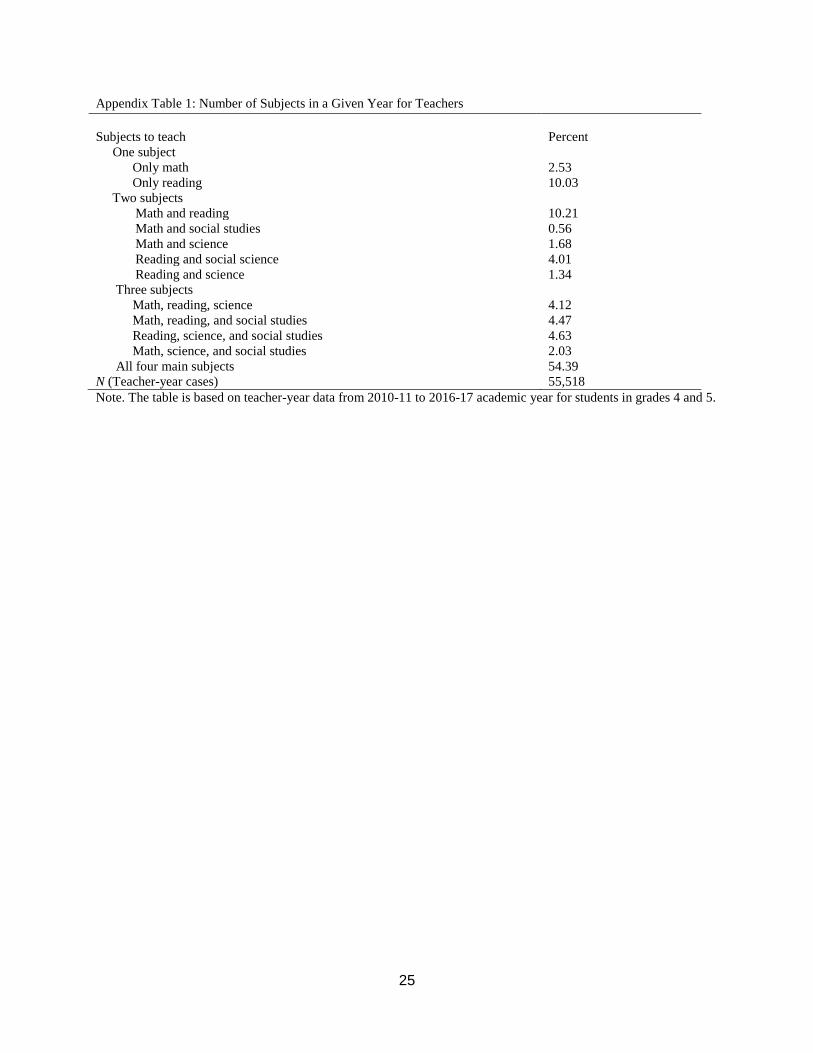
achievement in our analytic models. Following Bastian and Fortner (2018), we define specialists
as teachers who teach one or two subjects out of the four major subjects (i.e., math, reading,
social science, and science). When teachers teach three or four subjects, we define them as
generalists. About 22 percent of ever-specialists teach math, and 25 percent of ever-specialists
teach reading. We present more detailed information, including details about the number of
subjects taught by teachers in a given year, in Appendix Table 1.
Teachers in our data are mostly female and White, which reflects U.S. teacher
demographic characteristics (U.S. Department of Education, 2017). On average, Indiana teachers
in our sample have roughly 12 years of experience, and slightly fewer than half have a graduate
degree. The students in our sample are more racially/ethnically diverse than the teachers; Black,
Hispanic, and other race/ethnicity students make up about 30 percent of students. Half of the
students are eligible for free or reduced-price lunch, and 7 percent are English language learners.
About 14 percent of students receive special education services.
4. Analytic Models
4.1 Subject-area specialization and teaching effectiveness
Our primary goal is to estimate the causal effect of subject-area specialization on
teaching effectiveness and school improvement. An ideal strategy would compare outcomes for

7
teachers or schools randomly assigned to incorporate specialization to teachers or schools that
are not. Such a strategy would rule out the possibility that the timing of assignment to
specialization is related to other unobserved factors, or that teachers or schools adopting teacher
specialization are a select group with different characteristics than teachers or schools that do not.
Because we do not have random-assignment, we leverage quasi-experimental panel data
methods to recover estimates that—under the identifying assumptions of our models—carry a
causal interpretation. Specifically, we use multi-layer fixed effects models, with the key layer
being fixed effects for individual teachers themselves. The teacher fixed effects isolate
identifying variation to occur within teachers only—i.e., we identify the effect of specialization
by comparing the effectiveness of the same teachers in years when they do and do not specialize.
Our identification hinges on the assumption that factors that lead to changes in a teacher’s
specialization status are unrelated to time-varying changes in their own performance or the
expected performance of the students assigned to them, conditional on observed student controls.
Our primary specification is as follows:
𝑌𝑖𝑗𝑔𝑠𝑡 = 𝛽1𝑆𝑝𝑒𝑐𝑖𝑎𝑙𝑖𝑠𝑡𝑗𝑠𝑡 + 𝛽2𝑺𝒕𝒖𝒅𝒆𝒏𝒕𝑖𝑗𝑠𝑡 + 𝛽3𝑻𝒆𝒂𝒄𝒉𝒆𝒓𝑗𝑠𝑡 + 𝛽4𝑺𝒄𝒉𝒐𝒐𝒍𝑠𝑡 + 𝛿𝑗 +
𝜃𝑔+𝜌𝑡 + 𝜖𝑖𝑗𝑔𝑠𝑡 (1)
𝑌𝑖𝑗𝑔𝑡 represents the standardized math or reading score for student i with teacher j in
grade g and school s at time t. 𝑆𝑝𝑒𝑐𝑖𝑎𝑙𝑖𝑠𝑡𝑗𝑠𝑡 is the treatment variable of interest and indicates
whether a teacher is a specialist in a given school year in school s at time t. 𝑺𝒕𝒖𝒅𝒆𝒏𝒕𝑗𝑠𝑡 includes
student characteristics including prior year test scores in math or reading, gender, race/ethnicity,
eligibility for free or reduced-priced lunch (FRL), enrollment in special education services,
English language learner status (ELL), and class size. 𝑻𝒆𝒂𝒄𝒉𝒆𝒓𝑗𝑠𝑡 includes whether a teacher
has a graduate degree and whether a teacher is a new to school. 𝑺𝒄𝒉𝒐𝒐𝒍𝑠𝑡 includes school size,
the percent of Black and Hispanic students, and the percent of students who are eligible for free
or reduced-priced lunch. 𝛿𝑗 is a teacher fixed effect, 𝜃𝑔 is a grade fixed effect, 𝜋𝑠 is a school
fixed effect, and 𝜌𝑡 is a year fixed effect. 𝜖𝑖𝑗𝑔𝑠𝑡 is the error term, which we cluster at the school
level.
To examine whether the effects of specialization vary by time, we also run models where
we include a set of indicators for one, two, or three or more years since becoming specialist.
These models allow us to test whether the effects of specialization change as teachers accumulate

8
experience in that role. To examine whether teacher specialization and effectiveness vary across
student subgroups, we add interaction terms to our models to examine if effects are different for
students from certain subgroups, including students who are eligible for FRL, enrolled in special
education services, ELL, and lower-achieving students. We also present models run separately
for each subgroup in Appendix Tables 2 and 3 the results are qualitatively similar.
4.2 Teacher specialization and school improvement
While our teacher fixed effects models estimate the effectiveness of individual teachers,
it could still be the case that schools are effectively assigning teachers in ways that improve
average school outcomes. For example, though assigning a teacher to a specialist role may lower
an individual teacher’s average effectiveness, students may still be better off if that teacher is
better at a particular subject than the other generalists in the school. We use longitudinal school-
grade data and school fixed effects to test whether the percentage of teachers who are specialists
in a given year has an effect on school improvement in achievement, unexcused absences, and
percent of students receiving disciplinary infractions. The following equation presents our school
fixed effects specification:
𝑌𝑠𝑔𝑡 = 𝛽1𝑆𝑝𝑒𝑐𝑖𝑎𝑙𝑖𝑧𝑎𝑡𝑖𝑜𝑛𝑅𝑎𝑡𝑒𝑠𝑔𝑡 + 𝛽2𝑺𝒄𝒉𝒐𝒐𝒍𝑠𝑡 + 𝛿𝑠 + 𝜃𝑔+𝜌𝑡 + 𝜖𝑠𝑔𝑡 (2)
𝑌𝑠𝑔𝑡 represents one of the school-grade level outcomes (math achievement, reading
achievement, absences, or disciplinary incidents) for school s in grade g at time t. We measure
math and reading achievement by aggregating ISTEP+ math and reading scores at school-grade
level, respectively. Absences indicate average unexcused days absent at school-grade level, and
disciplinary incidents indicate percent ever-disciplined students at school-grade
level. 𝑆𝑝𝑒𝑐𝑖𝑎𝑙𝑖𝑧𝑎𝑡𝑖𝑜𝑛𝑅𝑎𝑡𝑒𝑠𝑔𝑡 indicates the percentage of students taught by a specialist in math
or reading in a school-grade, by year. When examining non-test score outcomes, we use the
percentage of students taught by either math or reading specialists. 𝑆𝑐ℎ𝑜𝑜𝑙𝑠𝑡 indicates time
varying school-grade level characteristics, including the percentage of teachers who have a
graduate degree, the percentage of teachers who are new to the school, school size, the
percentage of students who are Black and Hispanic, and the percentage of students who are
eligible for free or reduced-lunch prices. 𝛿𝑠 is a school fixed effect that controls for time-
invariant school characteristics. 𝜃𝑔 is a grade fixed effect, and 𝜖𝑠𝑔𝑡 is an error term. To examine
potential heterogenous effects of teacher specialization, we also include interaction terms

9
between the percentage of students who study with specialists and school characteristics,
including poverty level, the percentage of racial/ethnic minority student rates, and prior-year
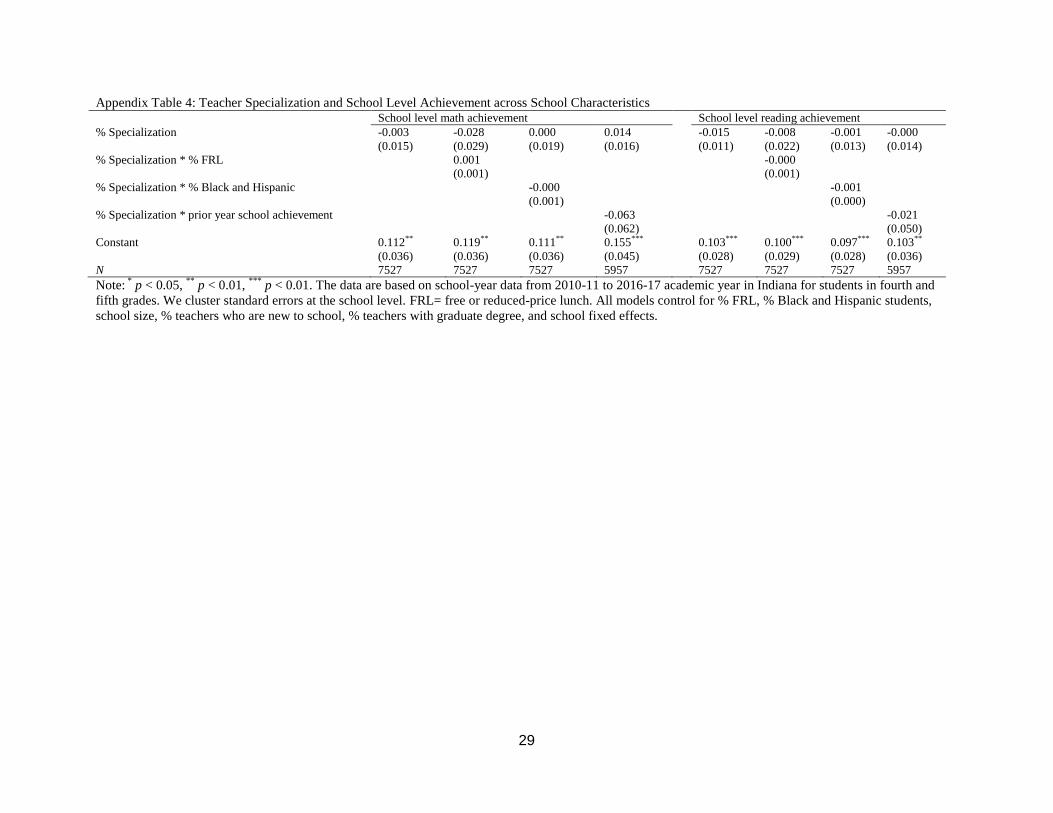
student achievement. As a robustness check, we present results using school-year level instead of
school-grade level in Appendix Tables 4 and 5, and the results are consistent.
5. Results
5.1 Descriptive characteristics
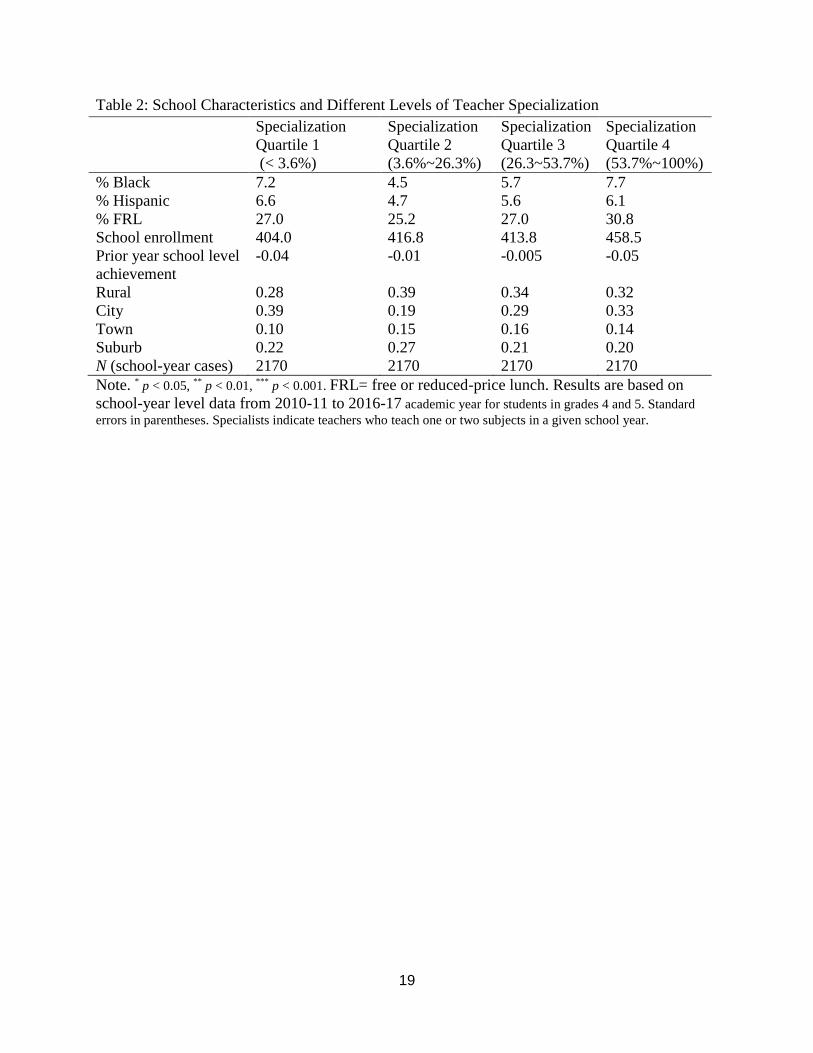
We first examine school characteristics and how they relate to the prevalence of teacher
specialization (i.e., quartiles of percent of students with subject area specialists). Overall, we find
few differences across schools with more or less teacher specialization (Table 2). Schools with
high and low specialization are similar in terms of percent Black, percent Hispanic, percent FRL,
prior achievement, and school size. Additionally, teacher specialization does not vary much by
school urbanicity.
Next, we investigate teacher characteristics that predict specialization in math or reading.
Perhaps counterintuitively, Table 3 shows that teachers with lower lagged value-added scores
and those categorized by the Indiana Department of Education as not highly qualified are more
likely to become subject-area specialists, compared with generalist teachers within a school
during the same school years. Column 1 in Table 3 shows that one SD increase in lagged math
value-added score is associated with a 4.8 percentage point decrease in the probability of
becoming a math specialist. In addition, being designated a highly qualified teacher is associated
with 10.7 percentage point decrease in the probability of becoming a math specialist. Hispanic
teachers and more experienced teachers are also less likely to become math specialists. Column 2
shows results from the models that predict becoming reading specialists, and the findings are
substantively similar.
5.2 Teacher specialization and teaching effectiveness
Our primary results regarding the impacts on teaching effectiveness of subject-area
specialization are shown in Table 4. Column 1 in shows that when a teacher specializes in fewer
subjects, their teaching effectiveness in math is 0.04 SD lower compared with when that same
teacher is a generalist. Column 2 shows that the first year of specialization generates the largest
negative impact, at -0.045 SD, while the second, and subsequent years of specialization lead to -
0.028 SD, and -0.032 SD decreases in math teaching effectiveness, respectively. Though the
10
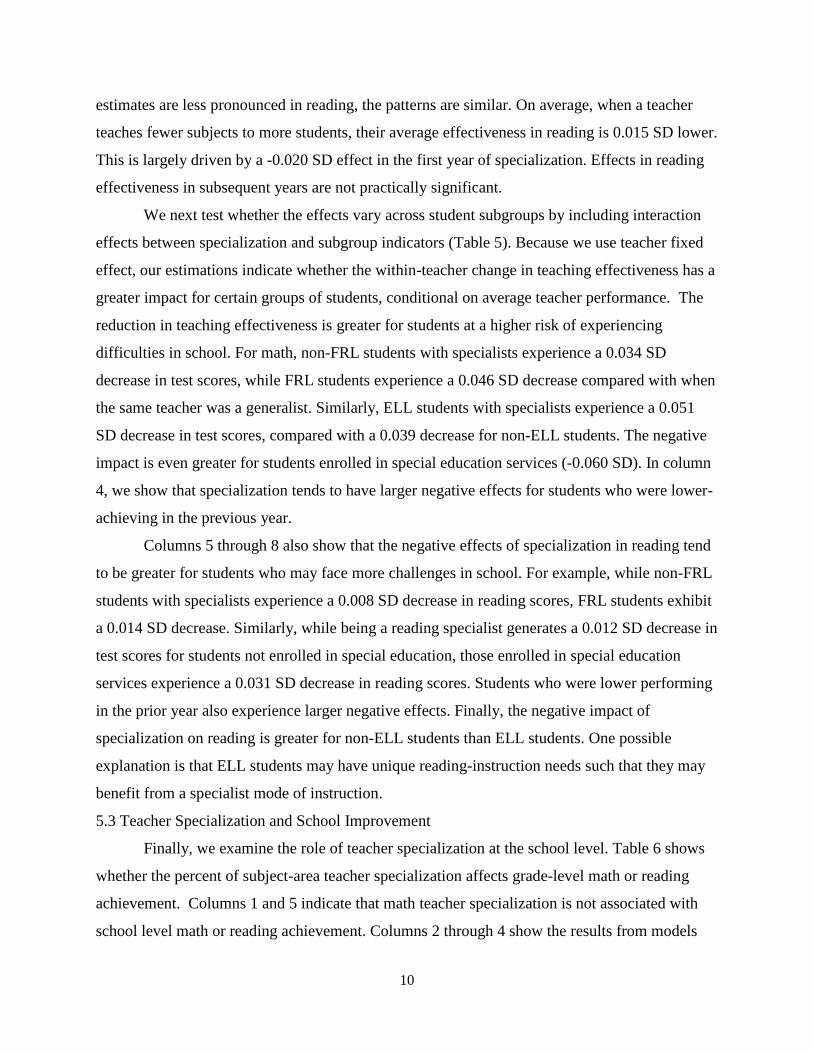
estimates are less pronounced in reading, the patterns are similar. On average, when a teacher
teaches fewer subjects to more students, their average effectiveness in reading is 0.015 SD lower.
This is largely driven by a -0.020 SD effect in the first year of specialization. Effects in reading
effectiveness in subsequent years are not practically significant.
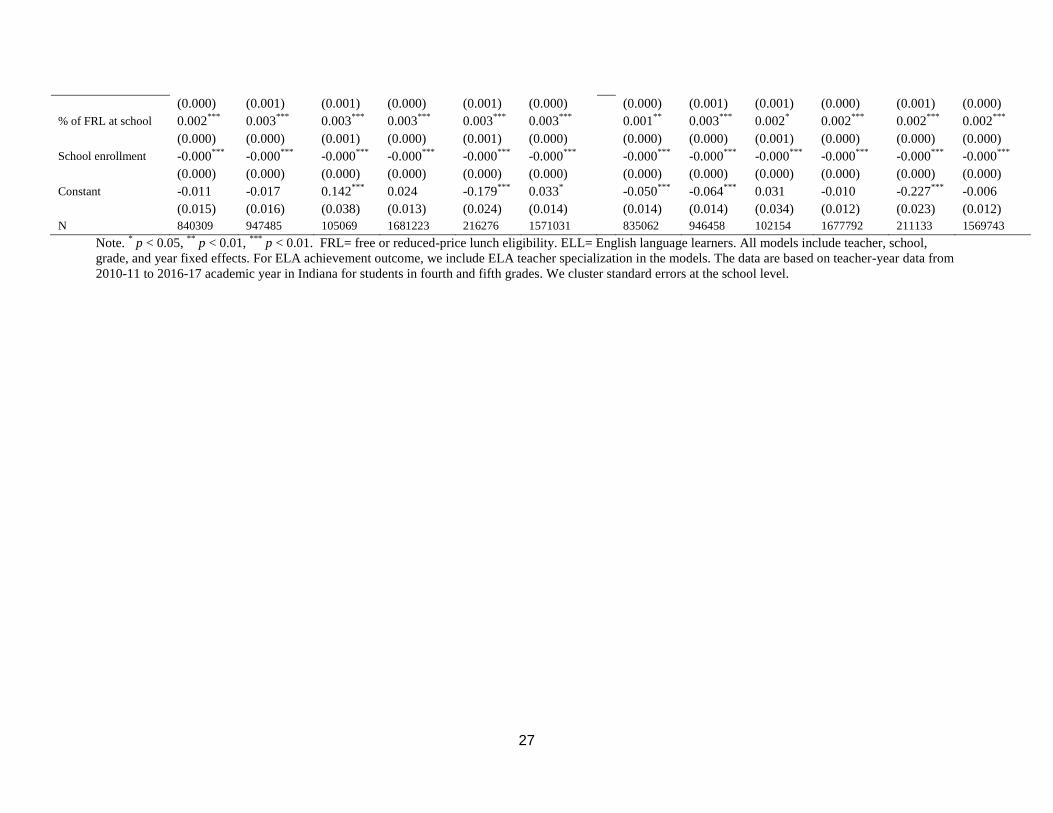
We next test whether the effects vary across student subgroups by including interaction
effects between specialization and subgroup indicators (Table 5). Because we use teacher fixed
effect, our estimations indicate whether the within-teacher change in teaching effectiveness has a
greater impact for certain groups of students, conditional on average teacher performance. The
reduction in teaching effectiveness is greater for students at a higher risk of experiencing
difficulties in school. For math, non-FRL students with specialists experience a 0.034 SD
decrease in test scores, while FRL students experience a 0.046 SD decrease compared with when
the same teacher was a generalist. Similarly, ELL students with specialists experience a 0.051
SD decrease in test scores, compared with a 0.039 decrease for non-ELL students. The negative
impact is even greater for students enrolled in special education services (-0.060 SD). In column
4, we show that specialization tends to have larger negative effects for students who were lower-
achieving in the previous year.
Columns 5 through 8 also show that the negative effects of specialization in reading tend
to be greater for students who may face more challenges in school. For example, while non-FRL
students with specialists experience a 0.008 SD decrease in reading scores, FRL students exhibit
a 0.014 SD decrease. Similarly, while being a reading specialist generates a 0.012 SD decrease in
test scores for students not enrolled in special education, those enrolled in special education
services experience a 0.031 SD decrease in reading scores. Students who were lower performing
in the prior year also experience larger negative effects. Finally, the negative impact of
specialization on reading is greater for non-ELL students than ELL students. One possible
explanation is that ELL students may have unique reading-instruction needs such that they may
benefit from a specialist mode of instruction.
5.3 Teacher Specialization and School Improvement
Finally, we examine the role of teacher specialization at the school level. Table 6 shows
whether the percent of subject-area teacher specialization affects grade-level math or reading
achievement. Columns 1 and 5 indicate that math teacher specialization is not associated with
school level math or reading achievement. Columns 2 through 4 show the results from models

11
with interactions between math teacher specialization and school characteristics indicating
proportions of students in poverty, minority students, and prior achievement levels. We find no
evidence of heterogenous effects between math specialization across these school characteristics.
In terms of school level reading performance, the results show that specialization effects do not
vary by proportions of students in poverty and minority students (Columns 6 and 7). We find
some suggestive evidence that reading specialization negatively affects reading achievement at
more high-achieving schools, though the effect is small.
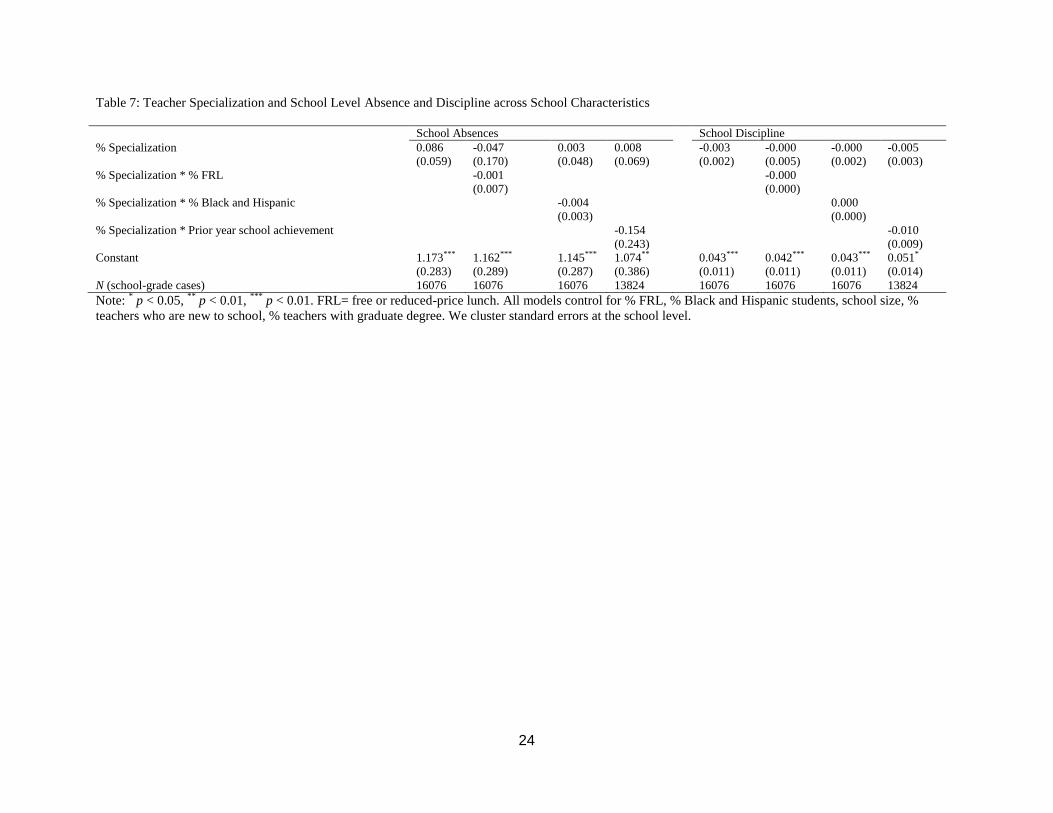
We also test whether teacher specialization affects school level absences or school
disciplinary outcomes (Table 7). We find no evidence that the percent of a school’s teacher
specialization affects these behavioral student outcomes. In addition, there are no heterogenous
effects across different school characteristics, including school percent FRL, percent of Black
and Hispanic students, and prior school level achievement.
6. Discussion and Conclusion
We use seven years of administrative data on elementary school students and teachers to
investigate whether and the extent to which subject-area specialization affects teaching
effectiveness and school performance. Although specialization is conceptually alluring because it
can capitalize on teachers’ comparative advantages and streamlines their preparation and training,
it does not seem to benefit students. Our teacher fixed effect models show that teaching
effectiveness in math and reading decreases when teachers teach fewer subjects to more students.
We further show that the negative effects have a greater impact for students who tend to
experience more challenges in school, including low-achieving students, FRL eligible students,
English language learners, and students receiving special education services. This is consistent
with related evidence showing that relationships are especially important for vulnerable students
(Al-Yagon & Mikulincer, 2004; Baker, 1999; O’Connor & McCartney, 2007; Wu et al., 2010).
At the school level, the relative concentration of teacher specialization does not translate into
increased school level outcomes, including average achievement, absences, or school
disciplinary incidents.
It is possible that specialization fails to live up to its promise is because school leaders are
not able to effectively determine which teachers should specialize in which subjects. We show
that teachers who exhibit lower value-added scores and are not designated as highly qualified
tend to become specialists in Indiana. Yet, related work in North Carolina found higher-quality
12
teachers (based on value-added score and principal evaluation) tend to become specialists, but
otherwise had similar findings to ours (Bastian & Fortner, 2018). In both cases, subject area
specialization reduced teaching effectiveness, and there is no evidence that increasing the
number of specialists improves school performance.
One mechanism that may explain our findings is that specialization weakens student-
teacher relationships. To explore this theory further, we e investigate whether the negative
effects of specialization are reduced if students are assigned to the same specialist for two
consecutive years (i.e., repeating student-teacher matching). We find that the negative effects of
specialization in math achievement are significantly lower when students are taught by the same
specialist in a consecutive year (Appendix Table 6). Although the results are suggestive, they
show that finding strategies to increase student-teacher familiarity with specialists may improve
their effectiveness (Hill & Jones, 2018).
This study contributes to our understanding of elementary school teacher specialization,
but it has limitations. First, because our identification strategy relies on teacher fixed effects, we
are not able to estimate teacher effectiveness for teachers who are either specialists or generalists
all the time during the study period. While teacher fixed effects remove time-invariant
characteristics and provide a reliable method to identify the effect on switchers, teachers who are
always specialists and generalists do not contribute to our estimations. In addition, our school-
level models cannot fully capture the complexity of decision-making that goes into assigning
teachers to specialists’ roles. Though the net effect of increased specialization appears to be null,
we don’t directly observe a counterfactual scenario where a school opts not to specialize with
every other aspect within the school held constant. It is possible for example, that schools
increase specialization as a strategy to deal with a shortage of qualified teachers, and without
increased specialization school performance may actually decrease.
Despite these limitations, our findings provide useful insight into elementary school
teacher specialization and echo the findings of related research (Bastian & Fortner, 2018; Fryer,
2018). Indeed, teacher surveys administered in the only randomized controlled trial evaluation of
teacher specialization found that teachers in treatment schools were less likely to report
providing tailored instruction for their students and demonstrated a negative impact on self-
reported job performance (Fryer, 2018). Our findings underscore the importance of opportunities
for teachers to know how their students learn and develop relationships (Grant, 1996; Hill &

13
Jones, 2018). Future research should further explore these mechanisms to determine optimal
ways to harness the potential gains of specialization without the unintended consequences that
teacher specialization seems to generate.

14
References
Ackerlund, G. (1959). Some teacher views on the self-contained classroom. The Phi Delta
Kappan, 40(7), 283-285.
Allen, K., Kern, M. L., Vella-Brodrick, D., Hattie, J., & Waters, L. (2018). What schools need to
know about fostering school belonging: A meta-analysis. Educational Psychology Review,
30(1), 1-34.
Al-Yagon, M., & Mikulincer, M. (2004). Socioemotional and academic adjustment among
children with learning disorders: The mediational role of attachment-based factors. The
journal of special education, 38(2), 111-123.
Baker, J. A. (1999). Teacher-student interaction in urban at-risk classrooms: Differential
behavior, relationship quality, and student satisfaction with school. The elementary school
journal, 100(1), 57-70.
Ball, D. L., Thames, M. H., & Phelps, G. (2008). Content knowledge for teaching: What makes
it special. Journal of teacher education, 59(5), 389-407.
Bastian, K. C., & Fortner, C. K. (2020). Is less more? Subject-area specialization and outcomes
in elementary schools. Education Finance and Policy, 15(2), 357-382.
Bastian, K. C., & Janda, L. (2018). Does quantity affect quality? Teachers’ course preparations
and effectiveness. Journal of Research on Educational Effectiveness, 11(4), 535-558.
Blazar, D. (2015). Grade assignments and the teacher pipeline: A low-cost lever to improve
student achievement?. Educational Researcher, 44(4), 213-227.
Bouchard, K. L., & Berg, D. H. (2017). Students' School Belonging: Juxtaposing the
Perspectives of Teachers and Students in the Late Elementary School Years (Grades 4-8).
School Community Journal, 27(1), 107-136.
Campbell, P. F., Nishio, M., Smith, T. M., Clark, L. M., Conant, D. L., Rust, A. H., ... & Choi, Y.
(2014). The relationship between teachers' mathematical content and pedagogical
knowledge, teachers' perceptions, and student achievement. Journal for Research in
Mathematics Education, 45(4), 419-459.
Cohen, J., Ruzek, E., & Sandilos, L. (2018). Does teaching quality cross subjects? Exploring
consistency in elementary teacher practice across subjects. AERA Open, 4(3),
2332858418794492.

15
Condie, S., Lefgren, L., & Sims, D. (2014). Teacher heterogeneity, value-added and education
policy. Economics of Education Review, 40, 76-92.
Chetty, R., Friedman, J. N., & Rockoff, J. E. (2014). Measuring the impacts of teachers II:
Teacher value-added and student outcomes in adulthood. American economic review,
104(9), 2633-79.
Corcoran, S. P., Evans, W. N., & Schwab, R. M. (2004). Changing labor-market opportunities
for women and the quality of teachers, 1957-2000. American Economic Review, 94(2),
230-235.
Culyer, R. C. (1984). The case for the self-contained classroom. The Clearing House, 57(9), 417-
419.
Curby, T. W., Rimm-Kaufman, S. E., & Ponitz, C. C. (2009). Teacher–child interactions and
children’s achievement trajectories across kindergarten and first grade. Journal of
educational psychology, 101(4), 912.
Fryer Jr, R. G. (2018). The" pupil" factory: Specialization and the production of human capital in
schools. American Economic Review, 108(3), 616-56.
Gewertz, C., (2014). Platooning on the rise in early grades. Education Week.
https://www.edweek.org/teaching-learning/platooning-on-the-rise-in-early-grades/2014/02
Goldhaber, D., Cowan, J., & Walch, J. (2013). Is a good elementary teacher always good?
Assessing teacher performance estimates across subjects. Economics of Education Review,
36, 216-228.
Grant, J., Johnson, B., & Richardson, I. (1996). The looping handbook (A. Fredenburg, Ed.):
Crystal Springs Books.
Hamre, B. K., & Pianta, R. C. (2005). Can instructional and emotional support in the first‐grade
classroom make a difference for children at risk of school failure?. Child development,
76(5), 949-967.
Hanushek, E. A., & Pace, R. R. (1995). Who chooses to teach (and why)?. Economics of
education review, 14(2), 101-117.
Hegde, A. V., & Cassidy, D. J. (2004). Teacher and parent perspectives on looping. Early
Childhood Education Journal, 32(2), 133-138.
Hill, A. J., & Jones, D. B. (2018). A teacher who knows me: The academic benefits of repeat
student-teacher matches. Economics of Education Review, 64, 1-12.

16
Hood, L. (2010). " Platooning" Instruction. The Education Digest, 75(7), 13-17.
Jacob, B. A., & Rockoff, J. E. (2011). Organizing schools to improve student achievement: Start
times, grade configurations, and teacher assignments. Washington, DC: Brookings
Institution, Hamilton Project.
Jennings, P. A., & Greenberg, M. T. (2009). The prosocial classroom: Teacher social and
emotional competence in relation to student and classroom outcomes. Review of
educational research, 79(1), 491-525.
Liew, J., Chen, Q., & Hughes, J. N. (2010). Child effortful control, teacher–student relationships,
and achievement in academically at-risk children: Additive and interactive effects. Early
Childhood Research Quarterly, 25(1), 51-64.
Lobdell, L. O., & Van Ness, W. J. (1963). The self-contained classroom in the elementary school.
The Elementary School Journal, 63(4), 212-217.
Meehan, B. T., Hughes, J. N., & Cavell, T. A. (2003). Teacher–student relationships as
compensatory resources for aggressive children. Child development, 74(4), 1145-1157.
Murray, C., & Malmgren, K. (2005). Implementing a teacher–student relationship program in a
high-poverty urban school: Effects on social, emotional, and academic adjustment and
lessons learned. Journal of school psychology, 43(2), 137-152.
O’Connor, E., & McCartney, K. (2007). Examining teacher–child relationships and achievement
as part of an ecological model of development. American educational research journal,
44(2), 340-369.
Ost, B. (2014). How do teachers improve? The relative importance of specific and general
human capital. American Economic Journal: Applied Economics, 6(2), 127-51.
Parker, A., Rakes, L., & Arndt, K. (2017, July). Departmentalized, self-contained, or somewhere
in between: understanding elementary grade-level organizational decision-making. In The
Educational Forum (Vol. 81, No. 3, pp. 236-255). Routledge.
Strohl, A., Schmertzing, L., Schmertzing, R., & Hsiao, E. (2014). Comparison of self-contained
and departmentalized elementary teachers’ perceptions of classroom structure and job
satisfaction. Journal of Studies in Education, 4(1), 109-127.

17
U.S. Department of Education, 2017. Table number 209.22.
https://nces.ed.gov/programs/digest/d17/tables/dt17_209.22.asp
Vidergor, H. E., & Azar Gordon, L. (2015). The case of a self-contained elementary classroom
for the gifted: Student, teacher, and parent perceptions of existing versus desired teaching–
learning aspects. Roeper Review, 37(3), 150-164.
Wu, J. Y., Hughes, J. N., & Kwok, O. M. (2010). Teacher–student relationship quality type in
elementary grades: Effects on trajectories for achievement and engagement. Journal of
school psychology, 48(5), 357-387.

18
Table 1: Teacher and Student Characteristics
Note. This summary statistics are based on unique teacher, teacher, and school data from 2010-11 to 2016-17
academic year in Indiana for students in 4 and 5 grades.
Teacher Math Reading
Ever Specialists (%) 22.7 24.8
Female (%) 85.0 86.0
Black (%) 4.2 4.3
White (%) 94.4 93.8
Hispanic (%) 1.1 1.2
Other race/ethnicity (%) 0.2 0.8
Teaching experience (Year) 11.9 11.9
Graduate degree (%) 43.5 43.3
N (Unique teacher observation) 15,895 17,101
Student
Female (%) 49.1
Black (%) 11.3
White (%) 70.9
Hispanic (%) 11.0
Other race/ethnicity (%) 9.0
Free or reduced-price lunch eligibility (%) 50.2
English Language Learner (%) 6.7
Enrollment in special education (%) 14.0
N (Unique student observation) 591,311
19
Table 2: School Characteristics and Different Levels of Teacher Specialization
Specialization
Quartile 1
(< 3.6%)
Specialization
Quartile 2
(3.6%~26.3%)
Specialization
Quartile 3
(26.3~53.7%)
Specialization
Quartile 4
(53.7%~100%)
% Black 7.2 4.5 5.7 7.7
% Hispanic 6.6 4.7 5.6 6.1
% FRL 27.0 25.2 27.0 30.8
School enrollment 404.0 416.8 413.8 458.5
Prior year school level
achievement
-0.04 -0.01 -0.005 -0.05
Rural 0.28 0.39 0.34 0.32
City 0.39 0.19 0.29 0.33
Town 0.10 0.15 0.16 0.14
Suburb 0.22 0.27 0.21 0.20
N (school-year cases) 2170 2170 2170 2170
Note. * p < 0.05,
** p < 0.01,
*** p < 0.001. FRL= free or reduced-price lunch. Results are based on
school-year level data from 2010-11 to 2016-17 academic year for students in grades 4 and 5. Standard
errors in parentheses. Specialists indicate teachers who teach one or two subjects in a given school year.

20
Table 3: Characteristics of First-time Specialists First Time Math Specialist First Time Reading Specialist
Prior value-added Score -0.048* -0.022
(0.019) (0.032)
Highly qualified designation -0.107*** -0.036**
(0.014) (0.012)
Female teacher 0.008 0.011
(0.008) (0.008)
Black teacher 0.004 0.018
(ref. White teacher) (0.015) (0.023)
Hispanic teacher -0.042** 0.028
(0.016) (0.033)
Other race/ethnicity teacher 0.092 0.031
(0.102) (0.037)
Years of teaching experience -0.002*** -0.003***
(0.000) (0.000)
Graduate degree 0.000 0.006
(0.007) (0.008)
Constant 0.213*** 0.220***
(0.014) (0.014)
School FE X X
Year FE X X
N (teacher-year cases) 33259 39560
Note. * p < 0.05,
** p < 0.01,
*** p < 0.001. These models include school and year fixed effects to estimate the
probability of becoming specialist within a school and year. Because the starting year of data is 2011, we are not
able to identify the first-time specialist in 2011. We thus exclude teacher data in 2011 in our analyses that predict
first-time specialists. Highly qualified teacher designation in Indiana indicates teachers who are qualified in the
subject via (1) passing PRAXIS/NTE, (2) 24 credits/degree in core academic, or (3) national board certification.
Standard errors in parentheses

21
Table 4: Teacher Specialization and Teaching Effectiveness
Math Reading
Model 1 Model 2 Model 1 Model 2
Specialization -0.040***
-0.015**
(0.006) (0.004)
First year of specialization -0.046***
-0.020***
(0.007) (0.004)
Second year of specialization -0.029***
-0.003
(0.008) (0.004)
Three years+ specialization -0.032***
-0.008
(0.009) (0.005)
Constant 0.036* 0.036
* -0.006 -0.006
(0.014) (0.014) (0.011) (0.011)
Teacher Fixed Effects X X X X
N (student-year cases) 1789158 1789158 1783212 1783212
Note. * p < 0.05,
** p < 0.01,
*** p < 0.01. All models include teacher, school, grade, and year fixed effects. In
addition, we control for student level controls (i.e., prior achievement, gender, race/ethnicity, FRL, ELL, enrollment
in special education, and class size), teacher level controls (i.e., graduate degree and new to school,), and school
level controls (i.e., school-level achievement, % Black, % Hispanic, % FRL, and school enrollment). For ELA
achievement outcome, we include ELA teacher specialization in the models. The data are based on teacher-year data
from 2010-11 to 2016-17 academic year in Indiana for students in fourth and fifth grades. We cluster standard errors
at the school level.

22
Table 5: Specialization and Student Achievement across Student Subgroups
Math Reading
Teacher Specialization -0.034***
-0.039***
-0.036***
0.023**
-0.008* -0.016
*** -0.012
*** -0.015
**
(0.006) (0.006) (0.006) (0.007) (0.004) (0.003) (0.003) (0.005)
FRL -0.081***
-0.088***
-0.088***
-0.108***
-0.093***
-0.102***
-0.102***
-0.122***
(0.002) (0.001) (0.001) (0.001) (0.002) (0.001) (0.001) (0.001)
ELL -0.025***
-0.018***
-0.025***
-0.067***
-0.058***
-0.067***
-0.058***
-0.094***
(0.002) (0.003) (0.002) (0.003) (0.002) (0.003) (0.002) (0.003)
Special education -0.127***
-0.127***
-0.113***
-0.198***
-0.207***
-0.207***
-0.196***
-0.312***
(0.002) (0.002) (0.003) (0.002) (0.002) (0.002) (0.003) (0.002)
Achievement Q1 (reference: Q4) -1.762***
-1.682***
(0.004) (0.003)
Achievement Q2 -1.115***
-1.091***
(0.003) (0.003)
Achievement Q3 -0.643***
-0.604***
(0.003) (0.003)
Prior achievement (Math or ELA) 0.752***
0.752***
0.752***
0.704***
0.704***
0.704***
(0.001) (0.001) (0.001) (0.001) (0.001) (0.001)
Specialization * FRL -0.012***
-0.014***
(0.002) (0.002)
Specialization * ELL -0.012**
0.015***
(0.004) (0.004)
Specialization * Special education -0.024***
-0.019***
(0.004) (0.003)
Specialization * Achievement Q1 -0.082***
0.000
(0.006) (0.004)
Specialization * Achievement Q2 -0.091***
0.004
(0.005) (0.004)
Specialization * Achievement Q3 -0.062***
-0.014***
(0.005) (0.004)
Constant 0.026* 0.029
* 0.028
* 0.949
*** -0.011 -0.006 -0.008 0.855
***
(0.013) (0.013) (0.013) (0.015) (0.012) (0.012) (0.012) (0.013)
Teacher Fixed Effects X X X X X X X X
N (student-year cases) 1789158 1789158 1789158 1789158 1783212 1783212 1783212 1783212
Note. * p < 0.05,
** p < 0.01,
*** p < 0.01. FRL= free or reduced-price lunch eligibility. ELL= English language learners. All models include teacher, school, grade, and
year fixed effects. In addition, we control for student level controls (i.e., prior achievement, gender, race/ethnicity, FRL, ELL, enrollment in special education,
class size), teacher level controls (i.e., graduate degree and new to school), and school level controls (i.e., school-level achievement, % Black, % Hispanic, %
FRL, and school enrollment). For ELA achievement outcome, we include ELA teacher specialization in the models. The data are based on teacher-year data from
2010-11 to 2016-17 academic year in Indiana for students in fourth and fifth grades. We cluster standard errors at the school level.

23
Table 6: Teacher Specialization and School Level Achievement across School Characteristics
School level math achievement School level reading achievement
% Specialization -0.013 -0.028 -0.024 0.010 -0.008 -0.013 -0.004 -0.001
(0.013) (0.029) (0.015) (0.014) (0.010) (0.018) (0.011) (0.011)
% Specialization * % FRL 0.000 0.000
(0.001) (0.001)
% Specialization * % Black and Hispanic -0.000 -0.000
(0.000) (0.000)
% Specialization * prior year school achievement -0.036 -0.0038*
(0.028) (0.018)
Constant 0.112** 0.119** 0.111** 0.155*** 0.103*** 0.100*** 0.097*** 0.103**
(0.036) (0.036) (0.036) (0.045) (0.028) (0.029) (0.028) (0.036)
N (school-grade cases) 16082 16082 16082 13829 16076 16076 16076 13824
Note: * p < 0.05,
** p < 0.01,
*** p < 0.01. All models include school fixed effects. FRL= free or reduced-price lunch. All models control for % FRL, % Black and
Hispanic students, school size, % teachers who are new to school, % teachers with graduate degree. We cluster standard errors at the school level.
24
Table 7: Teacher Specialization and School Level Absence and Discipline across School Characteristics
School Absences School Discipline
% Specialization 0.086 -0.047 0.003 0.008 -0.003 -0.000 -0.000 -0.005
(0.059) (0.170) (0.048) (0.069) (0.002) (0.005) (0.002) (0.003)
% Specialization * % FRL -0.001 -0.000
(0.007) (0.000)
% Specialization * % Black and Hispanic -0.004 0.000
(0.003) (0.000)
% Specialization * Prior year school achievement -0.154 -0.010
(0.243) (0.009)
Constant 1.173*** 1.162*** 1.145*** 1.074** 0.043*** 0.042*** 0.043*** 0.051*
(0.283) (0.289) (0.287) (0.386) (0.011) (0.011) (0.011) (0.014)
N (school-grade cases) 16076 16076 16076 13824 16076 16076 16076 13824
Note: * p < 0.05,
** p < 0.01,
*** p < 0.01. FRL= free or reduced-price lunch. All models control for % FRL, % Black and Hispanic students, school size, %
teachers who are new to school, % teachers with graduate degree. We cluster standard errors at the school level.
25
Appendix Table 1: Number of Subjects in a Given Year for Teachers
Subjects to teach Percent
One subject
Only math 2.53
Only reading 10.03
Two subjects
Math and reading 10.21
Math and social studies 0.56
Math and science 1.68
Reading and social science 4.01
Reading and science 1.34
Three subjects
Math, reading, science 4.12
Math, reading, and social studies 4.47
Reading, science, and social studies 4.63
Math, science, and social studies 2.03
All four main subjects 54.39
N (Teacher-year cases) 55,518
Note. The table is based on teacher-year data from 2010-11 to 2016-17 academic year for students in grades 4 and 5.

26
Appendix Table 2: Teacher Specialization and Student Achievement by Free-Reduced Lunch, English Language Learner, and Special Education Enrollment Math Reading
FRL Non-FRL ELL Non-ELL SPED Non-SPED FRL Non-FRL ELL Non-ELL SPED Non-SPED
Specialization -0.047***
-0.034***
-0.049* -0.040
*** -0.024
* -0.043
*** -0.022
*** -0.005 -0.019 -0.015
*** -0.027
*** -0.012
**
(0.007) (0.007) (0.020) (0.006) (0.011) (0.006) (0.004) (0.005) (0.010) (0.004) (0.007) (0.004)
Prior Achievement 0.746***
0.755***
0.734***
0.752***
0.689***
0.760***
0.712***
0.695***
0.691***
0.703***
0.715***
0.699***
(0.002) (0.002) (0.003) (0.002) (0.003) (0.002) (0.001) (0.002) (0.004) (0.002) (0.003) (0.002)
Female 0.006***
0.003* 0.011
** 0.004
*** -0.018
*** 0.007
*** 0.081
*** 0.091
*** 0.083
*** 0.086
*** 0.054
*** 0.091
***
(0.001) (0.001) (0.004) (0.001) (0.003) (0.001) (0.001) (0.001) (0.003) (0.001) (0.003) (0.001)
Special education -0.121***
-0.136***
-0.129***
-0.127***
-0.197***
-0.217***
-0.211***
-0.207***
(0.003) (0.003) (0.007) (0.002) (0.003) (0.003) (0.008) (0.002)
FRL -0.041***
-0.089***
-0.080***
-0.088***
-0.042***
-0.103***
-0.081***
-0.104***
(0.006) (0.001) (0.003) (0.001) (0.006) (0.001) (0.003) (0.002)
ELL -0.035***
-0.023***
-0.033***
-0.021***
-0.062***
-0.069***
-0.052***
-0.059***
(0.003) (0.005) (0.008) (0.003) (0.004) (0.005) (0.008) (0.003)
Black -0.085***
-0.102***
-0.043***
-0.094***
-0.112***
-0.089***
-0.077***
-0.104***
-0.006 -0.092***
-0.078***
-0.090***
(0.003) (0.004) (0.012) (0.003) (0.006) (0.003) (0.003) (0.005) (0.014) (0.003) (0.006) (0.003)
Hispanic -0.000 -0.040***
-0.078***
-0.011***
-0.020**
-0.017***
0.016***
-0.026***
-0.070***
0.004 0.010 -0.002
(0.003) (0.003) (0.009) (0.002) (0.006) (0.002) (0.003) (0.003) (0.010) (0.003) (0.006) (0.002)
Asian 0.180***
0.143***
0.132***
0.152***
0.147***
0.155***
0.174***
0.125***
0.094***
0.145***
0.122***
0.143***
(0.007) (0.005) (0.019) (0.005) (0.017) (0.005) (0.007) (0.006) (0.020) (0.005) (0.016) (0.005)
Other race -0.024***
-0.021***
-0.023 -0.025***
-0.036***
-0.023***
-0.011***
-0.016***
-0.018 -0.017***
-0.011 -0.016***
(0.002) (0.003) (0.020) (0.002) (0.006) (0.002) (0.003) (0.003) (0.020) (0.002) (0.006) (0.002)
Graduate Degree 0.013 0.019* -0.028 0.016
* 0.016 0.015 -0.003 0.022
** -0.009 0.011 0.020 0.007
(0.009) (0.008) (0.027) (0.007) (0.016) (0.008) (0.007) (0.008) (0.021) (0.006) (0.013) (0.007)
New to school -0.023***
-0.025***
-0.016 -0.024***
-0.012 -0.026***
-0.010* -0.004 -0.011 -0.007 -0.014 -0.007
(0.005) (0.005) (0.013) (0.005) (0.009) (0.005) (0.004) (0.005) (0.011) (0.004) (0.008) (0.004)
Class size 0.001* 0.001
** -0.000 0.001
** 0.002
*** 0.001
* 0.001
*** 0.002
*** 0.001
** 0.002
*** 0.002
*** 0.001
***
(0.000) (0.000) (0.001) (0.000) (0.000) (0.000) (0.000) (0.000) (0.001) (0.000) (0.001) (0.000)
School level
achievement
0.477***
0.505***
0.554***
0.478***
0.528***
0.476***
0.387***
0.436***
0.401***
0.404***
0.397***
0.406***
(0.012) (0.014) (0.033) (0.011) (0.021) (0.011) (0.011) (0.012) (0.029) (0.010) (0.018) (0.010)
% Black at school 0.002***
0.002***
0.002 0.002***
0.003***
0.002***
0.003***
0.002***
0.003***
0.002***
0.003***
0.002***
(0.000) (0.001) (0.001) (0.000) (0.001) (0.000) (0.000) (0.000) (0.001) (0.000) (0.001) (0.000)
% Hispanic at school 0.000 -0.000 -0.002 -0.000 -0.001 0.000 0.001 0.001 -0.000 0.000 -0.001 0.001
27
(0.000) (0.001) (0.001) (0.000) (0.001) (0.000) (0.000) (0.001) (0.001) (0.000) (0.001) (0.000)
% of FRL at school 0.002***
0.003***
0.003***
0.003***
0.003***
0.003***
0.001**
0.003***
0.002* 0.002
*** 0.002
*** 0.002
***
(0.000) (0.000) (0.001) (0.000) (0.001) (0.000) (0.000) (0.000) (0.001) (0.000) (0.000) (0.000)
School enrollment -0.000***
-0.000***
-0.000***
-0.000***
-0.000***
-0.000***
-0.000***
-0.000***
-0.000***
-0.000***
-0.000***
-0.000***
(0.000) (0.000) (0.000) (0.000) (0.000) (0.000) (0.000) (0.000) (0.000) (0.000) (0.000) (0.000)
Constant -0.011 -0.017 0.142***
0.024 -0.179***
0.033* -0.050
*** -0.064
*** 0.031 -0.010 -0.227
*** -0.006
(0.015) (0.016) (0.038) (0.013) (0.024) (0.014) (0.014) (0.014) (0.034) (0.012) (0.023) (0.012)
N 840309 947485 105069 1681223 216276 1571031 835062 946458 102154 1677792 211133 1569743
Note. * p < 0.05,
** p < 0.01,
*** p < 0.01. FRL= free or reduced-price lunch eligibility. ELL= English language learners. All models include teacher, school,
grade, and year fixed effects. For ELA achievement outcome, we include ELA teacher specialization in the models. The data are based on teacher-year data from
2010-11 to 2016-17 academic year in Indiana for students in fourth and fifth grades. We cluster standard errors at the school level.

28
Appendix Table 3: Teacher Specialization and Student Achievement across Achievement Levels
Math Reading
Lowest
Quartile
2nd
Quartile
3nd
Quartile
Highest
Quartile
Lowest
Quartile
2nd
Quartile
3nd
Quartile
Highest
Quartile
Specialization -0.032***
-0.035***
-0.043***
-0.045***
-0.024***
-0.020***
-0.010 0.002
(0.008) (0.008) (0.008) (0.010) (0.005) (0.005) (0.006) (0.007)
Prior Achievement 0.564***
0.835***
0.871***
0.544***
0.585***
0.809***
0.812***
0.461***
(0.003) (0.004) (0.004) (0.003) (0.003) (0.005) (0.005) (0.003)
Female 0.011***
0.012***
0.011***
-0.009***
0.078***
0.075***
0.086***
0.118***
(0.002) (0.002) (0.002) (0.002) (0.002) (0.002) (0.002) (0.002)
Special education -0.141***
-0.124***
-0.107***
-0.086***
-0.253***
-0.176***
-0.128***
-0.085***
(0.004) (0.003) (0.004) (0.005) (0.003) (0.003) (0.005) (0.006)
FRL -0.070***
-0.070***
-0.072***
-0.103***
-0.072***
-0.084***
-0.094***
-0.125***
(0.002) (0.002) (0.002) (0.002) (0.002) (0.002) (0.002) (0.003)
ELL -0.044***
-0.008 -0.008 0.002 -0.079***
-0.040***
-0.024***
-0.007
(0.005) (0.004) (0.005) (0.007) (0.005) (0.005) (0.006) (0.007)
Black -0.089***
-0.077***
-0.075***
-0.099***
-0.070***
-0.076***
-0.080***
-0.110***
(0.004) (0.004) (0.004) (0.006) (0.004) (0.004) (0.005) (0.007)
Hispanic -0.007* -0.009
** -0.016
*** -0.026
*** 0.017
*** 0.016
*** -0.004 -0.033
***
(0.004) (0.003) (0.003) (0.004) (0.004) (0.004) (0.004) (0.005)
Asian 0.132***
0.131***
0.122***
0.172***
0.116***
0.130***
0.139***
0.146***
(0.011) (0.008) (0.007) (0.008) (0.011) (0.010) (0.009) (0.008)
Other race -0.025***
-0.026***
-0.015***
-0.012* -0.007 -0.010
** -0.020
*** -0.011
*
(0.004) (0.004) (0.004) (0.005) (0.004) (0.004) (0.004) (0.005)
Graduate Degree 0.012 0.018 0.014 0.007 0.016 0.002 0.011 0.017
(0.012) (0.010) (0.009) (0.013) (0.009) (0.009) (0.008) (0.012)
New to school -0.023***
-0.023***
-0.014* -0.030
*** -0.008 -0.008 -0.012
* -0.004
(0.006) (0.006) (0.006) (0.008) (0.005) (0.005) (0.006) (0.007)
Class size 0.001* 0.001 0.001
** -0.000 0.001
*** 0.001
*** 0.002
*** 0.001
(0.000) (0.000) (0.000) (0.000) (0.000) (0.000) (0.001) (0.001)
School level
achievement
0.508***
0.456***
0.455***
0.507***
0.415***
0.397***
0.398***
0.422***
(0.014) (0.013) (0.015) (0.019) (0.013) (0.013) (0.013) (0.016)
% Black at school 0.002***
0.002***
0.002***
0.001 0.003***
0.002***
0.002***
0.001
(0.000) (0.000) (0.000) (0.001) (0.000) (0.000) (0.001) (0.001)
% Hispanic at
school
0.000 0.000 -0.000 -0.001 -0.000 0.001 0.001 0.000
(0.001) (0.001) (0.001) (0.001) (0.000) (0.001) (0.001) (0.001)
% of FRL at school 0.002***
0.002***
0.003***
0.003***
0.001***
0.001***
0.002***
0.003***
(0.000) (0.000) (0.000) (0.000) (0.000) (0.000) (0.000) (0.000)
School enrollment -0.000***
-0.000***
-0.000***
-0.000***
-0.000***
-0.000***
-0.000***
-0.000*
(0.000) (0.000) (0.000) (0.000) (0.000) (0.000) (0.000) (0.000)
Constant -0.198***
0.005 -0.013 0.348***
-0.140***
0.006 -0.049**
0.262***
(0.017) (0.016) (0.017) (0.023) (0.017) (0.014) (0.015) (0.019)
N 438717 452959 453042 440195 435200 451140 449151 442833
Note. * p < 0.05,
** p < 0.01,
*** p < 0.001. FRL= free or reduced-price lunch eligibility. ELL= English language
learners. All models include teacher, school, grade, and year fixed effects. For ELA achievement outcome, we
include ELA teacher specialization in the models. The data are based on teacher-year data from 2010-11 to 2016-17
academic year in Indiana for students in fourth and fifth grades. We cluster standard errors at the school level.
29
Appendix Table 4: Teacher Specialization and School Level Achievement across School Characteristics School level math achievement School level reading achievement
% Specialization -0.003 -0.028 0.000 0.014 -0.015 -0.008 -0.001 -0.000
(0.015) (0.029) (0.019) (0.016) (0.011) (0.022) (0.013) (0.014)
% Specialization * % FRL 0.001 -0.000
(0.001) (0.001)
% Specialization * % Black and Hispanic -0.000 -0.001
(0.001) (0.000)
% Specialization * prior year school achievement -0.063 -0.021
(0.062) (0.050)
Constant 0.112** 0.119** 0.111** 0.155*** 0.103*** 0.100*** 0.097*** 0.103**
(0.036) (0.036) (0.036) (0.045) (0.028) (0.029) (0.028) (0.036)
N 7527 7527 7527 5957 7527 7527 7527 5957
Note: * p < 0.05,
** p < 0.01,
*** p < 0.01. The data are based on school-year data from 2010-11 to 2016-17 academic year in Indiana for students in fourth and
fifth grades. We cluster standard errors at the school level. FRL= free or reduced-price lunch. All models control for % FRL, % Black and Hispanic students,
school size, % teachers who are new to school, % teachers with graduate degree, and school fixed effects.

30
Appendix Table 5: Teacher Specialization and School Level Absence and Discipline across School Characteristics School Absences School Discipline
% Specialization 0.007 -0.013 0.007 0.006 -0.004 -0.003 -0.004 0.000
(0.012) (0.024) (0.016) (0.013) (0.005) (0.011) (0.006) (0.004)
% Specialization * % FRL 0.001 -0.000
(0.001) (0.000)
% Specialization * % Black and Hispanic 0.000 0.000
(0.000) (0.000)
% Specialization * Prior year school achievement -0.037 -0.007
(0.036) (0.024)
Constant 0.404*** 0.409*** 0.404*** 0.376*** 0.063*** 0.063*** 0.063*** 0.045*
(0.032) (0.033) (0.032) (0.047) (0.017) (0.017) (0.018) (0.022)
N 7526 7526 7526 5956 7526 7526 7526 5956
Note: * p < 0.05,
** p < 0.01,
*** p < 0.01. The data are based on school-year data from 2010-11 to 2016-17 academic year in Indiana for students in fourth and
fifth grades. We cluster standard errors at the school level. FRL= free or reduced-price lunch. All models control for % FRL, % Black and Hispanic students,
school size, % teachers who are new to school, % teachers with graduate degree, and school fixed effects.

31
Appendix Table 6: Teacher Specialization and Student Achievement by Student-Teacher Repeated Matches
Math ELA
Specialization -0.040***
-0.015***
(0.006) (0.003)
Repeating student-teacher matching 0.028***
0.027***
(0.007) (0.006)
Specialization * Repeating student-teacher matching 0.020* -0.004
(0.009) (0.007)
Constant 0.030* -0.009
(0.013) (0.012)
N (Student-year cases) 1787311 1781393
Note. * p < 0.05,
** p < 0.01,
*** p < 0.01. All models include teacher, school, grade, and year fixed effects. In
addition, we control for student level controls (i.e., prior achievement, gender, race/ethnicity, FRL, ELL, enrollment
in special education, class size), teacher level controls (i.e., graduate degree and new to school), and school level
controls (i.e., school-level achievement, % Black, % Hispanic, % FRL, and school enrollment). For ELA
achievement outcome, we include ELA teacher specialization in the models. The data are based on teacher-year data
from 2010-11 to 2016-17 academic year in Indiana for students in fourth and fifth grades. We cluster standard errors
at the school level.