
SPPI Monthly CO Report
31
SPPI Monthly CO2 Report April 2009 | Volume 1 | Issue 4 Christopher Monckton, Editor ♦ www.scienceandpublicpolicy.org
Transcript of SPPI Monthly CO Report

SPPI Monthly CO2 ReportApril 2009 | Volume 1 | Issue 4
Christopher Monckton, Editor ♦ www.scienceandpublicpolicy.org

Five years’ ocean cooling disproves models.................................................................................................3
Five years’ global ocean cooling: reality yet again disobeys models.............................................................4
The cooling Northern Hemisphere: March 2009 vs. 1998-2006 .....................................................................5
CO2 concentration is rising, but still well below IPCC predictions ...............................................................6
IPCC predicts rapid, exponential CO2 growth that is not occurring .............................................................7
The 29-year global warming trend is just 2.5 °F (1.5 °C) per century ............................................................8
A long downtrend: 8 years’ global cooling at 1.8 °F (1 °C) / century ............................................................9
No correlation between CO2 concentration and temperature .....................................................................10
Sea level: Gore’s “Armageddon scenario” is not occurring ........................................................................11
Arctic sea-ice extent is at an eight-year record high for late April ..............................................................12
Antarctic sea-ice extent is at its third-greatest since records began ............................................................13
The regular “heartbeat” of global sea-ice extent: steady for 30 years..........................................................14
Hurricane, typhoon, & tropical cyclone activity are at a record low...........................................................15
Population growth, not ‘global warming,’ increases hurricane losses ........................................................16
The prolonged solar minimum continues, with very few sunspots............................................................17
Are we heading for a Maunder Minimum and a frozen Thames? ..............................................................18
How data revisionism prolongs a dying scare ...........................................................................................19
Your climate-sensitivity ready reckoner ....................................................................................................25
New Science ..............................................................................................................................................26
Valiant for truth: The top ten climate realists on the planet........................................................................29
Contents
2
5 years’ ocean cooling disproves modelsSPPI’s authoritative Monthly CO2 Report for April 2009 reveals that unpredicted ocean cooling over the pastfive years disproves the theory that manmade “global warming” has a significant effect on the Earth’s temperature.
None of the IPCC’s computer models had predicted ocean cooling. All had predicted ocean warming. They were wrong.
Rapid surface atmospheric cooling, especially in the Northern Hemisphere, has now continued for seven and a half years.
The IPCC assumes CO2 concentration will reach 836 [730, 1020] ppmv by 2100. However, for seven years, CO2
concentration has headed straight for only 575 ppmv by 2100. This alone halves all of the IPCC’s temperature projections.
Since 1980 temperature has risen at only 2.5 °F (1.5 °C) per century, not the 7 F° (3.9 C°) the IPCC imagines.
For 600 million years there has been no correlation between CO2 concentration and the Earth’s temperature.
Sea level rose just 8 inches in the 20th century and has been rising at just 1 ft/century since 1993. Though James Hansen ofNASA says sea level will rise 246 feet, sea level has scarcely risen since the beginning of 2006.
Sea ice extent in the Arctic is above the 30-year average, and has set a nine-year record high. In the Antarctic, sea ice extentreached a record high in 2007, and is now the third-highest in 30 years. Global sea ice extent shows little trend for 30 years.
The Accumulated Cyclone Energy Index is a 2-year running monthly sum of activity in all hurricanes, typhoons andtropical cyclones. It shows that there is now less severe tropical-storm activity than at any time in 30 years.
Solar activity is at a 100-year record low. We may be facing a 70-year Maunder Minimum – extreme cooling.
Science Focus this month studies “data revisionism” – how scientific results are bent to promote false alarmism.
Finally, check out our monthly selection of scientific papers, and meet the Top Ten “Global Warming” skeptics.
SPPI Monthly CO2 Report : : April 2009Accurate, Authoritative Analysis for Today’s Policymakers
3

Five years’ global ocean cooling: reality yet again disobeys models
Projected ocean warming vs. observed ocean cooling (x 1022 Joules: left scale): During the 5+ years since the deployment of 3300 automatedbathythermograph buoys throughout the world’s oceans, the oceans have not warmed as predicted by NASA/GISS: they have cooled, as shownin papers by Willis, and also by Loehle. In short, the models overestimate the anthropogenic effect on ocean heat sixfold to eightfold, in line withsimilar model-driven exaggerations of the diminution in outgoing long-wave radiation owing to additional atmospheric carbon dioxide, and inline with calculations (e.g. by Monckton, 2008) of the IPCC’s overestimate of climate sensitivity. The ocean cooling, when steady warmingwould be expected, proves the “high-climate-sensitivity” hypothesis false. Source: William DiPuccio.
4

The cooling Northern Hemisphere: March 2009 vs. 1998-2006
Visible cooling
The colored chart (right)shows changes in mean
surface temperatures for theprincipal regions of the
Northern Hemisphere inMarch 2009, compared with
mean surface temperaturesfor the same regions over theeight-year period 1998-2006.
Cooling is particularlyevident over central North
America, Alaska, and westernGreenland, though there has
been some warming overnorthern central Europe and
eastern Russia.
Overall, a pronouncedhemispheric cooling is clearly
visible, even though globalmean surface temperatures in
March 2008 had recoveredfrom the recently-ended la
Nina event.
Source: Ole Humlum
SPPI is always grateful toreceive charts and data
from scientists forinclusion here.
5

CO2 concentration is rising, but still well below IPCC predictions
CO2 is rising in a straight line, well below the IPCC’s projected range (pale blue region). The deseasonalized real-world data are shown as a thick, dark-blue line overlaid on the least-squares linear-regression trend. There is no sign of the exponential growth predicted by the IPCC. Data source: NOAA.
6
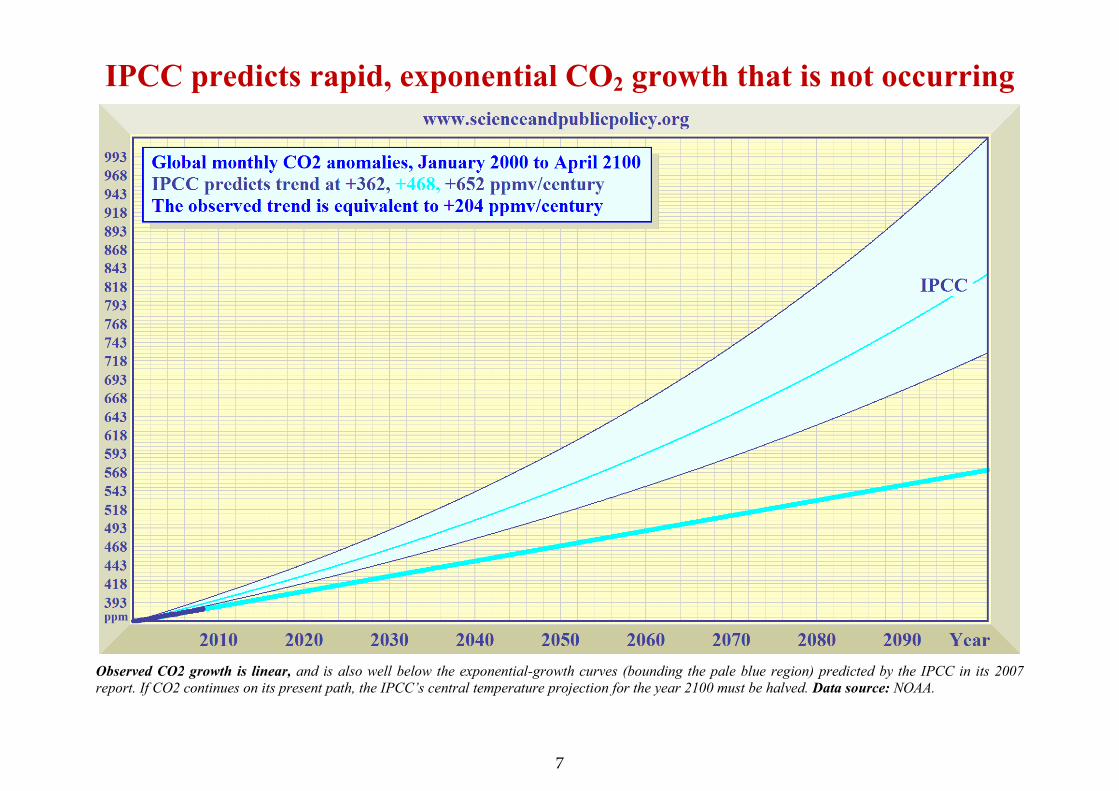
IPCC predicts rapid, exponential CO2 growth that is not occurring
Observed CO2 growth is linear, and is also well below the exponential-growth curves (bounding the pale blue region) predicted by the IPCC in its 2007report. If CO2 continues on its present path, the IPCC’s central temperature projection for the year 2100 must be halved. Data source: NOAA.
7

The 29-year global warming trend is just 2.5 °F (1.5 °C) per century
Global temperature for the past 29 full years has been undershooting the IPCC’s currently-predicted warming rates (pink region). The warming trend (thickred line) has been rising at well below half of the IPCC’s central estimate. Data source: SPPI index, compiled from HadCRUt3, NCDC, RSS, and UAH.
8

A long downtrend: 8 years’ global cooling at 1.8 °F (1 °C) / century
For eight and a half years, global temperatures have exhibited a pronounced downtrend. The IPCC’s predicted warming path (pink region) bears no relationto the global cooling that has been observed in the 21st century to date. Source: SPPI global temperature index.
9
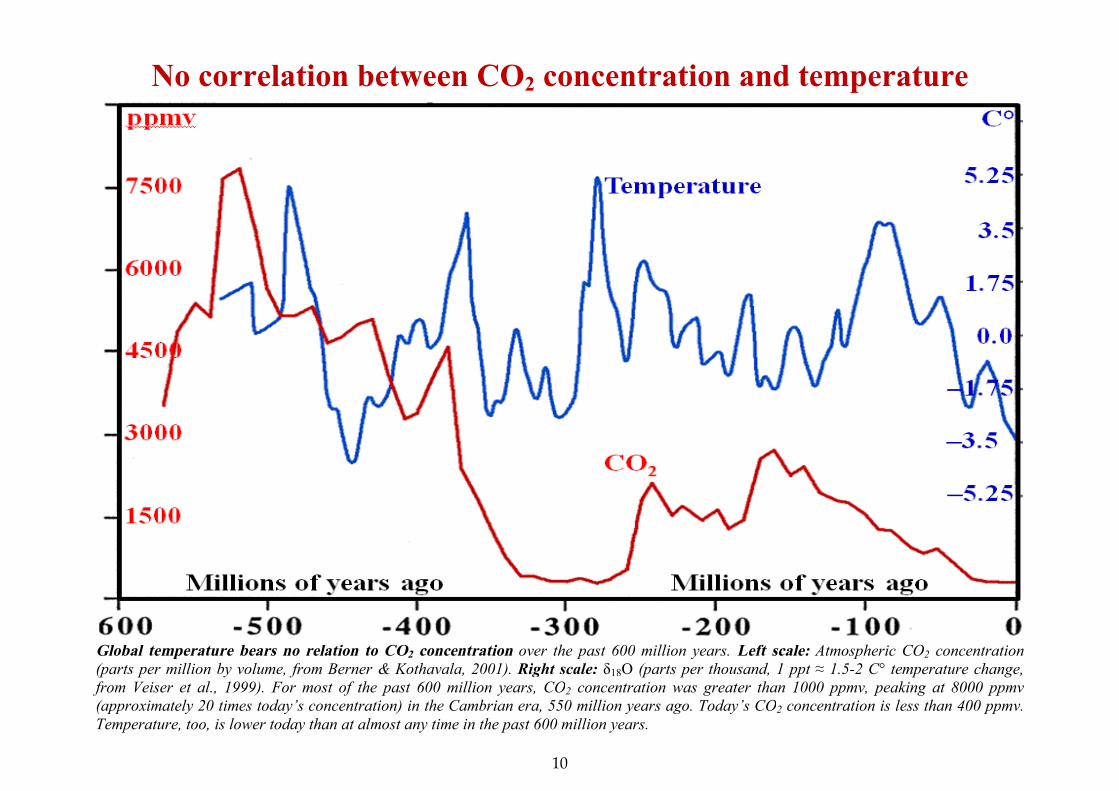
No correlation between CO2 concentration and temperature
Global temperature bears no relation to CO2 concentration over the past 600 million years. Left scale: Atmospheric CO2 concentration(parts per million by volume, from Berner & Kothavala, 2001). Right scale: δ18O (parts per thousand, 1 ppt ≈ 1.5-2 C° temperature change,from Veiser et al., 1999). For most of the past 600 million years, CO2 concentration was greater than 1000 ppmv, peaking at 8000 ppmv(approximately 20 times today’s concentration) in the Cambrian era, 550 million years ago. Today’s CO2 concentration is less than 400 ppmv.Temperature, too, is lower today than at almost any time in the past 600 million years.
10
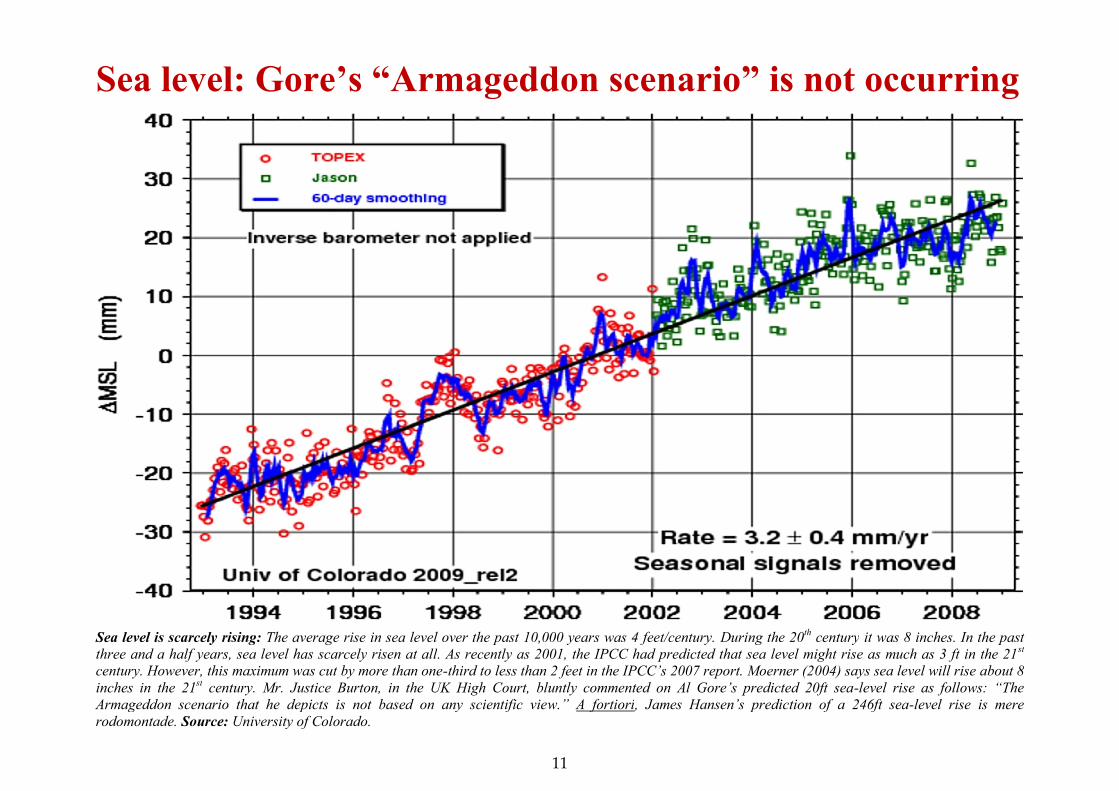
Sea level: Gore’s “Armageddon scenario” is not occurring
Sea level is scarcely rising: The average rise in sea level over the past 10,000 years was 4 feet/century. During the 20th century it was 8 inches. In the pastthree and a half years, sea level has scarcely risen at all. As recently as 2001, the IPCC had predicted that sea level might rise as much as 3 ft in the 21st
century. However, this maximum was cut by more than one-third to less than 2 feet in the IPCC’s 2007 report. Moerner (2004) says sea level will rise about 8inches in the 21st century. Mr. Justice Burton, in the UK High Court, bluntly commented on Al Gore’s predicted 20ft sea-level rise as follows: “TheArmageddon scenario that he depicts is not based on any scientific view.” A fortiori, James Hansen’s prediction of a 246ft sea-level rise is mererodomontade. Source: University of Colorado.
11

Arctic sea-ice extent is at an eight-year record high for late April
Arctic sea ice (millions of square kilometers: left scale): The red curve shows that the extent of sea ice in the Arctic is currently at an eight-year record highfor the time of year. This fact has not been reported in any mainstream news medium: it is to be found only in the SPPI Monthly CO2 Reports. Forcomparison, sea ice covered almost the same area of the Northern Hemisphere in April 2009 as it had done 29 years previously in April 1980. Summer seaice covered its least extent in 30 years during the late summer of 2007. However, NASA has attributed that sudden decline to unusual poleward movements ofheat transported by currents and winds. The decline cannot have been caused by “global warming”, because, as the SPPI Global Temperature Index shows,there has been a cooling trend globally during the past seven and a half years. At almost the same moment as summer sea-ice extent reached its 29-yearminimum in the Arctic, sea-ice extent in the Antarctic reached its 29-year maximum, though the latter event was very much less widely reported in the mediathan the former. Source: IARC JAXA, Japan.
12

Antarctic sea-ice extent is at its third-greatest since records began
Antarctic sea-ice extent (millions of square kilometers: left scale)shows a gentle but definite uptrend over the past 30 years. The peak extent, which occurredlate in 2007, followed shortly after the sharp decline in Arctic sea ice in the late summer of that year. Antarctic sea-ice extent is currently at its third-highestsince satellite records began. Source: University of Illinois, April 2009.
13

The regular “heartbeat” of global sea-ice extent: steady for 30 years
Planetary cardiogram showing global sea-ice area (millions of square kilometers): There has been a very slight decline in the trend (red) of global sea-iceextent over the decades, chiefly attributable to loss of sea ice in the Arctic during the summer, which was well below the mean in 2007, with some recovery in2008. However, the 2008 peak sea-ice extent was exactly on the 1979-2000 mean, and current sea-ice extent is a little above the 1979-2000 mean. Thedecline in summer sea-ice extent in the Arctic, reflected in the global sea-ice anomalies over most of the past eight years, runs counter to the pronouncedglobal atmospheric cooling trend over the same period, suggesting that the cause of the regional sea-ice loss cannot have been “global warming”. Seabedvolcanic activity recently reported in the Greenland/Iceland gap, with seabed temperatures of up to 574 °F, may have contributed to the loss of Arctic sea-ice.Source: University of Illinois, April 2009.
14
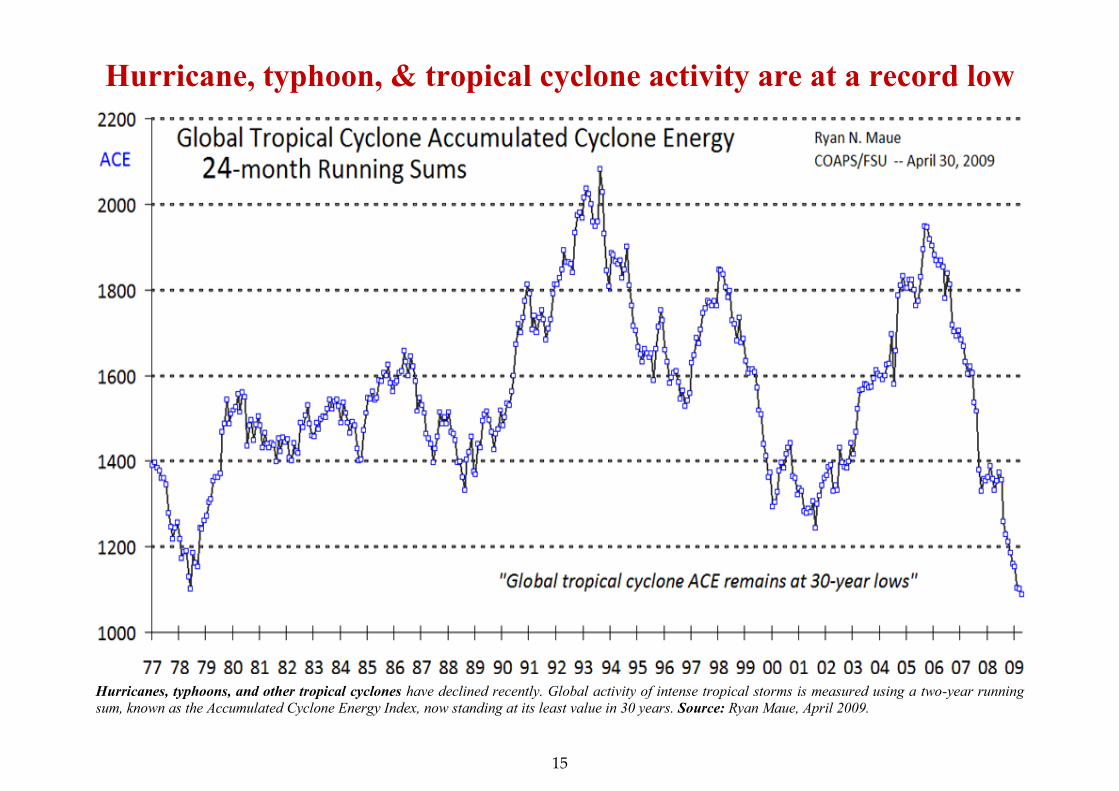
Hurricane, typhoon, & tropical cyclone activity are at a record low
Hurricanes, typhoons, and other tropical cyclones have declined recently. Global activity of intense tropical storms is measured using a two-year runningsum, known as the Accumulated Cyclone Energy Index, now standing at its least value in 30 years. Source: Ryan Maue, April 2009.
15

Population growth, not ‘global warming’, increases hurricane losses
Hurricane losses have not risen because of “global warming”: they have risen because there has been a substantial increase in the number of buildings inthe path of land-falling hurricanes. The upper panels show how Florida looked in 1920 and in 2007, showing the rapid growth in houses, hotels, andbusinesses. The lower panels show unadjusted hurricane losses (left) compared with losses after adjustment for inflation and population growth (right).
Miami, Florida, 2007Miami, Florida, 1920
16

The prolonged solar minimum continues, with very few sunspots
Upper panel: Sunspot numbers (red) from 13 February to 9 May, 2009. Current sunspot activity is less than for 100 years. Lower panel: Number of dayswithout any visible sunspots during the previous solar minimum (blue) and the present solar minimum (red). During the last ~11-year solar minimum, inSeptember/October 2006, the longest period without sunspots was 37 days, compared with 44 days in March/April 2009. Source: Jan Alvestad, April 2009.
17

Are we heading for a Maunder Minimum and a frozen Thames?
Mean sunspot numbers for the Maunder or Grand Solar Minimum (blue) and the current solar minimum (green). This intriguingcomparison, drawn by David Archibald and displayed recently at www.wattsupwiththat.com, raises the question whether the Sun is once again about to entera prolonged period of severe cooling similar to the 70-year Maunder Minimum from 1645 to 1715, during which there were almost no sunspots visible on thesolar surface and the rivers Thames and Hudson regularly froze over during the winter. The sharp downturn in solar activity over the past three yearsappears to match the recently-observed ocean cooling and the continuing decline in mean global surface temperatures. It is possible that the IPCC hasconsiderably underestimated the influence of the Sun on the Earth’s climate, correspondingly overestimating the influence of our carbon dioxide emissions.Source: Dr. David Archibald.
18

How data revisionism prolongs a dying scareAST MONTH Science Focus presented a discussion kindly supplied by Professor Richard Lindzen,demonstrating that satellite measurements of outgoing long-wave radiation from the Earth’s surfaceshowed 7-10 times as much escaping to space as the UN’s computer models had predicted, implying that the
UN has overestimated the effect of CO2 enrichment on global temperature 7-10fold.
The scale of this exaggeration is in line with the 6-8fold exaggeration of predicted ocean warming demonstrated earlier in thisMonthly CO2 Report. Ocean warming is another crucial but absent signature of anthropogenic “global warming” on the scaleimagined by the UN. The ocean cooling and the failure of observed outgoing long-wave radiation to match prediction are both inline with the climate-sensitivity calculations of Monckton (2008), Schwartz (2007), and many others, showing that theanthropogenic influence on global temperatures over the whole of the 20th century may be as little as 0.5 Celsius degrees (less than 1Fahrenheit degree).
Source: Rasmussen Polls, 2008-9
This powerful combination of empirical and theoretical results comes close to proving that the UNhas gotten its sums wrong, with potentially catastrophic consequences for nations, such as theUnited States, whose politicians labor under the misguided impression that promising to close downup to five-sixths of their economies in the name of “Saving The Planet” – a disaster for rich and pooralike, but especially for the poor – somehow demonstrates “leadership”. Fortunately, the people, atleast in the US, have seen through the “global warming” scare, perhaps because the relentlesspropaganda in the media, in Congress, and in the White House is simply too overdone to be credible.
Opinion polls, such as the Rasmussen tracking polls whose results are shown at left, demonstratethat there has been an astonishing reversal of public opinion over the past year in the US – in fact, a13.5% swing away from the alarmist belief that the “global warming” that ceased in 1998 is caused byhumankind’s activities. The tiny clique of financially and politically linked scientists and politicianswho are driving the “global warming” scare have long been aware that their propaganda was failing,and they have responded with some increasingly desperate revisions to the raw data. This month’sScience Focus provides some illustrations of what we shall call “data revisionism” – bendingscientific results to suit a failed theory.
L
SPPI Monthly CO2 Report : : Science FocusSpotlight on the changing science behind the changing climate
19

We begin with “data revisionism” as applied to the 2002 graph of outgoing long-wave radiation (top panel below) that we showed inlast month’s Science Focus. Four years later, the same authors, with the intriguing addition of one of the dozen or so scientists mostresponsible for fabricating and peddling the “global warming” scare, produced a second paper that revised the graph so that theobserved outgoing long-wave radiation came suspiciously close to the UN’s predictions (bottom panel). The pretext for this startlinginstance of data revisionism was that the authors of the 2002 paper had failed to take into account the orbital degradation of theEarth Radiation Budget Experiment Satellite (center panel) –
Observed (red) long-wave flux anomalies in Watts per square meter for the tropics against the mean of five climatemodel simulations (black) using observed sea surface temperature, and the total range of model-predictedanomalies (gray band). Top panel: The original graph. Bottom panel: the revised graph published four yearslater, allegedly to take account of orbital degradation in the ERBE satellite (in kilometers: center panel).
20
We leave it to readers of Science Focus to decide for themselves whether the scientists who produced the first graph could possiblyhave made so fundamental an error as to fail to allow for the fact that every satellite tends to move closer to the Earth with eachorbit. However, it is startlingly evident that the adjustments to the lower graph do not correspond at all well with the non-uniformchanges in the rate of orbital degradation shown in the center panel.
It is also worth recalling that the results obtained in the 2002 paper, which were reached by inadvertence because the authors werenot considering the impact on “global warming” at all, were sufficiently startling to induce many other research groups to replicatethe results. At least four groups did so, as reported in last month’s Science Focus -
CHEN, J., B.E. Carlson, and A.D. Del Genio. 2002. Evidence for strengthening of the tropical general circulation in the 1990s.Science 295: 838-841.
CESS, R.D., and P.M. Udelhofen. 2003. Climate change during 1985–1999: Cloud interactions determined from satellitemeasurements. Geophys. Res. Ltrs. 30:1: 1019, doi:10.1029/2002GL016128.
HATZIDIMITRIOU, D., I. Vardavas, K. G. Pavlakis, N. Hatzianastassiou, C. Matsoukas, and E. Drakakis. 2004. On thedecadal increase in the tropical mean outgoing longwave radiation for the period 1984–2000. Atmos. Chem. Phys. 4: 1419–1425.
CLEMENT, A.C., and B. Soden. 2005. The sensitivity of the tropical-mean radiation budget. J. Clim. 18: 3189-3203.
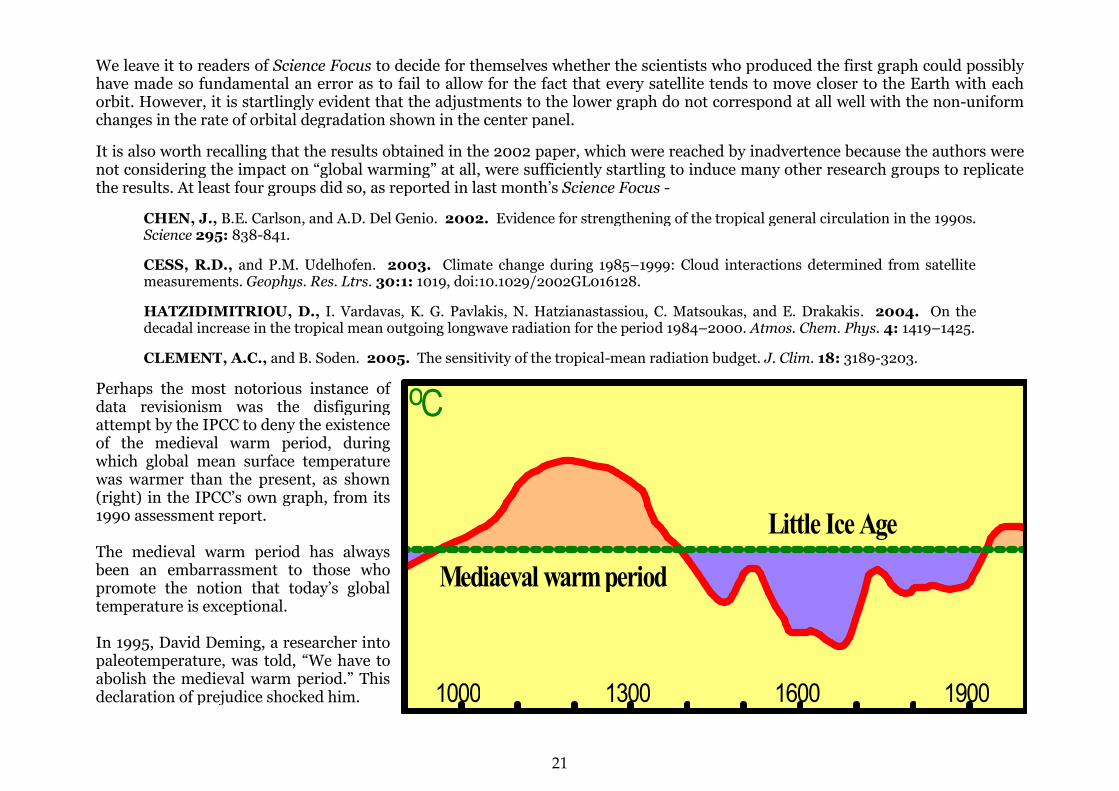
Perhaps the most notorious instance ofdata revisionism was the disfiguringattempt by the IPCC to deny the existenceof the medieval warm period, duringwhich global mean surface temperaturewas warmer than the present, as shown(right) in the IPCC’s own graph, from its1990 assessment report.
The medieval warm period has alwaysbeen an embarrassment to those whopromote the notion that today’s globaltemperature is exceptional.
In 1995, David Deming, a researcher intopaleotemperature, was told, “We have toabolish the medieval warm period.” Thisdeclaration of prejudice shocked him.
Mediaeval warmperiod
Little Ice Age
1000 1300 1600 1900
oC
21

Sure enough, by the time of the IPCC’s 2001 report the medieval warm period had been duly abolished, by the use of a series of
highly questionable statistical techniques that demonstrate how data revisionism is practiced by the pedlars of “global warming” –
Now you see it, now you don’t: The medieval warm period is absent from the IPCC’s 2001 graph of northern-hemispheretemperature. Nor is that the only irregularity. Instrumental measurements show that global temperature increased by 0.74Celsius degrees from 1900-2000: here, however, the increase appears to be closer to 1.2 Celsius degrees, an increase of 60% overreal-world observation.
22

How was this remarkable feat achieved? Read http://scienceandpublicpolicy.org/monckton/what_hockey_stick.html, which fullyexplains the corrupt science that produced the IPCC’s bent graph. See also www.co2science.org, where the medieval warm perioddatabase contains papers by almost 700 scientists from more than 400 institutions in 40 countries, establishing beyondreasonable doubt that the medieval warm period was real, was global, and was warmer than the present. After widespread protestby the scientific community, the National Research Council in the US considered the question of the graph that abolished themedieval warm period, and concluded that it had a validation skill not significantly different from zero – in effect, that it wasuseless. The NRC produced its own graph that partially restored the medieval warm period (upper panel below) –
Gradual re-emergence of the medieval warm period: The NRC (upper panel) partially restored themedieval warm period. However, the pale blue curve is merely a part of a longer dataset (lower panel) that, if theNRC had presented it in full, would have demonstrated the medieval warm period by Bayesian probabilities basedon 600 borehole measurements (Huang et al., 1998: data supplied by Huang and processed by McKitrick, 2005).
Another example of data revisionism will be found in the IPCC’s statistically-disreputable attempt, in its 2007 report, to pretendthat the rate of “global warming” has been accelerating for more than a century (see the Monthly CO2 Report for January 2009).
23
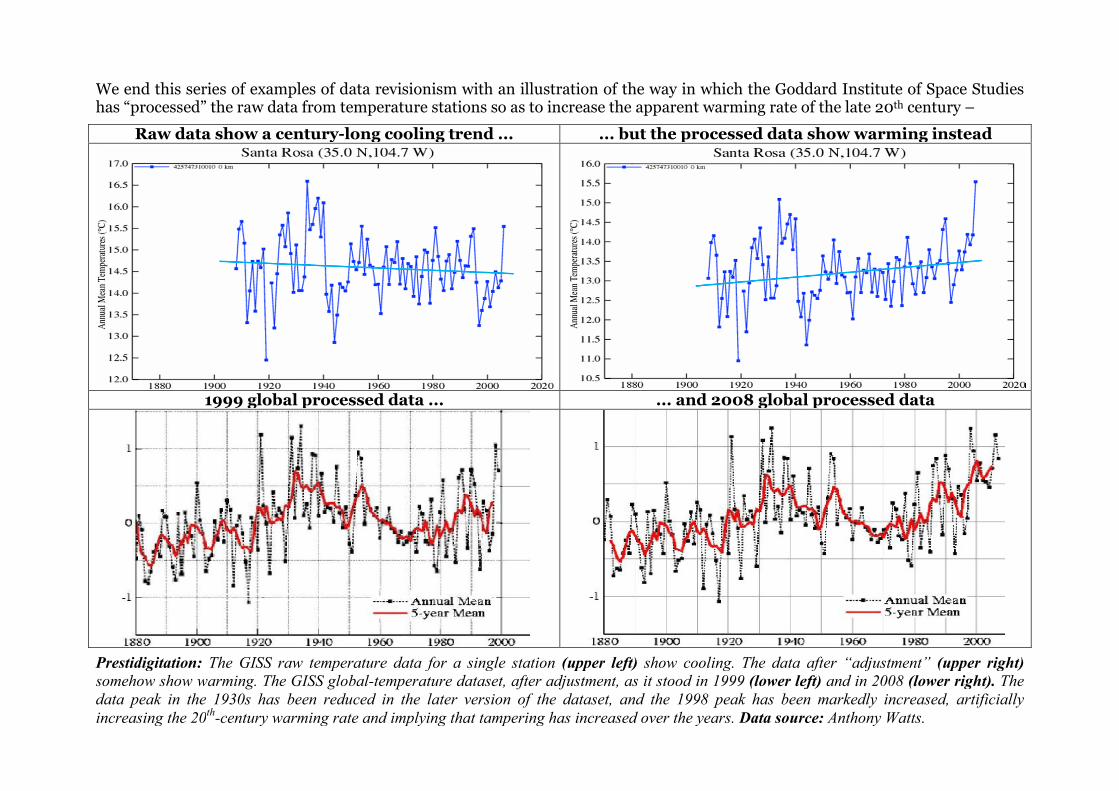
We end this series of examples of data revisionism with an illustration of the way in which the Goddard Institute of Space Studieshas “processed” the raw data from temperature stations so as to increase the apparent warming rate of the late 20th century –
Raw data show a century-long cooling trend ... ... but the processed data show warming instead
1999 global processed data ... ... and 2008 global processed data
Prestidigitation: The GISS raw temperature data for a single station (upper left) show cooling. The data after “adjustment” (upper right)somehow show warming. The GISS global-temperature dataset, after adjustment, as it stood in 1999 (lower left) and in 2008 (lower right). Thedata peak in the 1930s has been reduced in the later version of the dataset, and the 1998 peak has been markedly increased, artificiallyincreasing the 20th-century warming rate and implying that tampering has increased over the years. Data source: Anthony Watts.

24

Your climate-sensitivity ready reckonerHere is a step-by-step, do-it-yourself ready-reckoner which will let you use a pocket calculator to make your owninstant estimate of global temperature change in response to increases in atmospheric CO2 concentration.
STEP 1: Decide how far into the future you want your forecast to go, and estimate how much CO2 will be in the atmosphere atthat date. Example: Let us do a forecast to 2100. The Monthly CO2 Report charts show CO2 rising to C = 575 parts permillion by the end of the century, compared with B = 385 parts per million in late 2008.
STEP 2: Next, work out the proportionate increase C/B in CO2 concentration. In our example, C/B = 575/385 = 1.49.
STEP 3: Take the natural logarithm ln(C/B) of the proportionate increase. If you have a scientific calculator, find the naturallogarithm directly using the “ln” button. If not, look up the logarithm in the table below. In our example, ln 1.49 = 0.40.
n 1.05 1.10 1.15 1.20 1.25 1.30 1.35 1.40 1.45 1.50 1.55 1.60 1.65 1.70 1.75 1.80 1.85 1.90 1.95 2.00
ln 0.05 0.10 0.14 0.18 0.22 0.26 0.30 0.34 0.37 0.41 0.44 0.47 0.50 0.53 0.56 0.59 0.62 0.64 0.67 0.69n 2.05 2.10 2.15 2.20 2.25 2.30 2.35 2.40 2.45 2.50 2.55 2.60 2.65 2.70 2.75 2.80 2.85 2.90 2.95 3.00
ln 0.72 0.74 0.77 0.79 0.81 0.83 0.85 0.88 0.90 0.92 0/94 0.96 0.97 0.99 1.01 1.03 1.05 1.06 1.08 1.10
STEP 4: Choose a climate sensitivity coefficient c from the table below –
Coefficient c ... SPPI minimum SPPI central SPPI maximum IPCC minimum IPCC central IPCC maximum
... for C° 0.7 1.4 2.1 2.9 4.7 6.5
... for F° 1.25 2.50 3.75 5.25 8.5 11.75
STEP 5: Find the temperature change ΔT by multiplying the natural logarithm of the proportionate increase in CO2
concentration by your climate sensitivity coefficient. In our example, we’ll chose the IPCC central estimate c = 3.75 F. Then –
ΔT = c ln(C/B) = 3.75 x 0.40 = 1.5 F°, your predicted manmade warming to 2100. It’s as simple as that!
25

The Monthly CO2 Report summarizes key recent scientific papers, selected from those featured weekly at www.co2science.org, that significantlyadd to our understanding of the climate question. This month we review papers about the effects of “global warming” on North Atlantic andNorthern European storminess, West Antarctic Ice Sheet collapse, ocean acidification of marine coccolithophores, and viral diseases. Our finalpaper gives evidence that the Middle Ages were warmer than today.
Thirty-Second Summary
There is "no sign of a sustained enhanced storminess signal associated with 'global warming'." The transition time for a total collapse of the West Antarctic ice sheet would range from "1000 to several thousand years." "In the real ocean the larger coccolithophore species increase their calcification in response to anthropogenic CO2 release,"
contrary to what typically occurs in the lifeless "virtual ocean" of certain theoreticians. By far and away the most significant cause of enhanced viral diseases in recent years has not been global warming. 697 scientists from 406 institutions in 40 countries on the www.co2science.org Medieval Warm Period database say the Middle
Ages were warmer than today.
Northern European and North Atlantic Storminess
Hanna, E., Cappelen, J., Allan, R., Jonsson, T., Le Blanco, F., Lillington, T. and Hickey, K. 2008. New insights into North European and North Atlantic surfacepressure variability, storminess, and related climatic change since 1830. Journal of Climate 21: 6739-6766.
Among the highly publicized changes in weather phenomena that are predicted by climate alarmists to attend the ongoing rise in the air's CO2
content are increases in the frequency and severity of nearly all types of storms. This contentious claim is a most appropriate backdrop for thestudy of Hanna et al., who studied the temporal variability of the new dp(abs)24 pressure-variability index over the past 160 years via dataobtained from "long-running meteorological stations in Denmark, the Faroe Islands, Greenland, Iceland, the United Kingdom, and Ireland," afterfirst showing that the index is "significantly related to wind speed and is therefore a good measure of Atlantic and Northwest Europeanstorminess and climatic variation." The results indicated that there were "periods of relatively high dp(abs)24 and enhanced storminess around
SPPI Monthly CO2 Report : : New ScienceBREAKING NEWS IN THE JOURNALS, FROM www.co2science.org
26

1900 and the early to mid-1990s, and a relatively quiescent period from about 1930 to the early 1960s, in keeping with earlier studies." However,they report "there is little evidence that the mid- to late nineteenth century was less stormy than the present, and there is no sign [ouritalics] of a sustained enhanced storminess signal associated with 'global warming'." And in further discussing their findings, theresearchers say their analysis "lends a cautionary note to those who suggest that anthropogenic greenhouse warming probably results inenhanced extratropical storminess, as this is indicated neither by our own nor existing published observational results for the northeast Atlanticfor the last ~150 years."
The West Antarctic Ice Sheet: How Fast Could It Collapse?
Pollard, D. and DeConto, R.M. 2009. Modelling West Antarctic ice sheet growth and collapse through the past five million years. Nature 458: 329-332. Huybrechts, P. 2009. West-side story of Antarctic ice. Nature 458: 295-296.
Employing a greatly-improved "ice sheet/ice shelf model capable of high-resolution nesting with a new treatment of grounding-line dynamicsand ice-shelf buttressing to simulate Antarctic ice sheet variations over the past five million years," Pollard and DeConto modeled WestAntarctic Ice Sheet (WAIS) variations ranging from "full glacial extents with grounding lines near the continental shelf break, intermediatestates similar to modern, and brief but dramatic retreats, leaving only small, isolated ice caps on West Antarctic islands." Their work indicated,in the authors' words, that "the WAIS will begin [our italics] to collapse when nearby ocean temperatures warm by roughly 5°C." So how longwould it take to complete the process? In a News & Views story on Pollard and DeConto's findings, Huybrechts (2009) states that "the amountof nearby ocean warming required to generate enough sub-ice-shelf melting to initiate a significant retreat of the West Antarctic ice sheet ... maywell take several centuries to develop." And once started, he says that the transition time for a total collapse of the West Antarctic ice sheetwould range from "one thousand to several thousand years," which time period, in his words, "is nowhere near the century timescalesfor West Antarctic ice-sheet decay based on simple marine ice-sheet models," such as have been employed in the past. Once again, thespecter of 21st-century sea level rise being measured in meters -- as hyped by Al Gore and James Hansen -- can be seen to be receding everfurther into the distance of unreality.
Ocean Acidification and Marine Coccolithophores
Halloran, P.R., Hall, I.R., Colmenero-Hidalgo, E. and Rickaby, R.E.M. 2008. Evidence for a multi-species coccolith volume change over the past two centuries:understanding a potential ocean acidification response. Biogeosciences 5: 1651-1655.
Working with materials derived from a sediment core extracted from the subpolar North Atlantic Ocean, Halloran et al. analyzed the sizedistribution of CaCO3 particles in the less-than-10-µm sediment fraction over the past quarter-century. The work revealed "a changing particlevolume since the late 20th century consistent with an increase in the mass of coccoliths produced by the larger coccolithophore species," whichincluded Oolithotus fragilis, Calcidicus leptoporus, Coccolithus pelagicus var. pelagicus, and Helicosphaera carteri. As a result, Halloran et al.say their data suggest that "in the real ocean the larger coccolithophore species increase their calcification in response to anthropogenicCO2 release," contrary to what typically occurs in the lifeless "virtual ocean" of certain theoreticians, who see bad consequences in nearly
27
everything that could possibly be related to the historical rise in the air's CO2 concentration. They also state that "such a calcification responsecould be attributed to an alleviation of CO2 limitation in species that partly rely on the diffusive supply of dissolved carbon dioxide forphotosynthesis, as demonstrated by a rise in photosynthetic efficiency with increasing carbon dioxide in cultures of E. huxleyi."
The Impact of ‘Global Warming’ on Viral Diseases
Zell, R., Krumbholz, A. and Wutzler, P. 2008. Impact of global warming on viral diseases: what is the evidence? Current Opinion in Biotechnology 19: 652-660.
According to Zell et al., "it is assumed that global warming is forced by the anthropogenic release of 'greenhouse gases'," and that a further"consistent assumption" has been a consequent "increased exposure of humans to tropical pathogens and their vectors." However, they also note"there is dissent about this hypothesis (Taubes, 1997; Reiter, 2001; Hay et al., 2002; Reiter et al., 2003; Randolph, 2004; Zell, 2004; Halstead,2008)," and they thus go on to explore it in a bit more detail by reviewing the pertinent literature and describing "those mechanisms that havelead to an increase of virus activity in recent years." Based on their review, the three German researchers found that "only very few examplespoint toward global warming as a cause of excess viral activity." Instead, they determined that "coupled ocean/atmosphere circulations andcontinuous anthropogenic disturbances (increased populations of humans and domestic animals, socioeconomic instability, armed conflicts,displaced populations, unbalanced ecosystems, dispersal of resistant pathogens etc.) appear to be the major drivers of disease variability," andthat "global warming at best [our italics] contributes." Thus, by far and away the most significant cause of enhanced viral diseases in recentyears has not been global warming. In fact, two whole classes of factors have dominated human virology during this period.
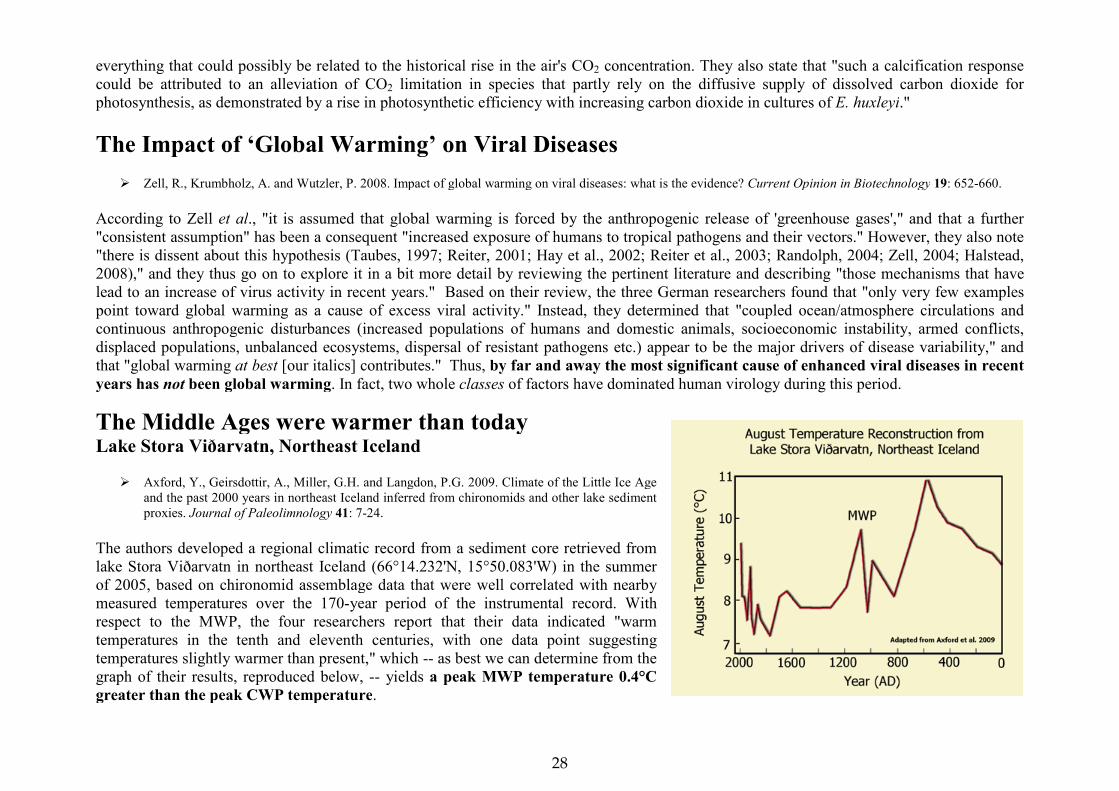
The Middle Ages were warmer than todayLake Stora Viðarvatn, Northeast Iceland
Axford, Y., Geirsdottir, A., Miller, G.H. and Langdon, P.G. 2009. Climate of the Little Ice Ageand the past 2000 years in northeast Iceland inferred from chironomids and other lake sedimentproxies. Journal of Paleolimnology 41: 7-24.
The authors developed a regional climatic record from a sediment core retrieved fromlake Stora Viðarvatn in northeast Iceland (66°14.232'N, 15°50.083'W) in the summerof 2005, based on chironomid assemblage data that were well correlated with nearbymeasured temperatures over the 170-year period of the instrumental record. Withrespect to the MWP, the four researchers report that their data indicated "warmtemperatures in the tenth and eleventh centuries, with one data point suggestingtemperatures slightly warmer than present," which -- as best we can determine from thegraph of their results, reproduced below, -- yields a peak MWP temperature 0.4°Cgreater than the peak CWP temperature.
28

Valiant for truth: The top ten climate realists on the planet
These ten playing-cards, imitating the “most-wanted” cards circulated by the US Army as it liberated Iraq, were devised by The Guardian, aBritish propaganda sheet. David Bellamy used to broadcast regularly till he questioned “global warming”: the BBC does not allow free speechon this issue. Christopher Booker writes a trenchant weekly column exposing “global warming” in the Sunday Telegraph. Melanie Phillips is adistinguished columnist with the Daily Mail. Senator James Inhofe is the US Senate’s most influential critic of “global warming”. Alaska,where Sarah Palin is Governor, needs all the warming it can get. Christopher Monckton sings Gilbert and Sullivan (unless I can be stopped).Pat Michaels advises the Cato Institute on climate. Steve Milloy runs the indispensable www.junkscience.com. Vaclav Klaus is President of theCzech Republic, and of the European Union. Sammy Wilson, environment minister for Northern Ireland, is an outspoken critic of “globalwarming” alarmism. Without these gallant few, the truth that “global warming” is a global fraud would have taken much longer to emerge.
29

30
If you'd like to learn more about climate change
science, request a speaker, or have any questions,
contact Robert Ferguson, SPPI President.


