Sports Foods Consumption in Australia and New Zealand · PDF fileRisks of consumer-identified...
70
1 Sports Foods Consumption in Australia and New Zealand (September 2013)
Transcript of Sports Foods Consumption in Australia and New Zealand · PDF fileRisks of consumer-identified...

1
Sports Foods Consumption in Australia and New Zealand
(September 2013)

2
Food Standards Australia New Zealand (FSANZ) supports and encourages the dissemination and exchange of information. Information in this presentation is provided under a Creative Commons Attribution 3.0 Australia (CC BY 3.0) Licence, except for the Food Standards Australia New Zealand logo. Attribution: You may copy, distribute, transmit and adapt the material in this publication by the CC BY 3.0 licence for commercial and non-commercial purposes; but you must attribute the work in the following manner: © Food Standards Australia New Zealand. This attribution must not, in anyway, suggest that FSANZ endorses you or your use of the work. For more information email [email protected]. Third party material: To the extent that information published in this presentation contains material in which copyright is owned by a third party, the CC BY 3.0 licence would not apply to such third party material and, if you wish to re-use third party material, you may have to seek permission from the copyright owner.

3
Contents
Executive summary ............................................................................................................... 5
Chapter 1 Introduction ........................................................................................................... 6
Background ....................................................................................................................... 6
Research framework ......................................................................................................... 6
Research questions ........................................................................................................... 7
Key definitions ................................................................................................................... 7
Structure of the report ........................................................................................................ 8
Chapter 2 Data collection, preparation, and limitations ........................................................ 10
Method ............................................................................................................................ 10
Sampling ......................................................................................................................... 11
Sample frame .............................................................................................................. 11
Sample design ............................................................................................................. 11
Sample weighting ......................................................................................................... 11
Response rates ............................................................................................................... 12
Data preparation .............................................................................................................. 12
Missing values ............................................................................................................. 12
Open-ended questions ................................................................................................. 12
Closed questions ......................................................................................................... 12
Analysis approach ........................................................................................................... 13
Study Limitations ............................................................................................................. 13
General population survey ........................................................................................... 13
Seasonal effects .......................................................................................................... 14
Snapshot of recent use ................................................................................................ 14
Chapter 3 Use of supplementary foods ............................................................................... 15
Overall prevalence........................................................................................................... 15
Type of supplementary food product used ....................................................................... 15
Characteristics of supplementary foods users ................................................................. 17
Gender ......................................................................................................................... 17
Age .............................................................................................................................. 18
Household income ....................................................................................................... 19
Occupational status ..................................................................................................... 20
Education ..................................................................................................................... 20
Ethnicity ....................................................................................................................... 21
Conclusions on characteristics of supplementary foods users ...................................... 22
Do user lifestyles reflect health guidelines? ..................................................................... 22

4
Conclusions on healthy lifestyle profiles of supplementary foods users ........................ 24
Benefits and risks ............................................................................................................ 25
Perceived benefits of supplementary foods use ........................................................... 25
Risks of consumer-identified sports foods use ............................................................. 26
Conclusions on benefits and risks ................................................................................ 26
Chapter 4 Supplementary foods consumption patterns ....................................................... 27
What activities are associated with consumption? ........................................................... 27
How much do people usually consume? .......................................................................... 29
Usual amount of consumption ...................................................................................... 29
How does frequency of exercise affect frequency of consumption? ................................. 29
What is the relative timing of exercise-related consumption? ........................................... 30
Conclusions on consumption patterns ............................................................................. 31
Chapter 5 Sources of information ........................................................................................ 33
What information sources about the risks and benefits of consumer-identified sports foods are used? ........................................................................................................................ 33
What is the main information source that influenced use? ............................................... 34
Places of last supplementary foods purchase .................................................................. 35
Conclusions on information sources ................................................................................ 36
Chapter 6 Conclusions ........................................................................................................ 37
Main research findings .................................................................................................... 37
Prevalence of use ........................................................................................................ 37
Characteristics of supplementary foods users .............................................................. 37
Patterns of supplementary foods consumption ............................................................. 38
Sources of information about consumer-identified sports foods ................................... 38
Key messages from the research .................................................................................... 38
References ......................................................................................................................... 40
Appendix 1: Questionnaire .................................................................................................. 42
Appendix 2: Population weights .......................................................................................... 61
Australia .......................................................................................................................... 61
New Zealand ................................................................................................................... 62
Appendix 3: Data preparation detail .................................................................................... 64
5
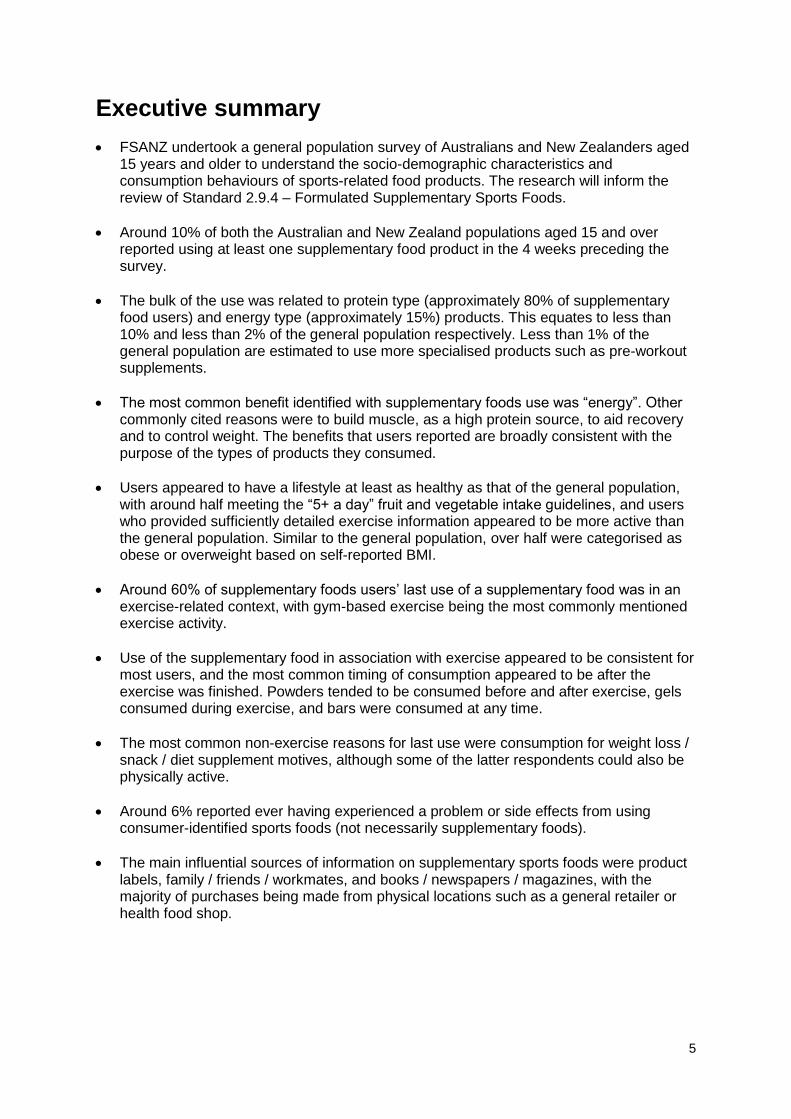
Executive summary
FSANZ undertook a general population survey of Australians and New Zealanders aged 15 years and older to understand the socio-demographic characteristics and consumption behaviours of sports-related food products. The research will inform the review of Standard 2.9.4 – Formulated Supplementary Sports Foods.
Around 10% of both the Australian and New Zealand populations aged 15 and over reported using at least one supplementary food product in the 4 weeks preceding the survey.
The bulk of the use was related to protein type (approximately 80% of supplementary food users) and energy type (approximately 15%) products. This equates to less than 10% and less than 2% of the general population respectively. Less than 1% of the general population are estimated to use more specialised products such as pre-workout supplements.
The most common benefit identified with supplementary foods use was “energy”. Other commonly cited reasons were to build muscle, as a high protein source, to aid recovery and to control weight. The benefits that users reported are broadly consistent with the purpose of the types of products they consumed.
Users appeared to have a lifestyle at least as healthy as that of the general population, with around half meeting the “5+ a day” fruit and vegetable intake guidelines, and users who provided sufficiently detailed exercise information appeared to be more active than the general population. Similar to the general population, over half were categorised as obese or overweight based on self-reported BMI.
Around 60% of supplementary foods users’ last use of a supplementary food was in an exercise-related context, with gym-based exercise being the most commonly mentioned exercise activity.
Use of the supplementary food in association with exercise appeared to be consistent for most users, and the most common timing of consumption appeared to be after the exercise was finished. Powders tended to be consumed before and after exercise, gels consumed during exercise, and bars were consumed at any time.
The most common non-exercise reasons for last use were consumption for weight loss / snack / diet supplement motives, although some of the latter respondents could also be physically active.
Around 6% reported ever having experienced a problem or side effects from using consumer-identified sports foods (not necessarily supplementary foods).
The main influential sources of information on supplementary sports foods were product labels, family / friends / workmates, and books / newspapers / magazines, with the majority of purchases being made from physical locations such as a general retailer or health food shop.

6
Chapter 1 Introduction
Background
Formulated supplementary sports foods (FSSFs) are regulated under Standard 2.9.4 of the Australia New Zealand Food Standards Code (the Code). FSSFs are:
specially formulated to assist sports people in achieving specific nutritional or performance goals. Such foods are intended as supplements to a diet rather than for use as the sole or principal source of nutrition.
Due to the particular physiological demands of sports people, this Standard provides for the addition to formulated supplementary sports foods of certain micronutrients and other ingredients which are not permitted to be added to other foods. This means that such products are not suitable for consumption by children (Purpose, Standard 2.9.4). In New Zealand, sports-related products may also be manufactured under the New Zealand Food (Supplemented Food) Standard 2010. Products which comply with the New Zealand Regulations can be imported into Australia under the Trans-Tasman Mutual Recognition Arrangement. Over recent years, there has been expansion in the range, availability, and marketing of sports-related food products. For example, technological advances have led to products such as single serve gel packs to boost energy. The various types of products can now be purchased from supermarkets, gyms, and the internet. Food Standards Australia New Zealand (FSANZ) has limited information relating to the users of sports-related food products, and in particular formulated supplementary sports foods. The objective of this research is to collect data that can inform the review of Standard 2.9.4 and contribute to an assessment of whether the Standard is currently working as intended. The quantitative research described in this report is the second of two related pieces of work undertaken by FSANZ with users of sports-related food products. The initial research, undertaken in mid-2010, was a set of focus groups designed to provide qualitative information on consumer attitudes and behaviours towards sports-related food products. This research was used to assist in scoping and designing the current research.
Research framework
The research has been structured into four key domains. These are:
consumption behaviour
reasons for use
knowledge and information
consumer perceptions of risks. Consumption behaviour includes the socio-demographic characteristics of people consuming the sports-related food products. There is regulatory interest in knowing how the sports-related food products are consumed, for example, how much is consumed per occasion and whether that is in the context of physical activity or sport. In order to understand consumption, it was important to identify the reasons why people use sports-related food products. By identifying the reasons that different types of consumer give for their sports-related food product use, the research could determine which reasons are more important than others.

7
Often, assumptions are made that knowledge about a product directly affects the use of that product. However, in practice, knowledge may be unrelated to product use. In addition, different people can have the same expressed reasons for use, but have different knowledge about the products. It was therefore important to determine, in general terms, the level of knowledge that consumers feel they have about sports-related food products. This domain tapped into ideas about what the sports-related food products actually “do” for the consumer, as well as identifying the information sources used by the consumer to learn about the products. Research questions inside this domain were designed to address a number of issues: What benefits do people think they will get from consuming these products? What elements of the product itself (e.g. the label, the advertising, the ingredients) have influenced people’s decisions? The consumer perceptions of the risks focussed on any self-identified problems correlated with consumption.
Research questions
The research framework was used to create the research questions for the survey, which in turn were used to develop the questions actually used in the survey. The research questions underpinning the final survey were linked to the key domains of research interest (Table 1.1).
Table 1.1 Overarching research questions linked to key research domains
Research question Key research domain
Overall use of sports foods by the Australian and New Zealand populations aged 15+ years
Consumption behaviour
Identify the sports foods consumed Consumption behaviour Estimate the level of average consumption Consumption behaviour Identify consumers’ reasons for sports foods consumption
Reasons for use
Determine the relative impacts of the influencers of sports foods consumption
Knowledge and information
Identify the information sources that influenced consumption
Knowledge and information
Identify the product information that influenced consumption. Examine the influence of product claims and product labels
Knowledge and information
Issues experienced with use Consumer perceptions of risks of use
Key definitions
It was not possible to construct a definition of FSSFs that would limit telephone survey responses to only those products that matched the technical regulatory or dietetic meaning of this term. As described later, while survey respondents were provided with a broad definition of “sports food products”, many of the products actually mentioned didn’t match the technical definition of a FSSF. On coding the responses, there were instances where inadequate information was provided to enable the specific product to be identified, and therefore definitively classified into its regulatory category. For example a generic term such as “protein shake” or “protein bar” was provided, where such a product could be FSSF or a formulated supplementary food depending on the ingredients. Even where a more specific name such as Aussie Bodies protein powder was mentioned, for a number of products this level of detail did not enable them to be categorised definitively. In this example, the product

8
could be either a FSSF, or a formulated supplementary food as defined in Standard 2.9.3 (“Formulated Meal Replacements and Formulated Supplementary Foods”). Because of the very small number of FSSFs that were clearly identified as such, survey responses have been categorised and analysed using two terms. These two terms, and their definitions, are:
consumer-identified sports foods, includes all products that survey respondents considered to be a sports food product regardless of the particular standard in the Code which relates to that product. This term captures the respondents’ categorisations and definitions of sports food products. The category includes foods that do not fall within the regulatory definition of a FSSF and foods that do. It may also include therapeutic goods that are not considered foods under the regulatory framework, even if the respondent considers them to be a sports food product. The types of foods included in the consumer-identified sports foods category were supplementary foods (defined below), general purpose foods (e.g. muesli bars, pasta), foods for special medical purposes (e.g. Fortisip), and therapeutic goods (e.g. some creatine powders).
supplementary foods, based on how the food is represented in the market, and is restricted to FSSFs, meal replacements, and weight loss products. Some of the foods in this category come within the ambit of Standard 2.9.3 (Formulated Meal Replacements and Formulated Supplementary Foods)and Standard 2.9.4 (FSSFs) of the Code, or the New Zealand Food (Supplemented Food) Standard 2010 (New Zealand only), but note the definition of ‘weight loss products’ below. This category represents a subset of consumer-identified sports foods. This captures experts’ categorisation and definition of these products in relation to the Food Standard Code.
Other important definitions of food products used in the report are:
formulated supplementary sports foods (FSSFs), which are foods or mixtures of foods specially formulated to assist sports people in achieving specific nutritional or performance goals. These foods have a compositional definition, based on named vitamins, minerals, amino acids, and other ingredients, as described in clause 2 (Composition) of Standard 2.9.4. Examples of FSSFs mentioned in the survey were Figure protein shake, Vitastrength creatine, Musashi protein bar, and Gu gel.
meal replacements, which are single foods or pre-packaged selections of foods that are sold as a replacement for one or more of the daily meals but not as a total diet replacement. These foods may have a compositional definition, based on named vitamins, minerals, and minimum levels of protein, energy, and specific vitamins and minerals, as described in clause 2 (Compositional requirements for formulated meal replacements) of Standard 2.9.3. Examples of meal replacements mentioned in the survey were Tony Fergusson shakes (powder) and One Square Meal bars.
weight loss products, which are not defined or specifically regulated in the Code, encompasses foods that consumers use to help them lose weight and may include meal replacements.
Electrolyte drinks were excluded from the scope because these products are not regulated under Standard 2.9.4, but are regulated under Standard 2.6.2 (Non-Alcoholic Beverages and Brewed Soft Drinks). The project was designed to achieve around 500 responses on product use. If the scope had been expanded to include electrolyte drinks, it was presumed that an overwhelming majority of respondents would answer the survey on the basis of electrolyte drink consumption, and very few of the 500 responses would relate to any non-electrolyte drink product.
Structure of the report
The main interest lies with supplementary foods, so this report has focussed on that subset of consumer-identified sports foods. Chapter 2 provides an overview of the survey method

9
and data preparation. Chapter 3 is devoted to key findings for all respondents who self-reported consuming a supplementary food. Chapter 4 contains information on consumption amounts and patterns. Chapter 5 shows the sources of information about the products, and the last place of purchase. Finally, Chapter 6 draws the findings together for a discussion. The three appendices contain the questionnaire used in the survey, the weights used to produce the population estimates in Chapter 3, and the recoding of variables that was performed prior to data analysis.

10
Chapter 2 Data collection, preparation, and limitations
Method
The research used a telephone survey to collect data from a simple random sample of both countries’ populations. This approach was used as it enabled the robust generation of population estimates. The survey questionnaire was designed by FSANZ with data collection outsourced to Newspoll. The final version of the survey questionnaire (see Appendix 1) was developed and tested through cognitive interviews, and pilot testing. The survey was administered using Computer Assisted Telephone Interviewing (CATI). Respondents answered one of two questionnaire versions:
a short-form version, for respondents who answered that they had not used sports food products in the previous 4 weeks. This version only collected data on country, geographical region, gender, and age.
a long-form version, for respondents who answered that they had used sports food products in the previous 4 weeks.
To determine which questionnaire version was to be used, respondents were asked:
“Now a question about sports food products, which can be used for sports and other reasons. These are products specially formulated to help people achieve specific nutritional or performance goals, such as providing energy, assisting endurance or recovery after sport, or building muscles and strength. “Sports food products include carbohydrate or protein bars, shakes, powders, tablets or gels, but do not include ready-made sports drinks or energy drinks such as vitamin waters, Gatorade, Powerade, or Red Bull. “Have you personally consumed any specially formulated sports food products, such as carbohydrate or protein bars, shakes, powders, tablets or gels in the past 7 days?”
If the respondent had not consumed such a product in the past 7 days, then they were asked if they had consumed in the past 14 days. If the answer was still no, the respondent was then asked if they had consumed in the past 4 weeks. A response of “yes” to any of these three questions resulted in the respondent being given the long-form questionnaire. A “no” response triggered the use of the short-form questionnaire. There were 5,001 interviews completed in Australia between 22 June and 10 July 2011 and 5,002 interviews were completed in New Zealand between 22 June and 2 August 2011. Call times were restricted to late afternoon/early evening for weekdays, and morning to evening on weekends. To further ensure the sample included those people who tend to spend a lot of time away from home, a system of call backs and appointments was incorporated. All respondents were asked their age and gender. All respondents who mentioned consuming one or more products were asked questions relating to sources of information about sports foods, side effects, activity levels, height and weight, fruit and vegetable intake, and detailed demographics (e.g. household income, ethnicity, education).

11
Detailed consumption information was only collected on the first product mentioned. This has an effect on the base numbers for the analyses. Where, for example, a respondent gave a supplementary food as their first mentioned product, that respondent will be included in the base for all analyses of supplementary foods. However, where the respondent’s first mentioned consumer-identified sports food was not a supplementary food, this respondent will not be included in the detailed consumption information for supplementary foods. Although electrolyte drinks were out of scope for the survey, and the lead in to the question on use discouraged these responses, some respondents provided electrolyte drinks as responses. All electrolyte drink responses were excluded from the survey analysis. If a respondent only mentioned an electrolyte drink, that respondent was excluded from the survey analysis.
Sampling
Sample frame
No sampling frame for FSSF consumers was available. The frame used for the survey was all persons aged 15 years and over living in Australia and New Zealand in June – July 2011.
Sample design
The sample design was a random survey stratified by area. The sample was randomly selected from SamplePages in Australia and through Random Digit Dialling (RDD) in New Zealand. A “last birthday” screening process was used to randomise respondent selection within a household.
Sample weighting
Sample weights were constructed so that the overall prevalence of recent use could be accurately estimated. The sample weights used were frequency weights, based on age, gender, and geographical region (Appendix 2). This method has been used to correct for any over- or under-sampling of respondents on the basis of those three attributes. The Australian population estimates used by Newspoll to produce the sample weights were the most recent estimates available at the time of surveying. As described in the methodology report (Keynes & Brockelsby 2011), the estimates were sourced from the Australian Bureau of Statistics (ABS) proportions collected in the 2006 Census of Population and Housing (using projected data released in December 2010). The New Zealand estimates were from Statistics New Zealand (Statistics NZ), Estimated Resident Population by Specified Age Group and Sex at 30 June 2010, by Regional Council Area (boundaries at 1 November 2010). These were the weights being used by Newspoll for surveys at this time, which were advised as the latest available (Keynes personal communication 6 May 2011). The Australian and New Zealand data are analysed separately, so the weights are within-country. Only the prevalence data for overall use was weighted. All other reported results are based on unweighted data. As the proportion of consumers was so low relative to non-consumers, and no sample frame existed for consumers, the use of weights could severely bias the estimates produced.

12
Response rates
The response rates for the survey were 12.5% for Australia and 17% for New Zealand. Response rates were calculated using the American Association for Public Opinion Research response rate calculator.1 Response rate 3, which excludes partial interviews being counted as respondents, and estimates the proportion of cases of unknown eligibility that are actually eligible, has been used for the calculation. This is the response rate formula recommended for use when the proportion of eligible sampling units (e.g. households, telephone numbers) is unknown (Sutcliffe and Flint 2011 pp.198-199).
Data preparation
This section summarises the changes that were made to the collected data, in preparing the data for analysis. The responses to the open-ended questions were collected during the telephone interviews, in advance of product classification, and so these questions were asked for all first-mentioned products.
Missing values
The initial cleaning process was to correctly set any missing values to missing. The data on this type of question was cleaned by setting the following response types to missing:
“don’t know”, or
“refused”, or
uncodeable response, e.g. New Zealand respondents who gave a “New Zealander” response to the ethnicity question, as “New Zealander” is not an ethnicity.
Where a question contains missing values, these are excluded from the counts used for the proportions and associated confidence intervals.
Open-ended questions
Responses to open-ended questions were inductively coded into sets of exclusive and exhaustive categories. The categories for each question are detailed in Appendix 3. Where respondents were able to make multiple responses this is indicated in the analysis.
Closed questions
Some variables required further cleaning in addition to missing value specification. The variables concerned, and the additional cleaning processes used, are outlined in Table 2.1.
1 Downloadable from
http://www.aapor.org/AM/Template.cfm?Section=Standard_Definitions2&Template=/CM/ContentDisplay.cfm&ContentID=3152
13
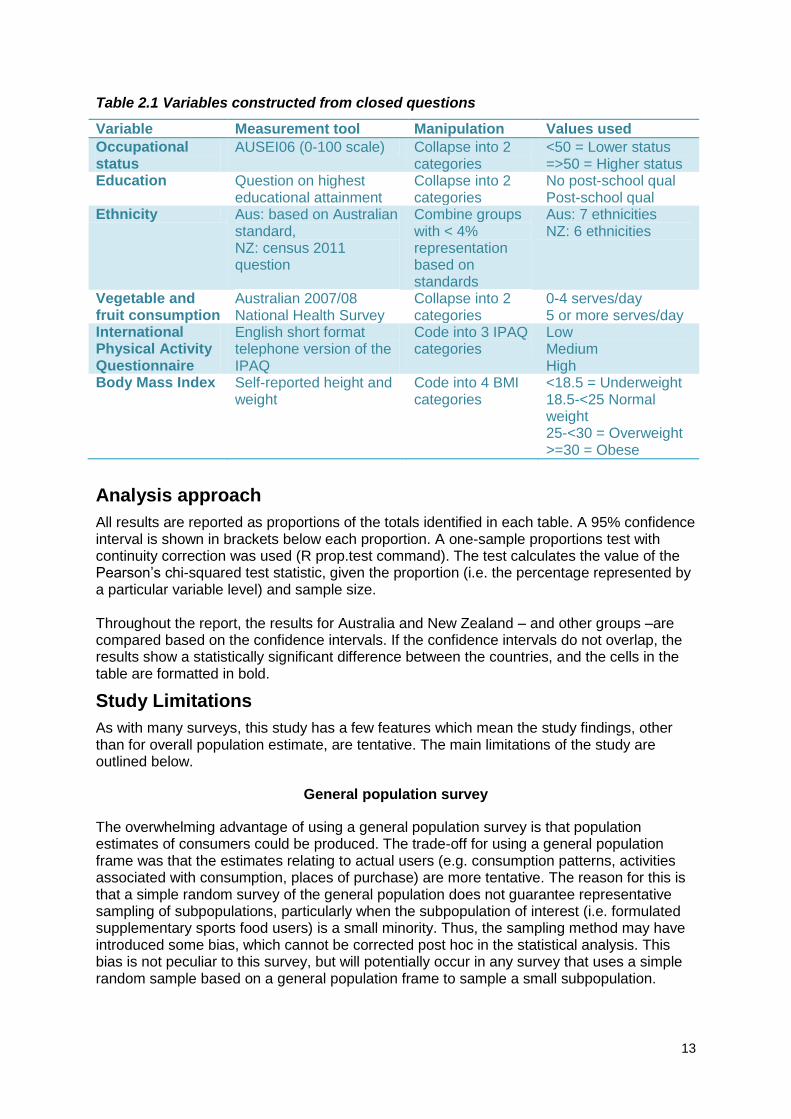
Table 2.1 Variables constructed from closed questions
Variable Measurement tool Manipulation Values used
Occupational status
AUSEI06 (0-100 scale) Collapse into 2 categories
<50 = Lower status =>50 = Higher status
Education Question on highest educational attainment
Collapse into 2 categories
No post-school qual Post-school qual
Ethnicity Aus: based on Australian standard, NZ: census 2011 question
Combine groups with < 4% representation based on standards
Aus: 7 ethnicities NZ: 6 ethnicities
Vegetable and fruit consumption
Australian 2007/08 National Health Survey
Collapse into 2 categories
0-4 serves/day 5 or more serves/day
International Physical Activity Questionnaire
English short format telephone version of the IPAQ
Code into 3 IPAQ categories
Low Medium High
Body Mass Index Self-reported height and weight
Code into 4 BMI categories
<18.5 = Underweight 18.5-<25 Normal weight 25-<30 = Overweight >=30 = Obese
Analysis approach
All results are reported as proportions of the totals identified in each table. A 95% confidence interval is shown in brackets below each proportion. A one-sample proportions test with continuity correction was used (R prop.test command). The test calculates the value of the Pearson’s chi-squared test statistic, given the proportion (i.e. the percentage represented by a particular variable level) and sample size. Throughout the report, the results for Australia and New Zealand – and other groups –are compared based on the confidence intervals. If the confidence intervals do not overlap, the results show a statistically significant difference between the countries, and the cells in the table are formatted in bold.
Study Limitations
As with many surveys, this study has a few features which mean the study findings, other than for overall population estimate, are tentative. The main limitations of the study are outlined below.
General population survey
The overwhelming advantage of using a general population survey is that population estimates of consumers could be produced. The trade-off for using a general population frame was that the estimates relating to actual users (e.g. consumption patterns, activities associated with consumption, places of purchase) are more tentative. The reason for this is that a simple random survey of the general population does not guarantee representative sampling of subpopulations, particularly when the subpopulation of interest (i.e. formulated supplementary sports food users) is a small minority. Thus, the sampling method may have introduced some bias, which cannot be corrected post hoc in the statistical analysis. This bias is not peculiar to this survey, but will potentially occur in any survey that uses a simple random sample based on a general population frame to sample a small subpopulation.

14
Seasonal effects
The survey was primarily conducted over winter (June and July 2011). The results are therefore representative of winter consumption patterns, which may differ from consumption in other seasons. Additionally, in New Zealand, there was a change in weather patterns, which saw a higher rainfall than usual in late June and early July, particularly in the Auckland region. This weather change could reasonably be expected to have made outdoor sports participation less appealing, particularly when the rain coincided with the cool mid-winter temperatures and shorter days. This is likely to have resulted in some changes to the proportions of activities associated with consumption, and also a decrease in the levels of consumption in New Zealand.
Snapshot of recent use
The survey asked about recent use, i.e. consumption, of consumer-identified sports foods, defined as use within the previous 4 weeks. No minimum period of use was required as a criterion for the survey. The picture of behaviour and attitudes presented in this report may not be reflective of consumers with either repeated or long term use.

15
Chapter 3 Use of supplementary foods
This chapter describes the characteristics of respondents who had used at least one supplementary foods product within the previous four weeks. As outlined in the Key definitions section in the Introduction, the definition of supplementary foods was based on how the food is represented in the market, and products in this category are restricted to FSSFs, meal replacements, and weight loss products and New Zealand supplemented foods. As outlined in Appendix 3, a product type classification was developed on the supplementary foods mentioned. Analyses of particular relevance to supplementary food type (e.g. comparisons by gender, by age) have been included. As stated in the previous chapter, a definition of sports foods (“products specially formulated to help people achieve specific nutritional or performance goals, such as providing energy, assisting endurance or recovery after sport, or building muscles and strength”) was provided to respondents to assist in collecting accurate responses. However, a number of respondents mentioned products that were clearly general foods or therapeutic goods. The range of out-of-scope products mentioned is a strong indicator that some consumers have a quite different concept of a sports food compared to the definition for a formulated supplementary sports food in the Code. For example, some respondents mentioned meals (e.g. salad) or meal components such as brown rice, pasta, potatoes, suggesting that a meal constructed from scratch for use in association with sport may be viewed as a ‘sports food’. Other respondents mentioned muesli bars, breakfast cereal, and multivitamins and supplements, such as tablets and fish oil capsules.
Overall prevalence
The overall prevalence of supplementary foods consumption, calculated using population weights, over the previous four weeks is:
10.2% (9.8% - 10.7%) in Australia, for people aged 15 years and over
9.3% (8.4% - 10.3%) in New Zealand, for people aged 15 years and over. The results indicate that there is no country difference in the proportion of the population consuming supplementary foods. These consumers comprise a small but sizeable proportion of the Australian and New Zealand populations aged 15 years and older. The prevalence rates are similar to that for consumer-identified sports foods consumption. This suggests that supplementary foods users comprise the vast majority of consumer-identified sports foods users:
11.6% (11.2% - 12.1%) in Australia, for people aged 15 years and over
10.9% (9.9% - 12.0%) in New Zealand, for people aged 15 years and over. Again, there is no country difference.
Type of supplementary food product used
As described in Appendix 3, the supplementary foods mentioned by respondents were each coded to one of seven categories, based on the general type of food. The types of products used in Australia and New Zealand are shown in Table 3.1 below. There are no statistically significant differences between Australia and New Zealand users for product type preference. Almost 80% of supplementary foods users had consumed some type of protein product. The only other product type used by at least 10% of supplementary foods users were energy products, such as carbohydrate gels and bars.

16
Table 3.1 Supplementary foods product type used, by country
Product type Australia (%)
(n=379)
New Zealand (%)
(n=398)
Protein 79.9
(75.5 – 83.8) 79.4
(75.0 – 83.2)
Energy 15.6
(12.1 – 19.7) 15.3
(12.0 – 19.3)
Miscellaneous 6.6
(4.4 – 9.7) 4.3
(2.6 – 6.9)
Pre-workout 2.4
(1.2 – 4.6) 2.0
(0.9 – 4.1)
Rehydration (excl. electrolyte drinks)
1.6 (0.6 – 3.6)
0 (0.0 – 1.2)
Meal replacement 0.3
(0.0 – 1.7) 2.0
(0.9 – 4.1)
Other 2.9
(1.5 – 5.3) 5.0
(3.3 – 7.7)
* Respondents could select mention more than one supplementary food product type, so the percentages sum to more than 100%. The estimated prevalence of use in the overall population aged 15 years and older, for the types of supplementary food products, is shown in Table 3.2. The estimates for Australian respondents for meal replacement are so small at the population level that neither the estimate nor the confidence interval can be accurately summarised to one decimal place. Other than protein products, each type of supplementary food was consumed by less than 2% of the population aged 15 years and older.
Table 3.2 Supplementary foods product type used, overall prevalence estimates
Product type Australia (%)
(n=18110000)
New Zealand (%)
(n=3470000)
Protein 8.2
(7.8 – 8.6) 7.4
(6.5 – 8.3)
Energy 1.5
(1.3 – 1.7) 1.3
(0.9 – 1.7)
Miscellaneous 0.9
(0.8 – 1.1) 0.4
(0.2 – 0.7)
Pre-workout 0.4
(0.3 – 0.5) 0.2
(0.1 – 0.5)
Rehydration (excl. electrolyte drinks)
0.2 (0.1 – 0.3)
0 (0 – 0.1)
Meal replacement <0.1 0.2
(0.1 – 0.4)
Other 0.3
(0.2 – 0.4) 0.5
(0.3 – 0.8)
* Respondents could mention more than one supplementary food product type, so the categories are not mutually exclusive. ** Weighted data used for prevalence estimates.

17
Characteristics of supplementary foods users
Gender
As shown in Table 3.3, in both countries there is no gender difference in supplementary foods consumption. Within gender, there is no difference in the prevalence of consumption between the two countries. The results also suggest no gender bias in consumption, in the Australian and New Zealand populations aged 15 years and older (Australia Bureau of Statistics 2011a, calculated from Table 8; Statistics New Zealand 2012, calculated from Table 2).
Table 3.3 Supplementary foods users by gender
Gender Australia (%)
(n=379)
New Zealand (%)
(n=398)
Female 47.8
(42.6 – 52.9) 49.5
(44.5 – 54.5)
Male 52.2
(47.1 – 57.4) 50.5
(45.5 – 55.5)
The product types were analysed to identify any gender preferences in use, and the results are shown in Table 3.4. Males were significantly more likely to report consuming products associated with energy or pre-workout concepts, and miscellaneous-type products, than females. Females were significantly more likely to report consuming protein products. There were no differences in use of rehydration or meal replacement products.
Table 3.4 Supplementary foods product type used, by gender
Product type Males (%)
(n=399)
Females (%)
(n=378)
Protein 73.2
(68.5 – 77.4) 86.5
(82.5 – 89.7)
Energy 20.8
(17.0 – 25.2) 9.8
(7.1 – 13.3)
Miscellaneous 9.3
(6.7 – 12.7) 1.3
(0.5 – 3.2)
Pre-workout 3.8
(2.2 – 6.3) 0.5
(0.1 – 2.1)
Rehydration (excl. electrolyte drinks)
1.3 (0.5 – 3.1)
0.3 (0.0 – 1.7)
Meal replacement 1.3
(0.5 – 3.1) 1.1
(0.3 – 2.9)
Other 3.3
(1.8 – 5.6) 4.8
(2.9 – 7.6)
* Respondents could mention more than one supplementary food product type, so the percentages sum to more than 100%.

18
Age
As shown in Table 3.5, users are spread across all age groups. There is no country-related difference in the age profile of these respondents. Bold figures indicate where the proportion of users in an age band differs significantly from the proportion in the general 15+ years’ population. The results were compared to the general populations of Australia and New Zealand, limited to ages 15 years and older (Australia Bureau of Statistics 2011a, calculated from Table 8; Statistics New Zealand 2012, calculated from Table 3). In Australia, people aged 20-29 years and 60 years and older were under-represented within supplementary foods users. For these two age groups, consumption is lower than would be expected on the basis of the age composition of the Australian population. Conversely, consumption in the age groups 15-19 years and 30-39 years is higher than would be expected. In New Zealand, people aged 60 years and older were under-represented among users and, similarly to Australia, those aged 15-19 years and 30-39 years were over-represented.
Table 3.5 Supplementary foods users by age, comparison with national percentages
Age (years)
Australia (%) New Zealand (%)
Users
(n=379)
General population
(n=18,359,921)
Users
(n=398)
General population
(n=3,537,480)
15-19 13.5
(10.3 – 17.4) 8.1
14.6 (11.3 – 18.5)
8.8
20-29 14.0
(10.7 – 18.0) 18.2
16.1 (12.7 – 20.1)
17.8
30-39 23.7
(19.6 – 28.4) 17.2
21.9 (18.0 – 26.3)
15.8
40-49 19.3
(15.5 – 23.7) 17.2
18.3 (14.7 – 22.6)
17.8
50-59 15.3
(11.9 – 19.4) 15.5
14.8 (11.6 – 18.8)
16.0
60+ 14.2
(11.0 – 18.3) 23.7
14.3 (11.1 – 18.2)
23.8
The analysis of age effects on consumption was replicated by product type. Because of the relatively large number of age categories (6), the analysis has been limited to product types reported by 2% or more of supplementary foods users. The results are shown in Figure 3.1 below. Protein products were consistently used at high rates across the age groups. Energy products were not as common for respondents aged 15-29 years as they were for the older age groups. There are no statistically significant differences for the other two types of product, but very few people reporting consuming pre-workout and miscellaneous products.

19
Figure 3.1 Use of supplementary food product type, by age group. 95% confidence intervals represented by black bars
Household income
Income was measured as annual household pre-tax income. The same income bands were used in both countries.2 There was no difference in the income distribution of supplementary foods users between the two countries, as shown in Table 3.6. Again, while the proportion of users in each income band was flatter in New Zealand, in Australia fewer users tended to be in the $30,001-$50,000 income band or report a household income of greater than $150,000, however these did not reach statistical significance. The lowest income households represent around 13% of supplementary foods users in Australia and New Zealand.
2 In AUD$ for Australians and NZD$ for New Zealanders. The assumption has been made that the cost of living
is roughly the same if NZD is assumed to be equal to AUD.

20
Table 3.6 Supplementary foods users by annual household income
Annual household income Australia (%)
(n=334)
New Zealand (%)
(n=333)
Up to 30 thousand dollars 13.5
(10.1 – 17.7) 12.3
(9.1 – 16.4)
$30,001 to 50 thousand 9.9
(7.0 – 13.7) 16.8
(13.0 – 21.4)
$50,001 to 70 thousand 18.9
(14.9 – 23.6) 18.3
(14.4 – 23.0)
$70,001 to 100 thousand 21.6
(17.3 – 26.4) 19.5
(15.5 – 24.3)
$100,001 to 150 thousand 22.2
(17.9 – 27.1) 17.1
(13.3 – 21.7)
More than 150 thousand 14.1
(10.6 – 18.4) 15.9
(12.2 – 20.4)
Occupational status
As described in Appendix 3, the AUSEI06 was incorporated as a measure of occupational status in this survey, to proxy socioeconomic status. The scale is continuous between 0 and 100, with a low measure representing low occupational status and a high measure representing high occupational status. For the purposes of analysis, the scores were split so that supplementary foods users with an AUSEI06 score of less than 50 were coded to low occupational status, and those with a score of 50 or greater were coded to high occupational status. As shown in Table 3.7, there were no differences in occupational status of supplementary foods users between the two countries. Over half of supplementary foods users had a low occupational status.
Table 3.7 Supplementary foods users by occupational status
AUSEI06 score Australia (%)
(n=265)
New Zealand (%)
(n=277)
Low status (<50) 56.2
(50.0 – 62.3) 56.0
(50.0 – 61.9)
High status (>=50) 43.8
(37.7 – 50.0) 44.0
(38.1 – 50.1)
Education
As shown in Table 3.8, supplementary foods users were relatively well educated. Around 57% reported having completed a post-school qualification, such as a university degree or diploma, or trade-related qualification. There was no difference in the level of education between Australia and New Zealand.

21
Table 3.8 Supplementary foods users by education level
Highest educational level Australia (%)
(n=379)
New Zealand (%)
(n=394)
No post-school qualification 42.2
(37.2 – 47.4) 43.4
(38.5 – 48.5)
Post-school qualification 57.8
(52.6 – 62.8) 56.6
(51.5 – 61.5)
Ethnicity
Ethnicity was captured using the approach described in Appendix 3. As shown in Table 3.9, two-thirds of supplementary foods users reported having an Australian ethnicity, and close to half reported having a British ethnicity. One user in 10 reported having an Irish ethnicity.
Table 3.9 Supplementary foods users by ethnicity, Australia
Ethnicity Supplementary foods users (%)
(n=378)
Australian 66.4
(61.4 – 71.1)
British, including English, Scottish or Welsh 43.7
(38.6 – 48.8)
Irish 10.8
(8.0 – 14.5)
New Zealander, including Māori 5.3
(3.3 – 8.2)
Australian Aboriginal or Torres Strait Islander
2.1 (1.0 – 4.3)
Other European 13.8
(10.5 – 17.7)
Some other ethnicity 20.9
(17.0 – 25.4)
* Respondents could select more than one ethnicity, so the percentages sum to more than 100%. In New Zealand, almost three-quarters of supplementary foods users reported having a New Zealand European ethnicity (Table 3.10). Almost 17% reported a Māori ethnicity.

22
Table 3.10 Supplementary foods users by ethnicity, New Zealand
Ethnicity Supplementary foods users (%)
(n=393)
NZ European 74.8
(70.2 – 79.0)
Māori 16.8
(13.3 – 20.9)
Asian 7.1
(4.9 – 10.3)
Other European 6.1
(4.0 – 9.1)
Pacific peoples 3.3
(1.8 – 5.7)
Some other ethnicity 0.8
(0.2 – 2.4)
* Respondents could select more than one ethnicity, so the percentages sum to more than 100%.
Conclusions on characteristics of supplementary foods users
There were very few differences in characteristics between supplementary foods users in Australia compared with New Zealand. Around 10% of the population aged 15 years and older were recent users, and they tended to be quite evenly spread across age and household income groups. While there was no overall pattern to the age profile of supplementary foods users, the youngest age group was over-represented and the oldest age group was under-represented. Males represented around half of all users in both countries, suggesting no gender bias among supplementary foods users, and there was no difference in the gender profile of users between the two countries. While over half of supplementary foods users had a lower status occupation, over half reported having a completed post-school qualification. The majority of supplementary foods users were in the main ethnic group for each country (Australian in Australia, New Zealand European in New Zealand). The majority of users reported using protein-type supplementary foods (approximately 80%), with the next most populous category, at approximately 15% of users, reporting energy type supplementary foods. These levels of use represent overall prevalence estimates of less than 10% and less than 2% for protein and energy-type supplementary foods respectively. Prevalence of use estimates for the other, typically more specialised, types of supplementary foods were less than 1% of the population.
Do user lifestyles reflect health guidelines?
Self-reported usual vegetable and fruit consumption (based on the questions in the Australian 2007/08 National Health Survey), physical activity levels (via a modified IPAQ3), and body mass index (BMI, based on self-reported height and weight) were used as proxies to assess the healthiness of supplementary foods user lifestyles. The results are shown in Table 3.11. Respondents who consume supplementary foods are a self-selected subpopulation who may differ from the general population, for example respondents may be more physically active, however it is still informative to compare to the general population.
3 The International Physical Activity Questionnaire. For more information, please refer to the section in Appendix
3.

23
Around half of supplementary foods users reported typically consuming 5 or more serves of fruit and/or vegetables a day, and there were no country differences. The current Australian guideline for people aged 19 years and older (the majority of respondents in this survey) is two serves of fruit and five serves of vegetables a day (National Health and Medical Research Council 2005). The Year Book Australia, 2012 (Australian Bureau of Statistics 2012), using the 2007-2008 National Health Survey data, found that only 6% of Australians aged 19 years and older met the guideline.4 In addition, around 9% usually ate five or more serves of vegetables and one or more serves of fruit a day; 11% usually ate four serves of vegetables and one or more serves of fruit a day; and 23% usually ate three serves of vegetables and one or more serves of fruit a day. Together, these four groups are close to the “5+ serves/day” category used in this survey, and represent around 49% of people aged 19 years and older, which is close to the 48% shown in Table 3.11. The results of the 2008-2009 New Zealand Adult Nutrition Survey are reported separately for fruit and vegetables and do not provide a comparator for the summary results reported in Table 3.11 (University of Otago & Ministry of Health 2011).
Table 3.11 Profile of lifestyle factors, supplementary foods users
Lifestyle factor Australia (%)5 New Zealand (%)
6
Fruit and vegetable intake
0-4 serves/day 51.6
(46.4 – 56.7) 44.7
(39.7 – 49.7)
5+ serves/day 48.4
(43.3 – 53.6) 55.3
(50.3 – 60.3)
IPAQ
Low 1.2
(0.3 – 3.9) 2.4
(1.0 – 5.4)
Moderate 38.4
(32.3 – 44.9) 34.8
(29.0 – 41.1)
High 60.3
(53.8 – 66.5) 62.8
(56.5 – 68.7)
BMI7
Underweight 2.1
(0.9 – 4.4) 0.6
(0.1 – 2.3)
Normal weight 42.3
(37.0 – 47.8) 41.3
(36.1 – 46.7)
Overweight 40.5
(35.2 – 46.0) 38.2
(33.1 – 43.5)
Obese 15.2
(11.6 – 19.6) 19.9
(16.0 – 24.6)
The IPAQ results are based on the subset of respondents who were able to provide activity information for the previous week. Over one-third of respondents were unable to supply this information and were therefore excluded from the analysis. The results reported for the IPAQ are therefore limited to the subset of respondents who provided sufficiently detailed information. Respondents in the current survey may be more likely to be physically active because the sample is limited to self-reported supplementary foods users. The current Australian guideline for adults is a total of 30 minutes of moderate exercise a day, in sessions of at least 10 minutes, for most days of the week (Department of Health and Ageing 2005). In New Zealand, the guideline for adults is at least 30 minutes of moderate intensity physical activity (equivalent to brisk walking) on most, if not all, days of the week, and vigorous exercise for extra fitness and health benefits (Ministry of Health 2008).
4 http://www.abs.gov.au/ausstats/[email protected]/Lookup/1301.0Main+Features2362012
5 The base counts are 376 for Fruit and vegetable intake, 242 for IPAQ, 336 for BMI.
6 The base counts are 394 for Fruit and vegetable intake, 250 for IPAQ, 351 for BMI.
7 Limited to respondents aged 18 years and older.

24
Around 60% of respondents who provided activity information reported a high physical activity level, and there were no country differences. Around 98% of Australian respondents who provided accurate physical activity information were meeting or exceeding the Australian guideline. The Australian National Health Survey, 2007-08 found that only 38% of adults met the guideline (Australian Bureau of Statistics 2011b), however this result was for all adults. Around 98% of New Zealand respondents who provided accurate physical activity information were meeting or exceeding the New Zealand guideline. Again, this is in contrast to the 2006/07 New Zealand Health Survey which found that 52% of adults met the guideline (Ministry of Health 2008). Finally, around 43% of respondents aged 18 years and older were underweight or normal weight, and there were no country differences. For Australian respondents, the proportion in the underweight and normal weight BMI categories was 44.3% (39.0% - 49.8%). While this is not significantly different to the 39% calculated from the 2007-08 National Health Survey (Australia Bureau of Statistics 2011c), the lower end of the confidence interval barely includes this figure. For New Zealand respondents, the proportion in the underweight and normal weight BMI categories was 41.9% (36.7% - 47.2%). This is larger than the 35.3% calculated from the 2008-2009 New Zealand Adult Nutrition Survey (University of Otago & Ministry of Health 2011). There are two plausible explanations of these differences. First, there may be some underestimation of self-reported BMI by respondents in this survey. Second, respondents in the current survey are likely to differ from the general population aged 15 years and older in ways that correlate with reduced BMI, for example they may be more likely to be physically active. Respondents were asked to compare the amount of activity they had undertaken in the past week to their usual level of activity. Table 3.12 shows the results. There is no difference in the typicality of the previous week’s exercise between the two countries. Around 60% of supplementary foods users had undertaken their normal level of physical activity in the preceding week.
Table 3.12 Typicality of recent exercise, supplementary foods users
Typicality of past week’s exercise Australia (%)
(n=378)
New Zealand (%)
(n=398)
More than usual 14.3
(11.0 – 18.3) 13.8
(10.7 – 17.7)
Same 59.8
(54.6 – 64.7) 58.3
(53.3 – 63.2)
Less than usual 25.9
(21.6 – 30.7) 27.9
(23.6 – 32.6)
Conclusions on healthy lifestyle profiles of supplementary foods users
The fruit and vegetable and BMI results suggest that the respondents to this survey are very similar to the general population in each country. The results for the IPAQ show that the proportion of respondents who met or exceeded physical activity guidelines was well in excess of the proportions found in national health surveys. Importantly, only those who consumed consumer-identified sports foods responded to the questions regarding healthy lifestyle. The high level of physical activity among this group is consistent with an appropriate use of the foods. The slightly higher proportions of respondents in the underweight and normal weight BMI categories may have also been expected due to the sampling frame.

25
Benefits and risks
Perceived benefits of supplementary foods use
There was no country effect on the proportion of supplementary foods users reporting each benefit. As shown in Table 3.13, the most common benefit reported was “energy”, which was mentioned by 22% of Australian users and 29% of New Zealand users (difference not statistically significant). “Hydration” was the least common benefit mentioned, and few respondents were using the products simply to “trial” them. Just over 15% of respondents in both countries were using the product either to “manage hunger” (e.g. consuming the product between meals as a snack) or as a “meal replacement”.
Table 3.13 Benefits reported by supplementary foods users*
Reported benefit** Australia (%)
(n=373)
New Zealand (%)
(n=397)
Energy 22.0
(18.0 – 26.6) 29.2
(24.8 – 34.0)
Build muscle 20.4
(16.5 – 24.9) 22.4
(18.5 – 26.9)
High protein 14.5
(11.1 – 18.6) 13.4
(10.2 – 17.2)
Recovery 14.2
(10.9 – 18.3) 11.8
(8.9 – 15.5)
Weight control 11.8
(8.8 – 15.6) 10.3
(7.6 – 13.9)
Health 9.4
(6.7 – 12.9) 5.5
(3.6 – 8.4)
Manage hunger 9.4
(6.7 – 12.9) 5.3
(3.4 – 8.1)
Exercise 8.8
(6.3 – 12.3) 4.3
(2.6 – 6.9)
Meal replacement 7.0
(4.7 – 10.2) 10.1
(7.4 – 13.6)
Trial 2.1
(1.0 – 4.3) 3.5
(2.0 – 6.0)
Hydration 1.9
(0.8 – 4.0) 2.0
(0.9 – 4.1)
Other 7.5
(5.1 – 10.8) 5.0
(3.3 – 7.7)
* Respondents could identify more than one perceived benefit, so the percentages sum to more than 100%. ** Table A3.2 in Appendix 3 outlines the types of responses coded into each of these benefit categories. Benefits reported by at least 4% of supplementary foods users in both countries were analysed by product type (Table 3.14). The “miscellaneous” and “pre-workout” categories for product type have been combined, due to small numbers in the latter category. The products in these two categories are similar in that they contain ingredients that are intended to provide a nutritional ergogenic aid to sport training and or performance. For users of protein products, the most frequently mentioned benefit was building muscle, followed by energy, high protein, and weight control. For users of energy products, the most commonly mentioned benefit was energy, with almost 60% of users spontaneously identifying this benefit. Just over 20% of energy product users mentioned exercise, and just over 10% mentioned recovery and/or health benefits. Miscellaneous products were most

26
commonly linked to energy benefits, with recovery and building muscle also mentioned by at least 15% of product users.
Table 3.14 Benefits reported by product type*
Reported benefit* Protein (%)
(n=597)
Energy (%)
(n=98)
Miscellaneous + Pre-workout (%)
(n=33)
Energy 18.6
(15.6 – 22.0) 59.2
(48.8 – 68.9)**
39.4 (23.4 – 57.8)**
Build muscle 26.1
(22.7 – 29.9) 3.1
(0.8 – 9.3)**
15.2 (5.7 – 32.7)**
High protein 16.2
(13.4 – 19.5) 5.1
(2.1 – 11.5)**
6.1 (1.2 – 21.0)**
Recovery 13.4
(10.8 – 16.5) 11.2
(6.0 – 19.6)**
18.2 (7.6 – 36.1)**
Weight control 12.7
(10.2 – 15.7) 0.0
(0.0 – 5.7)**
9.1 (2.4 – 25.5)**
Health 6.5
(4.7 – 8.9) 11.2
(6.6 – 19.6)**
6.1 (1.2 – 21.0)**
Manage hunger 8.0
(6.0 – 10.6) 5.1
(2.1 – 11.5)**
6.1 (1.2 – 21.0)**
Exercise 3.9
(2.4 – 5.6) 21.4
(14.0 – 31.1)** 12.1
(4.0 – 29.1)**
Meal replacement 10.1
(7.8 – 12.8) 3.1
(0.8 – 9.3)**
3.0 (0.2 – 17.5)**
* Respondents could identify more than one perceived benefit, but some product type and benefit categories have been omitted due to small sample size. ** The confidence interval is wide due to small expected counts.
Risks of consumer-identified sports foods use
Respondents were asked a single general question on side-effects. A small proportion of Australian and New Zealand supplementary foods users reported having experienced a problem or side effect from using any consumer-identified sports foods.8
6.6% (4.4 – 9.7) of 379 Australian supplementary foods users
5.8% (3.8 – 8.7) of 398 New Zealand supplementary foods users.
Conclusions on benefits and risks
Supplementary foods users reported a range of benefits / reasons for use, with “energy” as the most common reported benefit. A small group of users appear to be consuming the products for weight management: as a meal replacement, for weight control, and/or to manage hunger (snacking). Users of protein products most commonly reported consuming the product in order to build muscle, whereas the energy and miscellaneous types of supplementary foods were most commonly associated with energy benefits. Just over 5% in each country reported ever having experienced a problem or side effect from using any consumer-identified sports foods. It is not possible to link the type of sports food to this information.
8 The question was asked for all “sports food products” used and so does not just relate to supplementary foods
use.

27
Chapter 4 Supplementary foods consumption patterns
This chapter describes the consumption patterns of supplementary food consumers. Based on last use, the frequency of activities associated with consumption is outlined. This is followed by an analysis of the usual amount of consumption, and the factors that may affect this. Finally, the relationship between exercise and consumption is examined.
What activities are associated with consumption?
Supplementary foods users were asked to provide information on the one specific activity, or other reason, associated with their last use of the particular supplementary food consumed. This information provides a snapshot of recent use. Table 4.1 shows the activity or other reason, in descending order of mentions.
Table 4.1 Activity associated with last supplementary foods use
Category Activity associated with last use
Australia (%)
(n=369)
New Zealand (%)
(n=396)
Original response
Gym not elsewhere classified 16.0
(12.5 – 20.2) 18.7
(15.0 – 23.0)
Weight control 13.0
(9.8 – 17.0) 9.8
(7.2 – 13.3)
Snack 11.4
(8.4 – 15.2) 11.6
(8.7 – 15.3)
Weight training 11.1
(8.2 – 14.9) 9.6
(7.0 – 13.0)
Supplement 7.9
(5.4 – 11.2) 8.1
(5.7 – 11.3)
Meal replacement 7.6
(5.2 – 10.9) 5.1
(3.3 – 7.7)
Running 6.5
(4.3 – 9.7) 6.6
(4.4 – 9.6)
Cycling 6.5
(4.3 – 9.7) 4.8
(3.0 – 7.5)
Field ball sports 4.3
(2.6 – 7.1) 4.0
(2.4 – 6.6)
Trialling the product 2.4
(1.2 – 4.7) 1.8
(0.8 – 3.8)
Walking 2.2
(1.0 – 4.4) 3.0
(1.6 – 5.4)
Court ball sports 1.9
(0.8 – 4.0) 2.5
(1.3 – 4.7)
Martial arts 1.4
(0.5 – 3.3) 1.3
(0.5 – 3.1)
Other activities 7.9
(5.4 – 11.2) 13.1
(10.0 – 17.0)
Derived estimate Exercise-type activities 57.7
(52.5 – 62.8) 63.6
(58.7 – 68.3)
Table 4.1 shows that there are no differences between Australia and New Zealand for the activity that respondents associated with most recent use. Gym related activities, including weight training, and weight loss/ snack / diet supplement were the most common activities given. However, as noted earlier, the survey was conducted in winter, and the timing may have affected the results for certain activities. For example, if fewer people take walks in the

28
winter compared to the summer, and do not substitute an alternative activity, then there was less opportunity for such activity-based use to be captured in this survey. The results show that supplementary foods are used in circumstances clearly identifiable as an activity, such as running, and in circumstances that appear unrelated to activity, such as snacking. For some respondents their physical activity is consistent with the appropriate use of formulated supplementary sports foods. Other uses, such as snacking, may not be consistent with the appropriate use of formulated supplementary sports foods. However, as the activities are related to supplementary foods, which are designed to provide a supplement to the diet, such activities may originate from these consumers. The activities associated with use, as represented in Table 4.1, were categorised into an exercise / not exercise dichotomy. The results for exercise-type activities are shown in Table 4.1. Overall, around 60% of Australian and of New Zealand supplementary foods users indicated that they last consumed the product in an exercise-related context. However, some caution is required in interpreting these results. Because the question only asked about when the person last used the product, respondents who last consumed the supplementary food outside of a sporting or exercise occasion may still be physically active. Again, as the activities are related to supplementary foods which include weight-loss products, some consumption unrelated to exercise is expected.
Table 4.2 Activity associated with last product type use*
Activity associated with last use Protein (%)
(n=592)
Energy (%)
(n=98)
Miscellaneous+ Pre-workout (%)
(n=33)
Gym not elsewhere classified 20.1
(17.0 – 23.6) 3.1
(0.8 – 9.3)** 30.3
(16.2 – 48.9)**
Weight control 13.5
(10.9 – 16.6) 1.0
(0.1 – 6.4)**
6.1 (1.2 – 21.0)**
Snack 10.5
(8.2 – 13.3) 9.2
(4.5 – 17.2)**
24.2 (11.7 – 42.6)**
Weight training 12.0
(9.5 – 15.0) 1.0
(0.1 – 6.4)**
12.1 (4.0 – 29.1)
Supplement 8.3
(6.2 – 10.9) 9.2
(4.5 – 17.2)**
0.0 (0.0 – 13.0)**
Meal replacement 7.4
(5.5 – 9.9) 2.0
(0.4 – 7.9)**
3.0 (0.2 – 17.5)**
Running 4.7
(3.2 – 6.8) 20.4
(13.2 – 30.0)**
0.0 (0.0 – 13.0)**
Cycling 1.9
(1.0 – 3.4) 27.6
(19.2 – 37.7)**
3.0 (0.2 – 17.5)**
Field ball sports 4.2
(2.8 – 6.3) 4.1
(1.3 – 10.7)**
3.0 (0.2 – 17.5)**
Derived estimate
Exercise-type activities*** 57.9
(53.8 – 61.9) 77.6
(67.8 – 85.1)
66.7 (48.1 – 81.4)
* Some product type and activity categories have been omitted due to small sample size. ** The confidence interval is wide due to small expected counts. *** Base includes activities not included in the previous part of the table. Table 4.2 shows how the product type use is associated with the different activities. Protein type products were most often used for gym activities (1 in 5 consumption occasions). Around half of last energy-type product use was in the context of cycling or running. Around
29
30% of last miscellaneous product use was for gym activities, with almost 25% associated with snacking. Energy product users appeared to be slightly more likely to consume their product in an exercise context.
How much do people usually consume?
Usual amount of consumption
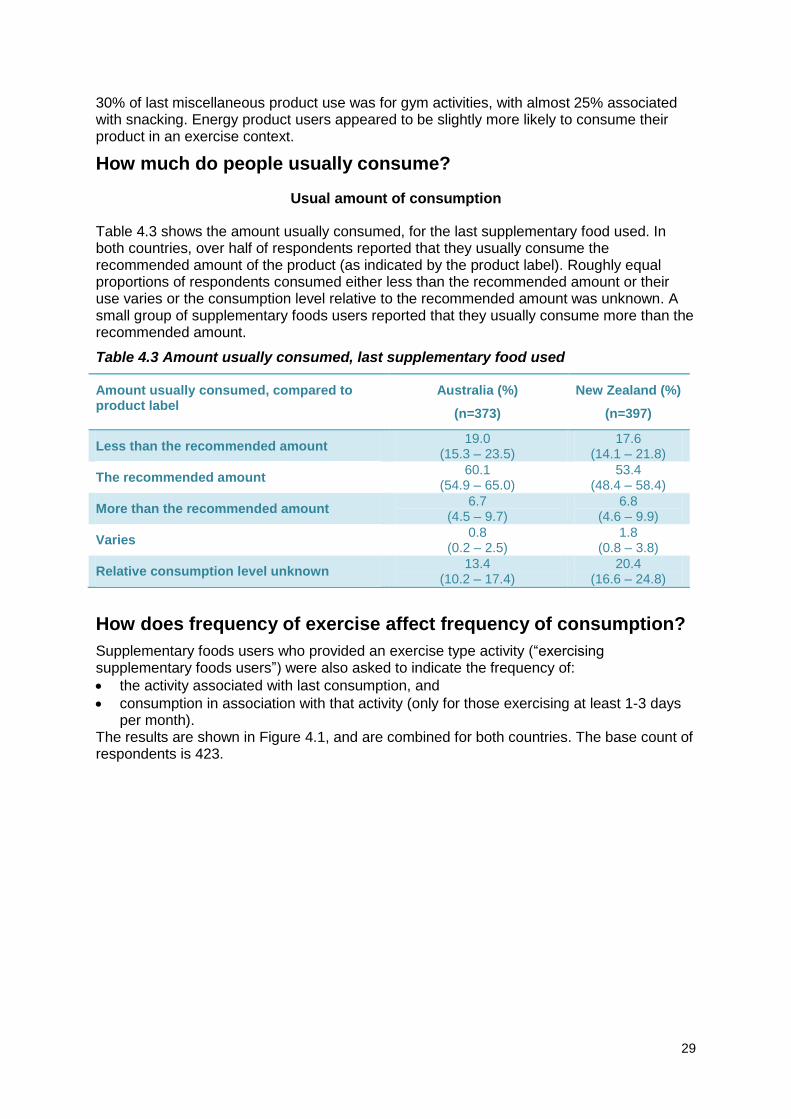
Table 4.3 shows the amount usually consumed, for the last supplementary food used. In both countries, over half of respondents reported that they usually consume the recommended amount of the product (as indicated by the product label). Roughly equal proportions of respondents consumed either less than the recommended amount or their use varies or the consumption level relative to the recommended amount was unknown. A small group of supplementary foods users reported that they usually consume more than the recommended amount.
Table 4.3 Amount usually consumed, last supplementary food used
Amount usually consumed, compared to product label
Australia (%)
(n=373)
New Zealand (%)
(n=397)
Less than the recommended amount 19.0
(15.3 – 23.5) 17.6
(14.1 – 21.8)
The recommended amount 60.1
(54.9 – 65.0) 53.4
(48.4 – 58.4)
More than the recommended amount 6.7
(4.5 – 9.7) 6.8
(4.6 – 9.9)
Varies 0.8
(0.2 – 2.5) 1.8
(0.8 – 3.8)
Relative consumption level unknown 13.4
(10.2 – 17.4) 20.4
(16.6 – 24.8)
How does frequency of exercise affect frequency of consumption?
Supplementary foods users who provided an exercise type activity (“exercising supplementary foods users”) were also asked to indicate the frequency of:
the activity associated with last consumption, and
consumption in association with that activity (only for those exercising at least 1-3 days per month).
The results are shown in Figure 4.1, and are combined for both countries. The base count of respondents is 423.

30
Figure 4.1 Frequency of consumption in association with frequency of activity
Just over 50% of exercising supplementary foods users usually undertook their mentioned exercise activity two to four days a week. This group, and those who undertook their mentioned exercise for five to six days a week, contained a sizeable subset who consumed the same supplementary food every time they performed that same exercise. Across all exercise frequencies, exercising supplementary foods users appeared to consistently consume the supplementary food: the smallest group of respondents were the ones who said that their use varies. Given that these exercising respondents represent around 60% of supplementary foods consumers, these results suggest that supplementary foods consumers have a pattern of consumption consistent with that intended by regulation.
What is the relative timing of exercise-related consumption?
The relative timing of exercise-related consumption was analysed for respondents who used the supplementary food at least every 2nd or 3rd time they undertook the exercise activity. This limits the analysis to exercising respondents who have a reasonably frequent pattern of product use in association with the activity (“active supplementary foods users”). Respondents could provide more than one answer, and Figure 4.2 shows the results. The base count of respondents is 307. The most common timing of use was after the active supplementary foods user had finished the activity.

31
Figure 4.2 Timing of consumption in relation to exercise
Conclusions on consumption patterns
There did not appear to be any major differences in the pattern of consumption between Australia and New Zealand, based on last supplementary food consumption. In both countries, around 60% of last use was in an exercise-related context, with gym-based exercise being the most commonly mentioned exercise activity. The relative popularity of the gym may be somewhat influenced by the winter timing of the survey. The most common non-exercise reasons for last use were consumption for weight loss / snack / diet supplement motives. However, because the survey only asked about last use, at least some respondents who provided a non-exercise context could still be physically active. These findings are also affected by the inclusion of weight loss and meal replacement foods in the category of supplementary foods. Looking at the level of consumption, in both countries over half stated they usually consume the recommended amount of the supplementary food. Around 7% of supplementary foods users in both Australia and New Zealand indicated that they normally use more than the recommended amount. Supplementary foods users who provided an exercise-related activity as their context for last use of the supplementary food were asked further consumption-related questions. Most commonly, the specific exercise mentioned was undertaken two to four days a week, with five to six days a week as the next most common category. Use of the supplementary food in association with the exercise was consistent for most users, and for these two groups the most common use was every time the exercise was performed. This last set of supplementary foods users was further refined, to contain only those who reported using the supplementary food at least every 2nd or 3rd time they performed the exercise. These respondents were asked when they used the supplementary food in

32
association with the exercise, and multiple responses could be provided. The most common timing of consumption was after the exercise was finished. Gels appeared to be most commonly consumed during exercise, powders were most commonly consumed after or before exercise, and bars consumption occurred at any relative timing.

33
Chapter 5 Sources of information
This chapter describes where respondents reported they obtained information about consumer-identified sports foods. The main sources of information are identified. Finally, based on place of last purchase, the relative popularity of outlets for supplementary foods is outlined.
What information sources about the risks and benefits of consumer-identified sports foods are used?
Supplementary foods users were asked to indicate, from a list read out by the interviewer, all sources of information they had been exposed to about consumer-identified sports foods.9 As shown in Table 5.1, some information sources are much more popular than others. In both countries, product labels, peers (family, friends, workmates), print media (books, newspapers, magazines) and the internet were the most common avenues that respondents identified for learning about the benefits and risks of consumer-identified sports foods consumption.
Table 5.1 All information sources mentioned, supplementary foods users, by country
Information source* Australia (%)
(n=366)
New Zealand (%)
(n=385)
Product labels 71.9
(66.9 – 76.3) 34.0
(29.3 – 39.0)
Family, friends, workmates 54.4
(49.1 – 59.5) 38.7
(33.8 – 43.8)
Books, newspapers, magazines 51.6
(46.4 – 56.9) 27.5
(23.2 – 32.3)
Internet, websites 48.9
(43.7 – 54.1) 34.3
(30.0 – 39.3)
Product brochures, pamphlets, billboards 39.6
(34.6 – 44.8) 20.0
(16.2 – 24.4)
Academic sources, eg lectures, seminars, school, university, TAFE, tech, journal articles
36.1 (31.2 – 41.2)
13.8 (10.6 – 17.7)
Shop assistant, pharmacy assistant 27.0
(22.6 – 32.0) 13.5
(10.3 – 17.4)
Dietitian, nutritionist 22.1
(18.1 – 26.8) 23.6
(19.5 – 28.3)
TV, radio 18.6
(14.8 – 23.0) 7.3
(5.0 – 10.5)
Doctor, pharmacist, nurse, midwife 13.7
(10.4 – 17.7) 9.6
(6.9 – 13.1)
Government agencies 6.3
(4.1 – 9.4) 2.6
(1.3 – 4.9)
Coach 4.9
(3.1 – 7.7) 7.5
(5.2 – 10.8)
Gym 2.7
(1.4 – 5.1) 4.2
(2.5 – 6.8)
Other 4.1
(2.4 – 6.8) 3.6
(2.1 – 6.2)
* Respondents could identify more than one information source, so the percentages sum to more than 100%.
9 The question was asked for all “sports food products” used and so does not just relate to supplementary foods
use.

34
There appears to be a number of statistically significant differences between Australia and New Zealand, and in all cases a higher proportion of Australian supplementary foods users mentioned the source. However, the interpretation of these differences is not clear cut since Australian respondents mentioned twice as many sources compared to New Zealand respondents: a median of 4 sources compared to a median of 2. The reduction to a shorter list of 14 sources in Table 5.1 retained the same median values. It is not clear why this difference occurred as respondents in both countries were read the same list of 17 information sources in its entirety plus an “other” category.
What is the main information source that influenced use?
Table 5.2 shows the percentage of supplementary foods users who identified each type of information source as the single largest influence on their decision to use consumer-identified sports foods.10 In both countries, the most commonly mentioned main source of information about these foods was family, friends, and workmates. Around 1 in 4 supplementary foods users identified these people as the main influence on their decision to use consumer-identified sports foods. Other commonly identified influential sources were internet / websites and product labels.
Table 5.2 Information source that was most influential, supplementary foods users, by country
Main information source Australia (%)
(n=350)
New Zealand (%)
(n=361)
Family, friends, workmates 27.1
(22.6 – 32.2) 24.1
(19.8 – 28.9)
Internet, websites 15.1
(11.6 – 19.4) 14.1
(10.8 – 18.3)
Product labels 10.9
(7.9 – 14.7) 11.9
(8.8 – 15.8)
Books, newspapers, magazines 10.3
(7.4 – 14.1) 7.8
(5.3 – 11.1)
Dietitian, nutritionist 8.3
(5.7 – 11.8) 15.8
(12.3 – 20.1)
Academic sources, eg lectures, seminars, school, university, TAFE, tech, journal articles
4.9 (2.9 – 7.8)
2.5 (1.2 – 4.8)
Shop assistant, pharmacy assistant 4.6
(2.7 – 7.5) 4.4
(2.6 – 7.2)
Doctor, pharmacist, nurse, midwife 4.6
(2.7 – 7.5) 3.3
(1.8 – 5.9)
Product brochures, pamphlets, billboards 2.9
(1.5 – 5.5) 3.0
(1.6 – 5.5)
Coach 2.9
(1.5 – 5.4) 6.4
(4.2 – 9.5)
TV, radio 2.6
(1.3 – 5.0) 1.7
(0.7 – 3.8)
Gym 1.4
(0.5 – 3.5) 3.3
(1.8 – 5.9)
Government agencies 0.9
(0.2 – 2.7) 0
(0.0 – 1.3)
Other 3.7
(2.1 – 6.4) 1.7
(0.7 – 3.8)
10
The question was asked for all “sports food products” used and so does not just relate to supplementary foods use.

35
The only statistically significant difference between Australia and New Zealand is that New Zealand respondents were almost twice as likely to mention dietitians or nutritionists as their single main influence. The most influential information source was analysed separately for protein and energy products. For both types of product, family/friends/workmates were the most commonly mentioned influential source, reported by just over 20% of users of this product type. For protein products, the other three main sources of information reported by at least 10% of users were internet/websites, dietitian/nutritionist, and product labels. For energy products, only product labels were also mentioned by at least 10%. The other product type categories were associated with small respondent numbers, and therefore could not be analysed at this level of detail.
Places of last supplementary foods purchase
To provide a snapshot of purchase behaviour, supplementary foods users were asked to indicate the place where they had last purchased or obtained the product. The results are shown in Table 5.3. The most common places of last purchase, which were identified by over half of Australian and New Zealand supplementary foods users, were a general retailer – such as a supermarket – and a “health-focussed” retailer – such as a health food shop. Also of interest is that the internet / overseas was the most recent source for around 10% of supplementary foods users in both countries.
Table 5.3 Place of last supplementary foods purchase
Place of last purchase Australia (%)
(n=373)
New Zealand (%)
(n=397)
General retailer, e.g. supermarket, service station, dairy 35.4
(30.6 – 40.5) 35.3
(30.6 – 40.2)
Heath food shop, naturopath, supplement retailer 26.3
(21.9 – 31.1) 18.4
(14.8 – 22.6)
Pharmacy, chemist 11.3
(8.3 – 15.0) 5.3
(3.4 – 8.1)
Gym, sports shop 10.7
(7.9 – 14.4) 16.6
(13.2 – 20.7)
Internet or overseas 8.8
(6.3 – 12.3) 10.3
(7.6 – 13.9)
Sponsor, direct selling 2.7
(1.4 – 5.0) 2.0
(0.9 – 4.1)
Sports coach, trainer 2.4
(1.2 – 4.7) 3.5
(2.0 – 6.0)
Team mates, peers, family 1.6
(0.7 – 3.6) 6.8
(4.6 – 9.9)
Doctor, dietitian, nutritionist 0.8
(0.2 – 2.5) 1.8
(0.8 – 3.8)
There were two differences between Australian and New Zealand supplementary foods users. Compared to New Zealand supplementary foods users, over twice as many Australian supplementary foods users identified a pharmacy or chemist as their last place of purchase, and sourcing from team mates, peers, or family was only a third as popular. A key message is that, in both countries, it appears that over 75% of supplementary foods users last purchased the product from a physical store in their country.

36
Conclusions on information sources
As a group, supplementary foods users have accessed a wide and diverse range of information sources on risks and benefits of consumer-identified sports foods. The most commonly used information sources were product labels, peers (family, friends, workmates), print media (books, newspapers, magazines) and the internet, with Australian supplementary foods users averaging twice as many information sources as New Zealand users. When asked to identify their main source of influence to use consumer-identified sports foods products, around 1 in 4 supplementary foods users identified peers (family, friends, and workmates). Other commonly identified influential sources were internet / websites and product labels. The most common places of last purchase, which were identified by over half of Australian and New Zealand supplementary foods users, were retailers, whether general or health-focussed. The internet / overseas was the most recent source for around 10% of supplementary foods users in both countries.

37
Chapter 6 Conclusions
Main research findings
Prevalence of use
Around 1 in 10 Australians and New Zealanders aged 15 years and over had consumed at least one consumer-identified sports food, most commonly a supplementary food, in the last 4 weeks. Most supplementary foods consumers had used protein products (about 80%), followed by products marketed to provide energy (about 15% of consumers). Within the overall population aged 15 years and older, however, even protein products were consumed by relatively few people (around 8% of the population). Less than 2% of this population consumed energy-type supplementary foods and less than 1% consumed more specialist supplementary foods such as pre-workout supplements.
Characteristics of supplementary foods users
There were no important differences between Australian users and New Zealand users. There was no gender bias in overall consumption. However, those aged 15-19 years tended to be somewhat over-represented among users, whereas those aged 60 years and older tended to be somewhat under-represented. Users tended to be reasonably well educated, although had a slight tendency to be in a lower status occupation, and appeared to reflect the ethnic diversity of the overall population of each country. Around half of Australian and New Zealand users reported consuming “5+” serves of fruit and vegetables a day, and around 43% were underweight or normal weight, based on self-reported height and weight. Just over 60% of both groups reported high levels of physical activity using the IPAQ measure. This suggests that respondents who regularly exercise are over-represented in this subgroup compared to the general population. This finding is not unexpected given the focus of the study was sports foods. The BMI findings in comparison to the latest general adult population BMI results also suggest that supplementary foods users may differ in a number of ways from the overall adult population. In particular, supplementary foods users may have more healthy lifestyles compared to the general population. The most common reason for use / benefit mentioned was “energy”: more than 1 in 5 respondents mentioned some aspect of use associated with energy. A group of users also appeared to be using the products for diet-related reasons, such as meal replacements and snacks, as well as those who specifically mentioned a weight control reason. Around 6% of supplementary foods users reported ever having experienced a problem or side effect associated with consumer-identified sports food consumption. The nature of the issue, the type of product, and the elapsed time since the experience were not examined in this research. When looking at the product types, some differences emerged. Males were significantly more likely to report consuming products associated with energy or pre-workout concepts, miscellaneous products. Females were significantly more likely to report consuming protein products. Protein products were consistently used at high rates across the age groups. Energy products were not as common for respondents aged 15-29 years as they were for the older age groups. For users of protein-type products, the most frequently mentioned benefit was building muscle, followed by energy, high protein, and weight control. For users of energy type

38
products, the most commonly mentioned benefit was energy, with almost 60% of users spontaneously identifying this benefit. Just over 20% of energy-type product users mentioned exercise, and just over 10% mentioned recovery and/or health benefits. Miscellaneous products were most commonly linked to energy benefits, with recovery and building muscle also mentioned by at least 15% of product users
Patterns of supplementary foods consumption
There did not appear to be any major differences in the pattern of consumption between Australia and New Zealand, based on last supplementary food consumption. Around 60% of last use was in an exercise-related context, with gym-based exercise being the most common. The most common non-exercise reasons for last use were consumption for weight loss / snack / diet supplement motives. Over half of the supplementary foods users stated they usually consume the recommended amount of the supplementary food. Around 7% of supplementary foods users in both Australia and New Zealand indicated that they normally use more than the recommended amount. For those who provided an exercise context for use, the specific exercise mentioned was most commonly undertaken two to four days a week, with five to six days a week as the next largest category. Use of the supplementary food in association with the exercise was consistent for most users, and for these two groups the most common use was every time the exercise was performed. For supplementary foods users who frequently used the product in combination with the reported exercise, the most common timing of consumption was after the exercise was finished. Protein-type products were most often used for gym activities (1 in 5 consumption occasions). Around half of last energy-type product use was in the context of cycling or running. Around 30% of last miscellaneous products use was for gym activities, with almost 25% associated with snacking. Energy-type product users appeared to be slightly more likely to consume their product in an exercise context, although over half of consumption occasions for each product type occurred in association with exercise.
Sources of information about consumer-identified sports foods
The most commonly used information sources were product labels, peers (family, friends, workmates), print media (books, newspapers, magazines) and the internet, with Australian supplementary foods users averaging twice as many information source mentions as New Zealand users. Around 1 in 4 supplementary foods users identified peers (family, friends, and workmates) as their main source of influence to use sports foods products. Other commonly identified influential sources were internet/ websites and product labels. The most common places of last purchase, which were identified by over half of Australian and New Zealand supplementary foods users, were retailers, whether general or health-focussed. The internet/overseas was the most recent source for around 10% of supplementary foods users in both countries.
Key messages from the research
The research suggests that consumers do not share the food regulation definition of “specially formulated” sports food product. As illustrated by the breadth of product types mentioned in the survey, outlined at the start of Chapter 3, there appears to be little or no differentiation, by consumers, between formulated supplementary sports foods (Standard

39
2.9.4), formulated supplementary foods / formulated meal replacements (Standard 2.9.3), and other foods. Therefore, consumers appear to have a different mental model of these types of food products that does not match the current regulation categorisation. Use of supplementary foods (viewed as consumer-identified sports foods from the perspective of consumers) occurs across genders, age groups, ancestries/ ethnicities, income levels, and lifestyles. Consumption occurs both in exercise-related contexts, as well as in situations where the consumer is not exercising. Within this survey, consumer definitions of specially formulated sports food products11 included meal replacements, weight loss products, and general foods (e.g. pasta). Just over 50% of exercising supplementary foods users usually undertook their mentioned exercise activity at least two to four days a week. This group contained a sizeable subset who consumed the same supplementary food every time they performed that same exercise. Given that these exercising respondents represent around 60% of supplementary foods consumers, these results suggest that supplementary foods consumers have a pattern of consumption consistent with that intended by regulation.
11
As asked in the survey.

40
References
Australian Bureau of Statistics (2011a) 31010DOC002_201106 Australian Demographic Statistics, June 2011 (Population by age and sex tables). Downloaded from http://www.abs.gov.au/AUSSTATS/[email protected]/DetailsPage/3101.0Jun%202011?OpenDocument on 20 July 2012. Australian Bureau of Statistics (2011b) Measures of physical activity. In 4835.0.55.001 - Physical Activity in Australia: A Snapshot, 2007-08. Available from http://www.abs.gov.au/ausstats/[email protected]/Latestproducts/4835.0.55.001Main%20Features32007-08?opendocument&tabname=Summary&prodno=4835.0.55.001&issue=2007-08&num=&view Australia Bureau of Statistics (2011c) Overweight and obesity in adults in Australia: a snapshot. 4842.0.55.001 2007 – 08. Available from http://www.ausstats.abs.gov.au/Ausstats/subscriber.nsf/0/7DC7186F4A9950DECA25789C0023DCEF/$File/4842055001_200708.pdf Australian Bureau of Statistics (2012) Article – In pursuit of 2 & 5 – fruit and vegetable consumption in Australia. In Year Book Australia, 2012. Available from http://www.abs.gov.au/ausstats/[email protected]/Lookup/1301.0Main+Features2362012 Department of Health and Ageing (2005) An active way to better health: National physical activity guidelines for adults. Available from http://www.health.gov.au/internet/main/publishing.nsf/Content/BC3101B1FF200CA4CA256F9700154958/$File/adults_phys.pdf Keynes N, Brockelsby A-L (2011) Quantitative Research into Consumer Usage of Sports Foods in Australia and New Zealand August 2011: Methodology Report. Sydney: Newspoll. McMillan J, Beavis A, Jones FL (2009) The AUSEI06: A new socioeconomic index for Australia. Journal of Sociology 45(2):123-149 Ministry of Health (2008) A Portrait of Health. Key Results of the 2006/07 New Zealand Health Survey. Wellington: Ministry of Health. Available from http://www.health.govt.nz/publication/portrait-health-key-results-2006-07-new-zealand-health-survey National Health and Medical Research Council (2005) Food for health, Dietary guidelines for Australians: A guide to healthy eating. Canberra: National Health and Medical Research Council. Downloaded from http://www.nhmrc.gov.au/_files_nhmrc/publications/attachments/n31.pdf on 26 September 2012. Statistics New Zealand (2012) National Population Estimates: March 2012 Quarter – tables. Downloaded from http://www.stats.govt.nz/browse_for_stats/population/estimates_and_projections/NationalPopulationEstimates_HOTPMar12qtr.aspx on 20 July 2012. Sutcliffe P, Flint R (2011) Sampling Design and Survey Administration Guide. Canberra: Food Standards Australia New Zealand.

41
University of Otago & Ministry of Health (2011) A Focus on Nutrition: Key findings of the
2008/09 New Zealand Adult Nutrition Survey. Wellington: Ministry of Health. Available from
http://www.health.govt.nz/system/files/documents/publications/a-focus-on-nutrition-v2.pdf

42
Appendix 1: Questionnaire
INTRODUCTION Good morning \ afternoon \ evening. My name is.... (NAME) from (INSERT Newspoll in Sydney / Consumer Link in New Zealand). We are conducting an important survey about sports foods on behalf of Food Standards Australia New Zealand, the government body responsible for food standards. May I please speak to the person in your household aged 15 years and over who had the most recent birthday? (RE-INTRODUCE IF NECESSARY) This survey will assist Food Standards in its review of the sports food standard and we’d like to include the opinions of different types of people. If you’re willing to participate, could I please start with your first name? INTERVIEWER PLEASE RECORD IN FIRST QUESTION Just to let you know this call may be monitored for quality and coaching purposes and we are not selling anything. Your responses are confidential and your answers will be used for research purposes only. These surveys are taking between 3 and 15 MINUTES depending on people’s answers (most surveys are taking 3 minutes). 1(a) RECORD COUNTRY PROG NOTE:
- SINGLE RESPONSE
1 Australia
2 New Zealand
1(b) RECORD AREA PROG NOTE:
- SINGLE RESPONSE
1 Brisbane 14 Northland region
2 Rest QLD 15 Auckland region
3 Sydney 16 Waikato region
4 Rest NSW ex ACT 17 Bay of Plenty region
5 ACT 18 Gisborne region
6 Melbourne 19 Hawke's Bay region
7 Rest VIC 20 Taranaki region
8 Adelaide 21 Manawatu-Wanganui region
9 Rest SA 22 Wellington region
10 Perth 23 Tasman region
11 Rest WA 24 Nelson region
12 Tasmania 25 Marlborough region
13 Northern Territory 26 West Coast region
27 Canterbury region
28 Otago region
29 Southland region
RECORD SEX

43
PROG NOTE: - SINGLE RESPONSE
1 Male
2 Female
3 What is your current age?
IF 98 OR OLDER RECORD AS ‘98’ IF REFUSED RECORD AS ‘99’ PROG NOTE: - ALLOW FOR A TWO DIGIT RESPONSE - ALLOW A RANGE FROM 15-99 Age ___ ___ PROG NOTE: ASK IF REFUSED CURRENT AGE IE CODE 99 IN Q3. OTHERS GO TO Q5 4 Which age group do you belong to? READ OUT PROG NOTE: - SINGLE RESPONSE
1 15 to 17
2 18 to 19
3 20 to 24
4 25 to 29
5 30 to 34
6 35 to 39
7 40 to 44
8 45 to 49
9 50 to 54
10 55 to 59
11 60 to 64
12 65 to 69
13 70 years and over
99 DO NOT READ Refused

44
PROG NOTE: ASK ALL RESPONDENTS 5a Now a question about sports food products, which can be used for sports and other reasons.
These are products specially formulated to help people achieve specific nutritional or performance goals, such as providing energy, assisting endurance or recovery after sport, or building muscles and strength. Sports food products include carbohydrate or protein bars, shakes, powders, tablets or gels, but do not include ready-made sports drinks or energy drinks such as vitamin waters, Gatorade, Powerade, or Red Bull. (PAUSE) Have you personally consumed any specially formulated sports food products, such as carbohydrate or protein bars, shakes, powders, tablets or gels in the past 7 days? DO NOT READ
PROG NOTE: - SINGLE RESPONSE
1 Yes
2 No
3 Don’t know
PROG NOTE: ASK IF NOT TAKEN IN THE PAST 7 DAYS IE CODE 2-3 IN Q5a. CODE 1 GO TO A1 5b Have you personally consumed any specially formulated sports food products in the past 14
days? DO NOT READ
PROG NOTE: - SINGLE RESPONSE
1 Yes
2 No
3 Don’t know
PROG NOTE: ASK IF NOT TAKEN IN THE PAST 14 DAYS IE CODE 2-3 IN Q5b. CODE 1 IN Q5b GO TO A1 5c Have you consumed any in the past 4 weeks? DO NOT READ
PROG NOTE: - SINGLE RESPONSE
1 Yes
2 No
3 Don’t know

45
SECTION A - PROG NOTE: ASK IF CONSUMED SPORTS FOODS IE CODE 1 IN Q5a, Q5b or Q5c. CODE 2-3 IN Q5c THANK AND GO TO Y7 A1 Which particular sports food products have you consumed in the (PROG NOTE: IF CODE 1
IN Q5A INSERT “last 7 days” IF CODE 1 IN Q5b INSERT “last 14 days” IF CODE 1 IN Q5c INSERT “last 4 weeks”)? Which others? PROBE FOR FULL BRAND NAME AND PRODUCT TYPE EG MUSASHI PROTEIN POWDER. IF NECCESARY REPEAT “Remember these include carbohydrate or protein bars, shakes, powders, tablets or gels, but do not include ready-made sports drinks or energy drinks such as vitamin waters, Gatorade, Powerade, or Red Bull.” IF RESPONDENT MENTIONS A DRINK DOUBLE CHECK THAT IT WAS NOT READY-MADE PROG NOTE: - MULTI RESPONSES ALLOWED - IF CODES 1-8 SELECTED THEN CANNOT SELECT CODE 9
1 Brand and type 1 (SPECIFY)
2 Brand and type 2 (SPECIFY)
3 Brand and type 3 (SPECIFY)
4 Brand and type 4 (SPECIFY)
5 Brand and type 5 (SPECIFY)
6 Brand and type 6 (SPECIFY)
7 Brand and type 7 (SPECIFY)
8 Brand and type 8 (SPECIFY)
9 Don’t know
PROG NOTE: ASK IF MENTION 1 OR MORE BRANDS/TYPE IE CODE 1-8 IN A1. CODE 9 THANK AND TERMINATE (NE1) WITH “Thank you for your time but we are looking to ask some further questions relating to specific brands and types of sports foods”.
A2 Thinking about the last time you used (PROG NOTE: INSERT FIRST BRAND \ TYPE
MENTIONED IE CODE 1 IN A1). Was it for a particular sport or exercise, or some other physical activity including your work, or was it for some other reason? DO NOT READ
PROG NOTE: - SINGLE RESPONSE
1 Sport or exercise (SPECIFY)
2 Other physical activity (SPECIFY)
3 Other reason (SPECIFY)
4 No reason \ don’t know

46
PROG NOTE: ASK IF USED FOR SPORT \ EXERCISE OR PHSYICAL ACTIVITY IE CODE 1-2 IN A2. OTHERS GO TO A6 A3 Thinking about the (PROG NOTE: INSERT SPORT \ EXERCISE OR PHYSICAL ACTIVITY
SPECIFIED IN A2) you were doing. How often do you usually do this? Is it…? READ OUT PROG NOTE:
- SINGLE RESPONSE
1 Every day
2 5 to 6 days a week
3 2 to 4 days a week
4 Once a week
5 1 to 3 days a month
6 Or, less often
7 DO NOT READ Don’t know \ varies
PROG NOTE: ASK IF DO AT LEAST 1-3 DAYS A MONTH IE CODE 1-5 IN A3. OTHERS GO TO A6 A4 Thinking again about the (PROG NOTE: INSERT FIRST BRAND \ TYPE SPECIFIED IN A1
IE CODE 1 IN A1) you used in relation to (PROG NOTE: INSERT SPORT \ EXERCISE OR PHYSICAL ACTIVITY MENTIONED IN A2). Which one of the following best describes when you would usually use that product? Is it…? READ OUT
PROG NOTE:
- SINGLE RESPONSE
1 Every time you do that particular activity
2 Every 2nd
or 3rd
time you do that particular activity
3 Or, less often
4 DO NOT READ Varies
PROG NOTE: ASK IF USE AT LEAST EVERY 2
ND OR 3
RD TIME IE CODE 1-2 IN A4. OTHERS GO
TO A6 A5 Which of the following describe when you usually use (PROG NOTE: INSERT FIRST BRAND
\ TYPE MENTIONED IE CODE 1 IN A1)? READ OUT PROG NOTE: - MULTI RESPONSES ALLOWED
1 Before you do (PROG NOTE: INSERT SPORT \ EXERCISE OR PHYSICAL ACTIVITY MENTIONED IN A2)
2 During (PROG NOTE: INSERT SPORT \ EXERCISE OR PHYSICAL ACTIVITY MENTIONED IN A2)
3 After you finish (PROG NOTE: INSERT SPORT \ EXERCISE OR PHYSICAL ACTIVITY MENTIONED IN A2)
4 At other times

47
PROG NOTE: ASK ALL USED SPORTS FOOD IE CODE 1 IN Q5a, b OR c A6 Thinking about when you use (PROG NOTE: INSERT FIRST BRAND \ TYPE MENTIONED
IE CODE 1 IN A1). Compared to what the label says do you usually have…? READ OUT PROG NOTE: - SINGLE RESPONSE
1 Less than the recommended amount
2 The recommended amount
3 More than the recommended amount
4 Or, are you not aware what the recommended amount is
5 DO NOT READ Varies
PROG NOTE: ASK IF NOT AWARE WHAT RECOMMENDED AMOUNT IS IE CODE 4 IN A6. OTHERS GO TO A8 A7 Can you please tell me how much of that (PROG NOTE: INSERT FIRST BRAND \ TYPE
MENTIONED IE CODE 1 IN A1) you usually have? PROBE FOR PORTION SIZE EG 1 BAR, 2 SCOOPS OF POWDER, 2 GEL PACK ETC
PROG NOTE: - OPEN TEXT FIELD __________________________________________________________________________ PROG NOTE: ASK ALL USED SPORTS FOOD IE CODE 1 IN Q5a, b OR c A8 And for what particular benefits or reasons did you use (PROG NOTE: INSERT FIRST
BRAND \ TYPE MENTIONED IE CODE 1 IN A1)? What other benefits or reasons? PROBE FULLY
PROG NOTE: - OPEN TEXT FIELD __________________________________________________________________________ A9 In which of the following places did you last purchase or obtain (PROG NOTE: INSERT
FIRST BRAND \ TYPE MENTIONED IE CODE 1 IN A1)? READ OUT STOP READING LIST ONCE RESPONDENT HAS PROVIDED AN ANSWER PROG NOTE: - SINGLE RESPONSE - RANDOMISE 1-10, THEN 11-12 LAST
1 A gym
2 A health food shop
3 A supermarket
4 The internet
5 A pharmacy or chemist store
6 A doctor
7 A dietician or nutritionist
8 A sports coach or trainer
9 Team mates or others you do the activity with
10 A sponsor
11 Or some other place (SPECIFY)
12 DO NOT READ Don’t know

48
_________________________________________________________________________________ SECTION B - PROG NOTE: ASK ALL USED SPORTS FOOD IE CODE 1 IN Q5a, b OR c B1 Thinking about all the sports food products you mentioned you had taken in the (PROG
NOTE: IF CODE 1 IN Q5A INSERT “last 7 days” IF CODE 1 IN Q5b INSERT “last 14 days” IF CODE 1 IN Q5c INSERT “last 4 weeks”). Would you say the amount you have consumed is…? READ OUT
PROG NOTE:
- SINGLE RESPONSE
1 More than you would usually consume
2 About the same as you would usually consume
3 Or, less than you would usually consume
4 DO NOT READ Don’t know
SECTION C - PROG NOTE: ASK ALL USED SPORTS FOOD IE CODE 1 IN Q5a, b OR c C1 From which of the following, if any, have you obtained information about the benefits or risks
associated with consuming specially formulated sports food products? READ OUT PROG NOTE:
- MULTI RESPONSES ALLOWED - IF CODES 1-19 SELECTED THEN CANNOT SELECT CODE 20-21 - SHOW 1-5, THEN RANDOMISE 6-14, THEN 15-21 LAST
1 Product brochures or pamphlets
2 Product labels
3 Doctor
4 Pharmacy assistant
5 Pharmacist
6 Dietician or nutritionist
7 Shop assistant
8 Internet or websites
9 Books
10 TV
11 Newspapers or magazines
12 Lectures or seminars
13 Journal Articles
14 School, University (PROG NOTE: IF AUS INSERT “or TAFE”) (IF NZ INSERT “or tech”)
15 Government agencies
16 (PROG NOTE: IF NZ INSERT) Drug Free Sport New Zealand
17 (PROG NOTE: IF AUS INSERT) Australian Sports Anti-Doping Authority
18 Family or friends
19 Or some other place (SPECIFY)
20 DO NOT READ None
21 DO NOT READ Don’t know

49
PROG NOTE: ASK IF MENTIONED 2 OR MORE SOURCES IE 2 OR MORE CODES 1-19IN C1. OTHERS AUTOFILL RESPONSE FROM C1 IN C2 AND GO TO C3 C2 Which was the one information source that most influenced your decision to use sports
foods? DO NOT READ PROG NOTE:
- SINGLE RESPONSE - CODE FRAME AS PER C1 - ONLY DISPLAY CODE 1-19 SELECTED IN C1, THEN 20-21 LAST
PROG NOTE: ASK ALL CONSUMED SPORTS FOOD IE CODE 1 IN Q5a, b OR c C3 Have you personally experienced any problems or side effects from using sports food
products? DO NOT READ PROG NOTE:
- SINGLE RESPONSE
1 Yes
2 No
3 Don’t know
SECTION D - PROG NOTE: ASK ALL USED SPORTS FOOD IE CODE 1 IN Q5a, b OR c D1 I am going to ask you about the time you spent being physically active in the last 7 days.
Please answer each question even if you do not consider yourself to be an active person. Think about the activities you do at work, as part of your house and yard work, to get from place to place, and in your spare time for recreation, exercise or sport.
Now think about all the vigorous activities which take hard physical effort that you did in the
last 7 days. Vigorous activities make you breathe much harder than normal and may include heavy lifting, digging, aerobics, or fast bicycling. Think only about those physical activities that you did for at least 10 minutes at a time.
During the last 7 days, on how many days did you do vigorous physical activities? DO NOT
READ
IF REQUIRED SAY “Think only about those physical activities that you do for at least 10 minutes at a time”
PROG NOTE: - SINGLE RESPONSE
0 Zero
1 One
2 Two
3 Three
4 Four
5 Five
6 Six
7 Seven
8 Don’t know
9 Refused

50
PROG NOTE: ASK IF VIGOROUS PHYSICAL EXERCISE ON AT LEAST ONE DAY IE CODE 1-7 IN D1. OTHERS GO TO D3 D2 (a) How much time did you usually spend doing vigorous physical activities on one of those days?
IF REQUIRED SAY “Think only about those physical activities that you do for at least 10 minutes at a time” IF DON’T KNOW SAY “An average time for one of those days on which you do vigorous activity is being sought”
IF PATTERN OF TIME SPENT VARIES WIDELY FROM DAY TO DAY OR DON’T KNOW RECORD ‘00’ FOR HOURS AND ‘998’ FOR MINUTES
IF REFUSED RECORD AS ‘00’ FOR HOURS AND ‘999’ FOR MINUTES MAXIMUM OF 16 HOURS AND 960 MINUTES PROG NOTE: - HOURS AND MINUTES BOTH MANDATORY FIELDS - HOURS AND MINUTES TO BE RECORDED SEPARATELY - ALLOW FOR A 2 DIGIT RESPONSE FOR HOURS - ALLOW FOR A 3 DIGIT RESPONSE FOR MINUTES - ALLOW FOR HOURS A RANGE FROM 0/16 - ALLOW FOR MINUTES A RANGE FROM 0/960, 998, 999 - CHECK BOTH HOURS AND MINUTES NOT ZERO ___ ___ Hours per day ___ ___ ___ Minutes per day PROG NOTE: ASK IF DON’T KNOW IE CODE 998 IN D2(a) MINUTES. OTHERS GO TO D3 D2(b) What is the total amount of time you spent over the last 7 days doing vigorous physical
activities?
IF REQUIRED SAY “Think only about those physical activities that you do for at least 10 minutes at a time”
IF DON’T KNOW RECORD ‘000’ FOR HOURS AND ‘9998’ FOR MINUTES
IF REFUSED RECORD AS ‘000’ FOR HOURS AND ‘9999’ FOR MINUTES MAXIMUM OF 112 HOURS AND 6720 MINUTES PROG NOTE: - HOURS AND MINUTES BOTH MANDATORY FIELDS - HOURS AND MINUTES TO BE RECORDED SEPARATELY - ALLOW FOR A 3 DIGIT RESPONSE FOR HOURS - ALLOW FOR A 4 DIGIT RESPONSE FOR MINUTES - ALLOW FOR HOURS A RANGE FROM 0/112 - ALLOW FOR MINUTES A RANGE FROM 0/6720, 9998, 9999 - CHECK BOTH HOURS AND MINUTES NOT ZERO ___ ___ ___ Hours per week ___ ___ ___ ___ Minutes per week

51
PROG NOTE: ASK ALL USED SPORTS FOOD IE CODE 1 IN Q5a, b OR c D3 Now think about activities which take moderate physical effort that you did in the last 7 days.
Moderate physical activities make you breathe somewhat harder than normal and may include carrying light loads, bicycling at a regular pace or doubles tennis. Do not include walking. Again, think about only those physical activities that you did for at least 10 minutes at a time.
During the last 7 days, on how many days did you do moderate physical activities? DO NOT
READ
IF REQUIRED SAY “Think only about those physical activities that you do for at least 10 minutes at a time”
PROG NOTE: - SINGLE RESPONSE
0 Zero
1 One
2 Two
3 Three
4 Four
5 Five
6 Six
7 Seven
8 Don’t know
9 Refused
PROG NOTE: ASK IF DONE MODERATE PHYSICAL EXERCISE ON AT LEAST ONE DAY IE CODE 1-7 IN D3. OTHERS GO TO D5 D4(a) How much time did you usually spend doing moderate physical activities on one of those days?
IF REQUIRED SAY “Think only about those physical activities that you do for at least 10 minutes at a time” IF DON’T KNOW SAY “An average time for one of those days on which you do moderate physical activity is being sought”
IF PATTERN OF TIME SPENT VARIES WIDELY FROM DAY TO DAY OR DON’T KNOW RECORD ‘00’ FOR HOURS AND ‘998’ FOR MINUTES
IF REFUSED RECORD AS ‘00’ FOR HOURS AND ‘999’ FOR MINUTES MAXIMUM OF 16 HOURS AND 960 MINUTES PROG NOTE: - HOURS AND MINUTES BOTH MANDATORY FIELDS - HOURS AND MINUTES TO BE RECORDED SEPARATELY - ALLOW FOR A 2 DIGIT RESPONSE FOR HOURS - ALLOW FOR A 3 DIGIT RESPONSE FOR MINUTES - ALLOW FOR HOURS A RANGE FROM 0/16 - ALLOW FOR MINUTES A RANGE FROM 0/960, 998, 999 - CHECK BOTH HOURS AND MINUTES NOT ZERO ___ ___ Hours per day ___ ___ ___ Minutes per day

52
PROG NOTE: ASK IF DON’T KNOW IE CODE 998 IN D4(a) MINUTES. OTHERS GO TO D5 D4(b) What is the total amount of time you spent over the last 7 days doing moderate physical
activities?
IF REQUIRED SAY “Think only about those physical activities that you do for at least 10 minutes at a time”
IF DON’T KNOW RECORD ‘000’ FOR HOURS AND ‘9998’ FOR MINUTES
IF REFUSED RECORD AS ‘000’ FOR HOURS AND ‘9999’ FOR MINUTES MAXIMUM OF 112 HOURS AND 6720 MINUTES PROG NOTE: - HOURS AND MINUTES BOTH MANDATORY FIELDS - HOURS AND MINUTES TO BE RECORDED SEPARATELY - ALLOW FOR A 3 DIGIT RESPONSE FOR HOURS - ALLOW FOR A 4 DIGIT RESPONSE FOR MINUTES - ALLOW FOR HOURS A RANGE FROM 0/112 - ALLOW FOR MINUTES A RANGE FROM 0/6720, 9998, 9999 - CHECK BOTH HOURS AND MINUTES NOT ZERO ___ ___ ___ Hours per week ___ ___ ___ ___ Minutes per week PROG NOTE: ASK ALL USED SPORTS FOOD IE CODE 1 IN Q5a, b OR c D5 Now think about the time you spent walking in the last 7 days. This includes at work and at
home, walking to travel from place to place, and any other walking that you might do solely for recreation, sport, exercise, or leisure.
During the last 7 days, on how many days did you walk for at least 10 minutes at a time?
DO NOT READ
IF REQUIRED SAY “think only about the walking that you do for at least 10 minutes at a time”
PROG NOTE: - SINGLE RESPONSE
0 Zero
1 One
2 Two
3 Three
4 Four
5 Five
6 Six
7 Seven
8 Don’t know
9 Refused

53
PROG NOTE: ASK IF DONE WALKING ON AT LEAST ONE DAY IE CODE 1-7 IN D5. OTHERS GO TO D7 D6(a) How much time did you usually spend walking on one of those days?
IF REQUIRED SAY “Think only about the walking that you do for at least 10 minutes at a time” IF DON’T KNOW SAY “An average time for one of those days on which you walk is being sought”
IF PATTERN OF TIME SPENT VARIES WIDELY FROM DAY TO DAY OR DON’T KNOW RECORD ‘00’ FOR HOURS AND ‘998’ FOR MINUTES
IF REFUSED RECORD AS ‘00’ FOR HOURS AND ‘999’ FOR MINUTES MAXIMUM OF 16 HOURS AND 960 MINUTES PROG NOTE: - HOURS AND MINUTES BOTH MANDATORY FIELDS - HOURS AND MINUTES TO BE RECORDED SEPARATELY - ALLOW FOR A 2 DIGIT RESPONSE FOR HOURS - ALLOW FOR A 3 DIGIT RESPONSE FOR MINUTES - ALLOW FOR HOURS A RANGE FROM 0/16 - ALLOW FOR MINUTES A RANGE FROM 0/960, 998, 999 - CHECK BOTH HOURS AND MINUTES NOT ZERO ___ ___ Hours per day ___ ___ ___ Minutes per day PROG NOTE: ASK IF DON’T KNOW IE CODE 998 IN D6(a) MINUTES. OTHERS GO TO D7 D6(b) What is the total amount of time you spent over the last 7 days walking?
IF REQUIRED SAY “Think only about the walking that you do for at least 10 minutes at a time”
IF DON’T KNOW RECORD ‘000’ FOR HOURS AND ‘9998’ FOR MINUTES
IF REFUSED RECORD AS ‘000’ FOR HOURS AND ‘9999’ FOR MINUTES MAXIMUM OF 112 HOURS AND 6720 MINUTES PROG NOTE: - HOURS AND MINUTES BOTH MANDATORY FIELDS - HOURS AND MINUTES TO BE RECORDED SEPARATELY - ALLOW FOR A 3 DIGIT RESPONSE FOR HOURS - ALLOW FOR A 4 DIGIT RESPONSE FOR MINUTES - ALLOW FOR HOURS A RANGE FROM 0/112 - ALLOW FOR MINUTES A RANGE FROM 0/6720, 9998, 9999 - CHECK BOTH HOURS AND MINUTES NOT ZERO ___ ___ ___ Hours per week ___ ___ ___ ___ Minutes per week

54
ASK ALL CONSUMED SPORTS FOOD IE CODE 1 IN Q5a, b OR c D7 Thinking again about all the physical activities you have done in the past 7 days, including
vigorous and moderate activities and walking. How would the amount of activity you have done in the past 7 days compare to the amount you would usually do? Would you say it is…? READ OUT
PROG NOTE:
- SINGLE RESPONSE
1 More than you would usually do
2 About the same
3 Or, less than you would usually do
4 DO NOT READ Don’t know
SECTION E - PROG NOTE: ASK ALL CONSUMED SPORTS FOOD IE CODE 1 IN Q5a, b OR c E1 This question is about the usual amount of vegetables you eat, including fresh, frozen and
tinned vegetables. One serve is equal to half a cup of cooked vegetables or legumes (PRON Leg-youms), or 1 medium potato, or 1 cup of salad vegetables. How many serves of vegetables do you usually eat each day? DO NOT READ
IF REQUIRED SAY “Do not include vegetable juice”
PROG NOTE: - SINGLE RESPONSE
0 Don’t eat any vegetables
1 1 serve or less per day
2 2 serves
3 3 serves
4 4 serves
5 5 serves
6 6 serves or more per day
7 Don’t know
E2 This question is about the usual amount of fruit you eat, including fresh, frozen, dried and
tinned fruit. One serve is equal to 1 medium fruit, eg 1 apple, 2 small fruit eg 2 apricots, or 1 cup of chopped or canned fruit. How many serves of fruit do you usually eat each day? DO NOT READ
IF REQUIRED SAY “Do not include fruit juice”
PROG NOTE: - SINGLE RESPONSE
0 Don’t eat any fruit
1 1 serve or less per day
2 2 serves
3 3 serves
4 4 serves
5 5 serves
6 6 serves or more per day
7 Don’t know

55
SECTION F - PROG NOTE: ASK ALL CONSUMED SPORTS FOOD IE CODE 1 IN Q5a, b OR c F1 I would now like to ask you some questions about your height and weight. Being as accurate as you can, please tell me your weight in kilograms. IF UNSURE SAY “Approximately what do you think it would be, either in kilograms or
stones?” RECORD DON’T KNOW \ REFUSED AS 999. IF RANGE GIVEN RECORD MIDPOINT IF WEIGHT GIVEN IN STONES, CHECK CONVERSION CHART THEN RECORD AS
KILOGRAMS PROG NOTE:
- ALLOW 3 DIGIT NUMERIC RESPONSE IN RANGE 30-300, 999 - UNLIKELY RANGE 140-300
_ _ _ kilograms F2 And please tell me your height without shoes in centimetres. IF UNSURE SAY “Approximately what do you think it would be, either in centimetres or feet
and inches?” RECORD DON’T KNOW \ REFUSED AS 999. IF RANGE GIVEN, RECORD MIDPOINT
IF HEIGHT GIVEN IN FEET \ INCHES, CHECK CONVERSION CHART THEN RECORD AS CENTIMETRES
PROG NOTE:
- ALLOW 3 DIGIT NUMERIC RESPONSE IN RANGE 40-225, 999 - UNLIKELY RANGE 40-80, 215-225
_ _ _ centimetres

56
SECTION Y (Australia only) - PROG NOTE: ASK IF CONSUMED SPORTS FOOD IE CODE 1 IN Q5a, b OR c. OTHERS GOT TO Y7 Y1 Which of the following best describe your ancestry? Please choose up to two of the
following ancestries only. Firstly…? READ OUT
INTERVIEWER INFORMATION: - IF PROVIDE 3 OR MORE ANCESTRIES PROBE FOR 2 BEST ANSWERS
PROG NOTE: - MULTIPLE RESPONSES ALLOWED - MAXIMUM 2 CODES 1-14 - IF CODE 1-14 SELECTED THEN CANNOT SELECT CODE 15
1 Australian Aboriginal or Torres Strait Islander
2 Australian
3 British, including English, Scottish or Welsh
4 Irish
5 Italian
6 German
7 Chinese, including Hong Kong
8 Greek
9 Dutch
10 New Zealander, including Maori
11 Indian
12 Lebanese
13 Vietnamese
14 Or, some other ancestry
15 DO NOT READ Refused \ don’t know
Y2 What is the highest educational qualification you have completed? DO NOT READ ONLY READ OUT IF RESPONDENT QUERIES HOW MUCH DETAIL IS NEEDED PROG NOTE: - SINGLE RESPONSE
1 University degree or higher (including postgraduate diploma)
2 Undergraduate diploma or associate diploma
3 Certificate, trade qualification or apprenticeship eg TAFE
4 Highest level of secondary school
5 Did not complete highest level of school
6 Never went to school
7 Still at secondary school
8 Other (SPECIFY)
9 DO NOT READ Refused

57
Y3 Is your household’s combined annual income from all sources, before tax…READ OUT PROG NOTE:
- SINGLE RESPONSE
INTERVIEWER INFORMATION: UNDER $30,000 PA IS UNDER $576 PER WEEK $30,001-$50,000 PA IS $577-$961 PER WEEK $50,001-$70,000 PA IS $962-$1,345 PER WEEK $70,001-$100,000, PA IS $1,346-$1,923 $100,001-$150,000, PA IS $1,924-$2,884 PER WEEK OVER $150,000 PA IS OVER $2,884 PER WEEK
1 Up to 30 thousand dollars
2 $30,001 to 50 thousand
3 $50,001 to 70 thousand
4 $70,001 to 100 thousand
5 $100,001 to 150 thousand
6 More than 150 thousand
7 DO NOT READ Refused
9 DO NOT READ Don’t know
Y4 Last week, did you have a full-time or part-time job of any kind? UNFOLD IF YES Was that…? READ OUT CODES 1-4 PROG NOTE:
- SINGLE RESPONSE
YES
1 Work for payment or profit
2 Absent on holidays, on paid leave, on strike, or temporarily stood down
3 Unpaid work in a family business
4 Or, other unpaid work
NO
5 Did not have a job
PROG NOTE: ASK IF YES WORK BUT NOT ‘OTHER UNPAID WORK’ IE CODE 1-3 IN Y4. CODE 4-5 IN Y4 GO TO Y7 Y5 In your main job held last week, what was your occupation?
PROBE FOR FULL TITLE EG CHILDCARE AIDE, MATHS TEACHER, PASTRY COOK, TANNING MACHINE OPERATOR, APPRENTICE TOOLMAKER, SHEEP AND WHEAT FARMER INTERVIEWER INFORMATION: FOR PUBLIC SERVANTS PROVIDE OFFICIAL DESIGNATION AND OCCUPATION FOR ARMED SERVICES PERSONNEL PROVIDE RANK AND OCCUPATION
PROG NOTE:
- OPEN TEXT FIELD __________________________________

58
Y6 What are the main tasks you usually perform in that occupation? PROBE FOR FULL DETAILS INTERVIEWER INFORMATION:
EXAMPLES INCLUDE LOOKING AFTER CHILDREN AT A DAY CARE CENTRE TEACHING SECONDARY SCHOOL STUDENTS MAKING CAKES AND PASTRIES OPERATING LEATHER TANNING MACHINE LEARNING TO MAKE AND REPAIR TOOLS AND DYES RUNNING A SHEEP AND WHEAT FARM FOR MANAGERS PROVIDE MAIN ACTIVITIES MANAGED
PROG NOTE: - OPEN TEXT FIELD __________________________________ PROG NOTE: ASK ALL
Y7 If my supervisor finds any errors with my work, we may need to call you back. If we need to,
may we contact you for other quality control purposes? DO NOT READ PROG NOTE: - SINGLE RESPONSE
1 Yes
2 No
CLOSE That completes all the questions we would like to ask you. Just to remind you, my name is ... (NAME) from Newspoll. This research was conducted on behalf of Food Standards Australia New Zealand in compliance with the Privacy Principles. (PAUSE) IF ASK ABOUT PRIVACY OR FOR MORE INFO ABOUT NEWSPOLL READ APPROPRIATE SCRIPT BELOW. PRIVACY Your phone number was randomly selected from a computer. Your personal details will be removed from your responses in about four weeks. Within this time, however, you may request that your personal details be deleted. MORE INFO ABOUT NEWSPOLL If you have a pen and paper handy, you can find more info about Newspoll from: Newspoll toll free: 1800 646 526 Market Research Society: 1300 364 830 Newspoll website: www.newspoll.com.au Thank you...(RESPONDENT NAME) for your time. INTERVIEWER INFORMATION RE SAMPLE: Phone numbers are obtained from a list provided by ‘samplepages.com.au’. To comply with federal privacy legislation, numbers are provided without names or addresses. IF RESPONDENT NOT SATISFIED WITH EXPLANATION If you want to know more about how your number was obtained then I can give you the number to contact ‘samplepages.com.au’ or their website address. If you have a pen and paper handy, the number \ website is: (03) 9024 2413 \ www.samplepages.com.au/privacy.aspx

59
DID THE RESPONDENT WISH TO HAVE THEIR DETAILS REMOVED IMMEDIATELY? PROG NOTE: - SINGLE RESPONSE
1 Yes
2 No
I certify that this is a true, accurate and complete interview, conducted in accordance with industry standards and the AMSRS Code of Professional Behaviour (ICC\ESOMAR). I will not disclose to any other person the content of this questionnaire or any other information relating to this project.
PROG NOTE: - SINGLE RESPONSE
1 Accept
2 Not accept

60
SECTION Z (New Zealand only) - PROG NOTE: ASK ALL CONSUMED SPORTS FOOD IE CODE 1 IN Q5a, b OR c . OTHERS GO TO Z7 Z1 Which of these ethnic groups do you belong to? READ OUT PROG NOTE:
- MULTI RESPONSES ALLOWED
1 New Zealand European
2 Maori
3 Samoan
4 Cook Island Maori
5 Tongan
6 Niuean
7 Chinese
8 Indian
9 Other (SPECIFY)
10 DO NOT READ Refused \ don’t know
Z2 What is the highest educational qualification you have completed? ONLY READ OUT IF RESPONDENT QUERIES HOW MUCH DETAIL IS NEEDED PROG NOTE: - SINGLE RESPONSE
1 University degree or higher (including postgraduate diploma)
2 Undergraduate diploma or associate diploma
3 Certificate, trade qualification or apprenticeship eg Tech
4 Highest level of secondary school
5 Did not complete highest level of school
6 Never went to school
7 Still at secondary school
8 Other (SPECIFY)
9 DO NOT READ Refused
QUESTION Z3-Z6 AS PER Y3-Y7 AUSTRALIA CLOSE That completes all the questions we would like to ask you. Thank you very much for helping us with this survey. We really appreciate the time you have given, as your opinions are very important to us. As I said earlier my name is *** from Consumer Link Market Research. If you have any questions about this survey you can contact my supervisor on 0508 SURVEY (787
839) CLICK NEXT TO CONTINUE Decleration I certify that I have conducted this interview in accordance with the guidelines set out in the Market Research Society Code of Practice in accordance with the instructions from Consumer Link.

61
Appendix 2: Population weights
Australia
Table A2.1 New South Wales, including ACT
Age group Males (000s) Females (000s) Total (000s)
15-24 544 516 1060 25-34 551 549 1100 35-49 792 807 1599 50-64 673 689 1362 65+ 479 576 1055 Total 3039 3137 6176
Table A2.2 Victoria
Age group Males (000s) Females (000s) Total (000s)
15-24 406 382 788 25-34 411 405 816 35-49 587 600 1187 50-64 481 498 979 65+ 344 416 760 Total 2229 2301 4530
Table A2.3 Queensland
Age group Males (000s) Females (000s) Total (000s)
15-24 329 315 644 25-34 321 316 637 35-49 477 484 961 50-64 401 403 804 65+ 266 302 568 Total 1794 1820 3614
Table A2.4 South Australia/ Northern Territories
Age group Males (000s) Females (000s) Total (000s)
15-24 134 124 258 25-34 129 126 255 35-49 198 196 394 50-64 174 177 351 65+ 122 148 270 Total 757 771 1528
Table A2.5 Western Australia
Age group Males (000s) Females (000s) Total (000s)
15-24 171 160 331 25-34 174 160 334 35-49 253 246 499 50-64 207 203 410 65+ 129 148 277 Total 934 917 1851

62
Table A2.6 Tasmania
Age group Males (000s) Females (000s) Total (000s)
15-24 35 34 69 25-34 28 29 57 35-49 50 53 103 50-64 51 52 103 65+ 36 43 79 Total 200 211 411
New Zealand
Table A2.7 Upper North Island
Age group Males (000s) Females (000s) Total (000s)
15-24 59 55 114 25-34 45 47 92 35-49 81 90 171 50-64 76 80 156 65+ 58 66 124 Total 319 338 658
Table A2.8 Auckland
Age group Males (000s) Females (000s) Total (000s)
15-24 114 110 224 25-34 106 112 218 35-49 157 170 327 50-64 115 120 235 65+ 68 83 151 Total 560 595 1155
Table A2.9 Lower North Island
Age group Males (000s) Females (000s) Total (000s)
15-24 39 37 76 25-34 28 30 58 35-49 52 57 109 50-64 49 51 100 65+ 37 45 82 Total 205 220 426
Table A2.10 Wellington
Age group Males (000s) Females (000s) Total (000s)
15-24 36 36 72 25-34 33 35 68 35-49 51 56 107 50-64 40 42 82 65+ 27 32 59 Total 187 201 388

63
Table A2.11 Canterbury
Age group Males (000s) Females (000s) Total (000s)
15-24 42 39 81 25-34 33 34 67 35-49 59 63 122 50-64 52 54 106 65+ 37 45 82 Total 223 235 458
Table A2.12 Other South Island
Age group Males (000s) Females (000s) Total (000s)
15-24 36 34 70 25-34 27 27 54 35-49 48 51 99 50-64 47 46 93 65+ 33 38 71 Total 190 197 387
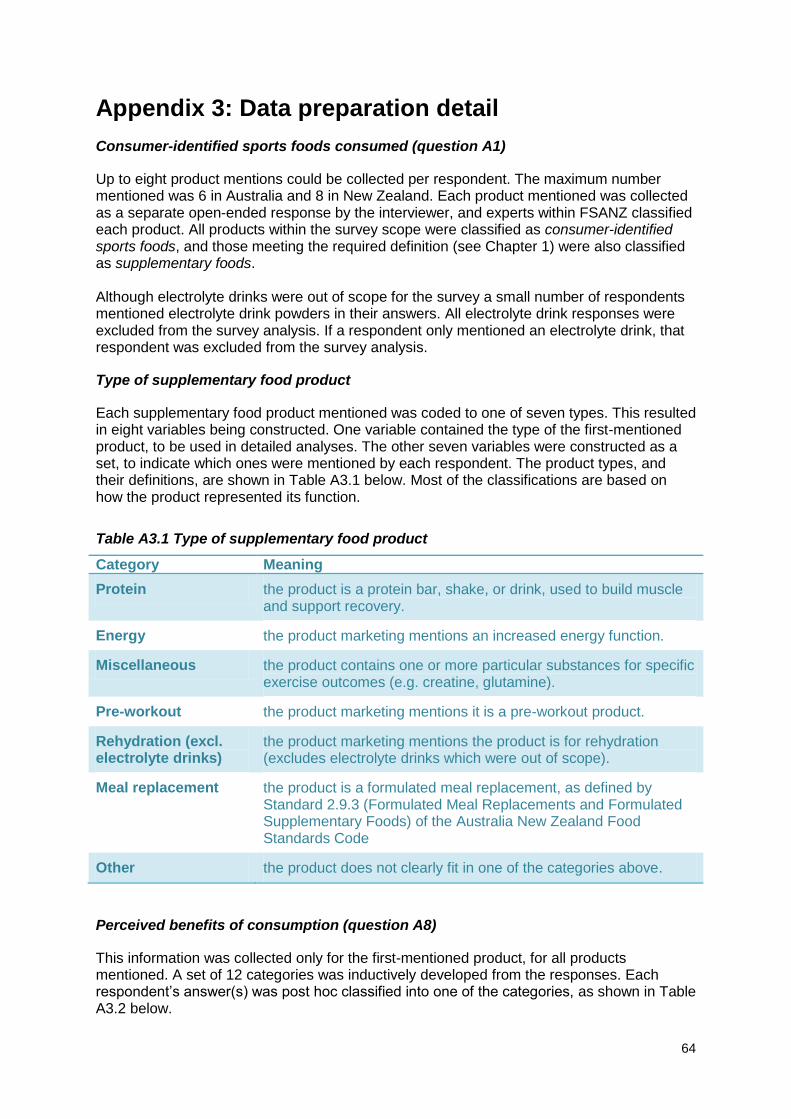
64
Appendix 3: Data preparation detail
Consumer-identified sports foods consumed (question A1)
Up to eight product mentions could be collected per respondent. The maximum number mentioned was 6 in Australia and 8 in New Zealand. Each product mentioned was collected as a separate open-ended response by the interviewer, and experts within FSANZ classified each product. All products within the survey scope were classified as consumer-identified sports foods, and those meeting the required definition (see Chapter 1) were also classified as supplementary foods. Although electrolyte drinks were out of scope for the survey a small number of respondents mentioned electrolyte drink powders in their answers. All electrolyte drink responses were excluded from the survey analysis. If a respondent only mentioned an electrolyte drink, that respondent was excluded from the survey analysis.
Type of supplementary food product
Each supplementary food product mentioned was coded to one of seven types. This resulted in eight variables being constructed. One variable contained the type of the first-mentioned product, to be used in detailed analyses. The other seven variables were constructed as a set, to indicate which ones were mentioned by each respondent. The product types, and their definitions, are shown in Table A3.1 below. Most of the classifications are based on how the product represented its function.
Table A3.1 Type of supplementary food product
Category Meaning
Protein the product is a protein bar, shake, or drink, used to build muscle and support recovery.
Energy the product marketing mentions an increased energy function.
Miscellaneous the product contains one or more particular substances for specific exercise outcomes (e.g. creatine, glutamine).
Pre-workout the product marketing mentions it is a pre-workout product.
Rehydration (excl. electrolyte drinks)
the product marketing mentions the product is for rehydration (excludes electrolyte drinks which were out of scope).
Meal replacement the product is a formulated meal replacement, as defined by Standard 2.9.3 (Formulated Meal Replacements and Formulated Supplementary Foods) of the Australia New Zealand Food Standards Code
Other the product does not clearly fit in one of the categories above.
Perceived benefits of consumption (question A8)
This information was collected only for the first-mentioned product, for all products mentioned. A set of 12 categories was inductively developed from the responses. Each respondent’s answer(s) was post hoc classified into one of the categories, as shown in Table A3.2 below.

65
Table A3.2 Categorisation of responses to question on perceived benefits
Category Meaning
Build muscle body-building type responses, including comments associated with gaining weight.
Energy general comments about getting energy, increasing alertness, that does not have any specific activity associated with the comment.
Exercise general comments around exercise, where the respondent has not been more specific.
Health comments about using it for health or therapeutic reasons.
High protein captures respondents who focussed on this specific characteristic of the consumer-identified sports food. Where protein has been linked to building muscle, by the respondent, that type of comment is coded to Build muscle instead.
Hydration comments about hydration or rehydration.
Manage hunger snacking-related (i.e. between-meal) comments.
Meal replacement comments indicating the product was used instead of eating a “proper meal”.
Other the general category for comments that do not fall into more specific categories.
Recovery comments specifically related to this type of benefit.
Trial comments relating to trialling the product. Coded into this category when there is little information about why the product was being trialled.
Weight control comments on losing or maintaining weight.
Activity associated with consumption (question A2)
This information was collected only for the first-mentioned product, for all products mentioned. Respondents were asked about the circumstances surrounding their most recent consumption of the product. The restriction to most recent use limits recollection errors and ensures that the use falls within the four-week period used to screen respondents. Each respondent could only report one activity. A set of 14 categories was inductively developed from the responses, with activities associated with four or fewer respondents in one or more countries grouped into the Other activities category. Each respondent’s answer(s) was post hoc classified into one of the categories, as shown in Table A3.3 below.

66
Table A3.3 Categorisation of responses on activity related to consumption
Category Types of activities included
Court ball sports basketball, netball, and also racket sports such as badminton, table tennis, and tennis.
Cycling
Field ball sports football, hockey, soccer, rugby.
Gym not elsewhere classified
used when the respondent mentioned “gym” without any information on the particular gym activity.
Martial arts kick boxing, boxing, tai chi, and generic martial arts responses.
Meal replacement used when the response indicated that the product had been consumed in place of breakfast, lunch, or dinner.
Other activities activities reported by very few respondents, e.g. dancing, golf, horse riding, motor sports, rowing, surfing, swimming, water polo, and extreme sports such as triathlons and iron man.
Running
Snack used when the response indicated that the product had been consumed as a snack, or because the respondent was hungry, with no mention of meal replacement.
Supplement used when the respondent mentioned they were consuming the product for health-type reasons, with no further information
Trialling the product
used when there is little information about why the product was being trialled.
Walking bush walking, tramping.
Weight control weight loss, weight gain, or weight maintenance..
Weight training body building, weight lifting, as well as weight training
Amount usually consumed (question A6)
By law, FSSFs must provide directions stating the recommended quantity and frequency of intake of the food and a statement of the recommended consumption in one day on their label. This information was collected only for the first-mentioned product, and respondents were asked how much they usually consumed. While this was a closed question, if the respondent was not aware of the recommended amount a follow-up open-ended question (A7) was asked. In the open-ended question, the respondent mentioned how much of the product they used in their own words, such as “one bar” or “two scoops”. Where the product and its recommended amount could be identified, the correct response was coded back into question A6. For some mentions, the amount of detail provided by the respondent was insufficient to identify the actual product used, and the recommended amount or serving size could not be determined. For these responses, even though the actual amount consumed was known, the code used was “relative consumption level unknown”. The final categories used for amount usually consumed were:
Less than the recommended amount
The recommended amount
More than the recommended amount
Varies
Relative consumption level unknown

67
Information sources on risks and benefits (question C1)
This information was collected only for the first-mentioned product, for all products mentioned. Respondents were asked which of a list of information sources they had used. Multiple responses were allowed, and a separate variable was created for each of the listed categories. Any “Or some other place” answers were captured into a single open-ended response field. Based on the open-ended responses provided, three additional categories were added. As some listed categories received only a very small number of responses, some of these categories were merged. The final categories of sources of information used in the data analysis are shown in Table A3.4 below.
Table A3.4 Categorisation of responses to question on information sources
Category Types of information sources included
Product brochures, pamphlets, billboards
Print-based product specific information, excluding the label
Product labels
Medical professional doctor, pharmacist, nurse, midwife, hospital
Nutrition professional dietitian, nutritionist
Shop assistant, pharmacy assistant
Internet, websites
Books, newspapers, magazines
Print media that includes product information as a subset of content
TV, radio
Academic sources lectures, seminars, school, university, TAFE (Australia), tech (New Zealand), journal articles
Government agencies including Drug Free Sport New Zealand (New Zealand) and Australian Sports Anti-Doping Authority (Australia)
Family, friends, workmates
Coach including personal trainer, exercise physiologist
Gym used when no more specific information is provided
Other sources reported by very few respondents, e.g. camp, sports club, sponsor, naturopath, health consultant
Place of last purchase (question A9)
This information was collected only for the first-mentioned product, for all products mentioned. Respondents were asked which of a list of product outlets, including internet-based, they had used to last purchase that food. Using last place of purchase, rather than all places of purchase, limits recollection errors. More common places of purchase will still be collected more frequently than less common places of purchase, using this method. Only a single response was allowed, and answers were coded into the one variable. Any “Or some other place” answers were captured into a single open-ended response field. Based on the open-ended responses, some categories were expanded slightly (e.g. “A supermarket” was expanded to include other general retail stores such as service stations

68
and dairies). Due to the small number of responses to the individual categories, “A doctor” and “A dietician or nutritionist” were merged. The final categories for place of last purchase used in the data analysis were:
General retailer, e.g. supermarket, service station, dairy
Heath food shop, naturopath, supplement retailer
Pharmacy, chemist
Gym, sports shop
Internet or overseas
Sponsor, direct selling
Sports coach, trainer
Team mates, peers, family
Doctor, dietitian, nutritionist
Occupational status
The Australian Socioeconomic Index 2006 (AUSIE06) was used as a measure of occupational status. This is the most recent version of a series of occupational status scales developed by the Australian National University (McMillan, Beavis, Jones 2009). The AUSEI06 is a continuous scale from 0 to 100, with a low measure representing low occupational status and a high measure representing high occupational status. The AUSEI06 requires that data have been coded according to the latest version of the Australia New Zealand Standard Classification of Occupations, although education level can be used as a proxy where occupation is absent. Australian census questions were included in the questionnaire to collect the required occupation data. There is no current New Zealand scale equivalent to the AUSEI06. However as the same occupation and education data were collected in both countries, the AUSEI06 method was used to analyse the data from New Zealand The AUSEI06 scores were used to create a new variable which split respondents into one of two categories:
AUSEI06 score below 50 (i.e. lower occupational status)
AUSEI06 score of 50 or above (i.e. higher occupational status). Only 70% of Australian and New Zealand supplementary foods users provided sufficient information that occupational status could be calculated, so the results may be biased. It is not possible to determine, with the information collected in the survey, the nature or extent of any bias.
Education
The respondent’s highest educational qualification was collected using effectively the same question for Australian and New Zealand respondents. The responses were summarised into two categories:
no post-school qualification
post-school qualification
Ethnicity
The question asked was different for each country. The ethnicity question for New Zealand respondents (question Z1) was the same as that for the 2011 census. Multiple ethnicities (no limit to the maximum number) could be captured for each respondent, and the ethnicities

69
provided were initially coded to the Ethnicity New Zealand Standard Classification 2005, at the 2-digit level to preserve the separation of Pacific peoples ethnic groups.12 Australian respondents were asked a question (Y1) based on a mixture of 2-digit and 4-digit codes from the Australian Standard Classification of Cultural and Ethnic groups, Second Edition, 2011.13 This enabled the collection of ethnicity to be similar across the two countries, and meant that only one question was asked in each country. Some of the ethnicities were mentioned by only one or two respondents, so the final ethnic groups used in the analysis were reported at the most aggregate level. The result was that all ethnic groups with less than 4% representation were merged into sensible categories, in order to produce robust estimates. In New Zealand, the aggregation was to the 1-digit classification structure, and this meant that no results below “Pacific peoples”, “Asian”, or “Other” could be reported. However, “NZ European” was retained as a separate ethnicity category, with all other European ethnicities coded to “Other European”. In Australia, this meant that Italian, German, Greek, and Dutch were coded into the “Other European” group, and Chinese, Indian, Lebanese, and Vietnamese were incorporated into the “Some other ethnicity” group.
Vegetable and fruit consumption
The usual intake of vegetables and fruit were collected using two questions (E1 and E2), which were based on the questions in the Australian 2007/08 National Health Survey. Intake was measured using serves, with the examples of serving sizes copied from the 2006/07 New Zealand Health Survey Adult Questionnaire. The usual vegetable and fruit consumption answers were summarised into a “fruit and vegetable intake” variable that had two levels:
0-4 serves of fruit and/or vegetables per day
5 or more serves of fruit and/or vegetables per day.
International Physical Activity Questionnaire (IPAQ)
The IPAQ is an internationally recognised instrument used to capture comparable estimates of physical activity.14 The English short format telephone version15 was used, although the time spent sitting question was omitted. This is the final question in that telephone version of the IPAQ, and it does not contribute to activity estimates. Questions D1 through D6(b) collected the IPAQ information. The data processing rules for the IPAQ16 were followed, and respondents were coded into one of the three levels of physical activity, using the IPAQ classification rules: “Low”, “Moderate”, or “High”.
Body Mass Index (BMI)
The BMI estimates are based on self-reported height and weight (questions F1 and F2). The interviewers converted any imperial measures to metric units using conversion charts. Some data cleaning of weight and height data was performed during data collection. For weight, the acceptable range in the survey was 30-300 kg, collected to the nearest kg, with all other responses coded to missing. For height, the acceptable range in the survey was 40-225 cm, collected to the nearest cm, with all other responses coded to missing. The weight range for
12
See http://stats.govt.nz/surveys_and_methods/methods/classifications-and-standards/classification-related-stats-standards/ethnicity.aspx for detail of this standard.
13 See http://www.abs.gov.au/AUSSTATS/[email protected]/DetailsPage/1249.02011?OpenDocument for detail of this
standard. 14
http://www.ipaq.ki.se/ipaq.htm accessed on 27 June 2011. 15
All versions of the IPAQ questionnaires are available from http://www.ipaq.ki.se/downloads.htm 16
http://www.ipaq.ki.se/scoring.pdf

70
Australian respondents was 35 to 165 kg (median of 75 kg) and the height range was 104 to 194 cm (median of 172 cm). For New Zealand respondents, the weight range was 30 to 152 kg (median of 76 kg) and the height range was 150 to 216 cm (median of 173 cm). Both sets of country figures include respondents aged 15 to 17 years who did not have a BMI estimated. This range restriction for height and weight is slightly different to that used in the Australian Health Survey. The latter survey included people aged less than 15 years of age, who would be expected to have lower weights and heights compared to this survey. In the Australian Health Survey, weight and height were measured, and the upper weight limit was 150 kg and the upper height limit was 210 cm, based on equipment limits. Both of these upper limits are more conservative than those used in the current survey. For all respondents, the BMI is in kg/m2 units, and was restricted to two decimal places after calculation. In the 2007-08 Australian National Health Survey, for the population aged 16 years and older, the first percentile of the BMI distribution was 10-14 kg/m2 and the 99th percentile was 42-58 kg/m2 (ABS, personal communication, 5 October 2012). These results compare favourably with those for the current survey. The BMI range for Australian respondents aged 18 years and older was 12.86 to 64.45 kg/m2. Two respondents each had a BMI in excess of 58 kg/m2, and were recoded to missing. The median BMI for Australian respondents after this data cleaning was 25.56 kg/m2. The BMI range for New Zealand respondents aged 18 years and older was 11.72 to 58.43 kg/m2. One respondent had a BMI in excess of 58 kg/m2, and was recoded to missing. The median BMI for New Zealand respondents after this data cleaning was 25.56 kg/m2. For adults aged 18 years and over, Table A3.5 shows how respondents were allocated into BMI categories. This classification was performed after the data were cleaned as outlined in the preceding paragraph.
Table A3.5 International cut-off points for adults aged 18 years and older 17
Classification BMI score (kg/m2)
Underweight < 18.5 Normal weight 18.5 - < 25 Overweight 25 - < 30 Obese 30+
The BMI for children aged less than 18 years is calculated the same way, but then is compared to BMI index-for-age percentiles.18 Due to the complexity of calculating a BMI for child respondents, and the small number of respondents aged under 18 years, the BMI estimates were restricted to respondents aged 18 years and older.
17
BMI ranges from http://www.health.govt.nz/nz-health-statistics/health-statistics-and-data-sets/maori-health-data-and-stats/tatau-kahukura-maori-health-chart-book/nga-tauwehe-tupono-me-te-marumaru-risk-and-protective-factors/body-size-various-ages
18 Refer to http://www.eduweb.vic.gov.au/edulibrary/public/earlychildhood/mch/bmi/bmigirl.pdf for females and
http://www.eduweb.vic.gov.au/edulibrary/public/earlychildhood/mch/bmi/bmiboy.pdf for males.