
Spontaneous Extrapolation and Detection of Stress Level ... · Spontaneous Extrapolation and...
11
FATIMA ISIAKA et al: SPONTANEOUS EXTRAPOLATION AND DETECTION OF STRESS LEVEL BASED . . . DOI 10.5013/IJSSST.a.17.32.01 1.1 ISSN: 1473-804x online, 1473-8031 print Spontaneous Extrapolation and Detection of Stress Level Based on Human Computer Interaction and Physiological Response *Fatima Isiaka Kassim Mwitondi Department of Computing Sheffield Hallam University Sheffield, United Kingdom Adamu Ibrahim School of Computing University of Leeds Leeds, United Kingdom Abstract — User Experience (UX) is of high importance for design specifications on web applications. Peering into the user’s mind is of high value. We always like to understand user cognitive processes, why they do certain things online, and whether they see some elements on the webpage that we cannot. Methods such as interview and surveys normally gather this information by simply asking the users subjectively. ther methods such as the observational process mainly rely on viewing or observing the users’ behaviour. In this paper we try to approach this in an objective perspective by directly observing what goes on in the users mind, through non-obstructive technique without interrupting the data collection thereby obtaining qualitative and quantitative data of high imension for modeling. To further test for bias in variance, prediction and confident intervals, boostrapping was employed for measures of accuracy to sample estimates. Keywords — UX, stress detection, extrapolate, task performance, boostrapping, cognitive process, human physiological response. I. INTRODUCTION Recent years have seen that interrelating Human Computer Interaction (HCI) and Human Physiological Response (HPR) is of high value to understanding UX [6]. Most UX investigations is based on or limited to overt observable behavior [22]. There has been very few work done in the use of physiological response with eye tracking in HCI. The latency in some physiological response measure is slow, e.g. skin conductance response (SCR). Response normally appear between 1 - 3 seconds after stimulus onset [1]. This means that the eyes have left the area of interest or fixation on a visual stimulus that caused the spikes in the SCR effect, long before the effect was registered in data. This latency is sometimes difficult to take into account [13][28][29]. Modeling the quantitative data obtained can tell a different story. A common finding in cognitive neuroscience states that user subjective perception of their attitude or behavior doesn’t always correspond to their neural activity [6][5], this is a short form of saying that users doesn’t always know what is going on in their minds. An example is of a participant eye fixation directed on a particular content on a webpage that correspond to certain spikes in their emotional arousal state observed in real-time, while subjectively they admitted to not really affected by the said element that occupied their visual attention [31][6]. In this paper we try to approach this through an objective perspective and make use of the quantitative data collected from an eye tracker and physiological response measure sensors. The main goal is to investigate the possibility of applying modeling techniques on high dimensional Human Computer Interaction and Human Physiological Response (HCI-HPR) data can predict affect states and recognize patterns. These patterns could be used to ultimately detect users stress level and associate it to an element. A modelling approach is the best technique [16][9][18], when considering this. II. RELATED WORK Though there has been quite a lot of work done on HCI where eye tracking is concerned, there are actually quite a few on eye tracking combined with physiological measures in HCI. We continually try to find methods in which to properly understand UX that allows us to gain more insight into user’s unconscious desire as they interact with elements since acknowledging that visual attention and engagement are not necessarily linked to perceptions of experience [15][10][17]. Physiological response measurements allow investigations on this area by collecting objective measures of performance [30][25]. Rather than asking participants if they find a particular tasks difficult or if their attention was distracted on the sudden appearance of stimuli on screen, their physiological response can be measured to give an objective rather than subjective report in an invariant process. The physiological measures considered here are the skin conductance, pupil dilation, skin temperature and eye movement, which are briefly discussed in the following subsections.
Transcript of Spontaneous Extrapolation and Detection of Stress Level ... · Spontaneous Extrapolation and...

FATIMA ISIAKA et al: SPONTANEOUS EXTRAPOLATION AND DETECTION OF STRESS LEVEL BASED . . .
DOI 10.5013/IJSSST.a.17.32.01 1.1 ISSN: 1473-804x online, 1473-8031 print
Spontaneous Extrapolation and Detection of Stress Level Based on Human Computer Interaction and Physiological Response
*Fatima Isiaka Kassim Mwitondi
Department of Computing Sheffield Hallam University Sheffield, United Kingdom
Adamu Ibrahim School of Computing University of Leeds
Leeds, United Kingdom
Abstract — User Experience (UX) is of high importance for design specifications on web applications. Peering into the user’s mind is of high value. We always like to understand user cognitive processes, why they do certain things online, and whether they see some elements on the webpage that we cannot. Methods such as interview and surveys normally gather this information by simply asking the users subjectively. ther methods such as the observational process mainly rely on viewing or observing the users’ behaviour. In this paper we try to approach this in an objective perspective by directly observing what goes on in the users mind, through non-obstructive technique without interrupting the data collection thereby obtaining qualitative and quantitative data of high imension for modeling. To further test for bias in variance, prediction and confident intervals, boostrapping was employed for measures of accuracy to sample estimates. Keywords — UX, stress detection, extrapolate, task performance, boostrapping, cognitive process, human physiological response.
I. INTRODUCTION
Recent years have seen that interrelating Human Computer Interaction (HCI) and Human Physiological Response (HPR) is of high value to understanding UX [6]. Most UX investigations is based on or limited to overt observable behavior [22]. There has been very few work done in the use of physiological response with eye tracking in HCI. The latency in some physiological response measure is slow, e.g. skin conductance response (SCR). Response normally appear between 1 - 3 seconds after stimulus onset [1]. This means that the eyes have left the area of interest or fixation on a visual stimulus that caused the spikes in the SCR effect, long before the effect was registered in data. This latency is sometimes difficult to take into account [13][28][29]. Modeling the quantitative data obtained can tell a different story. A common finding in cognitive neuroscience states that user subjective perception of their attitude or behavior doesn’t always correspond to their neural activity [6][5], this is a short form of saying that users doesn’t always know what is going on in their minds. An example is of a participant eye fixation directed on a particular content on a webpage that correspond to certain spikes in their emotional arousal state observed in real-time, while subjectively they admitted to not really affected by the said element that occupied their visual attention [31][6]. In this paper we try to approach this through an objective perspective and make use of the quantitative data collected from an eye tracker and physiological response measure sensors. The main goal is to investigate the possibility of applying modeling techniques on high dimensional Human
Computer Interaction and Human Physiological Response (HCI-HPR) data can predict affect states and recognize patterns. These patterns could be used to ultimately detect users stress level and associate it to an element. A modelling approach is the best technique [16][9][18], when considering this.
II. RELATED WORK
Though there has been quite a lot of work done on HCI where eye tracking is concerned, there are actually quite a few on eye tracking combined with physiological measures in HCI. We continually try to find methods in which to properly understand UX that allows us to gain more insight into user’s unconscious desire as they interact with elements since acknowledging that visual attention and engagement are not necessarily linked to perceptions of experience [15][10][17]. Physiological response measurements allow investigations on this area by collecting objective measures of performance [30][25].
Rather than asking participants if they find a particular tasks difficult or if their attention was distracted on the sudden appearance of stimuli on screen, their physiological response can be measured to give an objective rather than subjective report in an invariant process. The physiological measures considered here are the skin conductance, pupil dilation, skin temperature and eye movement, which are briefly discussed in the following subsections.

FATIMA ISIAKA et al: SPONTANEOUS EXTRAPOLATION AND DETECTION OF STRESS LEVEL BASED . . .
DOI 10.5013/IJSSST.a.17.32.01 1.2 ISSN: 1473-804x online, 1473-8031 print
(a) SCR measured with electrodes.
(b) Eye movement behavior showing Fig. 1: HCI-HPR and Eye tracking showing
Fig 2: SCR with typically computed features
A. Skin Conductance Measure (SCR)
The SCR is a measure of the electrical changes of the skin as a result of sweat [1], usually caused when the user is involved in an activity [27]. It is a measure of the emotional arousal state of a person, and can easily be measured with electrodes non-invasively placed on the fingertips, wrist or palm (Figure 1a). The SCR grows higher during states such as stress, interest, attention or nervousness and lower during states such as relaxation or boredom (Eq 1), depending on the state of the user and the task the user is involved in [26]. Figure 2 shows the SCR with typically computed features such as the latency (time from stimulus to an onset), amplitude (height of an arousal state), peak (maximum arousal state), SCL (tonic phase) e.t.c.
where can be any emotional arousal state, either elated or
relaxed.
B. Skin Temperature (ST)
ST measure increased exertion, excitement and stress. Temperature at the surface of the skin changes accordingly to blood circulation through body tissue [21]. Data from ST can also back SCR data in terms of interpreting stress [4][3]. The temperature of the body changes according to activities and other external factors just like the SCR. C. Eye Movement
Eye movement is the voluntary or involuntary movement of the eyes, which helps in acquiring, fixating and tracking visual stimuli. The three most important attributes in eye movement behaviour are the fixation (location of a user’s gaze), Fixation Duration (length of time that a user fixates) and Saccade (the angular distance between fixations) (Figure 1b). The fixations are mapped to the x and y coordinates that pinpoint where the user looked on a given display [6]. User experience can be reflected and determined through their attitude or behaviour [8][20]. Negative attitude towards a complex application shows a poor experience while positive attitude towards a complex application shows a good experience [23]. The three possible emotional states discussed here that can be experienced by a user during an interactive session could be expressed as stress, relaxation and neutral mood which can be demonstrated in the following concept.
Where

FATIMA ISIAKA et al: SPONTANEOUS EXTRAPOLATION AND DETECTION OF STRESS LEVEL BASED . . .
DOI 10.5013/IJSSST.a.17.32.01 1.3 ISSN: 1473-804x online, 1473-8031 print
III. METHODS
The method for data collection was based on usability evaluation testing, with 44 participants aged between 18-44. The users are both average users and constant user of webpages. They were seated in front of an eye tracker with their fingertips placed on a wireless SCR measure, while we collect both their physiological data and eye movement data recorded by an eye tracker. They interacted with a set of six webpages. The tasks assigned were both contrived and non-contrived tasks. Two of the webpages had both the Auto-suggest List (ASL) deactivated. The purpose is to see if the absence or presence of ASL increased or decreased their stress level. While the dynamic contents on the other pages where used as a form of emotional incitement to induce or evoke responses from the users and gauge if the sudden appearance of a picture or advisement distract them from their given task. The wireless SCR sensor (Affectivia Q- Sensor) (Figure
1a) was used to collect the SCR data. It also has the capability to measure and record the ST of the participants. The data collection was approach in two ways:
• Real Time
• Delayed
In real time (Figure 1a), we were able to investigate and observe the spikes in SCR, PD and ST while they interact with elements on the webpages. The delayed enabled us to access each session (Figure 3) ) of the experiment revisit, extract time sessions and register delay in latency of physiological readings that correspond to latency of eye movement and also for further analysis. This helps to identify a particular instance in time that might have been missed. Most of the behavior data such as “Looking”, “Interest” and “Clicking”, are logged in the eye tracker during real time and also during delay. Using this method, we can be able to obtain real-time feedback without interrupting collection of data. The quantitative data was exported to a spreadsheet, where a total of 264 instances were generated; with each participant’s data generating six instances. A short term interval processing was adopted for the sync HCI-HPR .
Fig. 3: Physiological measures in sync with fixations made by eye movement behavior

FATIMA ISIAKA et al: SPONTANEOUS EXTRAPOLATION AND DETECTION OF STRESS LEVEL BASED . . .
DOI 10.5013/IJSSST.a.17.32.01 1.4 ISSN: 1473-804x online, 1473-8031 print
IV. SIMULATIONS AND ANALYSIS
The method for data analysis was approached by extracting features with a custom algorithm that helps to run the simulations that detect increase in stress level based on the average amplitudes response detected for each webpage and the response duration. The steps for the algorithm is stated below (Figure 4). The feature extraction were considered based on significant variables often used in literature, when considering a multimodal approach such as combining eye tracking data and physiological measures [28][6], the novel approach involves appending saccade size of fixations. The diagram below illustrates these features. Each participant’s baseline differs and thus increase in amplitude depends on variations in median threshold used in extracting event correlates to produce a matrix Z(m, n). Participants generates instances each based on the number of webpages viewed. Savistsky filter [24] Eq 3 was applied for removal of noise and other artifacts on the physiological measures. The baseline (skin conductance level (SCL)) was estimated based on point interpolation moving average technique (Eq 4). Peaks on the SCR were detected on a given threshold that corresponds to a participant’s median SCR.
(3)
refers to the smooth SCR.
(4)
is the resulted data-points by resampling the smoothen SCR data-points, taking a moving average of
window size on each points in , in each time interval . The smoothed data still maintained its shape accordingly. Each physiological measure undergoes this process depending on how noisy the data are. The eye movement data obtained includes the PD and fixations captured by the eye tracker. The derived variable here is the saccade size D that gives the Euclidean distance between two points ( ) and .
D = (5)
where ( ), n = 1,2,….n are fixation points on the vertical plain of a webpage and ( ) are the fixations on the horizontal plain. The sync data are exported and written to a spreadsheet using MATLAB (Figure 6). If the SCR falls below median range, the participants is at the tonic place, hence nothing is actually happening and he/she is relaxed. Once there is increase in amplitude that exceeds the median level, the participants are either considered stressed or excited and given the nature of the
task the former is the classified affect state. Hence we integrate between “Stress”, “Neutral”, and “Relaxed” state of the users. The SCR is the physiological measure that serves as the major constant response for this case, given its ability for detecting spontaneous and evoked reaction in literature. The algorithm (Figure 4) detects each increase in amplitude and predicts the maximum SCR (peak) within a certain interval that correspond to a particular event. The final output data resulted into a higher dimensional dataset Z(m, n) developed for the purpose of modelling. We considered applying classification algorithms to see if patterns can be recognized from the integrated multimodal data. The patterns identified are trained based on the labelled class (stress level). This will provide a reasonable view of the input datasets and perform the most likely matching inputs based on the variations on the dataset. The peak detection algorithm provides means to organize the data from the sensors and detect events based on the peaks identified.
Fig. 4: Algorithm to detect associated user interaction to web events and
stress level

FATIMA ISIAKA et al: SPONTANEOUS EXTRAPOLATION AND DETECTION OF STRESS LEVEL BASED . . .
DOI 10.5013/IJSSST.a.17.32.01 1.5 ISSN: 1473-804x online, 1473-8031 print
The custom algorithm was able to detect affects corresponding to events during interaction with a performance of 80%. The next stage is to detect outliers that might be present using the least median of squares for regression or least mean of squares (LMS) adopted in [2] for outlier detection. This is based on the mean and standard deviation of each variable. It estimates parameters by solving the nonlinear minimization problem.
Fig. 5: Attributes of physiological measures used for modelling
To carry this out, two variables the URL (webpage) and Status (affect state) were removed from the scene, this provide a means to search for structures and try and find out whether natural structures exist in the dataset as opposed to physiological measures obtained from the participants. Using this method, we were able to detect that visiting webpages with dynamic contents especially where the Auto-Suggest List (ASL) is disabled and also where picture and video contents were found, increases the stress level of some participants because they were distracted (Figure 3 and 8). The absence of ASL disrupts the participants expectations of the task, thereby increasing their stress level. The chart in Figure 7 shows the number of instances there are increase in stress level of participants for the six webpages.
Instances like observation 45 and 215 had fixation duration of 4087 and 1534 secs, while looking at Yahoo and iGoogle page, even with application of filters before feature extraction. This is quite a large variation that totally exceed the average fixation duration (250ms) and normal fixation between 100ms- 500ms [12]. The LMS was able to detect this unusual occurrence on multiple simulation runs and this was traced to both pages. These outliers were suppressed. The chart also shows visiting the ASL enabled pages reduces the stress level of users than visiting the ASL disabled pages in Figure 8a and 8b.
Fig. 6: Methodology description
Fig. 7: Classifying stress level based on
(a) Spikes in SCR and great variations in PD and ST for Google page
Fig. 8: Increase in amplitudes on physiological response, continued on next page
FATIMA ISIAKA et al: SPONTANEOUS EXTRAPOLATION AND DETECTION OF STRESS LEVEL BASED . . .
DOI 10.5013/IJSSST.a.17.32.01 1.6 ISSN: 1473-804x online, 1473-8031 print
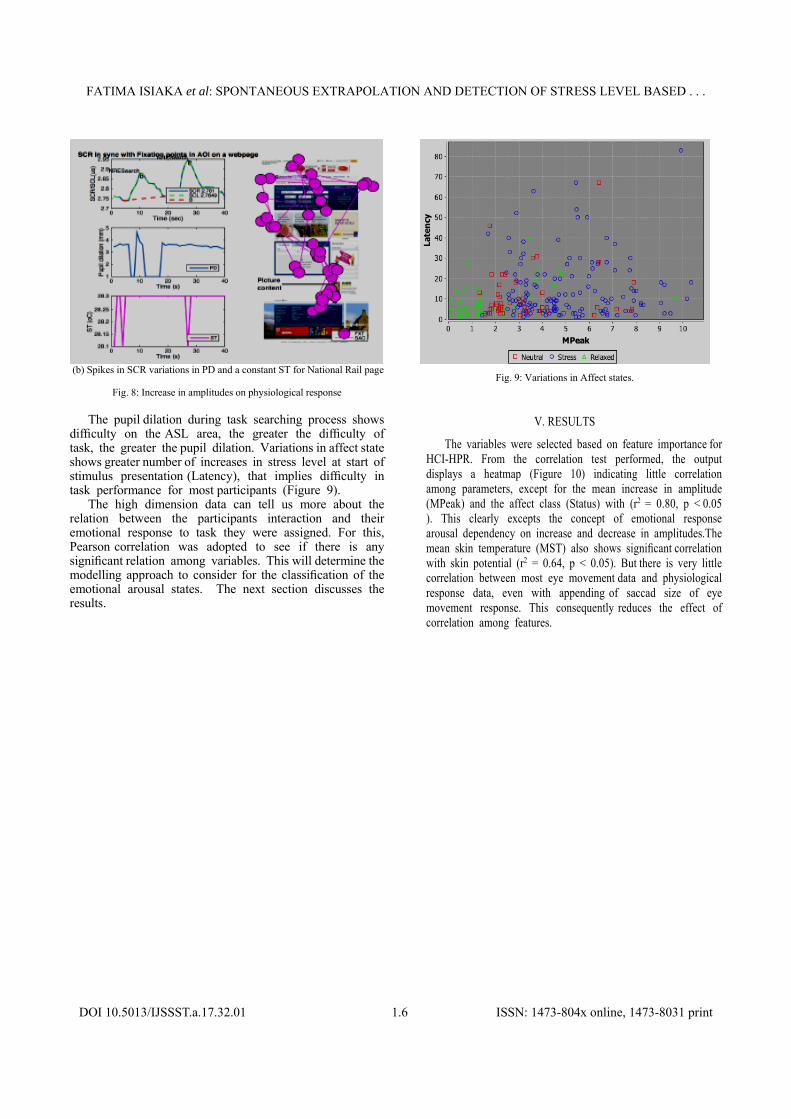
(b) Spikes in SCR variations in PD and a constant ST for National Rail page
Fig. 8: Increase in amplitudes on physiological response
The pupil dilation during task searching process shows
difficulty on the ASL area, the greater the difficulty of task, the greater the pupil dilation. Variations in affect state shows greater number of increases in stress level at start of stimulus presentation (Latency), that implies difficulty in task performance for most participants (Figure 9).
The high dimension data can tell us more about the relation between the participants interaction and their emotional response to task they were assigned. For this, Pearson correlation was adopted to see if there is any significant relation among variables. This will determine the modelling approach to consider for the classification of the emotional arousal states. The next section discusses the results.
Fig. 9: Variations in Affect states.
V. RESULTS
The variables were selected based on feature importance for HCI-HPR. From the correlation test performed, the output displays a heatmap (Figure 10) indicating little correlation among parameters, except for the mean increase in amplitude (MPeak) and the affect class (Status) with (r2 = 0.80, p < 0.05 ). This clearly excepts the concept of emotional response arousal dependency on increase and decrease in amplitudes.The mean skin temperature (MST) also shows significant correlation with skin potential (r2 = 0.64, p < 0.05). But there is very little correlation between most eye movement data and physiological response data, even with appending of saccad size of eye movement response. This consequently reduces the effect of correlation among features.

FATIMA ISIAKA et al: SPONTANEOUS EXTRAPOLATION AND DETECTION OF STRESS LEVEL BASED . . .
DOI 10.5013/IJSSST.a.17.32.01 1.7 ISSN: 1473-804x online, 1473-8031 print
Fig. 9: Variations in Affect states.
TABLE I: AGGREGATE OF CONFUSION MATRIX Affect state Neutral Stress Relaxed
Neutral 7 11 4 Stress 3 37 20
Relaxed 3 4 12
This form of behavior on datasets is most appropriate for the Naive Bayes classifier [14]. Even though some of the features exhibit significant correlation. However, it is quite unclear whether the correlated occurrence is as a result of suppressed outliers or the saccade measures. Other classifiers (Support Vector Machine [19], J48 [7] and Bagging [11])were adopted to improve training algorithm, aggregates the model performances (Figure 17) and test behavior of data. The 70/30 split partitioning was used to separate the dataset into a training and test set. This partitioning can ensure values of the variables to be automatically divided across the training and test set.
A. Model Performance
Based on aggregates of the model performance in classifying the affect state, the number of instances correctly classified as stress is high enough to justify that stress is the main emotion variable to be considered since it proved to be consistently high throughout the data analysis process. The number of instances that were correctly classified as ”Stress” are 37, while 12 instance
were correctly classified as ”Relaxed”, and 7 instance were either between stress level or tonic phase (Neural).
From literature, Bagging always seem to perform the most on several cases, and didn’t fail in this instance given the uncorrelated diversity and latency contingency of HCI-HPR.
The ROC plot shows the diagnostic outcome of the model performance, the proximity of the model performance to100%, illustrates that the diagnostic accuracy though not 100% accurate but close enough to ascertain that patterns can be recognized and detected in relation between HCI-HPR. It is feasible then to say or accept that there is possibility in automatically detecting stress in users and associate it to elements on a webpage, and possible to make better design decisions and produce apps that seek to reduce or decrease stress level by increasing number of ASL display and decreasing number of dynamic elements such as picture and video contents present on a page depending on the type of pages on the website.

FATIMA ISIAKA et al: SPONTANEOUS EXTRAPOLATION AND DETECTION OF STRESS LEVEL BASED . . .
DOI 10.5013/IJSSST.a.17.32.01 1.8 ISSN: 1473-804x online, 1473-8031 print
Fig. 11: ROC showing model performance
VI. SIMULATING PHYSIOLOGICAL DATA
The purpose of simulating data that satisfies constraints based on the physiological data collected, is to perform further validation on our model performance and results. Most form of simulated data acquisition method is based on specific mean and standard deviation used to generate random numbers that satisfies the condition of a specific dataset. For our purpose, we make the mean and variance exactly to the physiological pre-defined values. The variables are fitted, slackened and scaled to the right proportion as to emulate the original data. Given that
are the original variables, then the new variable is obtained as:
Where is referred to as the simple mean
and is the sample variance such
that the given sample mean of the set is simply in direct proportion to the value with equal variance of
. This also implies that an example of the form:
produces a dataset of , . . . , restricted to interval (n, m). These form of scaling generally alters the distribution pattern of the data, even for spatially distributed datasets. For the purpose of simulating normal multivariate data, the R package was used. It allows for the simulation of datasets that can emulate the behavior of the original data within the context of normally distributed data. The data are simulated specifically from the conditional distributed data of a normally distributed variable, given that the sample and mean and the
co-variance are equal to a pre-specified value. One important thing to note is that the marginal distributions are not exactly normalized. The following sections demonstrates the results obtained by carrying the above stated processes.
VII. DISTRIBUTION OF SIMULATED DATA
From the hypothetical data generated, we have z has the Baseline, Amplitude, MST, MSP, MappedFX and Status as the best selected variables from our original model. The Status is the only categorical variable from the entire dataset selected. rom the data set , amplitude and MST of the response has the lowest p-values (p1=7.33e06 and p2 = 0.000175) and are best predictors for the stress level. Looking at the density and histogram graph (Figure 12), it is noted that censoring in the amplitude values have far more reaction at 20 than the rest of the distribution. The simulated data also emulates the associative characteristics of the original data based on Pearson correlation, where there is obvious absence of correlation among attribute has shown in Figure 14, thought the Naive Bayes classifier is suitable for such distribution since all variable seem to be independent of each other. We resolve to the bootstrapping process to produce normal proportionally distributed data to determine its significance of data generalization. As a form of model comparison using linear model, the best fit also turn out to be the original model that comprises all attributes with confidence interval at 1.522. The receiver operating characteristics (Figure 15) shows with area under the curve as 0.57, which is far less when compared to the original model with area under the curve 0.91. This implies the generalization of the model is significant enough to be recognized as valid.
Fig. 12: Density and Histogram of most significant variable

FATIMA ISIAKA et al: SPONTANEOUS EXTRAPOLATION AND DETECTION OF STRESS LEVEL BASED . . .
DOI 10.5013/IJSSST.a.17.32.01 1.9 ISSN: 1473-804x online, 1473-8031 print
Figure 13 describes the relative likelihood for the simulated variables to take on a given value, based on the stress level of the entire distribution, the integral over the space for stressed used of equal to one. This is relative to the n number of variables selected for best model, such that the domain in the n-dimensional space of the values of the variables results to the probability that a realization of the dataset falls with the given domain of stress level.
Fig. 13: Probability density function for simulated data
For a given distribution of the form above, the density plot shows that there is no significant overlap, which implies that the users were close to been relaxed than stress, so it is more realistic to investigate what contributes to the relaxed state of users during HCI events. The simulated data can also tell us or describe how the relaxed state of users is actually a better status to defining the stress levels than neutral or stress mode.
Fig. 14: Correlation matrix of Simulated attributes
Fig. 15: ROC with performance of models using Linear model for validation
VIII. STANDARD ERRORS AND CONFIDENCE INTERVALS FOR BOOSTRAPPING
To construct a confidence interval for a populated parameter, an interval centered at a point estimate with a margin of error equal to twice the standard error was utilized. The size of the standard error was estimated by applying bootstrap and resampling many samples with substitutions from the original or simulated dataset. Each size has the original sample computed at a point estimate for each variable, in order to find the standard deviation of the distribution of the boostrape stats. Figure 16 shows that the distribution is nearly symmetrical and also bell-shaped. The standard error is given as 0.61 and the constructed confidence interval with margins of error rounded to one decimal place as -1.8 and 1.8. This then interprets that the 95% confident that the mean latency time for response peaks among users of the webpages who definitely did not experience stress is in the interval of approximately 2 minute latency. The accuracy of this diagnostics depends basically on the original data used for modelling and as part of representation from the population of importance. As the experiment conducted is based on non-obstructive method, it seems realistic.

FATIMA ISIAKA et al: SPONTANEOUS EXTRAPOLATION AND DETECTION OF STRESS LEVEL BASED . . .
DOI 10.5013/IJSSST.a.17.32.01 1.10 ISSN: 1473-804x online, 1473-8031 print
Fig. 16: Boostrap confidence intervals and standard errors
Fig. 17: Model for performance evaluation and visualization
IX. CONCLUSION
To further validate, we can examine the references to gain more understanding about the conditions associated with sampling procedure like for example, investigate on whether users drawn to aesthetics of the webpages reduces stress levels, or changing method of data collection like adopting to obstructive and subjective measures. Today it is possible to actually understand users’ cognitive and unconscious thought processes, due to constant struggle to
find the best methods to allow us to understand this concept. Implicit reactions and emotions can be measured, while users interact with elements on a webpage, this is because the benefit of physiological data is primarily that the measure of task performance is due to objective rather subjective measures. Data can be collected and examined in either delayed or real time without interrupting data collection. The reason for application of modeling is to see if pattern can be identified from the quantitative data obtained from physiological measures and eye tracking of

FATIMA ISIAKA et al: SPONTANEOUS EXTRAPOLATION AND DETECTION OF STRESS LEVEL BASED . . .
DOI 10.5013/IJSSST.a.17.32.01 1.11 ISSN: 1473-804x online, 1473-8031 print
participants. Based on the performance of models, it is fit to conclude that patterns can be learned in HCI-HPR. Though the custom algorithm used here might be complex and traditionally exemplified, it will be more feasible to produce a prototypical tool of its form for easy data analyses and user friendly. One of the future contributions will be to develop an integrative window based model for simulation of human physiological response to both static and dynamic contents of a webpage. This would facilitate analysis and evaluation protocol of HCI-HPR and this could contribute and help achieve better design decisions in shorter period of time than the normal traditional methods.
ACKNOWLEDGMENT
The authors would like to the Web Ergonomics Lab in University of Manchester, where the experiment was conducted.
REFERENCES
[1] John L Andreassi. Psychophysiology: Human behavior & physiological response. Psychology Press, 2000.
[2] AC Atkinson. Fast very robust methods for the detection of multiple outliers. Journal of the American Statistical Association, 89(428):1329–1339, 1994.
[3] Albert F Ax. The physiological differentiation between fear and anger in humans. Psychosomatic medicine, 15(5):433–442, 1953.
[4] Arreed F Barabasz Restricted environmental stimulation and the enhancement of hypnotizability: Pain, eeg alpha, skin conductance and temperature responses. The International journal of clinical and experimental hypnosis, 30(2):147–166, 1982.
[5] Jennifer C Romano Bergstrom, Erica L Olmsted-Hawala, and Hadley C Bergstrom. Older adults fail to see the periphery in a web site task. Universal Access in the Information Society, pages 1–10, 2014.
[6] Jennifer Romano Bergstrom and Andrew Schall. Eye tracking in user experience design. Elsevier, 2014.
[7] Davide Canali, Marco Cova, Giovanni Vigna, and Christopher Kruegel. Prophiler: a fast filter for the large-scale detection of malicious web pages. In Proceedings of the 20th international conference on World wide web, pages 197–206. ACM, 2011.
[8] J Alberto Castaneda, Francisco Munoz-Leiva, and Teodoro Luque. Web acceptance model (wam): Moderating effects of user experience.Information & Management, 44(4):384–396, 2007.
[9] Tim RV Davis and Fred Luthans. A social learning approach to organizational behavior. Academy of Management Review, 5(2):281–290, 1980.
[10] S¸ukr¨u Barıs¸ Demiral, Matthias Schlesewsky, and Ina Bornkessel-Schlesewsky. On the universality of language comprehension strate-gies: Evidence from turkish. Cognition, 106(1):484–500, 2008.
[11] Sandrine Dudoit, Jane Fridlyand, and Terence P Speed. Comparison of discrimination methods for the classification of tumors using gene expression data. Journal of the American statistical association, 97(457):77–87, 2002.
[12] John M Findlay, Robin Walker, and Robert W Kentridge. Eye movement research: Mechanisms, processes and applications, volume 6. Elsevier, 1995.
[13] Shamsi T Iqbal, Xianjun Sam Zheng, and Brian P Bailey. Task-evoked pupillary response to mental workload in human-computer interaction. In CHI’04 extended abstracts on Human factors in computing systems,
pages 1477–1480. ACM, 2004. [14] Ron Kohavi. Scaling up the accuracy of naive-bayes classifiers: A
decision-tree hybrid. In KDD, pages 202–207, 1996. [15] Simon P Liversedge and Hazel I Blythe. Lexical and sublexical
influences on eye movements during reading. Language and Linguistics Compass, 1(1-2):17–31, 2007.
[16] David J Lunn, Andrew Thomas, Nicky Best, and David Spiegelhalter. Winbugs-a bayesian modelling framework: concepts, structure, and extensibility. Statistics and computing, 10(4):325–337, 2000.
[17] Roxana Moreno, Martin Reislein, and Gamze Ozogul. Using virtual peers to guide visual attention during learning, Journal of Media Psychology, 2015.
[18] Nuria M Oliver, Barbara Rosario, and Alex P Pentland. A Bayesian computer vision system for modeling human interactions. Pattern Analysis and Machine Intelligence, IEEE Transactions on, 22(8):831–843, 2000.
[19] Edgar Osuna, Robert Freund, and Federico Girosi. An improved training algorithm for support vector machines. In Neural Networks for Signal Processing [1997] VII. Proceedings of the 1997 IEEE Workshop, pages 276–285. IEEE, 1997.
[20] Jenny Preece, Helen Sharp, and Yvonne Rogers. Interaction Design-beyond human-computer interaction. John Wiley & Sons, 2015.
[21] NL Ramanathan. A new weighting system for mean surface temperature of the human body. Journal of applied physiology, 19(3):531–533, 1964.
[22] Marc L Resnick. Ubiquitous computing ux when there is no ui. In Proceedings of the Human Factors and Ergonomics Society Annual Meeting, volume 57, pages 1007–1011. SAGE Publications, 2013.
[23] S´ebastien Saint-Aim´e, Brigitte Le P´ev´edic, and Dominique Duhautigrace–emotional computational model for emi companion robot. Advances in Human-Robot Interaction, page 26, 2009.
[24] Abraham Savitzky and Marcel JE Golay. Smoothing and differentiation of data by simplified least squares procedures. Analytical chemistry, 36(8):1627–1639, 1964.
[25] Neal Schmitt. Method bias: The importance of theory and measurement. Journal of Organizational Behavior, 15(5):393–398, 1994.
[26] Sec¸il Ugur. Wearing embodied emotions: A practice based design research on wearable technology. Springer, 2013. [27] Robert D Ward and Philip H Marsden. Physiological responses to different web page designs. International Journal of Human-Computer Studies, 59(1):199–212, 2003.
[28] Steve J Westerman, EJ Sutherland, L Robinson, H Powell, and G Tuck. A multi-method approach to the assessment of web page designs. In Affective Computing and Intelligent Interaction, pages 302–313. Springer, 2007.
[29] Matthias J Wieser, Paul Pauli, Georg W. Alpers, and Andreas M¨uhlberger. Is eye to eye contact really threatening and avoided in social anxiety? an eye-tracking and psychophysiology study. Journal of anxiety disorders, 23(1):93–103, 2009.
[30] Gillian M Wilson and M Angela Sasse. Do users always know whats good for them? utilising physiological responses to assess media quality. In People and Computers XIVUsability or Else!, pages 327–339. Springer, 2000.
[31] Daniel Wiswede, Jascha R¨usseler, and Thomas F M¨unte. Serial position effects in free memory recallan erp-study. Biological psychology, 75(2):185–193, 2007.