sponsored by Workiva AUDIT FEE REPORT - Home - FEI Final/2015-018.pdf · sponsored by Workiva AUDIT...
56
executive report sponsored by Workiva AUDIT FEE REPORT 2015 ANNUAL
Transcript of sponsored by Workiva AUDIT FEE REPORT - Home - FEI Final/2015-018.pdf · sponsored by Workiva AUDIT...

executive report
sponsored byWorkiva
AUDIT FEE
REPORT
2015ANNUAL

FOREWORD
Financial executives at public companies, private companies, and nonprofits are continuallychallenged to contain costs. To do that effectively, executives need high-quality, timely, andactionable information.
Workiva is pleased to sponsor the eighth annual Audit Fee Report from Financial ExecutivesResearch Foundation (FERF). As an independent research organization, FERF seeks to understandthe forces that are driving business and financial outcomes. FERF reports have earned a reputationfor being well-researched and documented, and for providing valuable insights with actionableinformation. This report is no exception.
Contained in this report is valuable information about audit fees for public, private, and nonprofitcompanies. I believe that some of the most important findings include:
• Median audit fees of all SEC filers experienced an increase of approximately 3.4 percent,compared to increases in the producer price for services of approximately 1.8 percent.
• However, the median increase in audit fees was 6.4 percent for the 20.6 percent of publiccompanies that disclosed material weaknesses in their internal controls over financialreporting (ICFR).
• Public company survey respondents reported that review of manual controls resulting fromPCAOB inspections was a significant driver of increased audit fees.
For private companies and nonprofits, this report remains one of the most valuable sources for auditfee information. Audit fees continue to rise at or below the rate of inflation for services—althoughaverages were significantly less for organizations with centralized finance organizations.
This report also provides a valuable basis for future research. Some of the most provocativequestions inspired by this report are:
• Although the median change in SEC filers' audit fees from 2013 to 2014 was a 3.4 percentincrease, over 45 percent of public companies reported lower audit fees from the prior year.What were the factors that contributed to this decrease, and are such practices sustainable?
• In each of the last 3 years, approximately 12 percent of public companies reported increasesin audit fees of 50 percent or more. What were the principal drivers of such significantincreases, and are they preventable?
• What is the nature of the material weaknesses in internal controls over financial reportingdisclosed by 20.6 percent of public companies?
We look forward to supporting FERF as it seeks to answer these and other important questions.
Joseph HowellExecutive Vice PresidentWorkiva
2015 Audit Fee Report - October 2015
Page 1 of 54
Copyright 2015 Financial Executives Research Foundation (FERF) www.ferf.org. No part may be reprinted or distributed without prior written approval from FERF.

Table of Contents
Executive Summary 3
Public Companies - SEC Filers 6
Public Companies - Survey Respondents 12
Private Companies 25
Nonprofit Companies 31
Exhibit A: 2014 Average Audit Fees by Filing Status 36
Exhibit B: 2014 Average Audit Hours by Filing Status 37
Exhibit C: 2014 Average Audit Fees by Sales Revenue 38
Exhibit D: Reasons for Increase in Audit Fees 41
Exhibit E: Centralized vs. Decentralized Operations 42
Exhibit F: Primary Audit Firm 43
Exhibit G: Non-Audit Fees 44
Exhibit H: Auditor Relations 45
Exhibit I: Public Company Internal Controls 46
Exhibit J: 2013 Audit Committee Questions 47
Exhibit K: Public Company Questions 48
Exhibit L: Change in Audit Fees Distribution - Three year analysis (all filers) 50
About Workiva 53
About MyLogIQ 53
About Financial Executives Research Foundation (FERF) 54
2015 Audit Fee Report - October 2015
Page 2 of 54
Copyright 2015 Financial Executives Research Foundation (FERF) www.ferf.org. No part may be reprinted or distributed without prior written approval from FERF.
Executive SummaryFinancial Executives Research Foundation’s (FERF) Audit Fee Report has beenproviding valuable insight into audit fee trends for the past seven years based on surveyresponses from FEI member companies. As in the past, this year's report analyzes themost recent audit year and provides reasons for changes from the prior year.
In addition, with the help of MyLogIQ (formerly LogixData) this year’s report alsosummarizes audit fees as reported by over 9,000 SEC filers and has been expanded toinclude:
• The audit fees for 8,156 unique filers in 2011; 8,129 in 2012; 7,885 in 2013; and7,071 in 20141;
• The percentage which disclosed ineffective internal controls over financialreporting (ICFR) from these SEC filers;
• A comparison of the median change in audit fees for these SEC filers, medianchanges in audit fees of those with ineffective internal controls, and effectiveinternal controls versus the U.S. average producer price index (services); and
• Impact of initial public offerings (IPOs) on audit fees.
MyLogIQ Findings: Public Companies• A total of 20.6 percent (or 1,460 filers) of these SEC filers reported ineffective
ICFR.• The median change for audit fees of companies that disclosed ineffective ICFR
was 6.4 percent, which was 3 percentage points more than the overall medianchange in audit fees of 3.4 percent and 4.6 percentage points more than the U.S.Average Producer Price Index for Services of 1.8 percent.
2015 Audit Fee Report - October 2015
Page 3 of 54
Copyright 2015 Financial Executives Research Foundation (FERF) www.ferf.org. No part may be reprinted or distributed without prior written approval from FERF.
1 At the time this analysis was prepared some companies had not yet reported their audit fees for 2014

FERF Survey Findings: The FERF survey summarizes responses from 762 U.S. publicly-held companies, 923
U.S. privately-held companies, and 574 nonprofit organizations for a total of 225participants.The averages and medians reported in this year's Audit Fee Report may not becomparable to 2013, as they may not involve the same participant population as thoseincluded in last year's report. Some of this year’s key findings include:
Public Companies• The 76 public companies responding to the survey paid an average audit fee of
$8.1 million and a median of $2.2 million for their 2014 audits. These amountsrepresented an average percentage increase of 10.7 percent and medianincrease of 3.1 percent over their prior year’s audit fees.
• Survey respondents indicated the reasons for the increase were primarily due toacquisitions and review of manual controls resulting from PCAOB inspections.Other areas for the increase included inflation, the new COSO framework, andchanges in the organizations’ structure.
• The number of audit hours required for a public company audit averaged 25,310with a median of 6,720 (based on 34 responses).
• The average and median audit fees for public companies that have centralizedfinance operations are significantly less than those that have decentralizedfinance operations.
• About 86.8 percent of responding public companies use a Big 45 auditor—withPwC auditing 22 of the total 76.
• A majority of public companies indicated that the volume of annual audit work byexternal auditors in 2014 has increased compared to 2013 in order to obtain bothan auditor's report on the financial statements (69.3 percent) and an auditor'sreport on internal controls (63.2 percent).
• A majority (67.6 percent) of public companies have adopted the 2013 COSOFramework. Others indicated that they will adopt the new Framework by 2015year end at the latest.
• Over half, or 58.7 percent of respondents, indicated an increase in internal costof compliance with Sarbanes-Oxley Section 404 within the past three years.However, about half (or 45.3 percent) indicated that they have better internalcontrols and that the additional expense was worthwhile.
• Overall, audit firms shared results of the PCAOB review with public companiesand requested that they implement the suggested firm inspection controlchanges.
2015 Audit Fee Report - October 2015
Page 4 of 54
Copyright 2015 Financial Executives Research Foundation (FERF) www.ferf.org. No part may be reprinted or distributed without prior written approval from FERF.
2 Although not statistically significant, we believe the public company survey responses are representative of the total population ofSEC filers because the median increase in the audit fees of the survey respondents was 3.1 percent, compared to the medianincrease of 3 percent in the audit fees of the total population.3 The private company responses are not statistically significant.4 The nonprofit organizations responses are not statistically significant.5 Big 4 include Deloitte, EY, KPMG, and PwC.

• A total of 45.3 percent and 66.7 percent of respondents, respectively, indicatedthat their auditors requested that they make changes to their controls or controlsdocumentation as a result of PCAOB requirements or inspection feedback.
• None of the respondents indicated that the PCAOB findings resulted in arestatement of their financial statements nor did it result in a change in theirauditor’s opinion.
Private• The 92 private companies paid an average annual audit fee of $254,740 and
median audit fee of $70,000, which was 2.7 percent and 2.0 percent,respectively, greater than the prior year. This increase was mainly due toinflation.
• The number of audit hours required for a private company averaged 2,800 with amedian of 850.
• Only 22.8 percent of private companies that responded used the Big 4. A majorityof the respondents use large regional firms.
Nonprofit• The 57 nonprofit companies paid an average annual audit fee of $107,208 and
median fees of $36,440, which was an average increase of 1.3 percent from theprior year. This increase was mainly due to inflation.
• The number of audit hours required for a nonprofit company averaged 585 with amedian of 400.
• Only 8.9 percent of nonprofit companies that responded used the Big 4. A total of73.2 percent selected “other,” which represented regional firms.
2015 Audit Fee Report - October 2015
Page 5 of 54
Copyright 2015 Financial Executives Research Foundation (FERF) www.ferf.org. No part may be reprinted or distributed without prior written approval from FERF.
Public Companies - SEC Filers
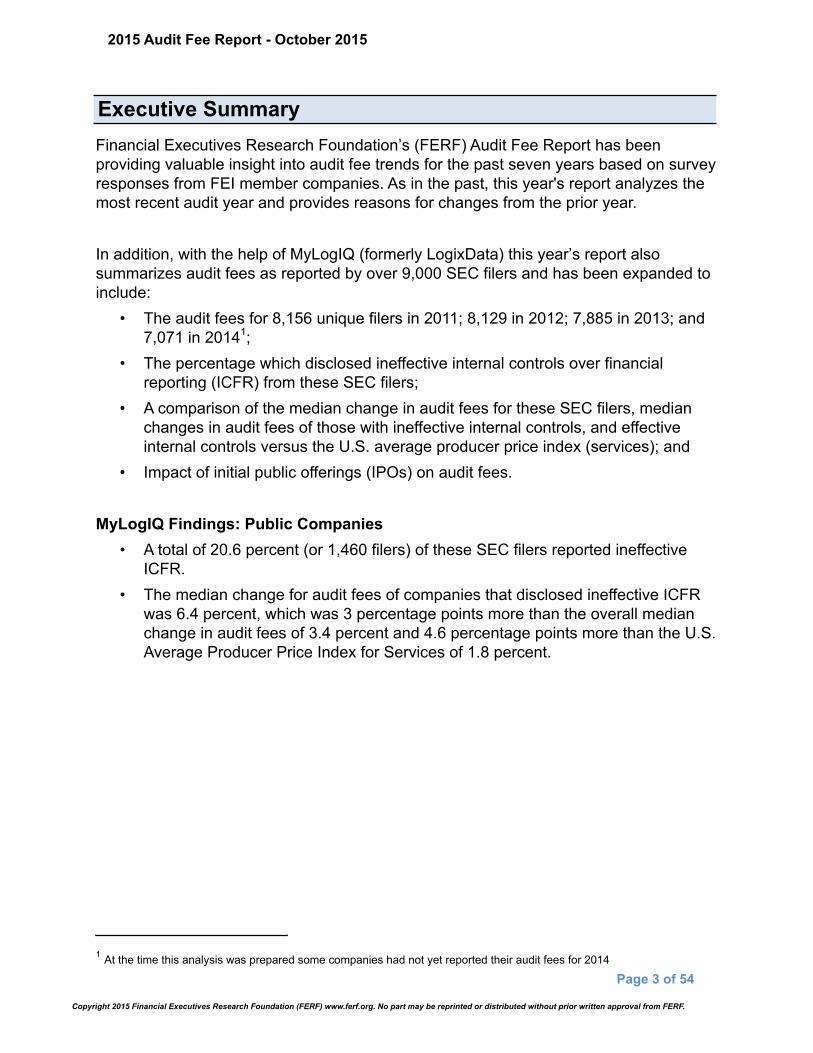
Using information obtained from MyLogIQ, this year’s report contains additionalstatistics from a broader pool of SEC filers for a longer period of time (2011–2014). Atotal of 9,431 unique filers were reviewed with information being derived from either theproxy statement or the form 10-K. Of the 9,431 filers, information was available for7,071 for 2014. Differences represent companies that either have not filed thisinformation or do not file the information due to their size.
Audit Fees for 2014
Audit fees paid by the 7,071 unique filers for 2014 averaged $1.5 million and had amedian of $402,812. Based on amounts reported by this population of filers, their totalaverage percentage increase in audit fees was 30.9 percent with a median percentagechange of 3.4 percent.
The median audit fee change by filer status was highest for large accelerated andaccelerated filers at 4.3 percent. This was followed by non-accelerated filers at 4percent and smaller reporting companies at 2.3 percent. The Agriculture, Forestry, andFishing industry also experienced the highest median audit fee change at 6.2 percent,which was followed by retail trade at 5 percent.
2011 2012 2013 2014SEC Filings 8,156 8,129 7,885 7,071Average Audit Fees $1,213,814 $1,281,544 $1,398,833 $1,533,438Median Audit Fees $246,000 $263,634 $309,441 $402,812
Mean % Change in Audit Fees6 — 30.4% 40.9% 30.9%Median % Change in Audit Fees — 3.0% 3.5% 3.4%
Median Audit Fee Changes By Filer StatusLarge Accelerated Filer — 5.5% 5.4% 4.3%Accelerated Filer — 3.4% 4.7% 4.3%Non Accelerated Filer — 1.8% 4.6% 4.0%Smaller Reporting Company — 0.8% 1.3% 2.3%
2015 Audit Fee Report - October 2015
Page 6 of 54
Copyright 2015 Financial Executives Research Foundation (FERF) www.ferf.org. No part may be reprinted or distributed without prior written approval from FERF.
6 The Mean % Change in Audit Fees is an average of the change in audit fees of all filers and not a change in the overall audit fee.
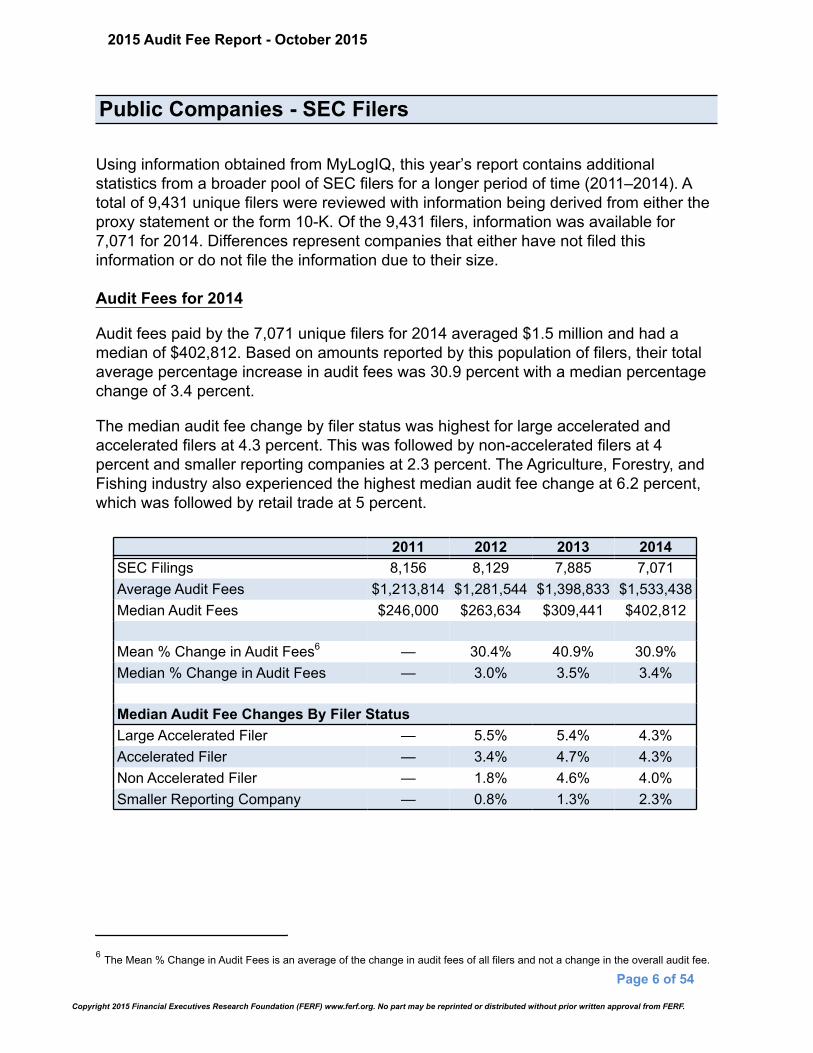
Median Audit Fee Changes By Industry 2011 2012 2013 2014Manufacturing — 3.4% 3.8% 3.5%Finance, Insurance, & Real Estate — 2.7% 3.3% 3.4%Services — 2.5% 4% 4.8%Mining — 0.8% 1.9% 2.2%Transportation, Communication, Electric, Gas, andSanitary Services — 3.0% 3.3% 1.2%Retail Trade — 3.7% 4.7% 5%Wholesale Trade — 3.9% 6.1% 4.9%Construction — 8.5% 10.8% 2.6%Agriculture, Forestry, and Fishing — 1.3% 0.1% 6.2%Public Administration — 1.9% 1.1% —%
Of these SEC filers, 341 indicated that they had an initial public offering (IPO) during theyear. The median audit fee change for these organizations was 41.3 percent, which wasa decrease from 362 IPOs in 2013.
Median Audit Fee Changes By IPO 2011 2012 2013 2014IPO 2012 (309) — 23.8% 4.7% 7.7%IPO 2013 (362) — 74.6% —%IPO 2014 (341) — 41.3%
The 7,071 filers were plotted on a distribution table to determine where the majority ofthe population falls as it relates to median percentage change. Over 950 filers wereplotted on a distribution table that had audit fee percentage change of negative 1percent. The distributions for the past two years are similar with the high points atnegative 1 and approximately 450 with percentage increases over 100 percent (SeeExhibit L).
2015 Audit Fee Report - October 2015
Page 7 of 54
Copyright 2015 Financial Executives Research Foundation (FERF) www.ferf.org. No part may be reprinted or distributed without prior written approval from FERF.

2013-2014 Audit Fee %Change Distribution
1,000
800
600
400
200
0
Cou
nt
(97)% (79)% (61)% (43)% (25)% (7)% 11% 29% 47% 65% 83% >100%
Percent Change
Primary Audit FirmMost of the public companies within the SEC filer population (3,336 or 47.2 percent)reported that they used one of the Big 4 as their primary auditor. EY was mentionedmost often (1,072 or 15.2 percent), followed by PwC (801 or 11.3 percent). After the Big4, Grant Thornton, RSM McGladrey & Pullen, Malone Bailey, Crowe Horwath, Marcum,and BDO were also mentioned.
2015 Audit Fee Report - October 2015
Page 8 of 54
Copyright 2015 Financial Executives Research Foundation (FERF) www.ferf.org. No part may be reprinted or distributed without prior written approval from FERF.

EY PwC Deloitte
KPMG Grant Thornton BDO
McGladrey Malone Bailey Crowe Horwath
Marcum
Auditor Breakdown
6,000
5,000
4,000
3,000
2,000
1,000
0
Cou
nt
2011 2012 2013 2014
1121 1170 1171 1072
868 880 860 801
817 807 781 754
729 723 731 709
2015 Audit Fee Report - October 2015
Page 9 of 54
Copyright 2015 Financial Executives Research Foundation (FERF) www.ferf.org. No part may be reprinted or distributed without prior written approval from FERF.

EY PwC Deloitte KPMG
Grant Thornton BDO McGladrey Malone Bailey
Crowe Horwath Marcum
Percentage of Total Audits Performed by Year by Auditor
15
10
5
0
Per
cent
ofTo
talA
udits
Per
form
ed
2011 2012 2013 2014
13.7%14.4%
14.9% 15.2%
10.6% 10.8% 10.9%11.3%
10.0% 9.9% 9.9%10.7%
8.9% 8.9%9.3%
10.0%
2015 Audit Fee Report - October 2015
Page 10 of 54
Copyright 2015 Financial Executives Research Foundation (FERF) www.ferf.org. No part may be reprinted or distributed without prior written approval from FERF.
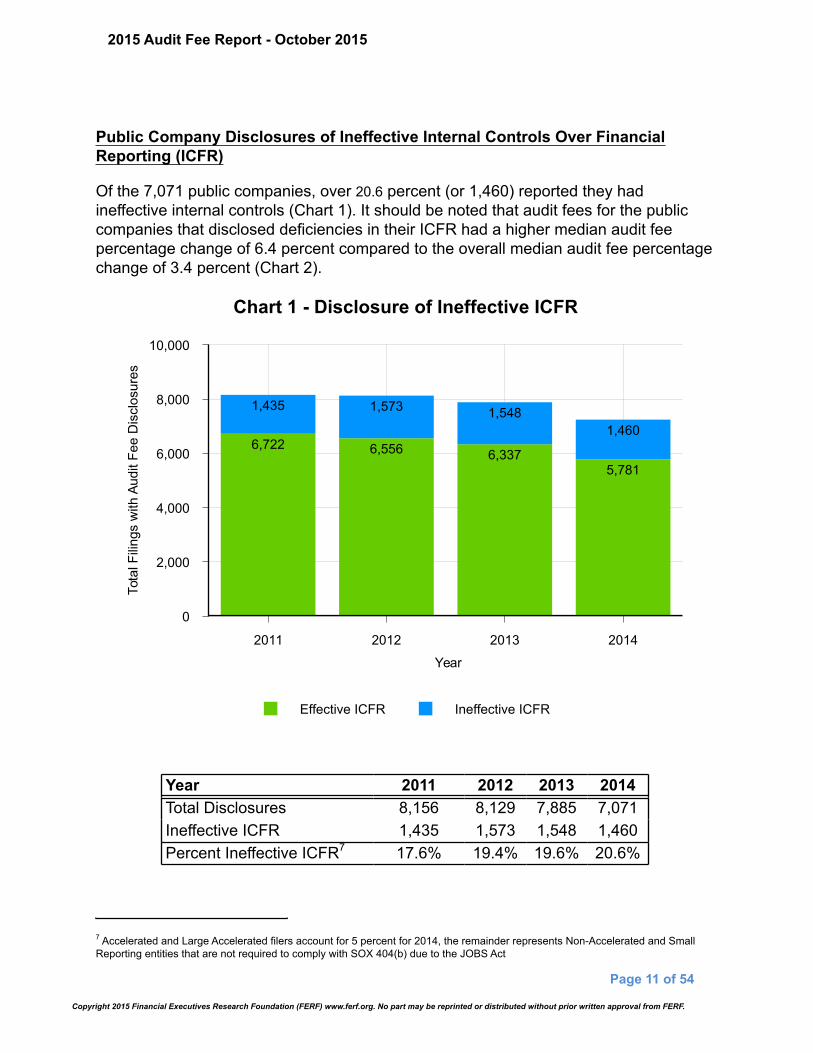
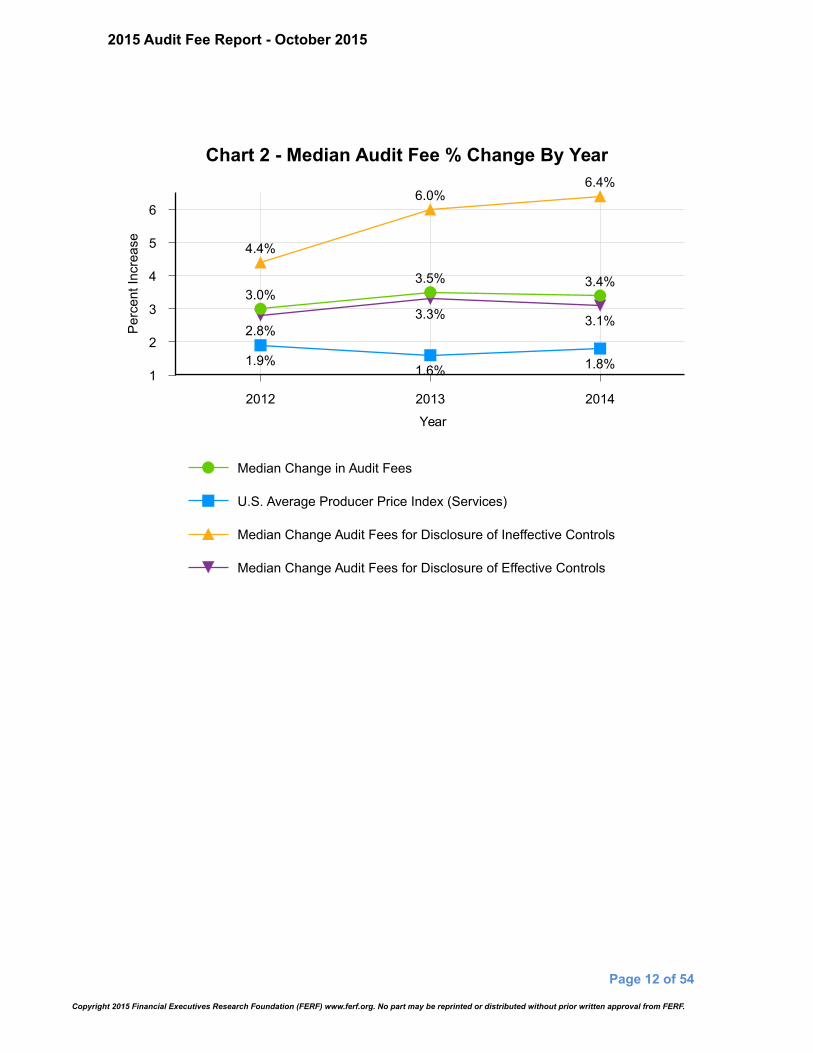
Public Company Disclosures of Ineffective Internal Controls Over FinancialReporting (ICFR)
Of the 7,071 public companies, over 20.6 percent (or 1,460) reported they hadineffective internal controls (Chart 1). It should be noted that audit fees for the publiccompanies that disclosed deficiencies in their ICFR had a higher median audit feepercentage change of 6.4 percent compared to the overall median audit fee percentagechange of 3.4 percent (Chart 2).
Effective ICFR Ineffective ICFR
Chart 1 - Disclosure of Ineffective ICFR
10,000
8,000
6,000
4,000
2,000
0
Tota
lFili
ngs
with
Audi
tFee
Dis
clos
ures
2011 2012 2013 2014
Year
6,722 6,556 6,3375,781
1,435 1,573 1,5481,460
Year 2011 2012 2013 2014Total Disclosures 8,156 8,129 7,885 7,071Ineffective ICFR 1,435 1,573 1,548 1,460Percent Ineffective ICFR7 17.6% 19.4% 19.6% 20.6%
2015 Audit Fee Report - October 2015
Page 11 of 54
Copyright 2015 Financial Executives Research Foundation (FERF) www.ferf.org. No part may be reprinted or distributed without prior written approval from FERF.
7 Accelerated and Large Accelerated filers account for 5 percent for 2014, the remainder represents Non-Accelerated and SmallReporting entities that are not required to comply with SOX 404(b) due to the JOBS Act
Median Change in Audit Fees
U.S. Average Producer Price Index (Services)
Median Change Audit Fees for Disclosure of Ineffective Controls
Median Change Audit Fees for Disclosure of Effective Controls
Chart 2 - Median Audit Fee % Change By Year
6
5
4
3
2
1
Per
cent
Incr
ease
2012 2013 2014
Year
3.0%3.5% 3.4%
1.9%1.6% 1.8%
4.4%
6.0%6.4%
2.8%3.3% 3.1%
2015 Audit Fee Report - October 2015
Page 12 of 54
Copyright 2015 Financial Executives Research Foundation (FERF) www.ferf.org. No part may be reprinted or distributed without prior written approval from FERF.

Public Companies - Survey ResponsesCompany Size
As measured by their public float, 67 or 88.2 percent of the public company respondentsare accelerated filers with market capitalization of more than $75 million. The remaining9 or 11.8 percent represent the non-accelerated filers with total public float of less than$75 million. The breakdown of public respondents follows (Exhibit A):
Non-accelerated
Accelerated $75 to$699 Market Cap.
Large Accelerated$700 and overMarket Cap.
11.8%
30.3%57.9%
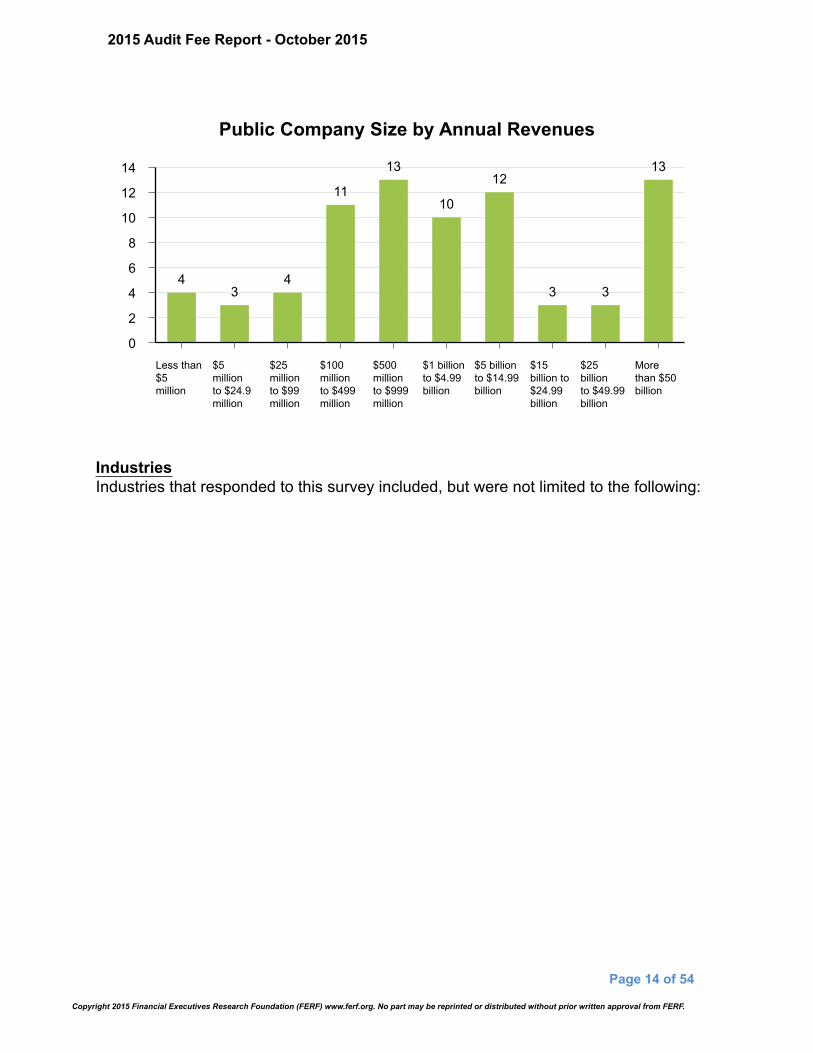
Responses were received from various revenue ranges—the highest were $500 to $999million to more than $50 billion. The chart below identifies the number of respondentsper revenues range (Exhibit C).
2015 Audit Fee Report - October 2015
Page 13 of 54
Copyright 2015 Financial Executives Research Foundation (FERF) www.ferf.org. No part may be reprinted or distributed without prior written approval from FERF.
Public Company Size by Annual Revenues
14
12
10
8
6
4
2
0Less than$5million
$5millionto $24.9million
$25millionto $99million
$100millionto $499million
$500millionto $999million
$1 billionto $4.99billion
$5 billionto $14.99billion
$15billion to$24.99billion
$25billionto $49.99billion
Morethan $50billion
43
4
11
13
10
12
3 3
13
Industries Industries that responded to this survey included, but were not limited to the following:
2015 Audit Fee Report - October 2015
Page 14 of 54
Copyright 2015 Financial Executives Research Foundation (FERF) www.ferf.org. No part may be reprinted or distributed without prior written approval from FERF.

30
25
20
15
10
5
0Manuf.Discrete
Non-ProfitOrg.
Manuf.Process
Tech. ProfesServ. - Otherthan IT
Energy -Oil, Gas,Solar,Other
Education- HigherEducation
Education -Primary orSecondary
Govt -Regional,State orLocal
28
25
20
17
1211
10 10 10
Other common industries included: transportation, financial services, healthcare retail,and insurance, among many others.
Audit Fees for 2014
SEC rule section 240.14a-101 of Schedule 14A (“the Section”) defines audit fees as “…the aggregate fees billed for each of the last two fiscal years for professional servicesrendered by the principal accountant for the audit of the registrant's annual financialstatements and review of financial statements included in the registrant's Form 10-Q(17 CFR 249.308a) or services that are normally provided by the accountant inconnection with statutory and regulatory filings or engagements for those fiscal years…”The results are shown in Exhibits A through C.
Audit fees paid by the 76 public company respondents averaged $8.1 million (Exhibit C)and were, for the most part, proportional to the size of the company as measured bymarket capitalization (Exhibit A) and annual revenues (Exhibit C). Respondentsindicated that their 2014 audit fees were an average of 10.7 percent greater than 2013and had a median increase of 3.1 percent. Average fees by size of company rangedfrom an average increase of 12.3 percent (11 percent increase for median) for those
2015 Audit Fee Report - October 2015
Page 15 of 54
Copyright 2015 Financial Executives Research Foundation (FERF) www.ferf.org. No part may be reprinted or distributed without prior written approval from FERF.

with less than $5 million in revenues to a minimal average increase of approximately 0.4percent (decrease of 0.4 percent for median) for those with revenues of more than $50billion.
Average Decrease/Increase from PY by Annual RevenueRanges
30
25
20
15
10
5
0Less than$5million
$5millionto $24.9million
$25millionto $99million
$100millionto $499million
$500millionto $999million
$1 billionto $4.99billion
$5 billionto $14.99billion
$15billion to$24.99billion
$25billionto $49.99billion
Morethan $50billion
12.3%
7.1%
0.5%
8.7%
21.9%26.0%
5.4% 6.2%
1.1% 0.4%
2015 Audit Fee Report - October 2015
Page 16 of 54
Copyright 2015 Financial Executives Research Foundation (FERF) www.ferf.org. No part may be reprinted or distributed without prior written approval from FERF.

Median Decrease/Increase from PY by Annual RevenueRanges
25
20
15
10
5
0
-5Less than$5million
$5millionto $24.9million
$25millionto $99million
$100millionto $499million
$500millionto $999million
$1 billionto $4.99billion
$5 billionto $14.99billion
$15billion to$24.99billion
$25billionto $49.99billion
Morethan $50billion
11.0%
20.5%
(0.3)%
4.8%
13.1%
4.9%0.7%
4.0% 2.7%
(0.4)%
Accelerated filers with a public float of $75 to $699 million experienced the greatestincrease at an average of 17.3 percent over prior year and a median of 7.8 percent.
Average Inc/Dec from PY Median Inc/Dec from PY
% Increase by filing type
20
15
10
5
0
-5
Non-accelerated Accelerated ($75 to$699 Public Float)
Large Accelerated($700 + Public Float)
-1.8%
17.3%
9.6%
-0.5%
7.8%
2.3%
2015 Audit Fee Report - October 2015
Page 17 of 54
Copyright 2015 Financial Executives Research Foundation (FERF) www.ferf.org. No part may be reprinted or distributed without prior written approval from FERF.

Annual audit fees as a percentage of annual revenues were calculated using theaverage audit fee per revenue range divided by the midpoint of each annual revenuerange provided. Based on the results, companies with less than $5 million in annualrevenues had the highest percentage of audit fees as a percentage of annual revenuesat 12.7 percent increase (12.7 percent median increase). For purposes of the graphsbelow, the less than $5 million range was removed due to an outlier that skewed theresults.
Average Annual Audit Fees as a % of Annual Revenues
3.0
2.5
2.0
1.5
1.0
0.5
0.0$5millionto $24.9million
$25millionto $99million
$100millionto $499million
$500millionto $999million
$1 billionto $4.99billion
$5 billionto $14.99billion
$15billion to$24.99billion
$25billionto $49.99billion
Morethan $50billion
3.09%
0.41% 0.32% 0.17% 0.08% 0.06% 0.07% 0.04% 0.06%
Median Annual Audit Fees as a % of Annual Revenues
1.21.11.00.90.80.70.60.50.40.30.20.10.0
$5millionto $24.9million
$25millionto $99million
$100millionto $499million
$500millionto $999million
$1 billionto $4.99billion
$5 billionto $14.99billion
$15billion to$24.99billion
$25billionto $49.99billion
Morethan $50billion
1.05%
0.46%
0.28%0.14%
0.07% 0.06% 0.07% 0.03% 0.06%
2015 Audit Fee Report - October 2015
Page 18 of 54
Copyright 2015 Financial Executives Research Foundation (FERF) www.ferf.org. No part may be reprinted or distributed without prior written approval from FERF.
A total of 34 or 44.7 percent of public companies provided the amount of hours spent onthe audit which averaged 25,310 hours (median of 6,720). The hours were then dividedby the respondents’ respective audit fees to arrive at the hourly fee. On average, thisamount approximated $225 per hour (median of $210 per hour) of audit work for publiccompanies (Exhibit B).
Reasons for Increase in Audit Fees
Respondents indicated that the reason for the increase in their audit fees was primarilydue to acquisitions (46.3 percent) and review of manual controls resulting from PCAOBinspections and other PCAOB issues (39 percent). 8
If an audit firm was subject to the PCAOB’s oversight review, 57.3 percent of 75respondents indicated that their audit firm shared the comments they received from thePCAOB with them and 10.7 percent said their audit firm did not (Exhibit K).
A total of 45.3 percent and 66.7 percent of these 75 respondents were required tochange their controls and/or control documents as a result of the PCAOB requirementsor inspection feedback (Exhibit K).
In a recent speech, Jeanette Franzel of the PCAOB pointed out that there was anupward trend in instances where a company may receive a clean ICFR audit opinionthat is subsequently withdrawn and replaced with adverse opinions on ICFR.
She cited two primary reasons why a subsequent withdrawn opinion may occur: “(1) theauditor becomes aware that one or more material weaknesses existed at the report datethat would have affected the auditor's opinion on ICFR had the auditor been aware of it;and (2) the previously issued ICFR audit opinion is being relied upon. Because theICFR opinions are issued annually, this "reliance period" is generally from the date theopinion is issued until the date of the issuance of the subsequent year's ICFR auditopinion.” 9
2015 Audit Fee Report - October 2015
Page 19 of 54
Copyright 2015 Financial Executives Research Foundation (FERF) www.ferf.org. No part may be reprinted or distributed without prior written approval from FERF.
8 For further clarification, in December 2012, the PCAOB issued a report on observations from its 2010 inspections of audits ofinternal control over financial reporting performed by domestic annual inspected firms. An inspection of the 309 integrated auditengagements revealed that 15 percent of the firms failed to obtain sufficient audit evidence to support their opinions on effectivenessof internal controls. In response, in October 2013, the PCAOB issued a Staff Practice Alert No. 11: “Considerations for Audits ofInternal Control Over Financial Reporting” in light of significant number of audit deficiencies observed in the past three years relatedto audits of internal controls over financial reporting PCAOB Issues Staff Audit Practice Alert in Light of Deficiencies Observedin Audits of Internal Control Over Financial Reporting, October 24, 2013.
9 http://pcaobus.org/News/Speech/Pages/08102015_Franzel.aspx

1.1 Figure 4: Number of ICFR Audit Opinions Restated from"Clean" (effective ICFR) to "Adverse" (ineffective ICFR)
In the same speech10, Franzel quantified the findings of audit deficiencies related toICFR reported in PCAOB inspection reports for the U.S. domestic Big 4 firms. Sheaffirmed that “most firms have been making some progress in their remediation efforts inthis area.”
Table 1: Inspection Findings for U.S. Domestic Big 4 Firms, 2010-2013
U.S. Domestic - Big 4 Firms [10]
InspectionYear
Total AuditsInspected, U.S.Big Four Firms
Inspected Auditswith Deficiencies
in the PublicInspection
Report
Total IntegratedAudits
Inspected, U.S.Big Four Firms
IntegratedAudits ICFR
Deficiencies inthe PublicInspection
Report
% of IntegratedAudits with ICFR Audit
Deficiencies inthe Public
Report
2013 219 85 211 76 36%2012 208 76 197 64 32%2011 225 80 213 48 23%2010 250 79 236 38 16% 10
2015 Audit Fee Report - October 2015
Page 20 of 54
Copyright 2015 Financial Executives Research Foundation (FERF) www.ferf.org. No part may be reprinted or distributed without prior written approval from FERF.
10 http://pcaobus.org/News/Speech/Pages/08102015_Franzel.aspx

Survey respondents suggest that PCAOB inspection findings continue to be a principalfactor for the increasing audit fees. The chart below quantifies the top reasons indicatedby respondents - acquisitions followed by review of manual controls resulting fromPCAOB inspection. Respondents were allowed to select all that applied.
Top Reasons for Increase in Audit Fees
504540353025201510
50
Acquisition Review ofmanualcontrolsresultingfrom PCAOBinspections
Otherchanges incompanyoperationsor structure
Inflation New COSOFramework
New SECreportingrequirements
Turnover ofkey auditfirm teammembersand/ormandatorypartnerrotation.
Focus onRevenueRecognition
46.3%
39.0%36.6%
31.7% 31.7%
22.0%19.5%
17.1%
Finally, responses were almost equally divided as to whether external auditorsdecreased their reliance on work performed by internal audit staff because of thePCAOB inspections or not. A total of 39.2 percent remained neutral about this issue;whereas 16.2 percent agreed and 20.3 percent disagreed.
2015 Audit Fee Report - October 2015
Page 21 of 54
Copyright 2015 Financial Executives Research Foundation (FERF) www.ferf.org. No part may be reprinted or distributed without prior written approval from FERF.
Centralized vs. Decentralized Operations
Consistent with prior years, respondents indicated that an audit of the financialstatements of a company with centralized operations could be more efficient and lesscostly than that of a company with decentralized operations.
Of the 76 public companies, 50 (66.0 percent) selected centralized operations and 26(34.0 percent) indicated decentralized operations. On average, public companies withcentralized operations paid $6.7 million (median of $1.1 million) for their annual financialstatement audits. Those with decentralized operations paid $10.8 million (median of$3.6 million) (Exhibit E).
Respondents with domestic finance operations also experienced lower audit fees thanthose with both domestic and international finance operations. Of the total publiccompanies, 25 indicated they only have domestic finance operations. Average auditfees were $1.7 million (median of $755,000) compared to average audit fees of $11.2million (median of $4.7 million) for those with both domestic and international financeoperations (Exhibit E).
Primary Audit Firm
Most of the public company respondents (66 or 86.8 percent) reported that they usedone of the Big 4 firms as their primary auditor. PwC was mentioned most often (22),followed by EY (17). After the Big 4, Grant Thornton, RSM McGladrey & Pullen, MossAdams, and BDO were also mentioned.
2015 Audit Fee Report - October 2015
Page 22 of 54
Copyright 2015 Financial Executives Research Foundation (FERF) www.ferf.org. No part may be reprinted or distributed without prior written approval from FERF.
Other Audit Fees
In addition to audit fees, the section also requires disclosures of a company’s audit-related fees, tax fees, and other fees.11
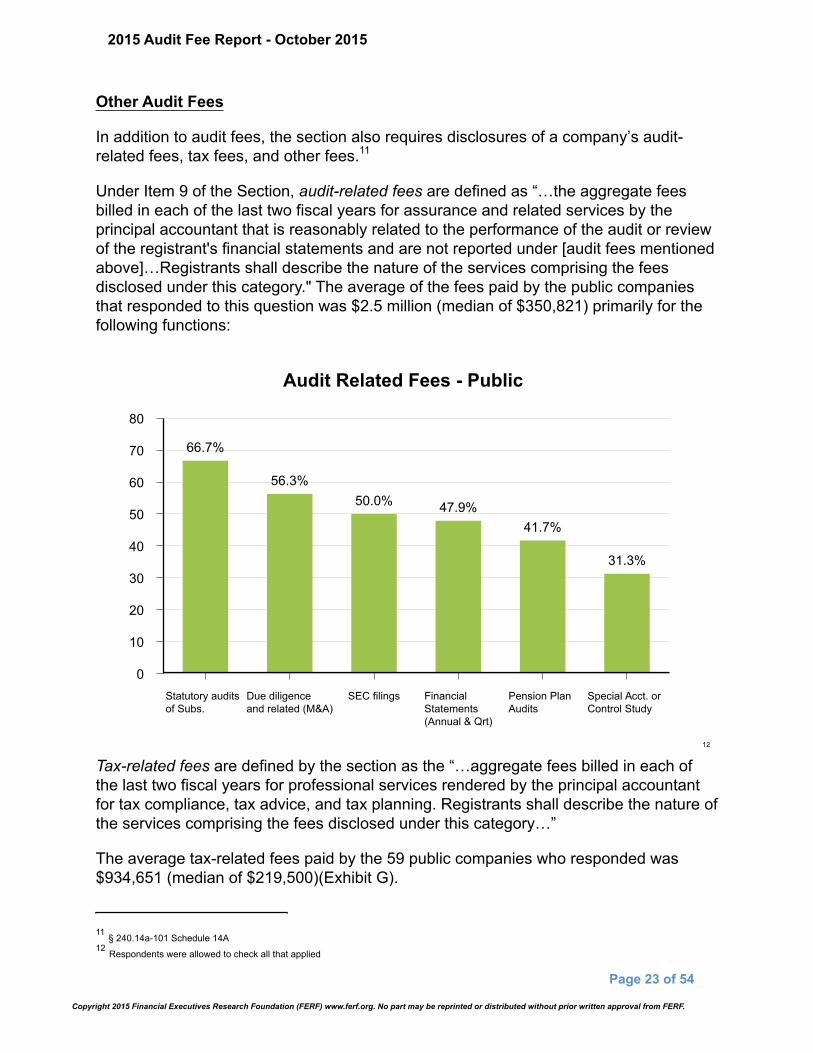
Under Item 9 of the Section, audit-related fees are defined as “…the aggregate feesbilled in each of the last two fiscal years for assurance and related services by theprincipal accountant that is reasonably related to the performance of the audit or reviewof the registrant's financial statements and are not reported under [audit fees mentionedabove]…Registrants shall describe the nature of the services comprising the feesdisclosed under this category." The average of the fees paid by the public companiesthat responded to this question was $2.5 million (median of $350,821) primarily for thefollowing functions:
Audit Related Fees - Public
80
70
60
50
40
30
20
10
0Statutory auditsof Subs.
Due diligenceand related (M&A)
SEC filings FinancialStatements(Annual & Qrt)
Pension PlanAudits
Special Acct. orControl Study
66.7%
56.3%50.0% 47.9%
41.7%
31.3%
12
Tax-related fees are defined by the section as the “…aggregate fees billed in each ofthe last two fiscal years for professional services rendered by the principal accountantfor tax compliance, tax advice, and tax planning. Registrants shall describe the nature ofthe services comprising the fees disclosed under this category…”
The average tax-related fees paid by the 59 public companies who responded was$934,651 (median of $219,500)(Exhibit G).
2015 Audit Fee Report - October 2015
Page 23 of 54
Copyright 2015 Financial Executives Research Foundation (FERF) www.ferf.org. No part may be reprinted or distributed without prior written approval from FERF.
11 § 240.14a-101 Schedule 14A12 Respondents were allowed to check all that applied
Public Company Internal Control Questions
More than half (58.7 percent of 75 respondents) indicated that their internal cost ofcompliance with SOX increased in the past three years. This increase was primarilyexperienced by accelerated filers at 73.9 percent of 23 responses.
Respondents quantified the reasons for the increase in internal costs for SOX primarilyas the regulatory requirements, specifically with the adoption of the 2013 COSOFramework. Other increases indicated were identified as:
• Growth of organization/growth of staff• Various PCAOB issues such as firm's PCAOB inspection findings, increase in
PCAOB’s requirements, PCAOB found auditor work papers deficient, andincreased testing and documentation as a result
• Large acquisition with additional systems
Optimistically, almost half (45.3 percent of 75 respondents) indicated that they havebetter internal controls and that compliance with SOX was worth the added overallexpense. Approximately 38.7 percent responded that they have better internal controls,but their compliance was not worth the added overall expense (Exhibit I).
Audit Committee
Section 205 of the SOX Act requires that an audit committee (or equivalent body)established by and among the board of directors of an issuer must be established forthe purpose of overseeing the accounting and financial reporting processes of theissuer and audits of the financial statements of the issuer. A total of 41.3 percent of 75respondents indicated that their audit committee meets less than four times a year.The audit committee normally oversees the internal audit functions of public companies.A total of 60.5 percent of 76 public respondents (mostly accelerated filers) indicated thattheir internal audit function is performed by separate departments. A total of 44.4percent of non-accelerated filers, indicated that their organization does not have aninternal audit function (Exhibit J).
2015 Audit Fee Report - October 2015
Page 24 of 54
Copyright 2015 Financial Executives Research Foundation (FERF) www.ferf.org. No part may be reprinted or distributed without prior written approval from FERF.
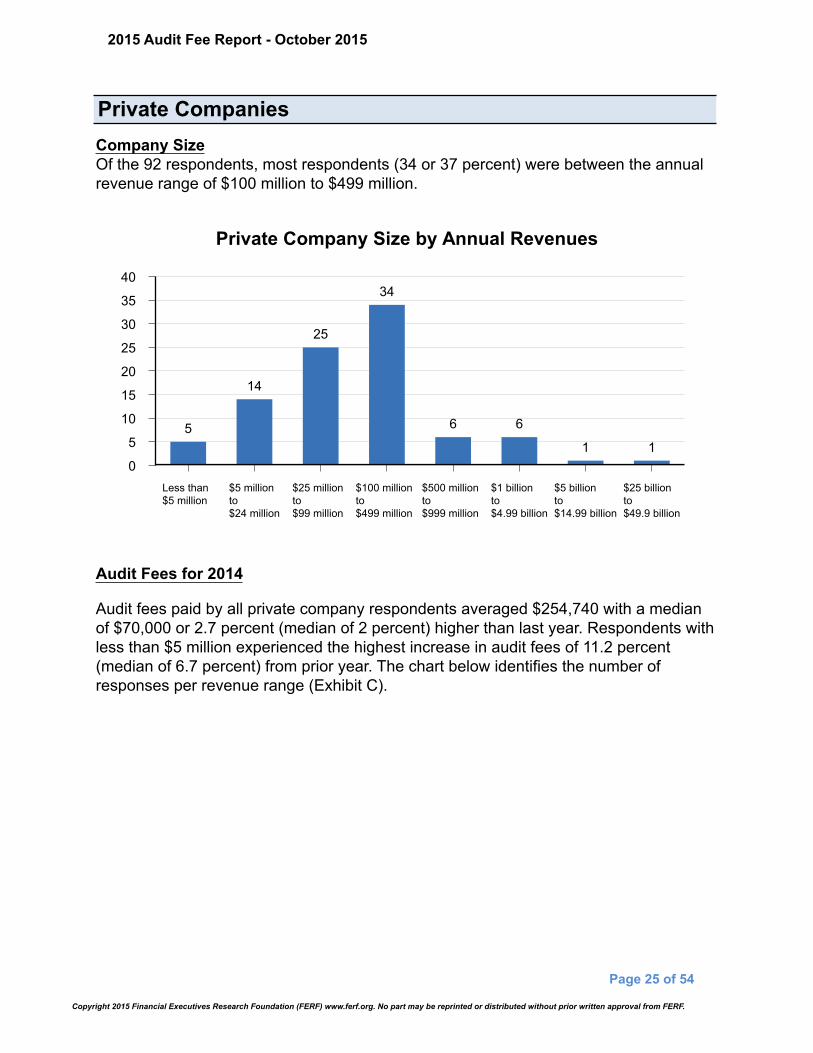
Private CompaniesCompany SizeOf the 92 respondents, most respondents (34 or 37 percent) were between the annualrevenue range of $100 million to $499 million.
Private Company Size by Annual Revenues
40
35
30
25
20
15
10
5
0Less than$5 million
$5 millionto$24 million
$25 millionto$99 million
$100 millionto$499 million
$500 millionto$999 million
$1 billionto$4.99 billion
$5 billionto$14.99 billion
$25 billionto$49.9 billion
5
14
25
34
6 6
1 1
Audit Fees for 2014
Audit fees paid by all private company respondents averaged $254,740 with a medianof $70,000 or 2.7 percent (median of 2 percent) higher than last year. Respondents withless than $5 million experienced the highest increase in audit fees of 11.2 percent(median of 6.7 percent) from prior year. The chart below identifies the number ofresponses per revenue range (Exhibit C).
2015 Audit Fee Report - October 2015
Page 25 of 54
Copyright 2015 Financial Executives Research Foundation (FERF) www.ferf.org. No part may be reprinted or distributed without prior written approval from FERF.
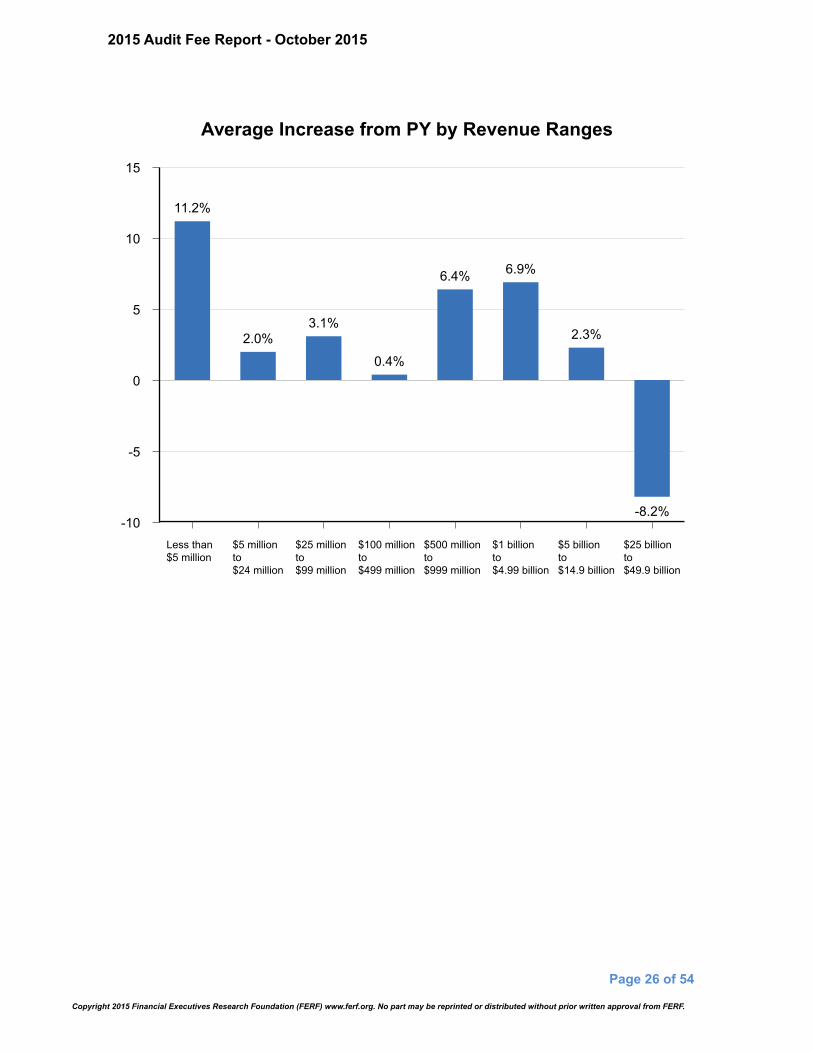
Average Increase from PY by Revenue Ranges
15
10
5
0
-5
-10Less than$5 million
$5 millionto$24 million
$25 millionto$99 million
$100 millionto$499 million
$500 millionto$999 million
$1 billionto$4.99 billion
$5 billionto$14.9 billion
$25 billionto$49.9 billion
11.2%
2.0%3.1%
0.4%
6.4% 6.9%
2.3%
-8.2%
2015 Audit Fee Report - October 2015
Page 26 of 54
Copyright 2015 Financial Executives Research Foundation (FERF) www.ferf.org. No part may be reprinted or distributed without prior written approval from FERF.

Median Increase from PY by Revenue Ranges
10
5
0
-5
-10Less than$5 million
$5 millionto$24 million
$25 millionto$99 million
$100 millionto$499 million
$500 millionto$999 million
$1 billionto$4.99 billion
$5 billionto$14.9 billion
$25 billionto$49.9 billion
6.7%
0.0%1.4% 1.9%
5.3%4.3%
2.3%
-8.2%
Similar to that of the public companies, annual audit fees as a percentage of annualrevenues were calculated using the average audit fees per revenue range divided bythe midpoint of each revenue range provided. As a percentage of annual revenues,audit fees were highest at 1 percent of revenues for all companies that reportedrevenues less than $5 million, with responses of 5 (Exhibit C).
Annual Average Audit Fees as a % of Annual Revenues
1.0
0.8
0.6
0.4
0.2
0.0Less than$5 million
$5 millionto$24 million
$25 millionto$99 million
$100 millionto$499 million
$500 millionto$999 million
$1 billionto$4.99 billion
$5 billionto$14.99 billion
$25 billionto$49.99 billion
1.00%
0.24%
0.09% 0.07% 0.05% 0.03% 0.02% 0.01%
2015 Audit Fee Report - October 2015
Page 27 of 54
Copyright 2015 Financial Executives Research Foundation (FERF) www.ferf.org. No part may be reprinted or distributed without prior written approval from FERF.

Annual Median Audit Fees as a % of Annual Revenues
1.0
0.8
0.6
0.4
0.2
0.0Less than $5million
$5 millionto$24 million
$25 millionto$99 million
$100 millionto$499 million
$500 millionto$999 million
$1 billionto$4.99 billion
$5 billionto$14.99 billion
$25 billionto$49.99 billion
0.81%
0.21%
0.07% 0.05% 0.04% 0.02% 0.02% 0.01%
A total of 30 private companies provided the total number of audit hours, whichaveraged 2,800 with a median of 850 and approximated $159 per hour (median of $200per hour) of audit work (Exhibit B).
2015 Audit Fee Report - October 2015
Page 28 of 54
Copyright 2015 Financial Executives Research Foundation (FERF) www.ferf.org. No part may be reprinted or distributed without prior written approval from FERF.
Reasons for Increase in Audit Fees
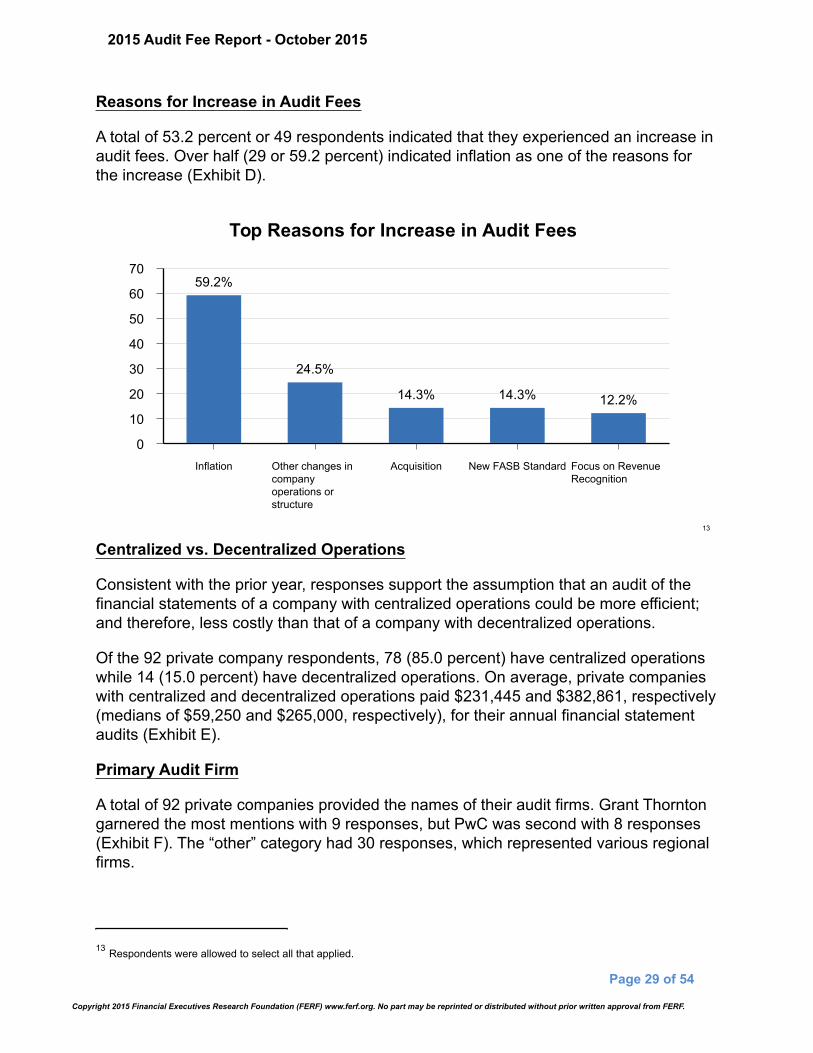
A total of 53.2 percent or 49 respondents indicated that they experienced an increase inaudit fees. Over half (29 or 59.2 percent) indicated inflation as one of the reasons forthe increase (Exhibit D).
Top Reasons for Increase in Audit Fees
70
60
50
40
30
20
10
0Inflation Other changes in
companyoperations orstructure
Acquisition New FASB Standard Focus on RevenueRecognition
59.2%
24.5%
14.3% 14.3% 12.2%
13
Centralized vs. Decentralized Operations
Consistent with the prior year, responses support the assumption that an audit of thefinancial statements of a company with centralized operations could be more efficient;and therefore, less costly than that of a company with decentralized operations.
Of the 92 private company respondents, 78 (85.0 percent) have centralized operationswhile 14 (15.0 percent) have decentralized operations. On average, private companieswith centralized and decentralized operations paid $231,445 and $382,861, respectively(medians of $59,250 and $265,000, respectively), for their annual financial statementaudits (Exhibit E).
Primary Audit Firm
A total of 92 private companies provided the names of their audit firms. Grant Thorntongarnered the most mentions with 9 responses, but PwC was second with 8 responses(Exhibit F). The “other” category had 30 responses, which represented various regionalfirms.
2015 Audit Fee Report - October 2015
Page 29 of 54
Copyright 2015 Financial Executives Research Foundation (FERF) www.ferf.org. No part may be reprinted or distributed without prior written approval from FERF.
13 Respondents were allowed to select all that applied.

Other Audit Fees
Using the same definitions of audit-related, tax, and other audit fees provided in theSection14, 48 private companies paid an average audit-related fee of $79,389 with amedian of $25,000, which included the following services:
Top Reasons for Increase in Audit Fees
60
50
40
30
20
10
0Financial Statements Pension Plan
AuditsAgreed-uponprocedures
Statutory Audits ofSubs.
Due Diligence &related (M&A)
Special Accountingor Control Studies
56.3%
33.3% 31.3%27.1%
20.8% 20.8%
15
Tax-related fees were $87,150 with a median of $35,000 based on 83 responses(Exhibit G).
Auditor Relations
When asked whether the volume of work for external auditors changed to obtain anauditor’s report for the financial statements, 57.8 percent indicated that the amount ofwork remained the same (Exhibit H).
2015 Audit Fee Report - October 2015
Page 30 of 54
Copyright 2015 Financial Executives Research Foundation (FERF) www.ferf.org. No part may be reprinted or distributed without prior written approval from FERF.
14 § 240.14a-101 of Schedule 14A15 Respondents were allowed to select all that applied.
Nonprofit CompaniesCompany Size
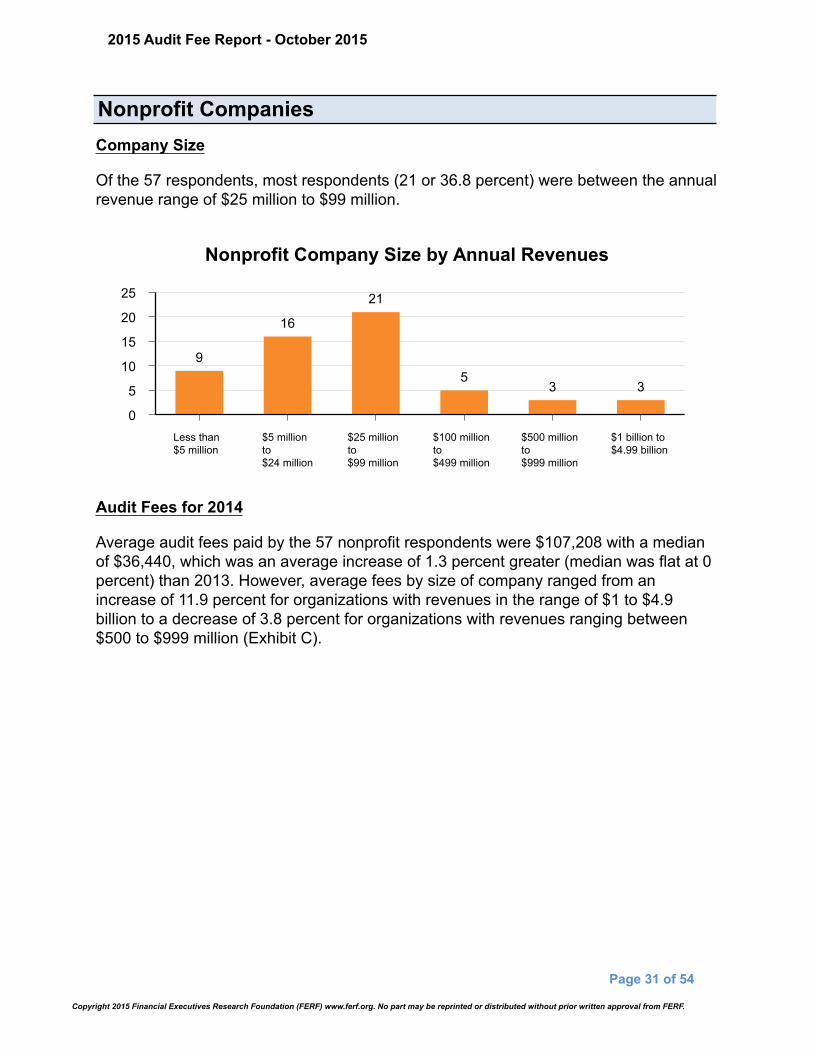
Of the 57 respondents, most respondents (21 or 36.8 percent) were between the annualrevenue range of $25 million to $99 million.
Nonprofit Company Size by Annual Revenues
25
20
15
10
5
0Less than$5 million
$5 millionto$24 million
$25 millionto$99 million
$100 millionto$499 million
$500 millionto$999 million
$1 billion to$4.99 billion
9
16
21
53 3
Audit Fees for 2014
Average audit fees paid by the 57 nonprofit respondents were $107,208 with a medianof $36,440, which was an average increase of 1.3 percent greater (median was flat at 0percent) than 2013. However, average fees by size of company ranged from anincrease of 11.9 percent for organizations with revenues in the range of $1 to $4.9billion to a decrease of 3.8 percent for organizations with revenues ranging between$500 to $999 million (Exhibit C).
2015 Audit Fee Report - October 2015
Page 31 of 54
Copyright 2015 Financial Executives Research Foundation (FERF) www.ferf.org. No part may be reprinted or distributed without prior written approval from FERF.

Average Increase/Decrease from PY by Annual Revenue Ranges
14
12
10
8
6
4
2
0
-2
-4
-6Less than$5 million
$5 millionto$24 million
$25 millionto$99 million
$100 millionto$499 million
$500 millionto$999 million
$1 billion to$4.99 billion
2.4%0.8% 0.6% 0.4%
-3.8%
11.9%
Median Increase/Decrease from PY by Annual Revenue Range
12
10
8
6
4
2
0Less than$5 million
$5 millionto$24 million
$25 millionto$99 million
$100 millionto$499 million
$500 millionto$999 million
$1 billion to$4.99 billion
2.4%
0.9% 0.4% 0.0% 0.0%
10.2%
2015 Audit Fee Report - October 2015
Page 32 of 54
Copyright 2015 Financial Executives Research Foundation (FERF) www.ferf.org. No part may be reprinted or distributed without prior written approval from FERF.

Audit fees as a percentage of revenues were also highest for companies with revenuesranging from $5 million to $24 million at 1.04 percent. However, from a medianperspective, companies with less than $5 million in revenues were the highest at .25percent.
Annual Average Audit Fees as a % of Annual Revenues
1.11.00.90.80.70.60.50.40.30.20.10.0
Less than$5 million
$5 millionto$24 million
$25 millionto$99 million
$100 millionto$499 million
$500 millionto$999 million
$1 billion to$4.99 billion
0.29%
1.04%
0.09%0.02% 0.02% 0.02%
Annual Median Audit Fees as a % of Annual Revenues
0.30
0.25
0.20
0.15
0.10
0.05
0.00Less than$5 million
$5 millionto$24 million
$25 millionto$99 million
$100 millionto$499 million
$500 millionto$999 million
$1 billion to$4.99 billion
0.25%
0.20%
0.09%
0.03% 0.02% 0.02%
2015 Audit Fee Report - October 2015
Page 33 of 54
Copyright 2015 Financial Executives Research Foundation (FERF) www.ferf.org. No part may be reprinted or distributed without prior written approval from FERF.

Reasons for Increase in Audit Fees
Of the 26 respondents, 65.4 percent indicated that the reason for the increase wasprimarily inflation. The top reasons for the increase include the following:
Top Reasons for Increase of Audit Fees
80
70
60
50
40
30
20
10
0Inflation Other changes in
company operationsor structure
OMB A-133 Yellow Book Audits
65.4%
19.2%15.4% 15.4%
Centralized vs. Decentralized OperationsOf the total 57 respondents, 55 (96.0 percent) have centralized operations and 2 (4.0percent) have decentralized operations. On average, those with centralized anddecentralized operations paid $107,499 and $99,350, respectively (median of $34,250and $99,350, respectively), for their annual financial statement audits (Exhibit E).
Primary Audit Firm
Only 5 nonprofit respondents or approximately 8.9 percent use the Big 4 led by EY andKPMG (2 each); while over 73.2 percent indicate they use non-Big 4 auditors. Othernational, regional, or local audit firms that were mentioned include Fortenberry &Ballard, PC; Hudson & Cisne; Lawrimore & Lawrimore; Parente Beard, LLC; and Wipfli(Exhibit F).
2015 Audit Fee Report - October 2015
Page 34 of 54
Copyright 2015 Financial Executives Research Foundation (FERF) www.ferf.org. No part may be reprinted or distributed without prior written approval from FERF.
Other Audit Fees
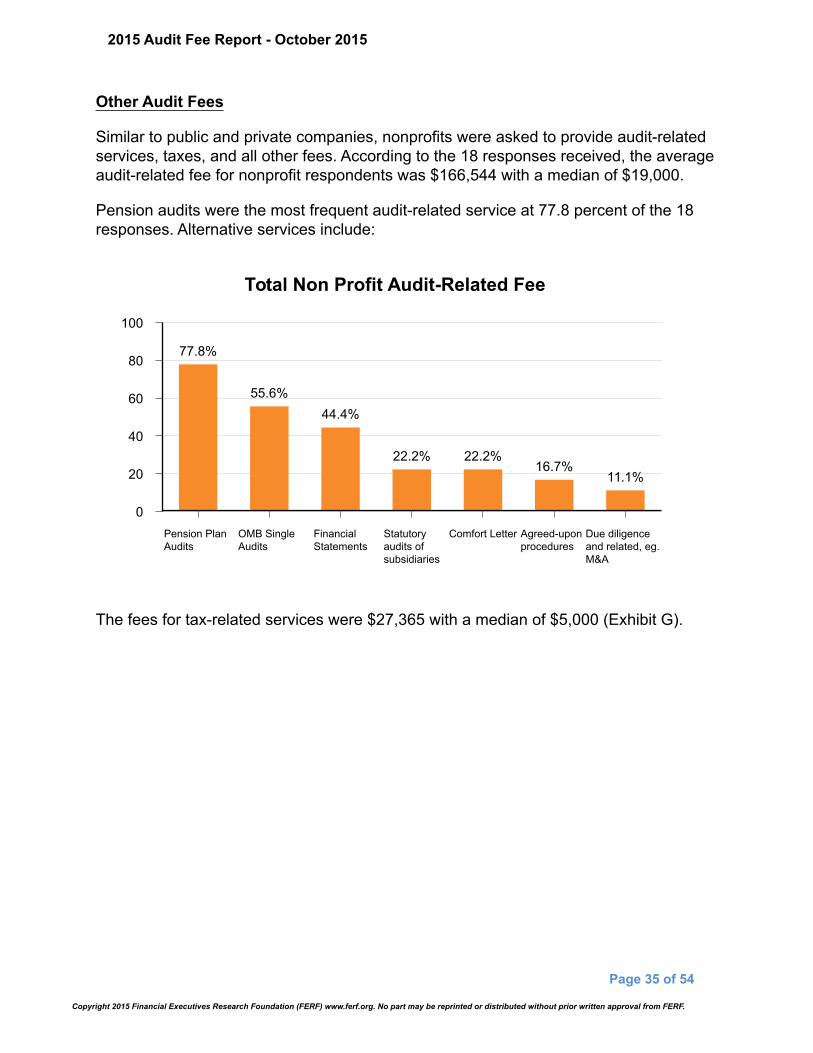
Similar to public and private companies, nonprofits were asked to provide audit-relatedservices, taxes, and all other fees. According to the 18 responses received, the averageaudit-related fee for nonprofit respondents was $166,544 with a median of $19,000.
Pension audits were the most frequent audit-related service at 77.8 percent of the 18responses. Alternative services include:
Total Non Profit Audit-Related Fee
100
80
60
40
20
0Pension PlanAudits
OMB SingleAudits
FinancialStatements
Statutoryaudits ofsubsidiaries
Comfort Letter Agreed-uponprocedures
Due diligenceand related, eg.M&A
77.8%
55.6%44.4%
22.2% 22.2%16.7%
11.1%
The fees for tax-related services were $27,365 with a median of $5,000 (Exhibit G).
2015 Audit Fee Report - October 2015
Page 35 of 54
Copyright 2015 Financial Executives Research Foundation (FERF) www.ferf.org. No part may be reprinted or distributed without prior written approval from FERF.

Exhibit A: 2014 Average Audit Fees by Filing Status
AcceleratedSmaller
ReportingCompanies
Non-Accelerated
$75 to$699
millionLarge Over$700 million
TotalPublic Private Nonprofit
GrandTotal
Survey Responses 9 23 44 76 92 57 225
Average Audit Fees $516,786 $1,487,718 $13,195,521 $8,150,941 $254,740 $107,208 $2,908,773
% Increase from Prior Year -1.8% 17.3% 9.6% 10.7% 2.7% 1.3% 5.1%
Median Audit Fees $306,000 $910,500 $6,630,500 $2,189,000 $70,000 $36,440 $139,000
Median % Increase from PY -0.5% 7.8% 2.3% 3.1% 2.0% —% 1.9%
SEC Filers 2,939 779 1,403 1,950 7,071 N/A N/A N/A
Average Audit Fees $142,188 $1,691,534 $909,018 $4,006,489 $1,533,438 N/A N/A N/A
% Increase from Prior Year 39.1% 71.2% 21.2% 11.0% 30.9% N/A N/A N/A
Median Audit Fees $55,507 $808,000 $604,500 $2,061,538 $402,812 N/A N/A N/A
Median % Increase from PY 2.0% 4.0% 4.3% 4.3% 3.4% N/A N/A N/A
2015 Audit Fee Report - October 2015
Page 36 of 54
Copyright 2015 Financial Executives Research Foundation (FERF) www.ferf.org. No part may be reprinted or distributed without prior written approval from FERF.

Exhibit B: 2014 Average Audit Hours by Filing Status
AcceleratedNon-
Accelerated$75 to $699
millionLarge Over$700 million Total Public Private Nonprofit Grand Total
Number of Responses 3 12 19 34 30 6 70
Average Audit Fees* $836,837 $1,558,685 $9,052,082 $5,682,479 $446,394 $104,789 $2,960,355
Average Audit Hours 4,376 6,684 40,379 25,310 2,800 585 13,544
Average $ per hour $191 $233 $224 $225 $159 $179 $219
Median Audit Fees* $966,000 $1,111,523 $4,778,020 $1,410,006 $170,000 $47,590 $567,599
Median Audit Hours 5,629 4,963 15,000 6,720 850 400 2,900
Median $ per hour $172 $224 $319 $210 $200 $119 $196
NIA = No Information Available *only of those that provided hours
2015 Audit Fee Report - October 2015
Page 37 of 54
Copyright 2015 Financial Executives Research Foundation (FERF) www.ferf.org. No part may be reprinted or distributed without prior written approval from FERF.
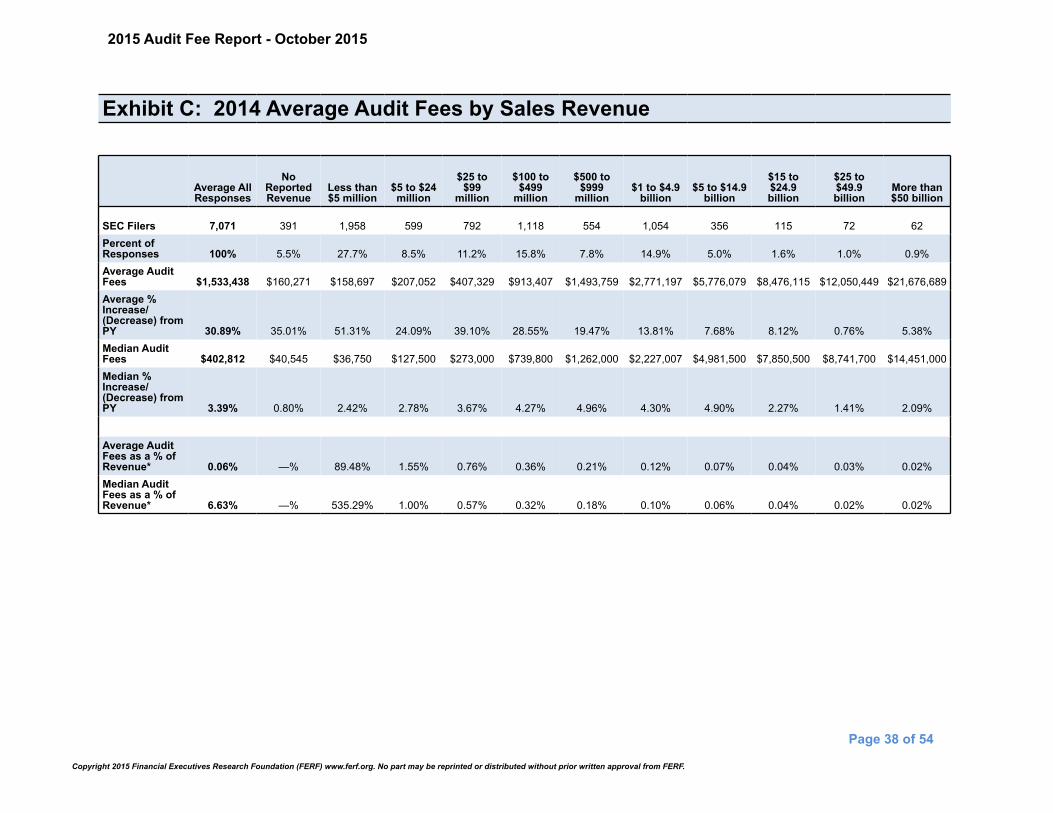
Exhibit C: 2014 Average Audit Fees by Sales Revenue
Average AllResponses
NoReportedRevenue
Less than$5 million
$5 to $24million
$25 to$99
million
$100 to$499
million
$500 to$999
million$1 to $4.9
billion$5 to $14.9
billion
$15 to$24.9billion
$25 to$49.9billion
More than$50 billion
SEC Filers 7,071 391 1,958 599 792 1,118 554 1,054 356 115 72 62Percent ofResponses 100% 5.5% 27.7% 8.5% 11.2% 15.8% 7.8% 14.9% 5.0% 1.6% 1.0% 0.9%Average AuditFees $1,533,438 $160,271 $158,697 $207,052 $407,329 $913,407 $1,493,759 $2,771,197 $5,776,079 $8,476,115 $12,050,449 $21,676,689Average %Increase/(Decrease) fromPY 30.89% 35.01% 51.31% 24.09% 39.10% 28.55% 19.47% 13.81% 7.68% 8.12% 0.76% 5.38%Median AuditFees $402,812 $40,545 $36,750 $127,500 $273,000 $739,800 $1,262,000 $2,227,007 $4,981,500 $7,850,500 $8,741,700 $14,451,000Median %Increase/(Decrease) fromPY 3.39% 0.80% 2.42% 2.78% 3.67% 4.27% 4.96% 4.30% 4.90% 2.27% 1.41% 2.09%
Average AuditFees as a % ofRevenue* 0.06% —% 89.48% 1.55% 0.76% 0.36% 0.21% 0.12% 0.07% 0.04% 0.03% 0.02%Median AuditFees as a % ofRevenue* 6.63% —% 535.29% 1.00% 0.57% 0.32% 0.18% 0.10% 0.06% 0.04% 0.02% 0.02%
2015 Audit Fee Report - October 2015
Page 38 of 54
Copyright 2015 Financial Executives Research Foundation (FERF) www.ferf.org. No part may be reprinted or distributed without prior written approval from FERF.

Exhibit C: 2014 Average Audit Fees by Sales Revenue Continued
Average AllResponses
Less than$5 million
$5 to $24million
$25 to $99million
$100 to$499
million
$500 to$999
million$1 to $4.9
billion$5 to $14.9
billion
$15 to$24.9billion
$25 to$49.9billion
More than$50 billion
PublicNumber of Responses 76 4 3 4 11 13 10 12 3 3 13Percent of Responses 100% 5.3% 3.9% 5.3% 14.5% 17.1% 13.2% 15.8% 3.9% 3.9% 17.1%Average Audit Fees ($) $8,150,941 637,613 447,462 251,959 959,936 1,272,654 2,399,310 5,555,663 13,663,333 13,168,333 32,023,923
Average % Increase/(Decrease) from PY 10.7% 12.3% 7.1% 0.5% 8.7% 21.9% 26% 5.4% 6.2% 1.1% 0.4%Median Audit Fees 2,189,000 636,000 151,750 282,500 830,000 1,018,510 2,125,000 5,541,500 13,899,000 11,500,000 31,499,000
Median % Increase/(Decrease) from PY 3.1% 11% 20.5% (0.3)% 4.8% 13.1% 4.9% 0.7% 4% 2.7% (0.4)%
Average Audit Fees as a %of Revenue* 12.75% 3.09% 0.41% 0.32% 0.17% 0.08% 0.06% 0.07% 0.04% 0.06%
Median Audit Fees as a %of Revenue* 12.72% 1.05% 0.46% 0.28% 0.14% 0.07% 0.06% 0.07% 0.03% 0.06%
Average Audit Hours** 25,310 6,180 500 NIA 5,141 5,217 9,103 27,767 37,000 NIA 125,979
Median Audit Hours ** 6,720 6,180 500 NIA 4,242 2,650 6,000 15,000 37,000 NIA 85,458
Number of Responses 34 2 1 NIA 8 5 7 5 2 NIA 4
PrivateNumber of Responses 92 5 14 25 34 6 6 1 NIA 1 NIAPercent of Responses 100% 5.4% 15.2% 27.2% 37.0% 6.5% 6.5% 1.1% NIA 1.1% NIAAverage Audit Fees ($) $254,740 50,079 34,300 54,713 202,490 384,805 848,118 2,335,000 NIA 4,500,000 NIA
Average % Increase/(Decrease) from PY 2.7% 11.2% 2.0% 3.1% 0.4% 6.4% 6.9% 2.3% NIA (8.2)% NIAMedian Audit Fees $70,000 40,397 30,000 45,000 137,500 324,915 725,400 2,335,000 NIA 4,500,000 NIA
Median % Increase/(Decrease) from PY 2% 6.7% —% 1.4% 1.9% 5.3% 4.3% 2.3% NIA (8.2)% NIA
Average Audit Fees as a %of Revenue* 1.00% 0.24% 0.09% 0.07% 0.05% 0.03% 0.02% NIA 0.01% NIA
Median Audit Fees as a %of Revenue* 0.81% 0.21% 0.07% 0.05% 0.04% 0.02% 0.02% NIA 0.01% NIA
2015 Audit Fee Report - October 2015
Page 39 of 54
Copyright 2015 Financial Executives Research Foundation (FERF) www.ferf.org. No part may be reprinted or distributed without prior written approval from FERF.
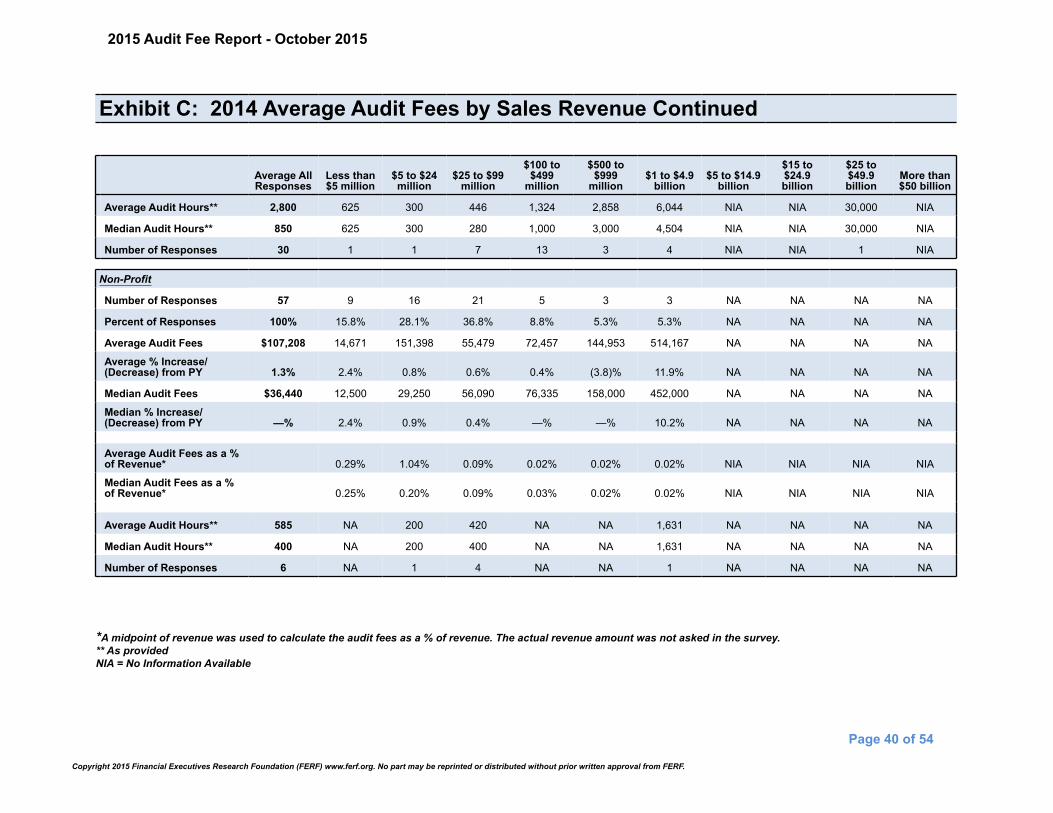
*A midpoint of revenue was used to calculate the audit fees as a % of revenue. The actual revenue amount was not asked in the survey. ** As providedNIA = No Information Available
Exhibit C: 2014 Average Audit Fees by Sales Revenue Continued
Average AllResponses
Less than$5 million
$5 to $24million
$25 to $99million
$100 to$499
million
$500 to$999
million$1 to $4.9
billion$5 to $14.9
billion
$15 to$24.9billion
$25 to$49.9billion
More than$50 billion
Average Audit Hours** 2,800 625 300 446 1,324 2,858 6,044 NIA NIA 30,000 NIA
Median Audit Hours** 850 625 300 280 1,000 3,000 4,504 NIA NIA 30,000 NIA
Number of Responses 30 1 1 7 13 3 4 NIA NIA 1 NIA
Non-Profit
Number of Responses 57 9 16 21 5 3 3 NA NA NA NA
Percent of Responses 100% 15.8% 28.1% 36.8% 8.8% 5.3% 5.3% NA NA NA NA
Average Audit Fees $107,208 14,671 151,398 55,479 72,457 144,953 514,167 NA NA NA NA
Average % Increase/(Decrease) from PY 1.3% 2.4% 0.8% 0.6% 0.4% (3.8)% 11.9% NA NA NA NA
Median Audit Fees $36,440 12,500 29,250 56,090 76,335 158,000 452,000 NA NA NA NA
Median % Increase/(Decrease) from PY —% 2.4% 0.9% 0.4% —% —% 10.2% NA NA NA NA
Average Audit Fees as a %of Revenue* 0.29% 1.04% 0.09% 0.02% 0.02% 0.02% NIA NIA NIA NIA
Median Audit Fees as a %of Revenue* 0.25% 0.20% 0.09% 0.03% 0.02% 0.02% NIA NIA NIA NIA
Average Audit Hours** 585 NA 200 420 NA NA 1,631 NA NA NA NA
Median Audit Hours** 400 NA 200 400 NA NA 1,631 NA NA NA NA
Number of Responses 6 NA 1 4 NA NA 1 NA NA NA NA
2015 Audit Fee Report - October 2015
Page 40 of 54
Copyright 2015 Financial Executives Research Foundation (FERF) www.ferf.org. No part may be reprinted or distributed without prior written approval from FERF.
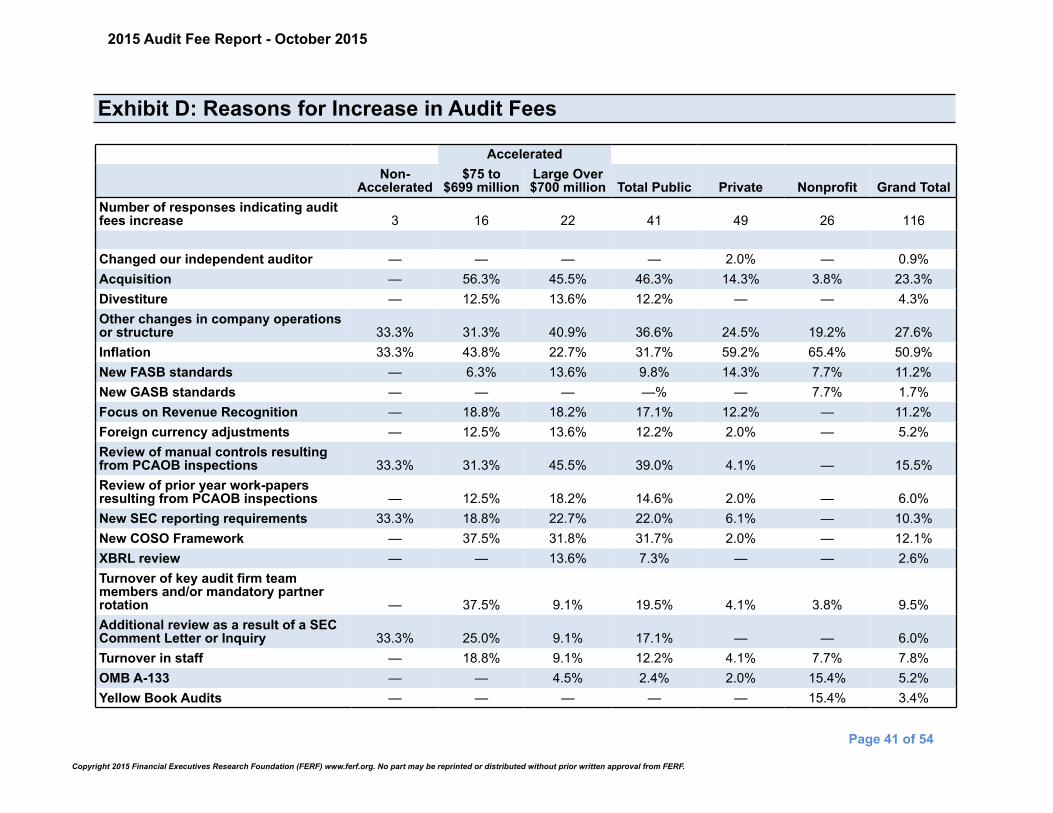
Exhibit D: Reasons for Increase in Audit Fees
AcceleratedNon-
Accelerated$75 to
$699 millionLarge Over$700 million Total Public Private Nonprofit Grand Total
Number of responses indicating auditfees increase 3 16 22 41 49 26 116
Changed our independent auditor — — — — 2.0% — 0.9%Acquisition — 56.3% 45.5% 46.3% 14.3% 3.8% 23.3%Divestiture — 12.5% 13.6% 12.2% — — 4.3%Other changes in company operationsor structure 33.3% 31.3% 40.9% 36.6% 24.5% 19.2% 27.6%Inflation 33.3% 43.8% 22.7% 31.7% 59.2% 65.4% 50.9%New FASB standards — 6.3% 13.6% 9.8% 14.3% 7.7% 11.2%New GASB standards — — — —% — 7.7% 1.7%Focus on Revenue Recognition — 18.8% 18.2% 17.1% 12.2% — 11.2%Foreign currency adjustments — 12.5% 13.6% 12.2% 2.0% — 5.2%Review of manual controls resultingfrom PCAOB inspections 33.3% 31.3% 45.5% 39.0% 4.1% — 15.5%Review of prior year work-papersresulting from PCAOB inspections — 12.5% 18.2% 14.6% 2.0% — 6.0%New SEC reporting requirements 33.3% 18.8% 22.7% 22.0% 6.1% — 10.3%New COSO Framework — 37.5% 31.8% 31.7% 2.0% — 12.1%XBRL review — — 13.6% 7.3% — — 2.6%Turnover of key audit firm teammembers and/or mandatory partnerrotation — 37.5% 9.1% 19.5% 4.1% 3.8% 9.5%Additional review as a result of a SECComment Letter or Inquiry 33.3% 25.0% 9.1% 17.1% — — 6.0%Turnover in staff — 18.8% 9.1% 12.2% 4.1% 7.7% 7.8%OMB A-133 — — 4.5% 2.4% 2.0% 15.4% 5.2%Yellow Book Audits — — — — — 15.4% 3.4%
2015 Audit Fee Report - October 2015
Page 41 of 54
Copyright 2015 Financial Executives Research Foundation (FERF) www.ferf.org. No part may be reprinted or distributed without prior written approval from FERF.

Exhibit E: Centralized vs. Decentralized Operations/Domestic and International Finance Operations
Centralized DecentralizedPublic
Number of Responses 50 26Percent of Responses 65.8% 34.2%Average Audit Fees $6,746,863 $10,851,092Median Audit Fee $1,192,225 $3,674,000
PrivateNumber of Responses 78 14Percent of Responses 84.8% 15.2%Average Audit Fees $231,445 $382,861Median Audit Fee $59,250 $265,000
NonprofitNumber of Responses 55 2Percent of Responses 96.5% 3.5%Average Audit Fees $107,499 $99,350Median Audit Fee $34,250 $99,350
Grand TotalNumber of Responses 183 42Percent of Responses 81.3% 18.7%Average Audit Fees $1,994,306 $6,849,694Median Audit Fee $82,400 $1,410,006
Domestic financeoperations only
Domestic and internationalfinance operations
PublicNumber of Responses 25 51Percent of Responses 32.9% 67.1%Average Audit Fees $1,751,077 $11,222,410Median Audit Fees $755,000 $4,778,020
PrivateNumber of Responses 65 27Percent of Responses 70.7% 29.3%Average Audit Fees $192,199 $220,993Median Audit Fees $46,000 $144,000
NonprofitNumber of Responses 57 —Percent of Responses 100.0% —%Average Audit Fees $107,208 N/AMedian Audit Fees $36,000 N/A
Grand TotalNumber of Responses 147 78Percent of Responses 65.3% 34.7%Average Audit Fees $428,147 $7,520,195Median Audit Fees $57,680 $1,334,654
2015 Audit Fee Report - October 2015
Page 42 of 54
Copyright 2015 Financial Executives Research Foundation (FERF) www.ferf.org. No part may be reprinted or distributed without prior written approval from FERF.

Exhibit F: Primary Audit Firm
AcceleratedNon-
Accelerated$75 to $699
millionLarge Over$700 million Total Public Private Nonprofit Grand Total
Number of Responses 9 23 44 76 92 56 224
PwC — 4 18 22 8 1 31EY 3 8 6 17 6 2 25Deloitte — 3 11 14 5 — 19KPMG — 4 9 13 2 2 17Grant Thornton — 1 — 1 9 — 10BDO — 1 — 1 7 — 8Mayer Hoffman McCann 1 — — 1 4 2 7McGladrey 1 — — 1 5 1 7Crowe Horwath — 1 — 1 4 1 6BKD — — — — 3 2 5Moss Adams — — — — 4 1 5Baker Tilly — — — — 3 2 5EKS&H — — — — 2 1 3Other 4 1 — 5 30 41 76Total 9 23 44 76 92 56 224
2015 Audit Fee Report - October 2015
Page 43 of 54
Copyright 2015 Financial Executives Research Foundation (FERF) www.ferf.org. No part may be reprinted or distributed without prior written approval from FERF.

Exhibit G: Non-Audit Fees
AcceleratedNon-
Accelerated$75 to
$699 millionLarge Over$700 million Total Public Private Nonprofit Grand Total
Audit-Related FeesNumber of Responses 2 11 35 48 48 18 114What was the cost of external auditfees billed for audit-related services?Average $84,867 $145,520 $3,459,333 $2,559,315 $79,389 $166,544 $1,137,330Median $84,867 $43,200 $900,000 $350,821 $25,000 $19,000 $50,950
Pension plan audits — 18.2% 51.4% 41.7% 33.3% 77.8% 43.9%Statutory audits of subsidiaries 50.0% 36.4% 77.1% 66.7% 27.1% 22.2% 43.0%Due diligence and related, eg. M&A — 36.4% 65.7% 56.3% 20.8% 11.1% 34.2%Special accounting or control studies — 27.3% 34.3% 31.3% 20.8% — 21.9%Capital market transactions support — 9.1% 17.1% 14.6% 10.4% — 10.5%Financial statements (annual orquarterly) 100.0% 54.5% 42.9% 47.9% 56.3% 44.4% 50.9%SEC filings 100.0% 63.6% 42.9% 50.0% —% — 21.1%Comfort letters — — 14.3% 10.4% 12.5% — 9.6%Agreed-upon procedures — 9.1% 25.7% 20.8% 31.3% 16.7% 24.6%XBRL Review — 9.1% 5.7% 6.3% — — 2.6%OMB - A-133 Single Audits — — — — — 55.6% 8.8%Other — — 17.1% 12.5% 12.5% 22.2% 14.0%
Tax FeesNumber of Responses 4 15 40 59 83 25 167What is the annual cost for otherservices?Average $49,223 $213,259 $1,271,581 $934,651 $87,150 $27,365 $374,261Median $51,168 $101,259 $380,989 $219,500 $35,000 $5,000 $57,500
2015 Audit Fee Report - October 2015
Page 44 of 54
Copyright 2015 Financial Executives Research Foundation (FERF) www.ferf.org. No part may be reprinted or distributed without prior written approval from FERF.
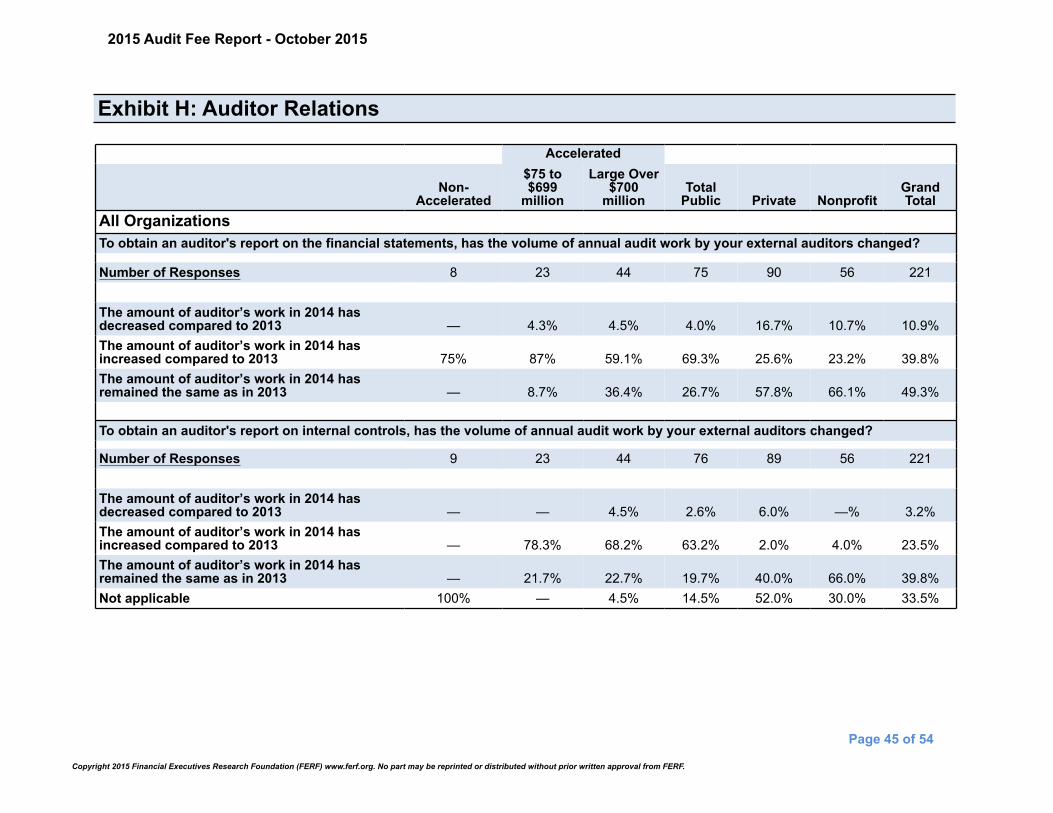
Exhibit H: Auditor Relations
Accelerated
Non-Accelerated
$75 to $699
million
Large Over$700
millionTotal
Public Private NonprofitGrandTotal
All OrganizationsTo obtain an auditor's report on the financial statements, has the volume of annual audit work by your external auditors changed?
Number of Responses 8 23 44 75 90 56 221
The amount of auditor’s work in 2014 hasdecreased compared to 2013 — 4.3% 4.5% 4.0% 16.7% 10.7% 10.9%The amount of auditor’s work in 2014 hasincreased compared to 2013 75% 87% 59.1% 69.3% 25.6% 23.2% 39.8%The amount of auditor’s work in 2014 hasremained the same as in 2013 — 8.7% 36.4% 26.7% 57.8% 66.1% 49.3%
To obtain an auditor's report on internal controls, has the volume of annual audit work by your external auditors changed?
Number of Responses 9 23 44 76 89 56 221
The amount of auditor’s work in 2014 hasdecreased compared to 2013 — — 4.5% 2.6% 6.0% —% 3.2%The amount of auditor’s work in 2014 hasincreased compared to 2013 — 78.3% 68.2% 63.2% 2.0% 4.0% 23.5%The amount of auditor’s work in 2014 hasremained the same as in 2013 — 21.7% 22.7% 19.7% 40.0% 66.0% 39.8%Not applicable 100% — 4.5% 14.5% 52.0% 30.0% 33.5%
2015 Audit Fee Report - October 2015
Page 45 of 54
Copyright 2015 Financial Executives Research Foundation (FERF) www.ferf.org. No part may be reprinted or distributed without prior written approval from FERF.

Exhibit I: Public Company Internal ControlsAccelerated
Non-Accelerated
$75 to $699 million
Large Over $700 million Total Public
Did your Company update to the 2013 COSO Framework for the most recent year-end?Number of Responses 9 22 43 74Yes 33.3% 68.2% 76.7% 67.6%No, but we plan to complete by year end 55.6% 27.3% 23.3% 29.7%No, but we have a target to complete by6/30/2016 11.1% 4.5% — 2.7%
Who performs your Sarbanes-Oxley 404 testing?Number of Responses 9 22 44 75Performed by finance / controllers resources 55.6% 18.2% 25% 26.7%Performed by internal audit 33.3% 63.6% 54.5% 54.7%Performed by management (decentralized) —% 9.1% 13.6% 10.7%Outsourced 11.1% 9.1% 6.8% 8%
Has your company experienced an increase/decrease in its internal costs of compliance withSarbanes-Oxley Section 404 within the past three years?Number of Responses 8 23 44 75Increase 50% 73.9% 52.3% 58.7%Decrease — — 13.6% 8%No Change 50% 26.1% 34.1% 33.3%
Reasons for increase included: (entities were allowed to select all that applied)Number of Responses 10 37 59 106Regulatory requirements (e.g. COSO 2013) 40% 24.3% 32.2% 30.2%Growth of organization/Growth of staff 10% 18.9% 20.3% 18.9%PCAOB inspection findings/related issues 10% 16.2% 16.9% 16%The company has completed a largeacquisition with additional systems 10% 10.8% 11.9% 11.3%The company has implemented a new ITsystem 10% 10.8% 8.5% 9.4%The company experienced a materialweakness or significant deficiency requiringadditional SOX testing — 8.1% 1.7% 3.8%Cybersecurity threats — 2.7% 3.4% 2.8%Other 20% 8.1% 5.1% 7.5%
How would you best describe your company´s compliance with Section 404?Number of Responses 8 23 44 75Better internal control, worth the addedexpense 12.5% 43.5% 52.3% 45.3%Better internal control, but not worth theadded expense 25% 39.1% 40.9% 38.7%No increase in internal control 37.5% 13% 2.3% 9.3%Cost of compliance far exceeds anyadditional internal control 25% 4.3% 4.5% 6.7%
2015 Audit Fee Report - October 2015
Page 46 of 54
Copyright 2015 Financial Executives Research Foundation (FERF) www.ferf.org. No part may be reprinted or distributed without prior written approval from FERF.

Exhibit J: 2014 Audit Committee Questions
AcceleratedNon-
Accelerated$75 to
$699 millionLarge Over$700 million Total Public Private Nonprofit Grand Total
How many times per year does your Audit Committee meet on earnings and quarterly filings?Number of Responses 9 23 43 75 N/A N/A 75Less than Four 44.4% 56.5% 32.6% 41.3% N/A N/A 41.3%Six 33.3% 21.7% 32.6% 29.3% N/A N/A 29.3%Eight 22.2% 17.4% 25.6% 22.7% N/A N/A 22.7%Ten —% 4.3% 2.3% 2.7% N/A N/A 2.7%More than Ten —% —% 7.0% 4.0% N/A N/A 4.0%
How is your internal audit function performed?Number of Responses 9 23 44 76 92 57 225Mix of internal and outsourcedresources 22.2% 34.8% 11.4% 19.7% 5.4% 5.3% 10.2%No internal audit function 44.4% 8.7% —% 7.9% 64.1% 52.6% 42.2%Outsourced resources —% 4.3% 6.8% 5.3% 4.3% 5.3% 4.9%Separate department 11.1% 43.5% 79.5% 60.5% 13% 8.8% 28%Shared internal responsibilities 22.2% 8.7% 2.3% 6.6% 13.0% 28.1% 14.7%
2015 Audit Fee Report - October 2015
Page 47 of 54
Copyright 2015 Financial Executives Research Foundation (FERF) www.ferf.org. No part may be reprinted or distributed without prior written approval from FERF.
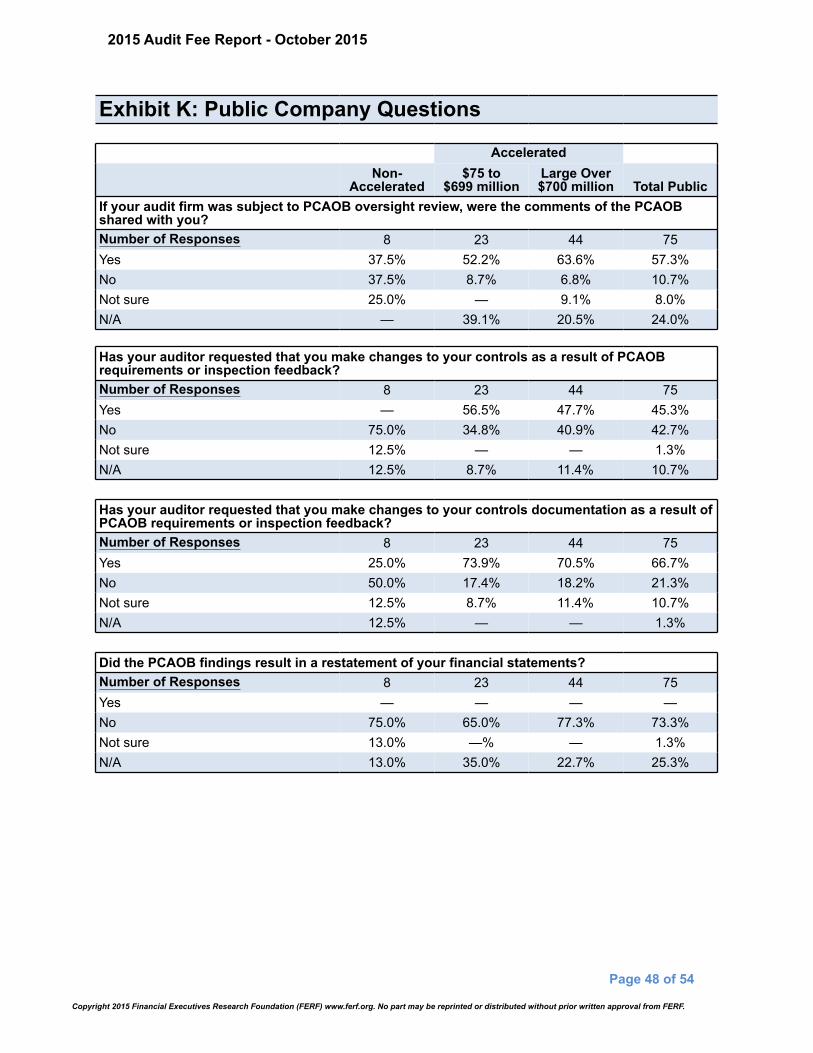
Exhibit K: Public Company Questions
AcceleratedNon-
Accelerated$75 to
$699 millionLarge Over $700 million Total Public
If your audit firm was subject to PCAOB oversight review, were the comments of the PCAOBshared with you?Number of Responses 8 23 44 75Yes 37.5% 52.2% 63.6% 57.3%No 37.5% 8.7% 6.8% 10.7%Not sure 25.0% — 9.1% 8.0%N/A — 39.1% 20.5% 24.0%
Has your auditor requested that you make changes to your controls as a result of PCAOBrequirements or inspection feedback?Number of Responses 8 23 44 75Yes — 56.5% 47.7% 45.3%No 75.0% 34.8% 40.9% 42.7%Not sure 12.5% — — 1.3%N/A 12.5% 8.7% 11.4% 10.7%
Has your auditor requested that you make changes to your controls documentation as a result ofPCAOB requirements or inspection feedback? Number of Responses 8 23 44 75Yes 25.0% 73.9% 70.5% 66.7%No 50.0% 17.4% 18.2% 21.3%Not sure 12.5% 8.7% 11.4% 10.7%N/A 12.5% — — 1.3%
Did the PCAOB findings result in a restatement of your financial statements? Number of Responses 8 23 44 75Yes — — — —No 75.0% 65.0% 77.3% 73.3%Not sure 13.0% —% — 1.3%N/A 13.0% 35.0% 22.7% 25.3%
2015 Audit Fee Report - October 2015
Page 48 of 54
Copyright 2015 Financial Executives Research Foundation (FERF) www.ferf.org. No part may be reprinted or distributed without prior written approval from FERF.

Exhibit K: Public Company Questions Continued
AcceleratedNon-
Accelerated$75 to
$699 millionLarge Over $700 million Total Public
Did the PCAOB findings result to a change in auditor’s opinion?Number of Responses 8 23 44 75Yes — — — —No 75.0% 65.2% 75.0% 72.0%Not sure 12.5% — — 1.3%N/A 12.5% 34.8% 25.0% 26.7%
Our external auditors decreased their reliance on work performed by internal audit staff becauseof the PCAOB inspections.Number of Responses 7 23 44 74Agree 28.6% 26.1% 9.1% 16.2%Disagree — 13.0% 27.3% 20.3%Neutral 71.4% 26.1% 40.9% 39.2%Strongly agree — 13.0% 13.6% 12.2%Strongly disagree — 21.7% 9.1% 12.2%
2015 Audit Fee Report - October 2015
Page 49 of 54
Copyright 2015 Financial Executives Research Foundation (FERF) www.ferf.org. No part may be reprinted or distributed without prior written approval from FERF.

Exhibit L: Audit Fees Percentage Change Distribution - Three year analysis (allfilers)
2011-2012 Audit Fee % Change Distribution
1,200
1,000
800
600
400
200
0
Cou
nt
(97)% (79)% (61)% (43)% (25)% (7)% 11% 29% 47% 65% 83% >100%
2011-2012 Audit Fee % Change
2015 Audit Fee Report - October 2015
Page 50 of 54
Copyright 2015 Financial Executives Research Foundation (FERF) www.ferf.org. No part may be reprinted or distributed without prior written approval from FERF.

Exhibit L: Audit Fees Percentage Change Distribution - Three year analysis (allfilers) Continued
2012-2013 Audit Fee % Change
1,000
800
600
400
200
0
Cou
nt
(97)% (79)% (61)% (43)% (25)% (7)% 11% 29% 47% 65% 83% >100%
Percent Change
2015 Audit Fee Report - October 2015
Page 51 of 54
Copyright 2015 Financial Executives Research Foundation (FERF) www.ferf.org. No part may be reprinted or distributed without prior written approval from FERF.

Exhibit L: Audit Fees Percentage Change Distribution - Three year analysis (allfilers) Continued
2013-2014 Audit Fee % Change Distribution
1,000
800
600
400
200
0
Cou
nt
(97)% (79)% (61)% (43)% (25)% (7)% 11% 29% 47% 65% 83% >100%
Percent Change
2015 Audit Fee Report - October 2015
Page 52 of 54
Copyright 2015 Financial Executives Research Foundation (FERF) www.ferf.org. No part may be reprinted or distributed without prior written approval from FERF.
About WorkivaWorkiva (NYSE:WK) created Wdesk, a cloud-based productivity platform for enterprises to collect, link,report, and analyze business data with control and accountability. Thousands of organizations, includingover 65% of the Fortune 500, use Wdesk for risk, compliance, or management reporting. Wdeskproprietary word processing, spreadsheet, and presentation applications are integrated and built upon adata management engine offering synchronized data, controlled collaboration, granular permissions, anda full audit trail. Wdesk helps to mitigate enterprise risk, improve productivity, and give users confidenceto make decisions with real-time data. Workiva employs more than 950 people with offices in 15 cities.The company is headquartered in Ames, Iowa. For more information, visit workiva.com.
About MyLogIQMyLogIQ started innovating on Big-Data & analysis more than a decade ago, under its former nameLogixData. Offering solution for analyzing public company SEC filings as well as reporting and regulatorytrends. Customers access our intelligent databases through our Software-As-A-Service: SECAnalyzer™or Data-As-A-Service: CompanyIQ™
MyLogIQ solutions are used by External Reporting Teams of Public companies, Big 5 Auditing Firms, LawFirms, Academia and Regulatory body. Users can subscribe to any or all of the following intelligentdatabases:
* Disclosure Research and Benchmarking* SEC Comment Letters and Responses* Audit Fees and SOX Analysis* Corporate Governance Analysis* Executive and Director Compensation Analysis* Financial Analysis* XBRL Liability Analysis* Ownership and Activist Investors
For more details visit us at www.mylogiq.com or email [email protected]
2015 Audit Fee Report - October 2015
Page 53 of 54
Copyright 2015 Financial Executives Research Foundation (FERF) www.ferf.org. No part may be reprinted or distributed without prior written approval from FERF.

About Financial Executives Research Foundation (FERF)
Financial Executives Research Foundation is the nonprofit 501(c) (3) research affiliate of Financial Executives International (FEI). FERF researchers identify key financial issues and develop impartial, timely research reports for FEI members and non-members alike, in a variety of publication formats. FERF relies primarily on voluntary tax-deductible contributions from corporations and individuals. Questions about FERF can be directed [email protected]. The views set forth in this publication are those of the author and do not necessarily represent those of the FERF Board as a whole, individual trustees, employees, or the members of the Research Committee. FERF shall be held harmless against any claims, demands, suits, damages, injuries, costs, or expenses of any kind or nature whatsoever except such liabilities as may result solely from misconduct or improper performance by the Foundation or any of its representatives. FERF publications can be ordered by logging onto http://www.ferf.org.
Copyright © 2015 by Financial Executives Research Foundation, Inc.All rights reserved. No part of this publication may be reproduced in any form or by any means without written permission from the publisher.
International Standard Book Number 978-1-61509-192-8Printed in the United States of AmericaFirst Printing
Authorization to photocopy items for internal or personal use, or the internal or personal use ofspecific clients, is granted by Financial Executives Research Foundation, Inc. provided that anappropriate fee is paid to Copyright Clearance Center, 222 Rosewood Drive, Danvers, MA01923. Fee inquiries can be directed to Copyright Clearance Center at (978) 750-8400. Forfurther information, please check Copyright Clearance Center online at http://www.copyright.com.
Cover art: ©Korovin/iStock/Thinkstock
2015 Audit Fee Report - October 2015
Page 54 of 54
Copyright 2015 Financial Executives Research Foundation (FERF) www.ferf.org. No part may be reprinted or distributed without prior written approval from FERF.

Financial Executives Research Foundation (FERF) gratefully acknowledges these companies for their support and generosity in FY2015
PLATINUM MAJOR GIFT | $50,000 +Exxon Mobil Corporation Microsoft Corporation
GOLD PRESIDENT’S CIRCLE | $10,000 - $14,999Cisco Systems, Inc.
Dow Chemical CompanyGeneral Electric Co
Wells Fargo & Company
SILVER PRESIDENT’S CIRCLE | $5,000 - $9,999Accenture LLP Johnson & Johnson
Apple, Inc. Lockheed Martin Corp.The Boeing Company McDonald’s CorporationComcast Corporation Medtronic, Inc.Corning Incorporated MetLife
Cummins Inc PepsiCo, Inc.Dell, Inc. Pfizer Inc.DuPont Procter & Gamble Co.
Eli Lilly and Company TennecoGM Foundation Tyco International Mgmnt Co.
Halliburton Wal-Mart Stores, IncIBM Corporation
GOLD CORPORATE LEADERSHIP - $2,500 - $4,999Aetna, Inc Select Medical Corp.
Intel Corporation Time Warner, Inc.Raytheon, Inc. The Walt Disney Company
SILVER CORPORATE LEADERSHIP - $1,000 - $2,499American Financial Group, Inc. McCormick & Company, Inc.
Barnes Group, Inc. OMNOVA Solutions, Inc.Edward Jones Paychex
Graham Holdings Scripps Networks Interactive, Inc.J.M. Smucker Company Trinity Industries, Inc.
2015 Audit Fee Report - October 2015
Page 55 of 54
Copyright 2015 Financial Executives Research Foundation (FERF) www.ferf.org. No part may be reprinted or distributed without prior written approval from FERF.