
Spm Pert&Cpm Part1
27
Strategic Project Management 1 SPM Basic PERT/CPM (Part 1) A Look Ahead We will now turn our attention to several tools and techniques associated with Project Time Management First, we will consider: PERT & CPM Historical Perspective Overview of Sequencing Techniques ADM: Arrow Diagramming Method Determining the Critical Path • download ADM_Class_Example.doc
description
Very, very important stuff about PERT, SPM, CPM. Explains very well how the diagrams really work.
Transcript of Spm Pert&Cpm Part1

Strategic Project Management 1SPM Basic PERT/CPM (Part 1)
A Look Ahead
We will now turn our attention to several tools and techniques associated with Project Time Management
First, we will consider: PERT & CPM Historical Perspective Overview of Sequencing Techniques ADM: Arrow Diagramming Method Determining the Critical Path
• download ADM_Class_Example.doc
Strategic Project Management 2SPM Basic PERT/CPM (Part 1)
A Look Ahead(continued)
After that, we will continue our exploration of tools and techniques by considering: The Concept of Float
download ADM_Float_Calcs.xls Probabilistic Activity Duration Estimates
download ADM_Mean_Variance.xls Probabilistic Project Completion
download ADM_Standard_Normal_Table.xls

Strategic Project Management 3SPM Basic PERT/CPM (Part 1)
PERT/CPMSome History
PERT was first used in the late 1950’s by the Navy for the Polaris Missile Program
PERT => Project Evaluation & Review Technique
Development was in conjunction with the consulting firm of Booz, Allen, and Hamilton
Development was designed to meet the needs of the “age of massive engineering”
The Navy was concerned with performance trends on large military projects.

Strategic Project Management 4SPM Basic PERT/CPM (Part 1)
PERT/CPMSome History (continued)
Virtually simultaneously CPM was developed by the duPont Company and Remington-Rand-Univac.
CPM => Critical Path Method For use on large construction projects Specifically targeted for process industries
The two groups were unaware of each other's existence until about 1960. By then, each stood on its own merits
Strategic Project Management 5SPM Basic PERT/CPM (Part 1)
PERT/CPMSome History (continued)
PERT’s strengths are in its use of probabilistic estimates of activity durations
CPM’s strengths are in its ability to do “time-cost trade-offs”
Today, PERT/CPM are widely recognized as comprising one set of techniques the differences are primarily viewed as only
of historical importance
Strategic Project Management 6SPM Basic PERT/CPM (Part 1)
Activity SequencingDisplay Techniques
There are many suitable techniques for displaying the sequence of activities involved in a project Gantt Charts Precedence Diagramming Arrow Diagramming Conditional Diagrams

Strategic Project Management 7SPM Basic PERT/CPM (Part 1)
Gantt Charts
Gantt charts use horizontal bars (or lines) to represent activities Gantt charts are more commonly used for
schedule display than activity sequencingsee BOK Figure 6-6 (1996 & 2000) for an examplelength of the bars show expected durationactivity inter-relationships are not explicitly shown
we will see Gantt Charts again when we consider Resource Loading & Leveling
Strategic Project Management 8SPM Basic PERT/CPM (Part 1)
The Precedence Diagramming Method
The Precedence Diagramming Method (PDM) uses boxes to represent activities and arrows to represent dependencies see BOK Figure 6-2 (1996 & 2000 for an
exampleThis technique is also known as the
Activity-on-Node (AON) Diagramming
Strategic Project Management 9SPM Basic PERT/CPM (Part 1)
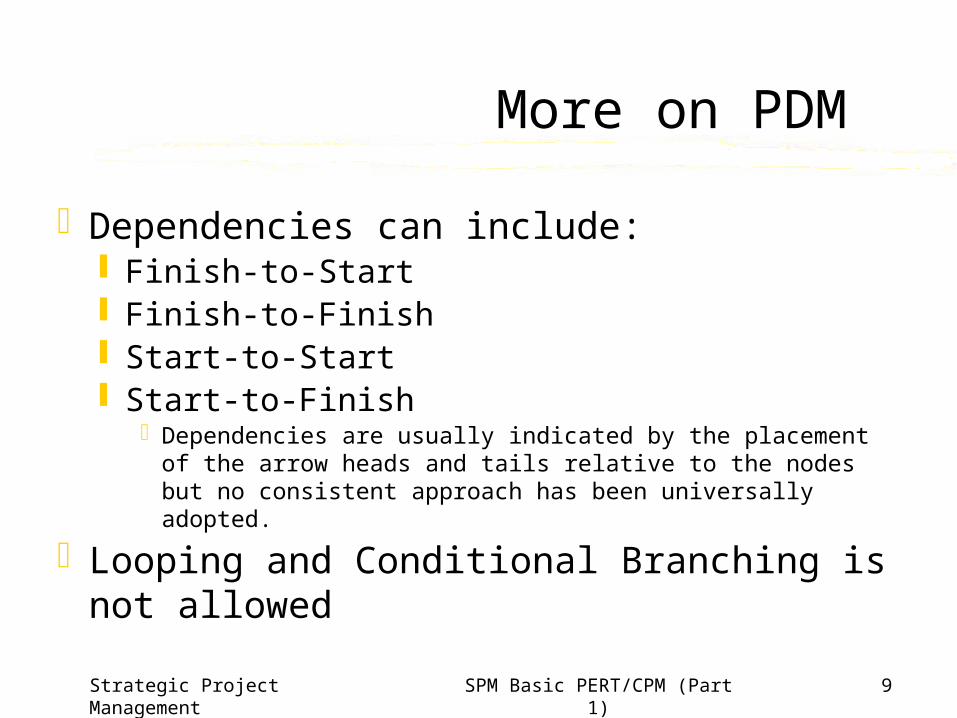
More on PDM
Dependencies can include: Finish-to-Start Finish-to-Finish Start-to-Start Start-to-Finish
Dependencies are usually indicated by the placement of the arrow heads and tails relative to the nodes but no consistent approach has been universally adopted.
Looping and Conditional Branching is not allowed

Strategic Project Management 10SPM Basic PERT/CPM (Part 1)
The Arrow Diagramming Method (ADM)
The Arrow Diagramming Method (ADM) uses the following conventions: Arrows represent activities
"Regular" activities require time and resources"Dummy" activities show precedence relationships
Nodes represent eventsA point in timeSome nodes may represent milestone events
see BOK Figure 6-3 (1996 & 2000) for an example

Strategic Project Management 11SPM Basic PERT/CPM (Part 1)
More on ADM
Also known as Activity-on-Arrow (AOA)Each activity is represented by one and
only one arrow in the network.Nodes (events) are numbered uniquely.
Duplicate node numbers are not allowedNo two activities can be identified by
the same beginning and ending nodes. Dummy activities may be required

Strategic Project Management 12SPM Basic PERT/CPM (Part 1)
More on ADM (continued)
Before an activity can begin, all activities terminating at the activities beginning node must be completed.
Neither the length of an activity arrow nor its “compass” direction have any significance.
Networks should (must) have only one initial event and one terminal event.

Strategic Project Management 13SPM Basic PERT/CPM (Part 1)
An Example to Try:Draw an Arrow Diagram
A project consists of Activities A, B, C, D, E, F, G, H, I, J, K, and LA, B, and C, the 1st activities of the project,
can start simultaneouslyA and B precede DB precedes E, F, and HF and C precede GE and H precede I and JC, D, F, and J precede KK precedes LI, G, and L are terminal activities for the project

Strategic Project Management 14SPM Basic PERT/CPM (Part 1)
Let’s Examine the Example Solution
Solution to be shown in class.
Strategic Project Management 15SPM Basic PERT/CPM (Part 1)
Conclusion of Sequencing Techniques
We’ll return to ADM in just a few minutes but first let’s complete the set of sequencing techniques by considering Conditional Diagramming

Strategic Project Management 16SPM Basic PERT/CPM (Part 1)
Conditional Diagramming
Conditional Diagramming methods allow for probabilistic activities and looping neither of these are allowed in traditional PDM
or ADMConditional diagramming techniques
include Graphical Evaluation and Review Technique (GERT) and System Dynamics these are beyond the scope of this course
Strategic Project Management 17SPM Basic PERT/CPM (Part 1)
Activity Durations
The next logical step in Project Time Management is to determine activity durations.
We are going to defer a detailed discussion of estimating activity durations until later in the course.
At this point we need to introduce the concept of the Critical Path of a project.

Strategic Project Management 18SPM Basic PERT/CPM (Part 1)
The Concept of the Critical Path
The determination of the start and completion time of each activity on the network diagram requires a special calculation procedure.
This approach classifies each activity as either critical or non-critical. The approach is commonly known as
the Critical Path Method
Strategic Project Management 19SPM Basic PERT/CPM (Part 1)
The Concept of the Critical Path (continued)
A delay in the start or completion of a critical path activity will cause a delay in the completion of the entire project.
Non-critical path activities can absorb some delay in start or completion without impacting project completion. The amount of delay which can be
absorbed is known as slack or float.

Strategic Project Management 20SPM Basic PERT/CPM (Part 1)
The Concept of the Critical Path (continued)
There will always be at least one sequence of activities from the initial node to the terminal node that is made up entirely of critical activities.
This is known as the Critical Path of the Project.
Any delay of a critical path activity will delay the completion of the project.

Strategic Project Management 21SPM Basic PERT/CPM (Part 1)
The Concept of the Critical Path (continued)
The critical path defines the minimal completion time for the project.
Multiple critical paths are possible. Complete multiple critical paths
two or more critical paths exist from the initial node to the terminal node of the project.
• rare in uncrashed networks, common in fully crashed Partial multiple critical paths
two or more sets of parallel activities are critical over some segment of the project.
• relatively common
Strategic Project Management 22SPM Basic PERT/CPM (Part 1)
Determining the Critical Path
The critical path is found by a two phase methodology after activity durations have been determined. A “forward pass” is made through the
network diagram to determine the earliest start time for each node.
A “backward pass” is made through the network to determine the latest completion time for each node.

Strategic Project Management 23SPM Basic PERT/CPM (Part 1)
Determining the Critical Path (continued)
This is best illustrated through an example. Mathematical details in SPM_PERT&CPM_Math
An ADM diagram for a project is shown on the following page the activities themselves are not labeled, we
will use the (start node, end node) pair to uniquely identify activities (e.g., (0,1))
duration estimates are indicated

Strategic Project Management 24SPM Basic PERT/CPM (Part 1)
Class ExampleCritical Path Calculations
0
2
1
4
3
5 6
3
2
2
3
2
23
57
6

Strategic Project Management 25SPM Basic PERT/CPM (Part 1)
Forward Pass and Backward Pass
Solution to be shown in class.
Strategic Project Management 26SPM Basic PERT/CPM (Part 1)
The Critical Path
An activity lies on the critical path if it meets the three following conditions: The earliest start and latest completion
for the activity’s terminal node are equal; The earliest start and latest completion
for the activity’s initial node are equal; The difference between the earliest start
of the terminal node and the earliest start of the initial node is the activity duration.

Strategic Project Management 27SPM Basic PERT/CPM (Part 1)
The Critical Path(continued)
Let’s re-examine the example for the critical path.
Solution to be shown in class.


