Splash Screen - Edl€¦ · the desire, willingness, and ability to buy a good or service, and...
130
Transcript of Splash Screen - Edl€¦ · the desire, willingness, and ability to buy a good or service, and...

Splash Screen

Chapter Menu
Chapter Introduction
Section 1: Demand
Section 2: Factors Affecting Demand
Section 3: Supply and the Supply Curve
Section 4: Demand and Supply at Work
Visual Summary
Chapter Intro 1
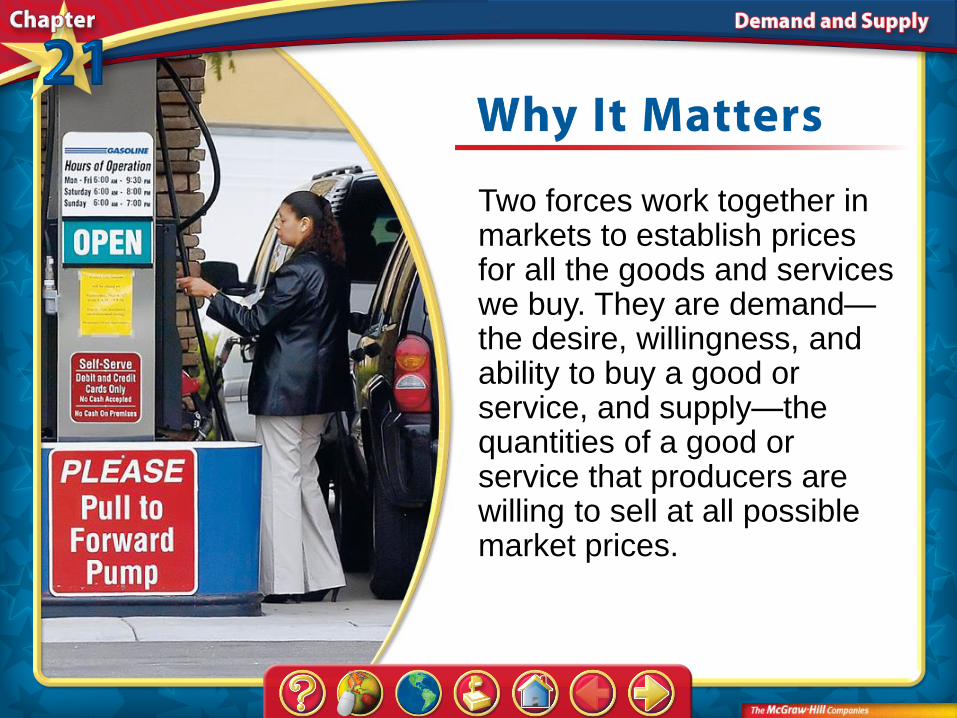
Two forces work together in markets to establish prices for all the goods and services we buy. They are demand— the desire, willingness, and ability to buy a good or service, and supply—the quantities of a good or service that producers are willing to sell at all possible market prices.

Chapter Intro 2
Section 1: Demand
Supply and demand in a market interact to determine price and the quantities bought and sold. Demand is the desire, willingness, and ability to buy a good or service.

Chapter Intro 2
Section 2: Factors Affecting Demand
Supply and demand in a market interact to determine price and the quantities bought and sold. Several factors can cause market demand for a product or service to change.
Chapter Intro 2
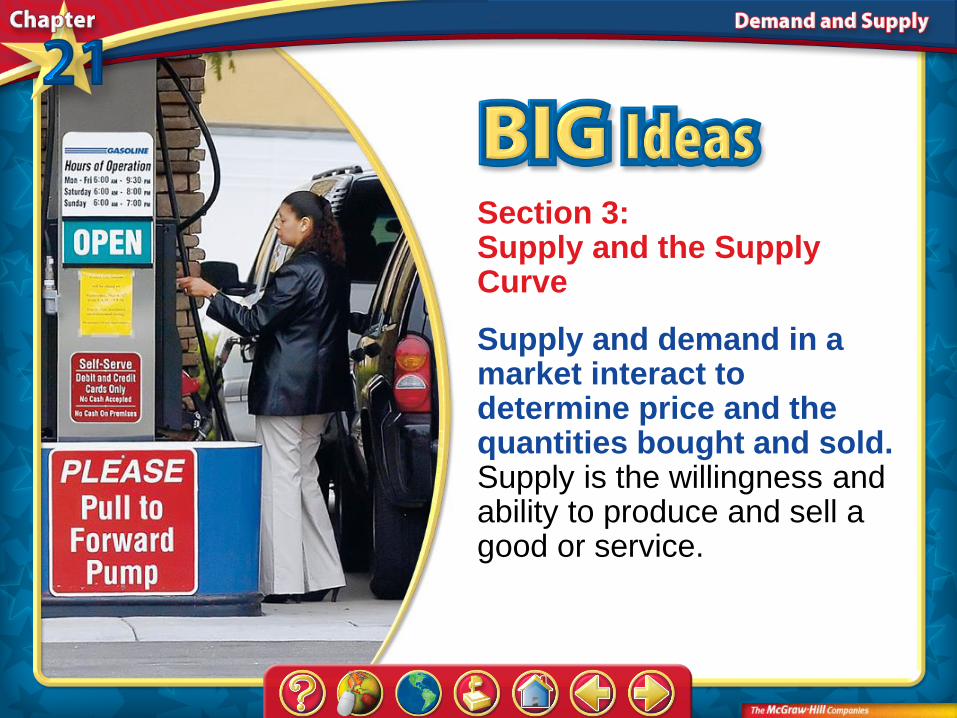
Section 3: Supply and the Supply Curve
Supply and demand in a market interact to determine price and the quantities bought and sold. Supply is the willingness and ability to produce and sell a good or service.

Chapter Intro 2
Section 4: Demand and Supply at Work
Supply and demand in a market interact to determine price and the quantities bought and sold. In our economy, the forces of supply and demand work together to establish prices.

Section 1-Main Idea
Guide to Reading
Big Idea
Supply and demand in a market interact to determine price and quantities bought and sold.
Section 1-Key Terms
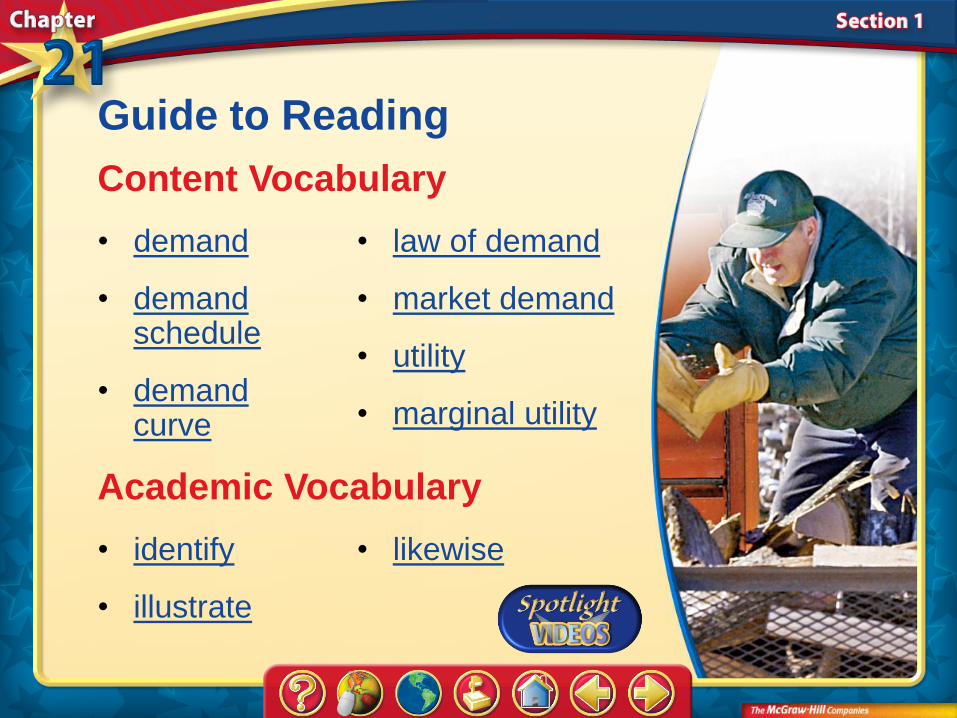
Guide to Reading
Content Vocabulary
• demand
• demand schedule
• demand curve
• law of demand
• market demand
• utility
• marginal utility
Academic Vocabulary
• identify
• illustrate
• likewise
A. A
B. B
Section 1-Polling Question
Have you ever bought something just because it was cheap?
A. Yes
B. No
A B
0%0%

Section 1
An Introduction to Demand
Demand is the desire, willingness, and ability to buy a good or service.
Section 1
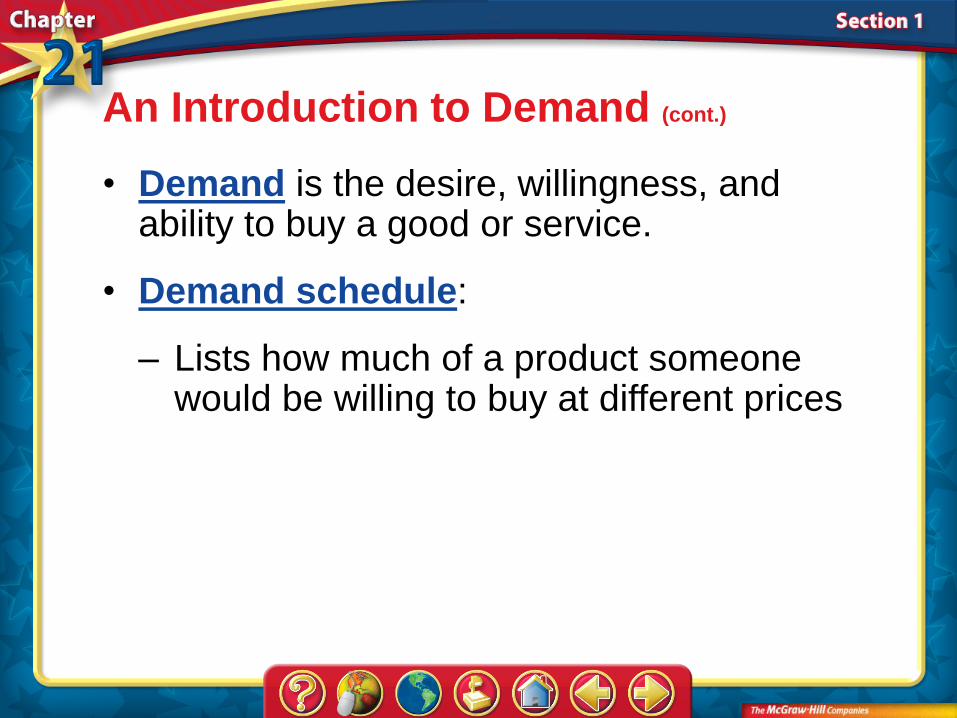
An Introduction to Demand (cont.)
• Demand is the desire, willingness, and ability to buy a good or service.
• Demand schedule:
– Lists how much of a product someone would be willing to buy at different prices
Section 1
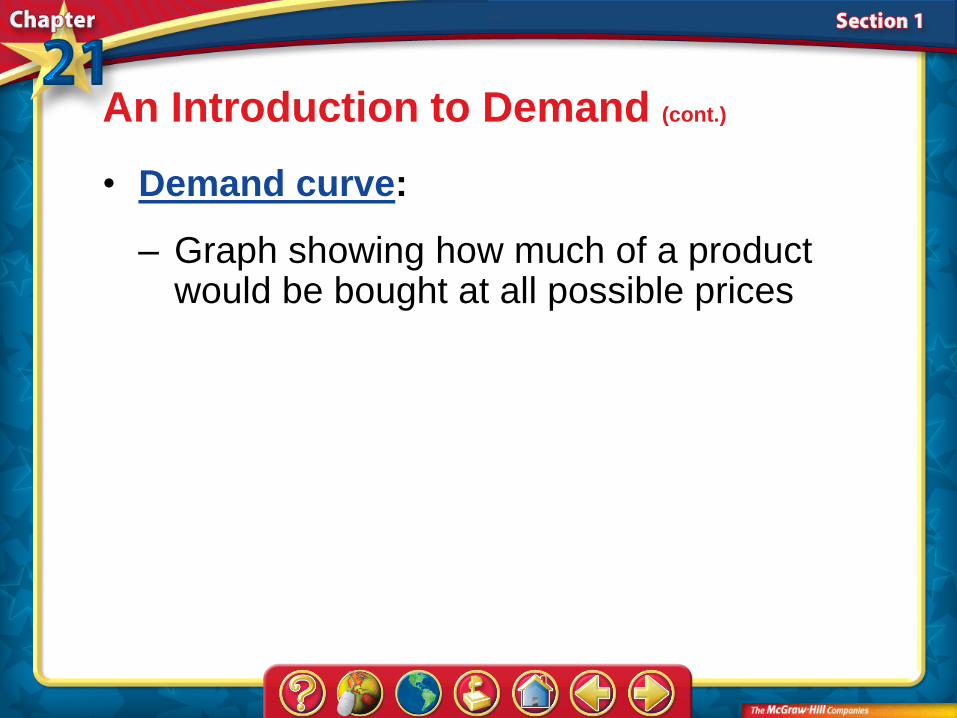
An Introduction to Demand (cont.)
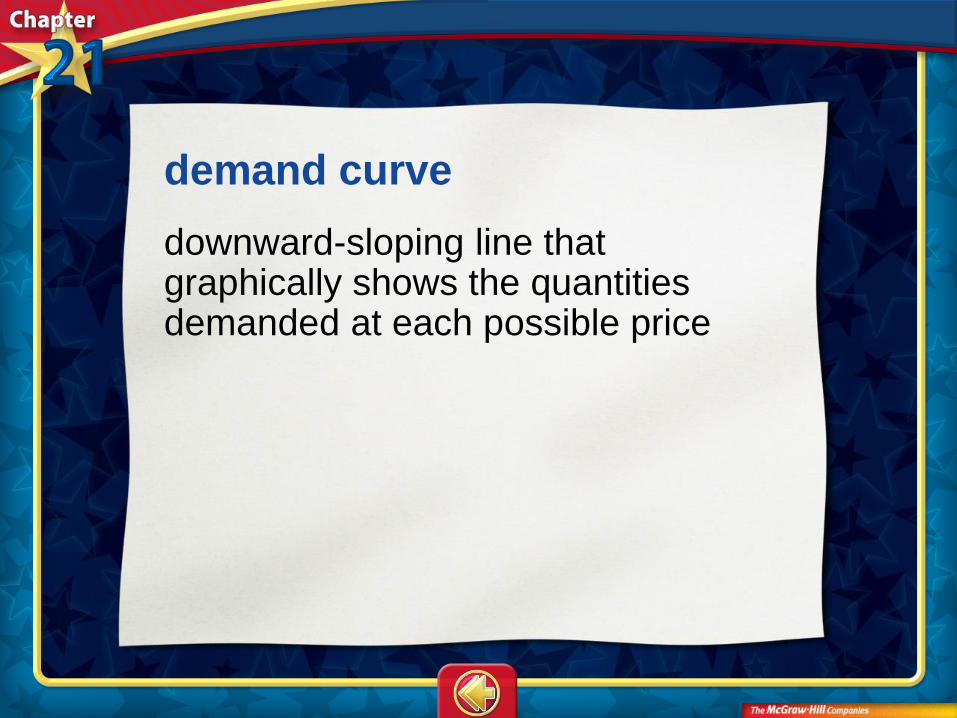
• Demand curve:
– Graph showing how much of a product would be bought at all possible prices

Section 1
• The law of demand
– Quantity demanded and price move in opposite directions
– A common sense approach to demand
An Introduction to Demand (cont.)

A. A
B. B
Section 1
Do you agree that people often wish to buy things that they are unable to purchase?
A. Agree
B. Disagree
A B
0%0%

Section 1
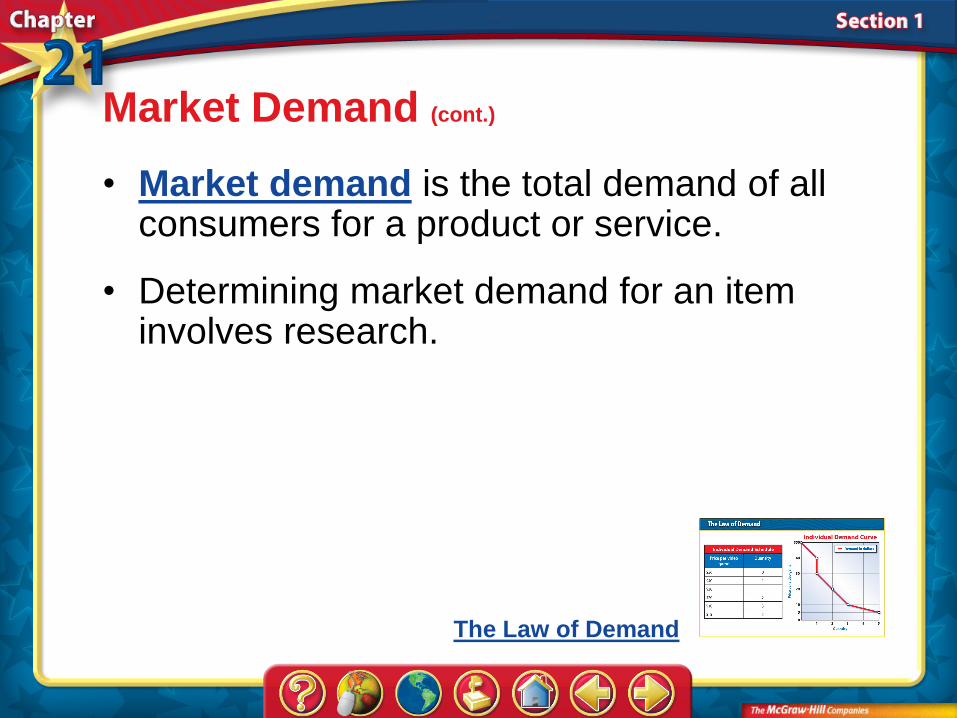
Market Demand
Market demand is the total demand of all consumers for a product or service.
Section 1
Market Demand (cont.)
• Market demand is the total demand of all consumers for a product or service.
• Determining market demand for an item involves research.
The Law of Demand

Section 1
Market Demand (cont.)
• Utility:
– The pleasure a product provides
– Not all objects have utility for all people

Section 1
• Diminishing marginal utility—product pleasure decreases with increased consumption
• Explains why prices fall as consumers buy more of an item.
Market Demand (cont.)
A. A
B. B
Section 1
Do you think you would be willing to pay the same amount for a second copy of an item?
A. Yes
B. No
A B
0%0%
Section 2-Main Idea
Guide to Reading
Big Idea
Supply and demand in a market interact to determine price and the quantities bought and sold.

Section 2-Key Terms
Guide to Reading
Content Vocabulary
• substitute
• complement
• demand elasticity
Academic Vocabulary
• immigration
• phenomenon

A. A
B. B
Section 2-Polling Question
Do you think that people should wait a certain period of time before making a large purchase?
A. Yes
B. No
A B
0%0%

Section 2
Changes in Demand
Several different factors can cause market demand for a good or service to change.

Section 2
Changes in Demand (cont.)
• Demand changes over time due to many forces.
• Changes in demand:
– More consumers enter the market
– Incomes, tastes, and expectations change
– Prices of related goods change
– Can be shown with market demand curve
Section 2
• Changes in population:
– More consumers means higher demand
– Fewer consumers means lower demand
– Can be affected by immigration
– May also be affected by birth and death rates or migration to other areas
Changes in Demand (cont.)
Section 2
• Changes in income:
– High wages give people more money to spend
– Low wages give people less money to spend
Changes in Demand (cont.)
Section 2
• Changes in taste:
– Advertising boost
– Popularity fades over time
Changes in Demand (cont.)
Section 2
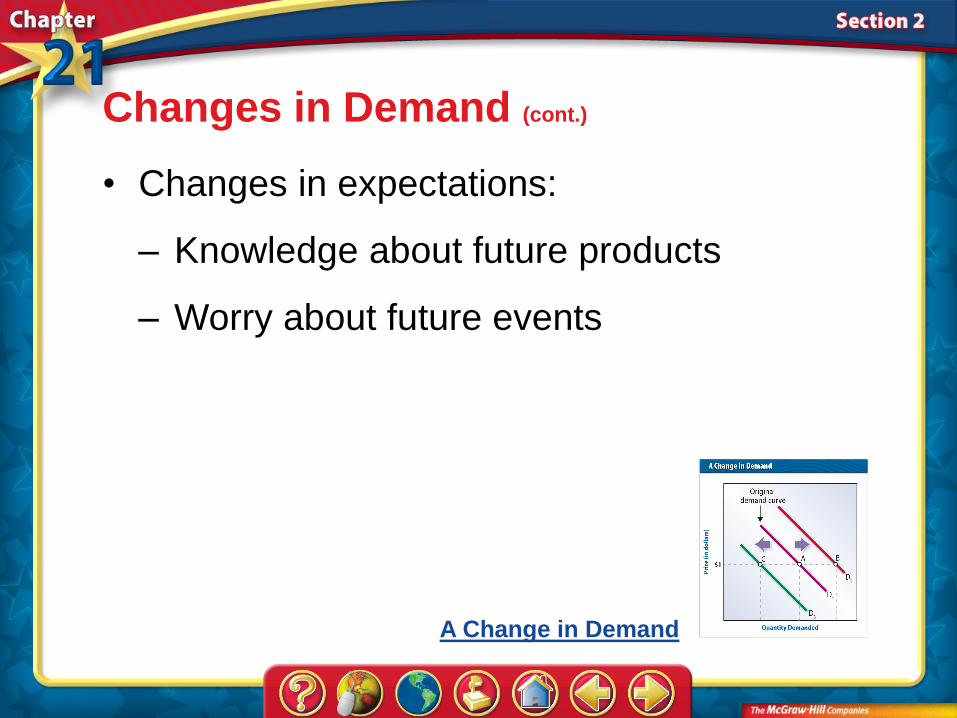
• Changes in expectations:
– Knowledge about future products
– Worry about future events
Changes in Demand (cont.)
A Change in Demand

Section 2
• Product-Related Changes:
– Changes in quality
– Changes in substitutes
– As price of product goes up, demand for its substitute will also go up.
Changes in Demand (cont.)
Change in Demand for Substitutes

Section 2
– Changes in complements (products used together)
– As demand for one product goes up or down, so will demand for its complements.
Changes in Demand (cont.)
• Change in quantity demanded tracks the movement along a given demand curve.

A. A
B. B
C. C
D. D
Section 2
A B C D
0% 0%0%0%
Which of the following expectations would make you change your current spending habits?
A. New fuel technology due in ten years
B. Changes in clothing style
C. An upcoming presidential election
D. The release of a new video game system
Section 2
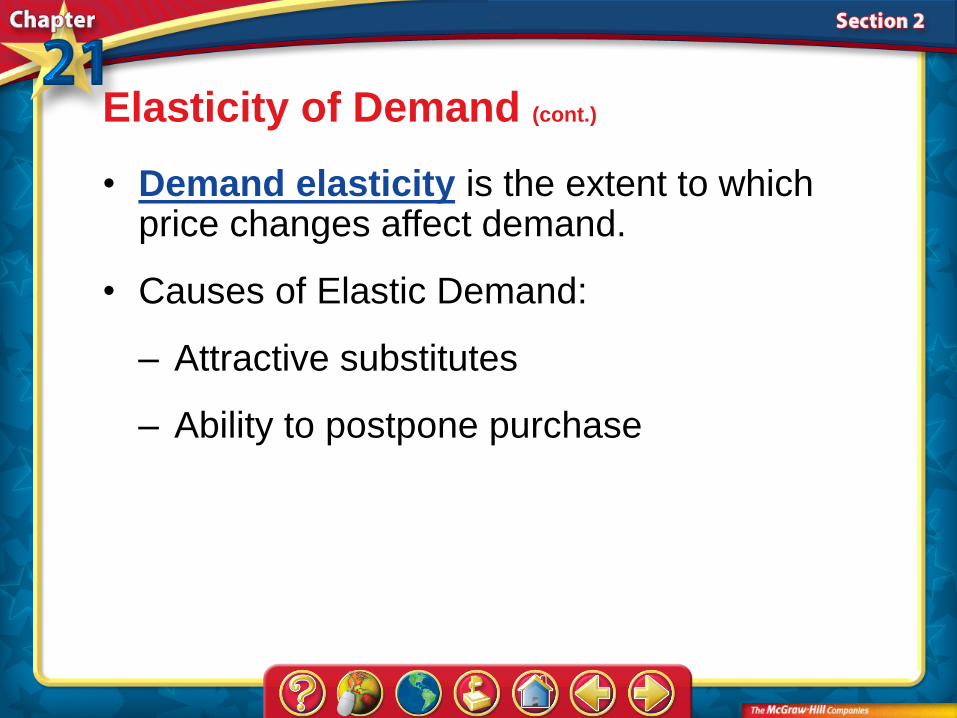
Elasticity of Demand
Demand elasticity is the extent to which a change in price causes a change in the quantity demanded.
Section 2
Elasticity of Demand (cont.)
• Demand elasticity is the extent to which price changes affect demand.
• Causes of Elastic Demand:
– Attractive substitutes
– Ability to postpone purchase

Section 2
Elasticity of Demand (cont.)
• Causes of Inelastic Demand:
– Few or no substitutes (e.g., medicine)
• Demand for luxuries more elastic than demand for necessities

A. A
B. B
Section 2
Do you agree that gasoline has an inelastic demand?
A. Agree
B. Disagree
A B
0%0%

Section 3-Main Idea
Guide to Reading
Big Idea
Supply and demand in a market interact to determine price and the quantities bought and sold.
Section 3-Key Terms
Guide to Reading
Content Vocabulary
• supply
• law of supply
• supply schedule
• supply curve
• profit
• market supply
• productivity
• technology
• subsidy
• supply elasticity

Section 3-Key Terms
Guide to Reading
Academic Vocabulary
• motive
• restrict

A. A
B. B
Section 3-Polling Question
Do you agree that producers should always provide a greater supply of a product than they think they will really need?
A. Agree
B. Disagree
A B
0%0%

Section 3
An Introduction to Supply
Supply is the quantities of a good or service that producers are willing to sell at all possible market prices.

Section 3
An Introduction to Supply (cont.)
• Supply is the quantity of goods and service for sale.
• Supply is the opposite of demand.

Section 3
• The law of supply:
– As prices go up, so do supplies of goods; as prices go down, so do supplies
– Law illustrated by a supply schedule
An Introduction to Supply (cont.)
The Law of Supply

A. A
B. B
Section 3
Do you know why diamonds, a luxury item, costs more than water, which is need for survival?
A. Yes
B. No
A B
0%0%

Section 3
Graphing the Supply Curve
As with the law of demand, special tables and graphs can show the law of supply.

Section 3
Graphing the Supply Curve (cont.)
• Special graphs and tables can show the law of supply.
• A supply curve graphically shows the amount of a product that would be supplied at all possible prices in the market.
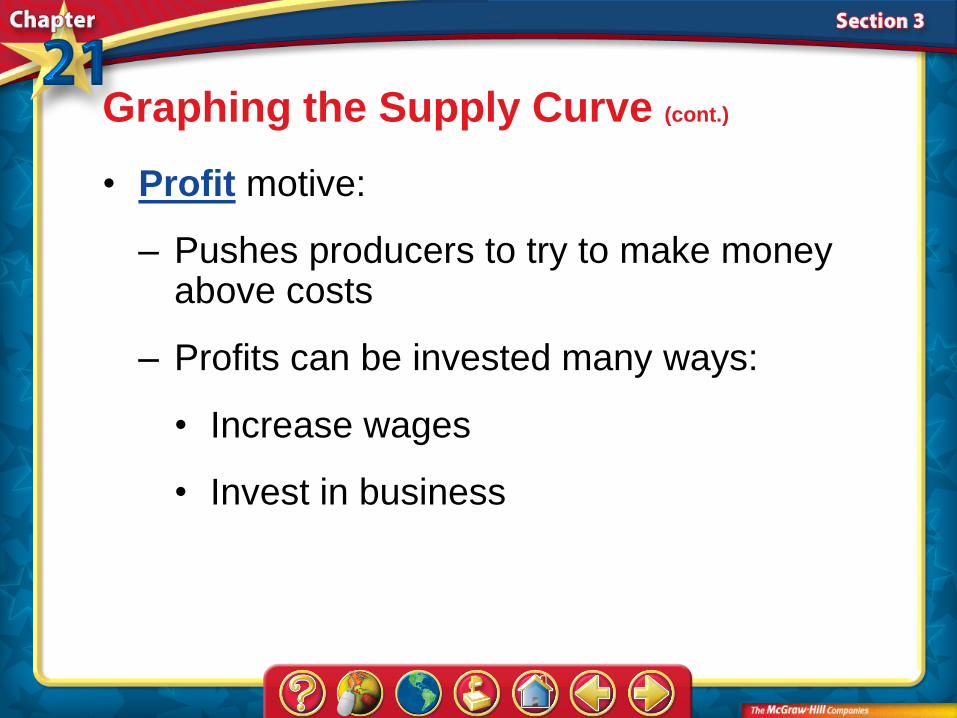
Section 3
• Profit motive:
– Pushes producers to try to make money above costs
– Profits can be invested many ways:
Graphing the Supply Curve (cont.)
• Increase wages
• Invest in business

Section 3
• Acquire more space
• Buy new equipment
• Hire more workers
• Keep money
Graphing the Supply Curve (cont.)

Section 3
• Market supply:
– Slope follows individual trends
– Upward slope shows that producers prefer to sell more items at higher prices
– Most important influence is price
Graphing the Supply Curve (cont.)

A. A
B. B
C. C
D. D
Section 3
A B C D
0% 0%0%0%
If you were a business owner, what would you do with your profits?
A. Increase workers wages
B. Buy more equipment
C. Hire more workers
D. Spend it on a personal vacation
Section 3
Changes in Supply
Supply increases or decreases depending on many different factors.

Section 3
Changes in Supply (cont.)
• Different factors cause increases and decreases in overall supply.
• The cost of resources:
– When the price of resources falls, supply goes up.
– When the price of resources goes up, supply falls.
Shifts in the Supply Curve

Section 3
• Productivity:
– When productivity increases, costs go down.
– When productivity decreases, costs go up.
Changes in Supply (cont.)

Section 3
• Technology:
– Can lower costs of production and increase supply
Changes in Supply (cont.)

Section 3
• Government policies:
– Usually restrict supply
– Taxes
Changes in Supply (cont.)
• Higher taxes lower supply
• Lower taxes increase supply

Section 3
• Subsidies:
– Lower production costs
Changes in Supply (cont.)
• Expectations:
– Producers may adjust supply to meet expected demand

Section 3
• Number of Suppliers:
– More suppliers cause more supply
– Fewer suppliers cause less supply
Changes in Supply (cont.)

A. A
B. B
C. C
D. D
Section 3
A B C D
0% 0%0%0%
Which of the following do you think has the greatest impact on supply?
A. Cost of resources
B. Technology
C. Expectations
D. Number of suppliers
Section 3
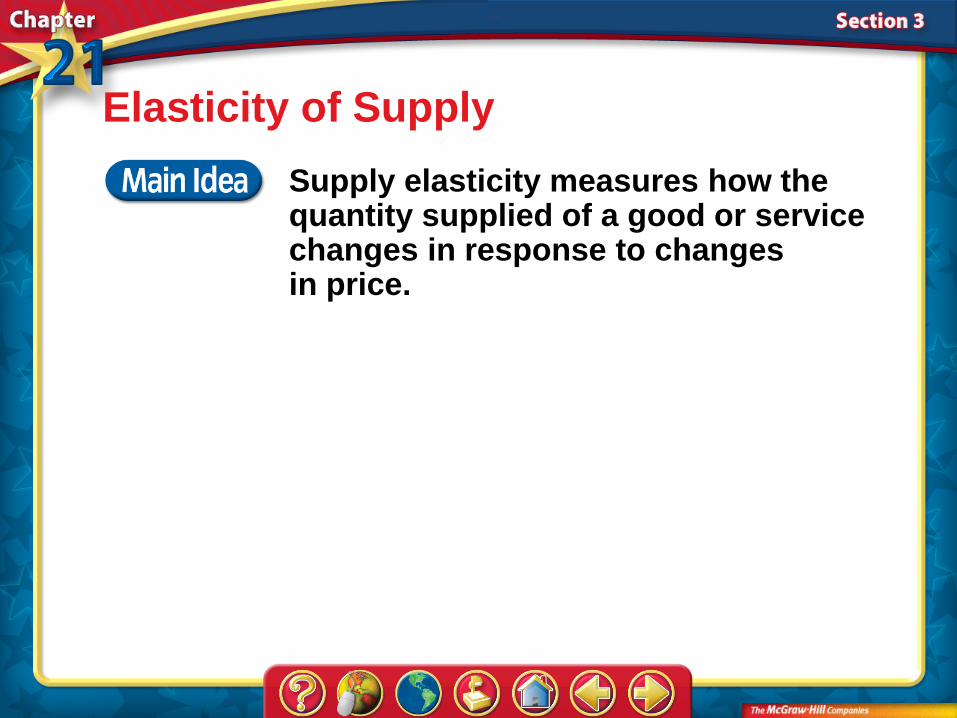
Elasticity of Supply
Supply elasticity measures how the quantity supplied of a good or service changes in response to changes in price.
Section 3
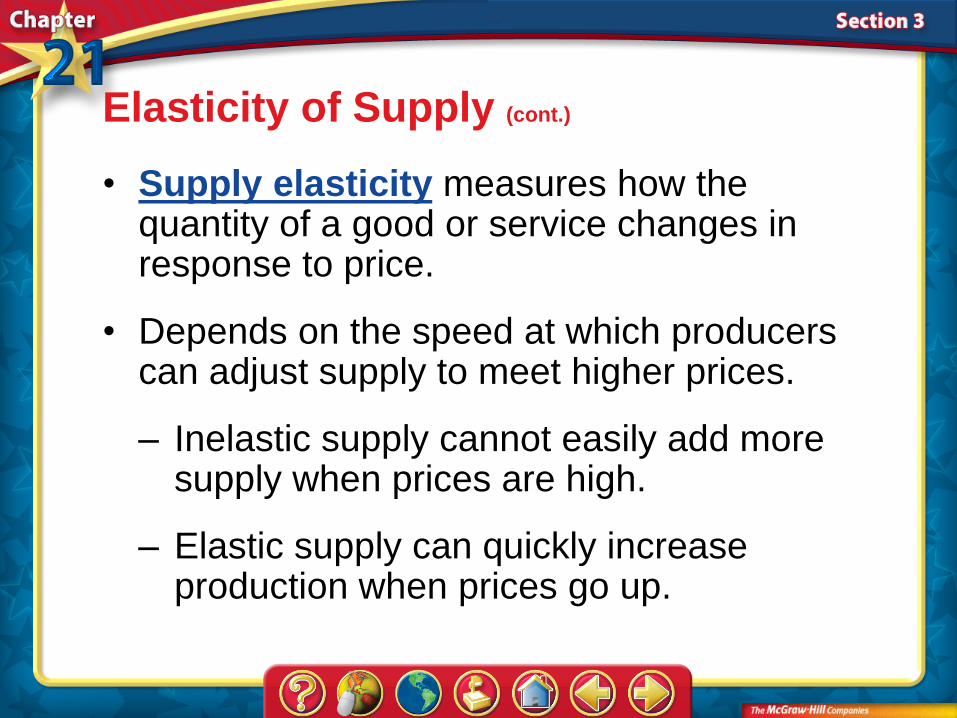
Elasticity of Supply (cont.)
• Supply elasticity measures how the quantity of a good or service changes in response to price.
• Depends on the speed at which producers can adjust supply to meet higher prices.
– Inelastic supply cannot easily add more supply when prices are high.
– Elastic supply can quickly increase production when prices go up.
A. A
B. B
C. C
D. D
Section 3
A B C D
0% 0%0%0%
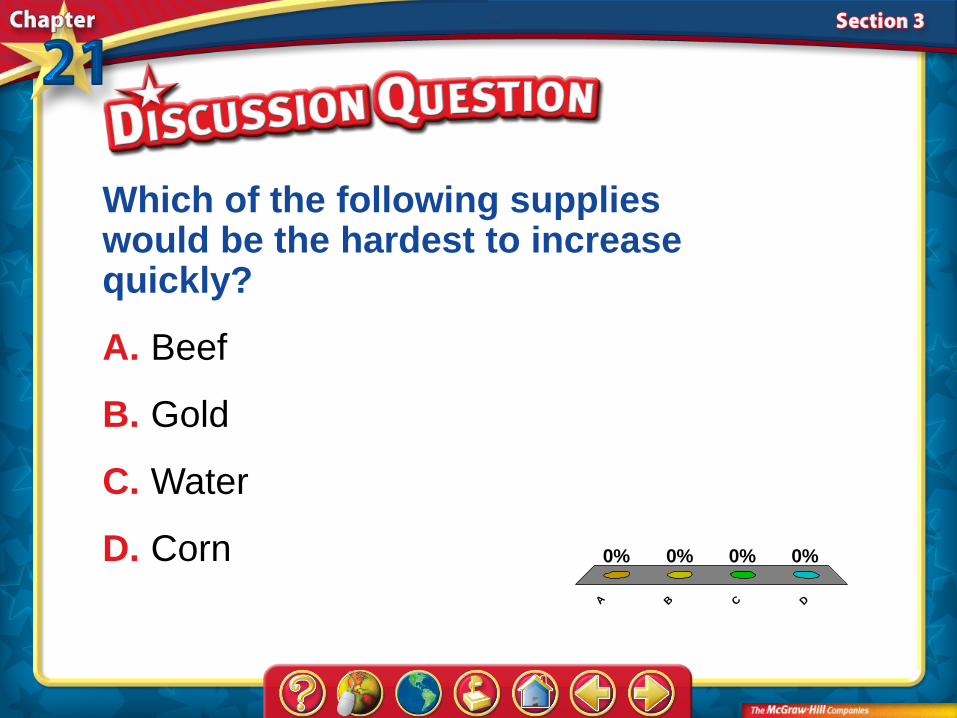
Which of the following supplies would be the hardest to increase quickly?
A. Beef
B. Gold
C. Water
D. Corn
Section 4-Main Idea
Guide to Reading
Big Idea
Supply and demand in a market interact to determine price and the quantities bought and sold.

Section 4-Key Terms
Guide to Reading
Content Vocabulary
• surplus
• shortage
• equilibrium price
• price ceiling
• price floor
• minimum wage
Academic Vocabulary
• mechanism
• purchase
• focus

A. A
B. B
Section 4-Polling Question
Do you think an economy would work if everything cost the same price?
A. Yes
B. No
A B
0%0%

Section 4
Markets and Prices
The forces of supply and demand work together in markets to establish prices.

Section 4
Markets and Prices (cont.)
• Supply and demand work together to establish prices.
• Surplus indicates price is too high for demand.
• Shortage indicates price is too low for demand.
The Price Adjustment Process

Section 4
• The balance between supply and demand is equilibrium price.
– Stays until supply or demand changes
Markets and Prices (cont.)
Section 4
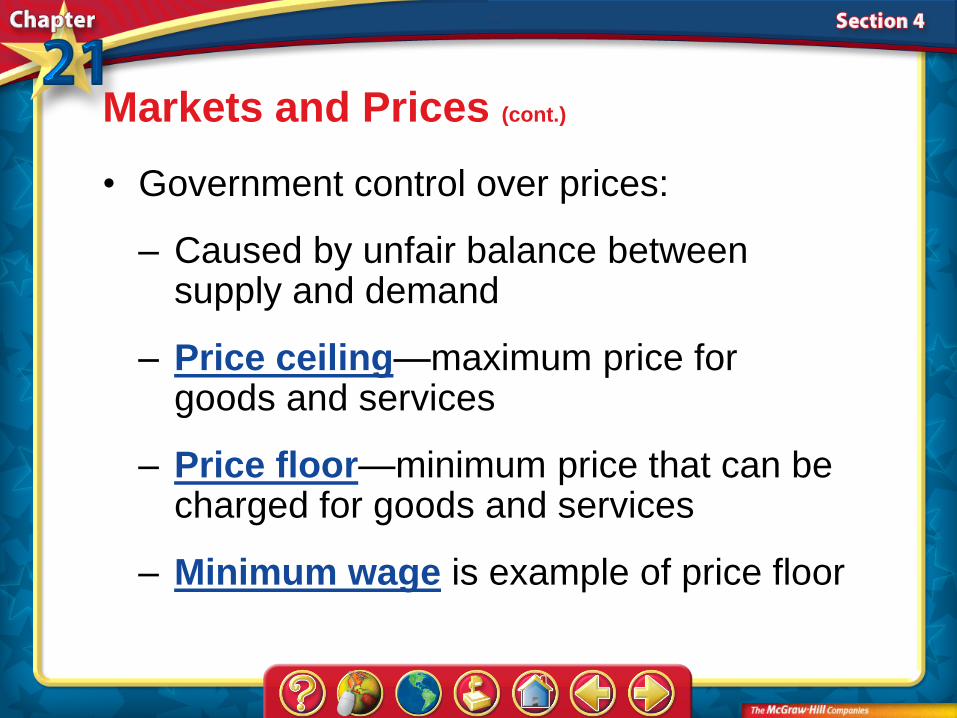
• Government control over prices:
– Caused by unfair balance between supply and demand
– Price ceiling—maximum price for goods and services
– Price floor—minimum price that can be charged for goods and services
– Minimum wage is example of price floor
Markets and Prices (cont.)
A. A
B. B
Section 4
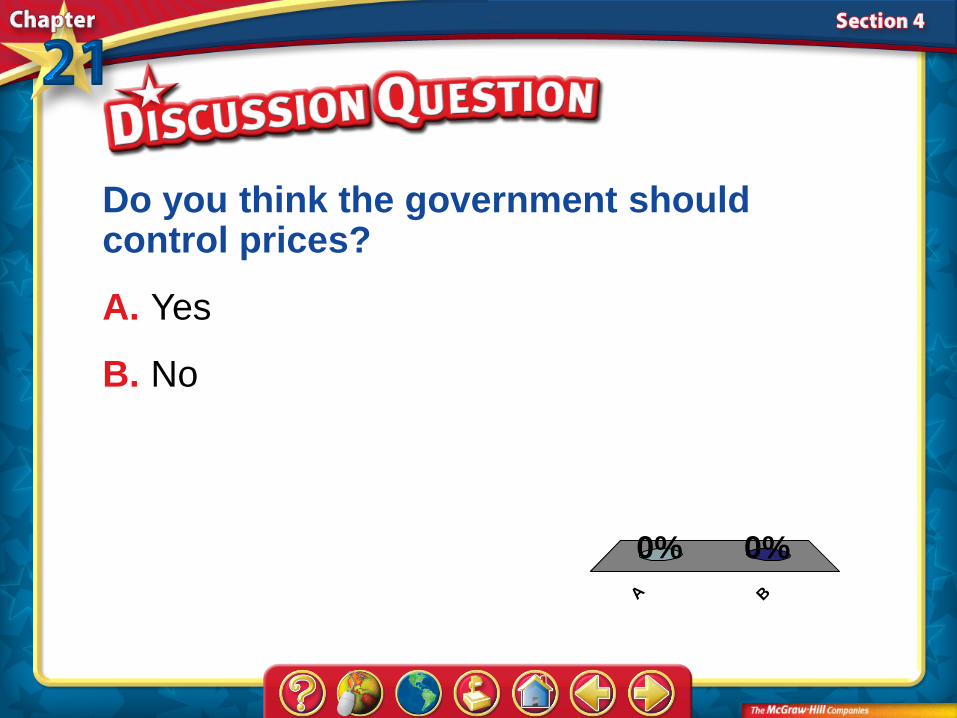
Do you think the government should control prices?
A. Yes
B. No
A B
0%0%

Section 4
Prices as Signals
In our economy, prices are signals that help businesses and consumers make decisions.

Section 4
Prices as Signals (cont.)
• Prices help businesses and consumers make decisions.
• Advantages of prices:
– They are neutral.
– They are flexible.
– They allow freedom of choice.
– Opposite in command economy
– They are familiar.

A. A
B. B
Section 4
Are there any advantages to the lack of choice offered in command economies?
A. Yes
B. No
A B
0%0%
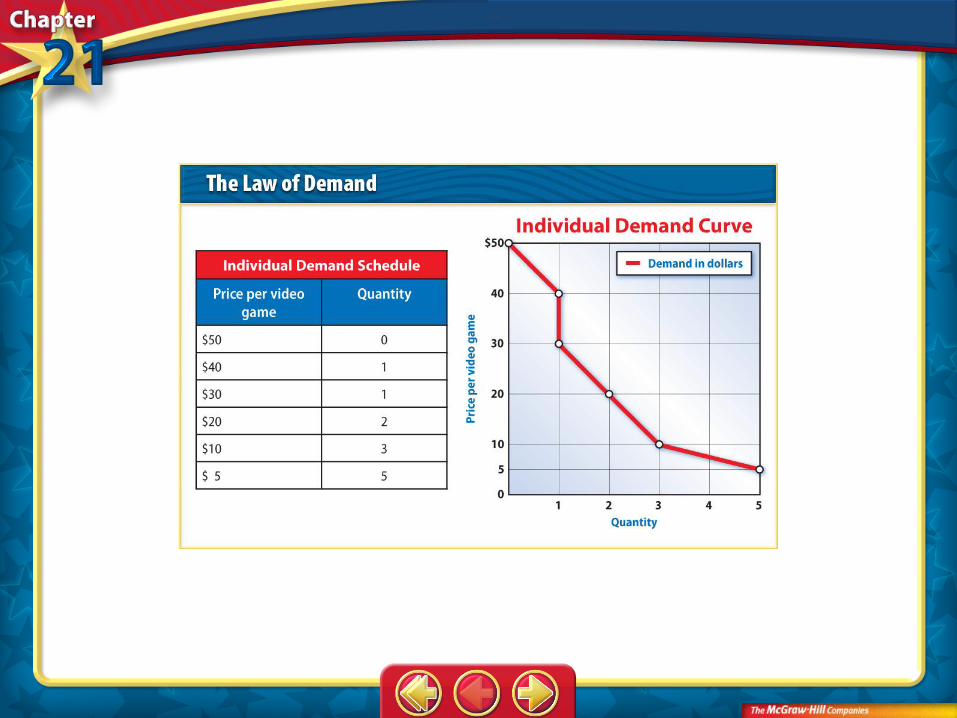
Figure 1

Figure 1

Figure 2

Figure 3

Figure 4

Figure 4

Figure 5

Figure 6

TIME Trans

DFS Trans 1

DFS Trans 2

DFS Trans 3
As the supply
increases, the price
decreases.

DFS Trans 4

Vocab1
demand
the desire, willingness, and ability to buy a good or service

Vocab2
demand schedule
a table showing quantities demanded at different possible prices
Vocab3
demand curve
downward-sloping line that graphically shows the quantities demanded at each possible price

Vocab4
law of demand
the concept that people are normally willing to buy less of a product if the price is high and more of it if the price is low

Vocab5
market demand
the total demand of all consumers for a product or service

Vocab6
utility
the amount of satisfaction one gets from a good or service

Vocab7
marginal utility
additional use that is derived from each unit acquired
Vocab8
identify
to find or show the identity of

Vocab9
illustrate
to show or make clear by example

Vocab10
likewise
similarly or in addition

Vocab11
substitute
a competing product that consumers can use in place of another

Vocab12
complement
product often used with another product

Vocab13
demand elasticity
measure of responsiveness relating change in quantity demanded to a change in price

Vocab14
immigration
the arrival of people from another region

Vocab15
phenomenon
a rare or important fact or event

Vocab16
supply
the amount of goods and services that producers are able and willing to sell at various prices during a specified time period

Vocab17
law of supply
the principle that suppliers will normally offer more for sale at higher prices and less at lower prices
Vocab18
supply schedule
table showing quantities supplied at different possible prices

Vocab19
supply curve
upward-sloping line that graphically shows the quantities supplied at each possible price

Vocab20
profit
the money a business receives for its products or services over and above its costs

Vocab21
market supply
the total of all the supply schedules of all the businesses that provide the same good or service

Vocab22
productivity
the degree to which resources are being used efficiently to produce goods and services

Vocab23
technology
the methods or processes used to make goods and services

Vocab24
subsidy
a government payment to an individual, business, or group in exchange for certain actions

Vocab25
supply elasticity
responsiveness of quantity supplied to a change in price

Vocab26
motive
something that causes a person to act

Vocab27
restrict
to place limits on or keep within bounds

Vocab28
surplus
situation in which quantity supplied is greater than quantity demanded; situation in which government spends less than it collects in revenues
Vocab29
shortage
situation in which quantity demanded is greater than quantity supplied

Vocab30
equilibrium price
the price at which the amount producers are willing to supply is equal to the amount consumers are willing to buy
Vocab31
price ceiling
maximum price that can be charged for goods and services, set by the government

Vocab32
price floor
minimum price that can be charged for goods and services, set by the government

Vocab33
minimum wage
lowest legal wage that can be paid to most U.S. workers

Vocab34
mechanism
the steps that compose a process or activity

Vocab35
purchase
to buy or pay for

Vocab36
focus
a central point of attention or activity
Help
Click the Forward button to go to the next slide.
Click the Previous button to return to the previous slide.
Click the Home button to return to the Chapter Menu.
Click the Transparency button from the Chapter Menu or Chapter Introduction slides to access the TIME Transparency that is relevant to this chapter. From within a section, click on this button to access the relevant Daily Focus Skills Transparency.
Click the Return button in a feature to return to the main presentation.
Click the Economics Online button to access online textbook features.
Click the Reference Atlas button to access the Interactive Reference Atlas.
Click the Exit button or press the Escape key [Esc] to end the chapter slide show.
Click the Help button to access this screen.
Links to Presentation Plus! features such as Graphs in Motion, Charts in Motion, and figures from your textbook are located at the bottom of relevant screens.
To use this Presentation Plus! product:

End of Custom Shows
This slide is intentionally blank.