SPFBDCAP UNITED STATES DEPARTMENT OF THE INTERIOR …
59
UNITED STATES DEPARTMENT OF THE INTERIOR MINERALS MANAGEMENT SERVICE GULF OF MEXICO REGION POSTSALE 21-JUN-2000 PAGE: 1 Final Bid Recap (all Bids by Area/Tract) Sale Number : 175 Sale Identifier: CENTRAL GULF OF MEXICO Sale Date : 15-MAR-2000 Region Name : Gulf of Mexico OCS Region SPFBDCAP LA1 Area West Cameron Area Area Name G21530 G21531 G21532 G21533 G21534 G21535 G21536 482.08 1,425.39 5,000.00 3,750.00 5,000.00 3,750.00 5,000.00 A A A A A A A 18 19 44 47 57 111 112 1 1 1 2 3 1 2 1 2 1 1 $25,068.00 $507,439.00 $537,544.00 $361,750.00 $265,750.00 $802,500.00 $641,250.00 $913,755.00 $420,104.00 $111,303.00 $141,387.00 $52.00 $356.00 $107.51 $72.35 $53.15 $214.00 $171.00 $182.75 $84.02 $29.68 $28.28 100.00000 100.00000 78.00000 20.00000 2.00000 75.00000 25.00000 50.00000 50.00000 100.00000 50.00000 50.00000 78.00000 20.00000 2.00000 100.00000 100.00000 100.00000 00078 00078 01001 01978 01999 00048 02222 02330 02397 00078 02330 02397 01001 01978 01999 01046 01832 01832 Chevron U.S.A. Inc. Chevron U.S.A. Inc. IP Petroleum Company, Inc. The William G. Helis Company, L.L.C. Houston Energy, Inc. Forest Oil Corporation PetroQuest Energy One, L.L.C. Cheniere Energy, Inc. Samson Offshore Company Chevron U.S.A. Inc. Cheniere Energy, Inc. Samson Offshore Company IP Petroleum Company, Inc. The William G. Helis Company, L.L.C. Houston Energy, Inc. The Houston Exploration Company Forcenergy Inc Forcenergy Inc Bid Type OCS Number Block Block Size Block Unit Company Percent(%) Company Name Amount Bid/ Tract Unit Total Bonus Rank $1,165,044.00 $1,443,750.00 $1,333,859.00 3 2 2 *** *** *** *** TRACT TOTALS *** TRACT TOTALS *** TRACT TOTALS G21532 G21533 G21534 TOTAL BIDS TOTAL BIDS TOTAL BIDS TOTAL AMOUNT EXPOSED TOTAL AMOUNT EXPOSED TOTAL AMOUNT EXPOSED 16 2/3% ROY 16 2/3% ROY 16 2/3% ROY 16 2/3% ROY 16 2/3% ROY 16 2/3% ROY 16 2/3% ROY
Transcript of SPFBDCAP UNITED STATES DEPARTMENT OF THE INTERIOR …

UNITED STATES DEPARTMENT OF THE INTERIORMINERALS MANAGEMENT SERVICE
GULF OF MEXICO REGION
POSTSALE21-JUN-2000PAGE: 1
Final Bid Recap (all Bids by Area/Tract)Sale Number : 175Sale Identifier: CENTRAL GULF OF MEXICOSale Date : 15-MAR-2000Region Name : Gulf of Mexico OCS Region
SPFBDCAP
LA1Area West Cameron AreaArea Name
G21530
G21531
G21532
G21533
G21534
G21535
G21536
482.08
1,425.39
5,000.00
3,750.00
5,000.00
3,750.00
5,000.00
A
A
A
A
A
A
A
18
19
44
47
57
111
112
1
1
1
2
3
1
2
1
2
1
1
$25,068.00
$507,439.00
$537,544.00
$361,750.00
$265,750.00
$802,500.00
$641,250.00
$913,755.00
$420,104.00
$111,303.00
$141,387.00
$52.00
$356.00
$107.51
$72.35
$53.15
$214.00
$171.00
$182.75
$84.02
$29.68
$28.28
100.00000
100.00000
78.00000 20.00000 2.00000 75.00000 25.00000 50.00000 50.00000
100.00000
50.00000 50.00000
78.00000 20.00000 2.00000 100.00000
100.00000
100.00000
00078
00078
01001019780199900048022220233002397
00078
0233002397
01001019780199901046
01832
01832
Chevron U.S.A. Inc.
Chevron U.S.A. Inc.
IP Petroleum Company, Inc.The William G. Helis Company, L.L.C.Houston Energy, Inc.Forest Oil CorporationPetroQuest Energy One, L.L.C.Cheniere Energy, Inc.Samson Offshore Company
Chevron U.S.A. Inc.
Cheniere Energy, Inc.Samson Offshore Company
IP Petroleum Company, Inc.The William G. Helis Company, L.L.C.Houston Energy, Inc.The Houston Exploration Company
Forcenergy Inc
Forcenergy Inc
Bid TypeOCSNumber Block
BlockSize
BlockUnit Company Percent(%) Company Name
Amount Bid/Tract Unit
TotalBonus Rank
$1,165,044.00
$1,443,750.00
$1,333,859.00
3
2
2
***
***
***
*** TRACT TOTALS
*** TRACT TOTALS
*** TRACT TOTALS
G21532
G21533
G21534
TOTAL BIDS
TOTAL BIDS
TOTAL BIDS
TOTAL AMOUNT EXPOSED
TOTAL AMOUNT EXPOSED
TOTAL AMOUNT EXPOSED
16 2/3% ROY
16 2/3% ROY
16 2/3% ROY
16 2/3% ROY
16 2/3% ROY
16 2/3% ROY
16 2/3% ROY

UNITED STATES DEPARTMENT OF THE INTERIORMINERALS MANAGEMENT SERVICE
GULF OF MEXICO REGION
POSTSALE21-JUN-2000PAGE: 2
Final Bid Recap (all Bids by Area/Tract)Sale Number : 175Sale Identifier: CENTRAL GULF OF MEXICOSale Date : 15-MAR-2000Region Name : Gulf of Mexico OCS Region
'R' Denotes Rejected Tract.
SPFBDCAP
LA1Area West Cameron AreaArea Name
G21537
G21538
G21539
G21540
G21541
G21542
G21543
G21544
G21545
5,000.00
5,000.00
5,000.00
5,000.00
5,000.00
5,000.00
5,000.00
5,000.00
5,000.00
A
A
A
A
A
A
A
A
A
128
175
177
190
212
216
241
251
252
1
1
2
1
1
1
1
2
1
1
1
$227,333.00
$1,750,282.00
$300,000.00
$200,000.00
$136,103.00
$163,103.00
$212,550.00
$183,000.00
$153,500.00
$135,000.00
$151,325.00
$45.47
$350.06
$60.00
$40.00
$27.22
$32.62
$42.51
$36.60
$30.70
$27.00
$30.27
66.67000 33.33000
100.00000
100.00000
100.00000
100.00000
100.00000
66.67000 33.33000 100.00000
50.00000 50.00000
100.00000
100.00000
0216900231
00560
01834
01834
01832
01832
019350028200059
0233002397
00078
02018
Spinnaker Exploration Company, L.L.C.Pogo Producing Company
Seneca Resources Corporation
Stone Energy Corporation
Stone Energy Corporation
Forcenergy Inc
Forcenergy Inc
Pioneer Natural Resources USA, Inc.CNG Producing CompanyAmerada Hess Corporation
Cheniere Energy, Inc.Samson Offshore Company
Chevron U.S.A. Inc.
Basin Exploration, Inc.
Bid TypeOCSNumber Block
BlockSize
BlockUnit Company Percent(%) Company Name
Amount Bid/Tract Unit
TotalBonus Rank
$2,050,282.00
$395,550.00
2
2
***
***
*** TRACT TOTALS
*** TRACT TOTALS
G21538
G21542
TOTAL BIDS
TOTAL BIDS
TOTAL AMOUNT EXPOSED
TOTAL AMOUNT EXPOSED
16 2/3% ROY
16 2/3% ROY
16 2/3% ROY
16 2/3% ROY
16 2/3% ROY
16 2/3% ROY
16 2/3% ROY
16 2/3% ROY
16 2/3% ROY
R

UNITED STATES DEPARTMENT OF THE INTERIORMINERALS MANAGEMENT SERVICE
GULF OF MEXICO REGION
POSTSALE21-JUN-2000PAGE: 3
Final Bid Recap (all Bids by Area/Tract)Sale Number : 175Sale Identifier: CENTRAL GULF OF MEXICOSale Date : 15-MAR-2000Region Name : Gulf of Mexico OCS Region
SPFBDCAP
LA1AArea West Cameron Area, West AdditionArea Name
G21546
G21547
G21548
G21549
G21550
G21551
G21552
G21553
G21554
G21555
G21556
G21557
5,000.00
5,000.00
4,458.43
5,000.00
5,000.00
842.91
5,000.00
5,000.00
5,000.00
5,000.00
5,000.00
5,000.00
A
A
A
A
A
A
A
A
A
A
A
A
162
288
296
307
322
323
332
370
392
393
400
425
1
1
2
1
1
1
1
1
1
1
1
1
1
$147,227.00
$177,500.00
$147,227.00
$885,391.00
$319,725.00
$151,250.00
$30,900.00
$151,325.00
$1,023,000.00
$1,889,000.00
$671,000.00
$572,000.00
$176,256.00
$29.45
$35.50
$29.45
$198.59
$63.95
$30.25
$36.66
$30.27
$204.60
$377.80
$134.20
$114.40
$35.25
100.00000
66.67000 33.33000 100.00000
100.00000
50.00000 50.00000
50.00000 50.00000
50.00000 50.00000
100.00000
60.00000 40.00000
100.00000
100.00000
100.00000
100.00000
01855
021690023101855
01935
0233002397
0233002397
0233002397
02018
0214801385
00185
00185
00185
01138
Vastar Resources, Inc.
Spinnaker Exploration Company, L.L.C.Pogo Producing CompanyVastar Resources, Inc.
Pioneer Natural Resources USA, Inc.
Cheniere Energy, Inc.Samson Offshore Company
Cheniere Energy, Inc.Samson Offshore Company
Cheniere Energy, Inc.Samson Offshore Company
Basin Exploration, Inc.
Westport Oil and Gas Company, Inc.Chieftain International (U.S.) Inc.
Samedan Oil Corporation
Samedan Oil Corporation
Samedan Oil Corporation
El Paso Production GOM Inc.
Bid TypeOCSNumber Block
BlockSize
BlockUnit Company Percent(%) Company Name
Amount Bid/Tract Unit
TotalBonus Rank
$324,727.002*** *** TRACT TOTALSG21547 TOTAL BIDS TOTAL AMOUNT EXPOSED
16 2/3% ROY
16 2/3% ROY
16 2/3% ROY
16 2/3% ROY
16 2/3% ROY
16 2/3% ROY
16 2/3% ROY
16 2/3% ROY
16 2/3% ROY
16 2/3% ROY
16 2/3% ROY
16 2/3% ROY

UNITED STATES DEPARTMENT OF THE INTERIORMINERALS MANAGEMENT SERVICE
GULF OF MEXICO REGION
POSTSALE21-JUN-2000PAGE: 4
Final Bid Recap (all Bids by Area/Tract)Sale Number : 175Sale Identifier: CENTRAL GULF OF MEXICOSale Date : 15-MAR-2000Region Name : Gulf of Mexico OCS Region
SPFBDCAP
LA1AArea West Cameron Area, West AdditionArea Name
G21558
G21559
5,000.00
5,000.00
A
A
438
443
1
1
$246,000.00
$169,000.00
$49.20
$33.80
100.00000
100.00000
00185
00185
Samedan Oil Corporation
Samedan Oil Corporation
Bid TypeOCSNumber Block
BlockSize
BlockUnit Company Percent(%) Company Name
Amount Bid/Tract Unit
TotalBonus Rank
16 2/3% ROY
16 2/3% ROY

UNITED STATES DEPARTMENT OF THE INTERIORMINERALS MANAGEMENT SERVICE
GULF OF MEXICO REGION
POSTSALE21-JUN-2000PAGE: 5
Final Bid Recap (all Bids by Area/Tract)Sale Number : 175Sale Identifier: CENTRAL GULF OF MEXICOSale Date : 15-MAR-2000Region Name : Gulf of Mexico OCS Region
SPFBDCAP
LA1BArea West Cameron Area, South AdditionArea Name
G21560
G21561
G21562
G21563
G21564
G21565
G21566
G21567
G21568
G21569
5,000.00
5,000.00
5,000.00
5,475.43
5,000.00
5,000.00
5,000.00
5,000.00
5,000.00
5,000.00
A
A
A
A
A
A
A
A
A
A
446
460
483
497
530
531
558
585
609
635
1
1
1
1
1
1
1
1
1
1
2
3
$234,000.00
$315,510.00
$265,580.00
$307,000.00
$141,750.00
$285,585.00
$311,665.00
$141,980.00
$142,000.00
$807,800.00
$534,020.00
$250,100.00
$46.80
$63.10
$53.12
$56.07
$28.35
$57.12
$62.33
$28.40
$28.40
$161.56
$106.80
$50.02
100.00000
100.00000
100.00000
50.00000 50.00000
100.00000
100.00000
100.00000
100.00000
100.00000
100.00000
100.00000
100.00000
00185
02421
02421
0138502148
02421
02421
02421
02421
00981
01819
00730
00003
Samedan Oil Corporation
Devon Energy Production Company, L.P.
Devon Energy Production Company, L.P.
Chieftain International (U.S.) Inc.Westport Oil and Gas Company, Inc.
Devon Energy Production Company, L.P.
Devon Energy Production Company, L.P.
Devon Energy Production Company, L.P.
Devon Energy Production Company, L.P.
Anadarko Petroleum Corporation
ATP Oil & Gas Corporation
Walter Oil & Gas Corporation
Union Oil Company of California
Bid TypeOCSNumber Block
BlockSize
BlockUnit Company Percent(%) Company Name
Amount Bid/Tract Unit
TotalBonus Rank
$1,591,920.003*** *** TRACT TOTALSG21569 TOTAL BIDS TOTAL AMOUNT EXPOSED
16 2/3% ROY
16 2/3% ROY
16 2/3% ROY
16 2/3% ROY
16 2/3% ROY
16 2/3% ROY
16 2/3% ROY
16 2/3% ROY
16 2/3% ROY
16 2/3% ROY

UNITED STATES DEPARTMENT OF THE INTERIORMINERALS MANAGEMENT SERVICE
GULF OF MEXICO REGION
POSTSALE21-JUN-2000PAGE: 6
Final Bid Recap (all Bids by Area/Tract)Sale Number : 175Sale Identifier: CENTRAL GULF OF MEXICOSale Date : 15-MAR-2000Region Name : Gulf of Mexico OCS Region
SPFBDCAP
LA2Area East Cameron AreaArea Name
G21570
G21571
G21572
G21573
G21574
G21575
G21576
G21577
G21578
5,000.00
5,000.00
5,000.00
5,000.00
5,000.00
5,000.00
5,000.00
5,000.00
5,000.00
A
A
A
A
A
A
A
A
A
40
45
104
106
115
137
139
178
179
1
1
1
2
3
1
2
1
1
1
1
1
2
$3,750,500.00
$326,748.00
$937,000.00
$238,580.00
$183,000.00
$212,583.00
$136,170.00
$238,580.00
$170,000.00
$1,578,000.00
$225,798.00
$515,300.00
$140,654.00
$750.10
$65.35
$187.40
$47.72
$36.60
$42.52
$27.23
$47.72
$34.00
$315.60
$45.16
$103.06
$28.13
100.00000
100.00000
60.00000 40.00000 100.00000
100.00000
100.00000
100.00000
100.00000
100.00000
100.00000
100.00000
75.00000 25.00000 100.00000
00282
02018
021480138502025
00730
01046
02025
02025
00078
02169
02018
017040234902018
CNG Producing Company
Basin Exploration, Inc.
Westport Oil and Gas Company, Inc.Chieftain International (U.S.) Inc.Coastal Oil & Gas USA, L.P.
Walter Oil & Gas Corporation
The Houston Exploration Company
Coastal Oil & Gas USA, L.P.
Coastal Oil & Gas USA, L.P.
Chevron U.S.A. Inc.
Spinnaker Exploration Company, L.L.C.
Basin Exploration, Inc.
Remington Oil and Gas CorporationMagnum Hunter Production, Inc.Basin Exploration, Inc.
Bid TypeOCSNumber Block
BlockSize
BlockUnit Company Percent(%) Company Name
Amount Bid/Tract Unit
TotalBonus Rank
$1,358,580.00
$348,753.00
$655,954.00
3
2
2
***
***
***
*** TRACT TOTALS
*** TRACT TOTALS
*** TRACT TOTALS
G21572
G21573
G21578
TOTAL BIDS
TOTAL BIDS
TOTAL BIDS
TOTAL AMOUNT EXPOSED
TOTAL AMOUNT EXPOSED
TOTAL AMOUNT EXPOSED
16 2/3% ROY
16 2/3% ROY
16 2/3% ROY
16 2/3% ROY
16 2/3% ROY
16 2/3% ROY
16 2/3% ROY
16 2/3% ROY
16 2/3% ROY

UNITED STATES DEPARTMENT OF THE INTERIORMINERALS MANAGEMENT SERVICE
GULF OF MEXICO REGION
POSTSALE21-JUN-2000PAGE: 7
Final Bid Recap (all Bids by Area/Tract)Sale Number : 175Sale Identifier: CENTRAL GULF OF MEXICOSale Date : 15-MAR-2000Region Name : Gulf of Mexico OCS Region
SPFBDCAP
LA2Area East Cameron AreaArea Name
G21579 5,000.00A 184 1 $372,100.00 $74.42 75.00000 25.00000
0170402349
Remington Oil and Gas CorporationMagnum Hunter Production, Inc.
Bid TypeOCSNumber Block
BlockSize
BlockUnit Company Percent(%) Company Name
Amount Bid/Tract Unit
TotalBonus Rank
16 2/3% ROY

UNITED STATES DEPARTMENT OF THE INTERIORMINERALS MANAGEMENT SERVICE
GULF OF MEXICO REGION
POSTSALE21-JUN-2000PAGE: 8
Final Bid Recap (all Bids by Area/Tract)Sale Number : 175Sale Identifier: CENTRAL GULF OF MEXICOSale Date : 15-MAR-2000Region Name : Gulf of Mexico OCS Region
SPFBDCAP
LA2AArea East Cameron Area, South AdditionArea Name
G21580
G21581
G21582
G21583
G21584
G21585
G21586
5,000.00
5,000.00
5,000.00
5,000.00
5,000.00
5,000.00
5,000.00
A
A
A
A
A
A
A
257
282
283
298
348
369
374
1
1
1
1
1
1
2
1
2
$531,100.00
$505,000.00
$418,256.00
$143,500.00
$191,000.00
$319,000.00
$253,282.00
$2,057,000.00
$414,750.00
$106.22
$101.00
$83.65
$28.70
$38.20
$63.80
$50.66
$411.40
$82.95
100.00000
75.00000 25.00000
100.00000
75.00000 25.00000
100.00000
60.00000 40.00000 100.00000
75.00000 25.00000 75.00000 25.00000
00003
0170402349
01138
0170402349
02148
021480138500560
01689015130004802222
Union Oil Company of California
Remington Oil and Gas CorporationMagnum Hunter Production, Inc.
El Paso Production GOM Inc.
Remington Oil and Gas CorporationMagnum Hunter Production, Inc.
Westport Oil and Gas Company, Inc.
Westport Oil and Gas Company, Inc.Chieftain International (U.S.) Inc.Seneca Resources Corporation
Murphy Exploration & Production CompanyCallon Petroleum Operating CompanyForest Oil CorporationPetroQuest Energy One, L.L.C.
Bid TypeOCSNumber Block
BlockSize
BlockUnit Company Percent(%) Company Name
Amount Bid/Tract Unit
TotalBonus Rank
$572,282.00
$2,471,750.00
2
2
***
***
*** TRACT TOTALS
*** TRACT TOTALS
G21585
G21586
TOTAL BIDS
TOTAL BIDS
TOTAL AMOUNT EXPOSED
TOTAL AMOUNT EXPOSED
16 2/3% ROY
16 2/3% ROY
16 2/3% ROY
16 2/3% ROY
16 2/3% ROY
16 2/3% ROY
16 2/3% ROY

UNITED STATES DEPARTMENT OF THE INTERIORMINERALS MANAGEMENT SERVICE
GULF OF MEXICO REGION
POSTSALE21-JUN-2000PAGE: 9
Final Bid Recap (all Bids by Area/Tract)Sale Number : 175Sale Identifier: CENTRAL GULF OF MEXICOSale Date : 15-MAR-2000Region Name : Gulf of Mexico OCS Region
SPFBDCAP
LA2AArea East Cameron Area, South AdditionArea Name
G21587 5,000.00A 380 1
2
3
$578,000.00
$431,100.00
$187,800.00
$115.60
$86.22
$37.56
50.00000 50.00000 100.00000
100.00000
007300221900003
01819
Walter Oil & Gas CorporationKerr-McGee Oil & Gas CorporationUnion Oil Company of California
ATP Oil & Gas Corporation
Bid TypeOCSNumber Block
BlockSize
BlockUnit Company Percent(%) Company Name
Amount Bid/Tract Unit
TotalBonus Rank
$1,196,900.003*** *** TRACT TOTALSG21587 TOTAL BIDS TOTAL AMOUNT EXPOSED
16 2/3% ROY

UNITED STATES DEPARTMENT OF THE INTERIORMINERALS MANAGEMENT SERVICE
GULF OF MEXICO REGION
POSTSALE21-JUN-2000PAGE: 10
Final Bid Recap (all Bids by Area/Tract)Sale Number : 175Sale Identifier: CENTRAL GULF OF MEXICOSale Date : 15-MAR-2000Region Name : Gulf of Mexico OCS Region
SPFBDCAP
LA3Area Vermilion AreaArea Name
G21588
G21589
G21590
G21591
G21592
G21593
G21594
G21595
G21596
3,380.24
5,000.00
2,500.00
5,000.00
4,521.33
4,461.05
5,000.00
5,000.00
5,000.00
A
A
A
A
A
A
A
A
A
28
32
39
69
71
72
74
85
123
1
1
1
1
1
2
3
4
1
2
3
1
1
2
1
$155,600.00
$141,600.00
$806,888.00
$140,300.00
$903,423.00
$451,282.00
$195,900.00
$173,500.00
$376,600.00
$204,282.00
$175,900.00
$131,300.00
$400,100.00
$162,150.00
$153,475.00
$46.03
$28.32
$322.76
$28.06
$199.81
$99.81
$43.33
$38.37
$84.42
$45.79
$39.43
$26.26
$80.02
$32.43
$30.70
100.00000
100.00000
100.00000
100.00000
100.00000
100.00000
100.00000
100.00000
100.00000
100.00000
100.00000
100.00000
100.00000
100.00000
100.00000
00064
00064
02018
00064
02018
00560
00064
01777
01385
00560
00064
00064
00003
02349
00145
Hunt Oil Company
Hunt Oil Company
Basin Exploration, Inc.
Hunt Oil Company
Basin Exploration, Inc.
Seneca Resources Corporation
Hunt Oil Company
Ocean Energy, Inc.
Chieftain International (U.S.) Inc.
Seneca Resources Corporation
Hunt Oil Company
Hunt Oil Company
Union Oil Company of California
Magnum Hunter Production, Inc.
J. M. Huber Corporation
Bid TypeOCSNumber Block
BlockSize
BlockUnit Company Percent(%) Company Name
Amount Bid/Tract Unit
TotalBonus Rank
$1,724,105.00
$756,782.00
$562,250.00
4
3
2
***
***
***
*** TRACT TOTALS
*** TRACT TOTALS
*** TRACT TOTALS
G21592
G21593
G21595
TOTAL BIDS
TOTAL BIDS
TOTAL BIDS
TOTAL AMOUNT EXPOSED
TOTAL AMOUNT EXPOSED
TOTAL AMOUNT EXPOSED
16 2/3% ROY
16 2/3% ROY
16 2/3% ROY
16 2/3% ROY
16 2/3% ROY
16 2/3% ROY
16 2/3% ROY
16 2/3% ROY
16 2/3% ROY

UNITED STATES DEPARTMENT OF THE INTERIORMINERALS MANAGEMENT SERVICE
GULF OF MEXICO REGION
POSTSALE21-JUN-2000PAGE: 11
Final Bid Recap (all Bids by Area/Tract)Sale Number : 175Sale Identifier: CENTRAL GULF OF MEXICOSale Date : 15-MAR-2000Region Name : Gulf of Mexico OCS Region
SPFBDCAP
LA3Area Vermilion AreaArea Name
G21597 5,000.00A 156 1 $165,000.00 $33.00 100.0000001364 Newfield Exploration Company
Bid TypeOCSNumber Block
BlockSize
BlockUnit Company Percent(%) Company Name
Amount Bid/Tract Unit
TotalBonus Rank
16 2/3% ROY

UNITED STATES DEPARTMENT OF THE INTERIORMINERALS MANAGEMENT SERVICE
GULF OF MEXICO REGION
POSTSALE21-JUN-2000PAGE: 12
Final Bid Recap (all Bids by Area/Tract)Sale Number : 175Sale Identifier: CENTRAL GULF OF MEXICOSale Date : 15-MAR-2000Region Name : Gulf of Mexico OCS Region
'R' Denotes Rejected Tract.
SPFBDCAP
LA3BArea Vermilion Area, South AdditionArea Name
G21598
G21599
G21600
G21601
G21602
G21603
G21604
G21605
G21606
G21607
5,000.00
5,000.00
5,597.57
5,000.00
5,000.00
5,000.00
5,000.00
5,000.00
5,000.00
4,020.43
A
A
A
A
A
A
A
A
A
A
269
276
282
319
353
358
359
372
373
378
1
1
2
1
2
1
1
1
1
2
1
1
1
$333,333.00
$750,000.00
$227,227.00
$3,175,282.00
$356,000.00
$379,319.00
$289,000.00
$356,500.00
$356,500.00
$153,150.00
$285,000.00
$260,000.00
$513,500.00
$66.67
$150.00
$45.45
$567.26
$63.60
$75.86
$57.80
$71.30
$71.30
$30.63
$57.00
$52.00
$127.72
100.00000
100.00000
100.00000
100.00000
100.00000
74.00000 22.00000 4.00000
100.00000
100.00000
100.00000
100.00000
100.00000
100.00000
100.00000
00282
01834
01855
00560
01364
010010197801999
00185
00981
00981
02349
00981
00981
00981
CNG Producing Company
Stone Energy Corporation
Vastar Resources, Inc.
Seneca Resources Corporation
Newfield Exploration Company
IP Petroleum Company, Inc.The William G. Helis Company, L.L.C.Houston Energy, Inc.
Samedan Oil Corporation
Anadarko Petroleum Corporation
Anadarko Petroleum Corporation
Magnum Hunter Production, Inc.
Anadarko Petroleum Corporation
Anadarko Petroleum Corporation
Anadarko Petroleum Corporation
Bid TypeOCSNumber Block
BlockSize
BlockUnit Company Percent(%) Company Name
Amount Bid/Tract Unit
TotalBonus Rank
$977,227.00
$3,531,282.00
$509,650.00
2
2
2
***
***
***
*** TRACT TOTALS
*** TRACT TOTALS
*** TRACT TOTALS
G21599
G21600
G21604
TOTAL BIDS
TOTAL BIDS
TOTAL BIDS
TOTAL AMOUNT EXPOSED
TOTAL AMOUNT EXPOSED
TOTAL AMOUNT EXPOSED
16 2/3% ROY
16 2/3% ROY
16 2/3% ROY
16 2/3% ROY
16 2/3% ROY
16 2/3% ROY
16 2/3% ROY
16 2/3% ROY
16 2/3% ROY
16 2/3% ROYR

UNITED STATES DEPARTMENT OF THE INTERIORMINERALS MANAGEMENT SERVICE
GULF OF MEXICO REGION
POSTSALE21-JUN-2000PAGE: 13
Final Bid Recap (all Bids by Area/Tract)Sale Number : 175Sale Identifier: CENTRAL GULF OF MEXICOSale Date : 15-MAR-2000Region Name : Gulf of Mexico OCS Region
SPFBDCAP
LA3BArea Vermilion Area, South AdditionArea Name
G21608
G21609
G21610
G21611
G21612
5,000.00
5,000.00
3,984.33
5,000.00
5,000.00
A
A
A
A
A
382
383
399
405
411
1
1
1
1
2
1
$242,000.00
$542,000.00
$1,037,774.00
$258,000.00
$153,000.00
$458,000.00
$48.40
$108.40
$260.46
$51.60
$30.60
$91.60
100.00000
100.00000
100.00000
100.00000
100.00000
100.00000
00981
00981
02312
00981
00185
00981
Anadarko Petroleum Corporation
Anadarko Petroleum Corporation
McMoRan Oil & Gas LLC
Anadarko Petroleum Corporation
Samedan Oil Corporation
Anadarko Petroleum Corporation
Bid TypeOCSNumber Block
BlockSize
BlockUnit Company Percent(%) Company Name
Amount Bid/Tract Unit
TotalBonus Rank
$411,000.002*** *** TRACT TOTALSG21611 TOTAL BIDS TOTAL AMOUNT EXPOSED
16 2/3% ROY
16 2/3% ROY
16 2/3% ROY
16 2/3% ROY
16 2/3% ROY

UNITED STATES DEPARTMENT OF THE INTERIORMINERALS MANAGEMENT SERVICE
GULF OF MEXICO REGION
POSTSALE21-JUN-2000PAGE: 14
Final Bid Recap (all Bids by Area/Tract)Sale Number : 175Sale Identifier: CENTRAL GULF OF MEXICOSale Date : 15-MAR-2000Region Name : Gulf of Mexico OCS Region
SPFBDCAP
LA3AArea South Marsh Island AreaArea Name
G21613
G21614
G21615
G21616
5,000.00
3,078.41
5,000.00
5,000.00
A
A
A
A
9
35
38
51
1
1
2
3
1
2
3
1
$165,000.00
$353,970.00
$212,662.00
$169,855.00
$838,000.00
$416,005.00
$355,088.00
$1,465,000.00
$33.00
$114.98
$69.08
$55.18
$167.60
$83.20
$71.02
$293.00
100.00000
75.00000 25.00000 100.00000
100.00000
100.00000
100.00000
50.00000 50.00000
60.00000 40.00000
00078
017040234902401
02421
00185
00222
0138502401
0138502148
Chevron U.S.A. Inc.
Remington Oil and Gas CorporationMagnum Hunter Production, Inc.Equitable Production (Gulf) Company
Devon Energy Production Company, L.P.
Samedan Oil Corporation
Aviara Energy Corporation
Chieftain International (U.S.) Inc.Equitable Production (Gulf) Company
Chieftain International (U.S.) Inc.Westport Oil and Gas Company, Inc.
Bid TypeOCSNumber Block
BlockSize
BlockUnit Company Percent(%) Company Name
Amount Bid/Tract Unit
TotalBonus Rank
$736,487.00
$1,609,093.00
3
3
***
***
*** TRACT TOTALS
*** TRACT TOTALS
G21614
G21615
TOTAL BIDS
TOTAL BIDS
TOTAL AMOUNT EXPOSED
TOTAL AMOUNT EXPOSED
16 2/3% ROY
16 2/3% ROY
16 2/3% ROY
16 2/3% ROY

UNITED STATES DEPARTMENT OF THE INTERIORMINERALS MANAGEMENT SERVICE
GULF OF MEXICO REGION
POSTSALE21-JUN-2000PAGE: 15
Final Bid Recap (all Bids by Area/Tract)Sale Number : 175Sale Identifier: CENTRAL GULF OF MEXICOSale Date : 15-MAR-2000Region Name : Gulf of Mexico OCS Region
SPFBDCAP
LA3CArea South Marsh Island Area, South AdditionArea Name
G21617
G21618
G21619
G21620
G21621
G21622
G21623
G21624
G21625
G21626
G21627
G21628
5,000.00
5,000.00
5,000.00
5,000.00
5,000.00
5,000.00
5,000.00
3,401.62
5,000.00
5,000.00
3,582.10
2,500.00
A
A
A
A
A
A
A
A
A
A
A
A
92
93
97
129
154
163
164
166
178
187
199
200
1
1
1
1
1
1
1
1
2
1
1
1
1
$133,100.00
$231,200.00
$151,750.00
$138,855.00
$126,000.00
$126,000.00
$126,000.00
$1,529,885.00
$85,500.00
$126,000.00
$126,000.00
$181,850.00
$118,500.00
$26.62
$46.24
$30.35
$27.77
$25.20
$25.20
$25.20
$449.75
$25.14
$25.20
$25.20
$50.77
$47.40
75.00000 25.00000
75.00000 25.00000
75.00000 25.00000
100.00000
100.00000
100.00000
100.00000
100.00000
100.00000
100.00000
100.00000
100.00000
100.00000
0170402349
0170402349
0004802222
02421
00981
00981
00981
02025
00981
00981
00981
00981
00981
Remington Oil and Gas CorporationMagnum Hunter Production, Inc.
Remington Oil and Gas CorporationMagnum Hunter Production, Inc.
Forest Oil CorporationPetroQuest Energy One, L.L.C.
Devon Energy Production Company, L.P.
Anadarko Petroleum Corporation
Anadarko Petroleum Corporation
Anadarko Petroleum Corporation
Coastal Oil & Gas USA, L.P.
Anadarko Petroleum Corporation
Anadarko Petroleum Corporation
Anadarko Petroleum Corporation
Anadarko Petroleum Corporation
Anadarko Petroleum Corporation
Bid TypeOCSNumber Block
BlockSize
BlockUnit Company Percent(%) Company Name
Amount Bid/Tract Unit
TotalBonus Rank
$1,615,385.002*** *** TRACT TOTALSG21624 TOTAL BIDS TOTAL AMOUNT EXPOSED
16 2/3% ROY
16 2/3% ROY
16 2/3% ROY
16 2/3% ROY
16 2/3% ROY
16 2/3% ROY
16 2/3% ROY
16 2/3% ROY
16 2/3% ROY
16 2/3% ROY
16 2/3% ROY
16 2/3% ROY

UNITED STATES DEPARTMENT OF THE INTERIORMINERALS MANAGEMENT SERVICE
GULF OF MEXICO REGION
POSTSALE21-JUN-2000PAGE: 16
Final Bid Recap (all Bids by Area/Tract)Sale Number : 175Sale Identifier: CENTRAL GULF OF MEXICOSale Date : 15-MAR-2000Region Name : Gulf of Mexico OCS Region
SPFBDCAP
LA3DArea South Marsh Island Area, North AdditionArea Name
G21629
G21630
G21631
G21632
1,756.63
5,000.00
5,000.00
5,000.00
A
A
A
A
234
273
276
277
1
1
1
2
1
$652,298.00
$178,282.00
$2,760,282.00
$2,107,777.00
$178,282.00
$371.33
$35.66
$552.06
$421.56
$35.66
100.00000
100.00000
100.00000
82.50000 17.50000
100.00000
02018
00560
00560
0100101978
00560
Basin Exploration, Inc.
Seneca Resources Corporation
Seneca Resources Corporation
IP Petroleum Company, Inc.The William G. Helis Company, L.L.C.
Seneca Resources Corporation
Bid TypeOCSNumber Block
BlockSize
BlockUnit Company Percent(%) Company Name
Amount Bid/Tract Unit
TotalBonus Rank
$4,868,059.002*** *** TRACT TOTALSG21631 TOTAL BIDS TOTAL AMOUNT EXPOSED
16 2/3% ROY
16 2/3% ROY
16 2/3% ROY
16 2/3% ROY

UNITED STATES DEPARTMENT OF THE INTERIORMINERALS MANAGEMENT SERVICE
GULF OF MEXICO REGION
POSTSALE21-JUN-2000PAGE: 17
Final Bid Recap (all Bids by Area/Tract)Sale Number : 175Sale Identifier: CENTRAL GULF OF MEXICOSale Date : 15-MAR-2000Region Name : Gulf of Mexico OCS Region
SPFBDCAP
LA4Area Eugene Island AreaArea Name
G21633
G21634
G21635
G21636
G21637
G21638
G21639
G21640
G21641
1,897.36
5,000.00
5,000.00
5,000.00
5,000.00
3,824.72
5,000.00
5,000.02
5,000.00
A
A
A
A
A
A
A
A
A
19
31
40
84
99
129A
213
223
235
1
1
2
1
1
1
2
1
1
1
1
$87,282.00
$228,282.00
$211,500.00
$281,877.00
$146,450.00
$812,349.00
$138,875.00
$451,100.00
$1,131,000.00
$215,413.00
$156,000.00
$46.00
$45.66
$42.30
$56.38
$29.29
$162.47
$27.78
$117.94
$226.20
$43.08
$31.20
100.00000
100.00000
100.00000
100.00000
50.00000 50.00000
100.00000
50.00000 50.00000
100.00000
100.00000
100.00000
100.00000
00560
00560
00282
01732
0233002397
02018
0233002397
00003
02169
02211
02169
Seneca Resources Corporation
Seneca Resources Corporation
CNG Producing Company
Cockrell Oil and Gas, L.P.
Cheniere Energy, Inc.Samson Offshore Company
Basin Exploration, Inc.
Cheniere Energy, Inc.Samson Offshore Company
Union Oil Company of California
Spinnaker Exploration Company, L.L.C.
EEX Corporation
Spinnaker Exploration Company, L.L.C.
Bid TypeOCSNumber Block
BlockSize
BlockUnit Company Percent(%) Company Name
Amount Bid/Tract Unit
TotalBonus Rank
$439,782.00
$951,224.00
2
2
***
***
*** TRACT TOTALS
*** TRACT TOTALS
G21634
G21637
TOTAL BIDS
TOTAL BIDS
TOTAL AMOUNT EXPOSED
TOTAL AMOUNT EXPOSED
16 2/3% ROY
16 2/3% ROY
16 2/3% ROY
16 2/3% ROY
16 2/3% ROY
16 2/3% ROY
16 2/3% ROY
16 2/3% ROY
16 2/3% ROY

UNITED STATES DEPARTMENT OF THE INTERIORMINERALS MANAGEMENT SERVICE
GULF OF MEXICO REGION
POSTSALE21-JUN-2000PAGE: 18
Final Bid Recap (all Bids by Area/Tract)Sale Number : 175Sale Identifier: CENTRAL GULF OF MEXICOSale Date : 15-MAR-2000Region Name : Gulf of Mexico OCS Region
SPFBDCAP
LA4AArea Eugene Island Area, South AdditionArea Name
G21642
G21643
G21644
G21645
G21646
G21647
G21648
5,000.00
2,500.00
5,000.02
5,000.00
5,000.00
5,000.00
5,000.00
A
A
A
A
A
A
A
302
307
311
343
344
345
347
1
2
1
1
1
1
2
1
2
3
1
$251,152.00
$227,227.00
$126,175.00
$517,000.00
$156,000.00
$562,500.00
$456,000.00
$4,187,500.00
$142,000.00
$131,228.00
$562,500.00
$50.23
$45.45
$50.47
$103.40
$31.20
$112.50
$91.20
$837.50
$28.40
$26.25
$112.50
100.00000
100.00000
75.00000 25.00000
60.00000 40.00000
100.00000
50.00000 50.00000 100.00000
50.00000 50.00000 100.00000
100.00000
100.00000
01704
01855
0218901855
0138502148
02169
009810168902169
009810168901385
02211
00981
Remington Oil and Gas Corporation
Vastar Resources, Inc.
Bellwether Exploration CompanyVastar Resources, Inc.
Chieftain International (U.S.) Inc.Westport Oil and Gas Company, Inc.
Spinnaker Exploration Company, L.L.C.
Anadarko Petroleum CorporationMurphy Exploration & Production CompanySpinnaker Exploration Company, L.L.C.
Anadarko Petroleum CorporationMurphy Exploration & Production CompanyChieftain International (U.S.) Inc.
EEX Corporation
Anadarko Petroleum Corporation
Bid TypeOCSNumber Block
BlockSize
BlockUnit Company Percent(%) Company Name
Amount Bid/Tract Unit
TotalBonus Rank
$478,379.00
$1,018,500.00
$4,460,728.00
2
2
3
***
***
***
*** TRACT TOTALS
*** TRACT TOTALS
*** TRACT TOTALS
G21642
G21646
G21647
TOTAL BIDS
TOTAL BIDS
TOTAL BIDS
TOTAL AMOUNT EXPOSED
TOTAL AMOUNT EXPOSED
TOTAL AMOUNT EXPOSED
16 2/3% ROY
16 2/3% ROY
16 2/3% ROY
16 2/3% ROY
16 2/3% ROY
16 2/3% ROY
16 2/3% ROY

UNITED STATES DEPARTMENT OF THE INTERIORMINERALS MANAGEMENT SERVICE
GULF OF MEXICO REGION
POSTSALE21-JUN-2000PAGE: 19
Final Bid Recap (all Bids by Area/Tract)Sale Number : 175Sale Identifier: CENTRAL GULF OF MEXICOSale Date : 15-MAR-2000Region Name : Gulf of Mexico OCS Region
SPFBDCAP
LA4AArea Eugene Island Area, South AdditionArea Name
G21649 5,000.04A 395 1
2
$863,010.00
$252,000.00
$172.60
$50.40
100.00000
50.00000 50.00000
00730
0018502169
Walter Oil & Gas Corporation
Samedan Oil CorporationSpinnaker Exploration Company, L.L.C.
Bid TypeOCSNumber Block
BlockSize
BlockUnit Company Percent(%) Company Name
Amount Bid/Tract Unit
TotalBonus Rank
$1,115,010.002*** *** TRACT TOTALSG21649 TOTAL BIDS TOTAL AMOUNT EXPOSED
16 2/3% ROY

UNITED STATES DEPARTMENT OF THE INTERIORMINERALS MANAGEMENT SERVICE
GULF OF MEXICO REGION
POSTSALE21-JUN-2000PAGE: 20
Final Bid Recap (all Bids by Area/Tract)Sale Number : 175Sale Identifier: CENTRAL GULF OF MEXICOSale Date : 15-MAR-2000Region Name : Gulf of Mexico OCS Region
SPFBDCAP
LA5Area Ship Shoal AreaArea Name
G21650
G21651
G21652
G21653
G21654
G21655
G21656
G21657
4,978.82
5,000.00
5,000.00
5,000.00
5,000.00
5,000.00
5,000.00
2,500.00
A
A
A
A
A
A
A
A
62
86
98
104
107
109
127
225
1
1
1
1
1
1
1
2
1
2
$916,740.00
$757,000.00
$203,100.00
$1,063,423.00
$353,100.00
$353,100.00
$227,227.00
$167,798.00
$2,350,400.00
$77,030.00
$184.13
$151.40
$40.62
$212.68
$70.62
$70.62
$45.45
$33.56
$940.16
$30.81
100.00000
60.00000 40.00000
100.00000
100.00000
100.00000
100.00000
100.00000
100.00000
100.00000
100.00000
02401
0138502148
02268
02018
02268
02268
01855
02018
00282
02189
Equitable Production (Gulf) Company
Chieftain International (U.S.) Inc.Westport Oil and Gas Company, Inc.
Bois d'Arc Offshore Ltd.
Basin Exploration, Inc.
Bois d'Arc Offshore Ltd.
Bois d'Arc Offshore Ltd.
Vastar Resources, Inc.
Basin Exploration, Inc.
CNG Producing Company
Bellwether Exploration Company
Bid TypeOCSNumber Block
BlockSize
BlockUnit Company Percent(%) Company Name
Amount Bid/Tract Unit
TotalBonus Rank
$395,025.00
$2,427,430.00
2
2
***
***
*** TRACT TOTALS
*** TRACT TOTALS
G21656
G21657
TOTAL BIDS
TOTAL BIDS
TOTAL AMOUNT EXPOSED
TOTAL AMOUNT EXPOSED
16 2/3% ROY
16 2/3% ROY
16 2/3% ROY
16 2/3% ROY
16 2/3% ROY
16 2/3% ROY
16 2/3% ROY
16 2/3% ROY

UNITED STATES DEPARTMENT OF THE INTERIORMINERALS MANAGEMENT SERVICE
GULF OF MEXICO REGION
POSTSALE21-JUN-2000PAGE: 21
Final Bid Recap (all Bids by Area/Tract)Sale Number : 175Sale Identifier: CENTRAL GULF OF MEXICOSale Date : 15-MAR-2000Region Name : Gulf of Mexico OCS Region
SPFBDCAP
LA5AArea Ship Shoal Area, South AdditionArea Name
G21658
G21659
G21660
G21661
G21662
5,000.00
5,000.00
5,000.00
5,277.82
5,000.00
A
A
A
A
A
263
275
281
331
338
1
1
1
1
1
$215,824.00
$415,990.00
$215,925.00
$181,500.00
$165,000.00
$43.16
$83.20
$43.19
$34.39
$33.00
100.00000
100.00000
100.00000
100.00000
100.00000
02211
02421
02211
02211
00981
EEX Corporation
Devon Energy Production Company, L.P.
EEX Corporation
EEX Corporation
Anadarko Petroleum Corporation
Bid TypeOCSNumber Block
BlockSize
BlockUnit Company Percent(%) Company Name
Amount Bid/Tract Unit
TotalBonus Rank
16 2/3% ROY
16 2/3% ROY
16 2/3% ROY
16 2/3% ROY
16 2/3% ROY
UNITED STATES DEPARTMENT OF THE INTERIORMINERALS MANAGEMENT SERVICE
GULF OF MEXICO REGION
POSTSALE21-JUN-2000PAGE: 22
Final Bid Recap (all Bids by Area/Tract)Sale Number : 175Sale Identifier: CENTRAL GULF OF MEXICOSale Date : 15-MAR-2000Region Name : Gulf of Mexico OCS Region
SPFBDCAP
LA6Area South Timbalier AreaArea Name
G21663
G21664
G21665
G21666
G21667
G21668
G21669
G21670
G21671
1,564.65
5,000.00
4,753.88
5,000.00
5,000.00
5,000.00
4,731.10
3,750.00
5,000.00
A
A
A
A
A
A
A
A
A
16
47
141
142
144
167
168
188
199
1
1
2
1
1
1
1
1
1
1
$41,000.00
$157,750.00
$140,000.00
$137,929.00
$137,710.00
$215,024.00
$137,611.00
$215,123.00
$100,000.00
$277,005.00
$26.20
$31.55
$28.00
$29.01
$27.54
$43.00
$27.52
$45.47
$26.67
$55.40
100.00000
75.00000 25.00000 100.00000
100.00000
100.00000
100.00000
100.00000
100.00000
100.00000
50.00000 50.00000
02268
000480222200078
02211
02211
02211
02211
02211
02211
0022202189
Bois d'Arc Offshore Ltd.
Forest Oil CorporationPetroQuest Energy One, L.L.C.Chevron U.S.A. Inc.
EEX Corporation
EEX Corporation
EEX Corporation
EEX Corporation
EEX Corporation
EEX Corporation
Aviara Energy CorporationBellwether Exploration Company
Bid TypeOCSNumber Block
BlockSize
BlockUnit Company Percent(%) Company Name
Amount Bid/Tract Unit
TotalBonus Rank
$297,750.002*** *** TRACT TOTALSG21664 TOTAL BIDS TOTAL AMOUNT EXPOSED
16 2/3% ROY
16 2/3% ROY
16 2/3% ROY
16 2/3% ROY
16 2/3% ROY
16 2/3% ROY
16 2/3% ROY
16 2/3% ROY
16 2/3% ROY

UNITED STATES DEPARTMENT OF THE INTERIORMINERALS MANAGEMENT SERVICE
GULF OF MEXICO REGION
POSTSALE21-JUN-2000PAGE: 23
Final Bid Recap (all Bids by Area/Tract)Sale Number : 175Sale Identifier: CENTRAL GULF OF MEXICOSale Date : 15-MAR-2000Region Name : Gulf of Mexico OCS Region
SPFBDCAP
LA6AArea South Timbalier Area, South AdditionArea Name
G21672
G21673
G21674
G21675
G21676
G21677
G21678
G21679
G21680
G21681
G21682
G21683
4,639.98
5,000.00
5,000.00
5,000.00
5,000.00
5,000.00
5,000.00
5,000.00
5,000.00
5,000.00
5,000.00
4,503.30
A
A
A
A
A
A
A
A
A
A
A
A
215
224
226
227
234
254
267
268
274
293
298
299
1
1
1
1
1
1
2
1
1
1
1
1
1
2
$190,611.00
$130,097.00
$190,092.00
$137,711.00
$239,000.00
$234,040.00
$153,150.00
$889,350.00
$426,160.00
$861,000.00
$239,000.00
$225,627.00
$225,728.00
$161,465.00
$41.08
$26.02
$38.02
$27.54
$47.80
$46.81
$30.63
$177.87
$85.23
$172.20
$47.80
$45.13
$50.13
$35.85
100.00000
100.00000
100.00000
100.00000
100.00000
100.00000
100.00000
100.00000
100.00000
100.00000
60.00000 40.00000
100.00000
100.00000
100.00000
02211
02211
02211
02211
00689
00730
02349
02401
02401
02169
0214801385
02211
02211
02222
EEX Corporation
EEX Corporation
EEX Corporation
EEX Corporation
Shell Offshore Inc.
Walter Oil & Gas Corporation
Magnum Hunter Production, Inc.
Equitable Production (Gulf) Company
Equitable Production (Gulf) Company
Spinnaker Exploration Company, L.L.C.
Westport Oil and Gas Company, Inc.Chieftain International (U.S.) Inc.
EEX Corporation
EEX Corporation
PetroQuest Energy One, L.L.C.
Bid TypeOCSNumber Block
BlockSize
BlockUnit Company Percent(%) Company Name
Amount Bid/Tract Unit
TotalBonus Rank
$387,190.00
$387,193.00
2
2
***
***
*** TRACT TOTALS
*** TRACT TOTALS
G21677
G21683
TOTAL BIDS
TOTAL BIDS
TOTAL AMOUNT EXPOSED
TOTAL AMOUNT EXPOSED
16 2/3% ROY
16 2/3% ROY
16 2/3% ROY
16 2/3% ROY
16 2/3% ROY
16 2/3% ROY
16 2/3% ROY
16 2/3% ROY
16 2/3% ROY
16 2/3% ROY
16 2/3% ROY
16 2/3% ROY

UNITED STATES DEPARTMENT OF THE INTERIORMINERALS MANAGEMENT SERVICE
GULF OF MEXICO REGION
POSTSALE21-JUN-2000PAGE: 24
Final Bid Recap (all Bids by Area/Tract)Sale Number : 175Sale Identifier: CENTRAL GULF OF MEXICOSale Date : 15-MAR-2000Region Name : Gulf of Mexico OCS Region
SPFBDCAP
LA6AArea South Timbalier Area, South AdditionArea Name
G21684
G21685
5,000.00
5,000.00
A
A
306
308
1
1
$989,000.00
$266,000.00
$197.80
$53.20
60.00000 40.00000
100.00000
0214801385
00981
Westport Oil and Gas Company, Inc.Chieftain International (U.S.) Inc.
Anadarko Petroleum Corporation
Bid TypeOCSNumber Block
BlockSize
BlockUnit Company Percent(%) Company Name
Amount Bid/Tract Unit
TotalBonus Rank
16 2/3% ROY
16 2/3% ROY

UNITED STATES DEPARTMENT OF THE INTERIORMINERALS MANAGEMENT SERVICE
GULF OF MEXICO REGION
POSTSALE21-JUN-2000PAGE: 25
Final Bid Recap (all Bids by Area/Tract)Sale Number : 175Sale Identifier: CENTRAL GULF OF MEXICOSale Date : 15-MAR-2000Region Name : Gulf of Mexico OCS Region
SPFBDCAP
LA7Area Grand Isle AreaArea Name
G21686 5,000.00A 34 1 $153,000.00 $30.60 100.0000001364 Newfield Exploration Company
Bid TypeOCSNumber Block
BlockSize
BlockUnit Company Percent(%) Company Name
Amount Bid/Tract Unit
TotalBonus Rank
16 2/3% ROY

UNITED STATES DEPARTMENT OF THE INTERIORMINERALS MANAGEMENT SERVICE
GULF OF MEXICO REGION
POSTSALE21-JUN-2000PAGE: 26
Final Bid Recap (all Bids by Area/Tract)Sale Number : 175Sale Identifier: CENTRAL GULF OF MEXICOSale Date : 15-MAR-2000Region Name : Gulf of Mexico OCS Region
SPFBDCAP
LA7AArea Grand Isle Area, South AdditionArea Name
G21687
G21688
4,539.89
5,000.00
A
A
117
120
1
1
$319,000.00
$350,000.00
$70.27
$70.00
50.00000 50.00000
100.00000
0068900981
00981
Shell Offshore Inc.Anadarko Petroleum Corporation
Anadarko Petroleum Corporation
Bid TypeOCSNumber Block
BlockSize
BlockUnit Company Percent(%) Company Name
Amount Bid/Tract Unit
TotalBonus Rank
16 2/3% ROY
16 2/3% ROY

UNITED STATES DEPARTMENT OF THE INTERIORMINERALS MANAGEMENT SERVICE
GULF OF MEXICO REGION
POSTSALE21-JUN-2000PAGE: 27
Final Bid Recap (all Bids by Area/Tract)Sale Number : 175Sale Identifier: CENTRAL GULF OF MEXICOSale Date : 15-MAR-2000Region Name : Gulf of Mexico OCS Region
SPFBDCAP
LA8Area West Delta AreaArea Name
G21689
G21690
1,250.00
5,000.00
A
A
28
46
1
1
$50,000.00
$175,000.00
$40.00
$35.00
100.00000
100.00000
00078
02079
Chevron U.S.A. Inc.
CXY Energy Offshore Inc.
Bid TypeOCSNumber Block
BlockSize
BlockUnit Company Percent(%) Company Name
Amount Bid/Tract Unit
TotalBonus Rank
16 2/3% ROY
16 2/3% ROY

UNITED STATES DEPARTMENT OF THE INTERIORMINERALS MANAGEMENT SERVICE
GULF OF MEXICO REGION
POSTSALE21-JUN-2000PAGE: 28
Final Bid Recap (all Bids by Area/Tract)Sale Number : 175Sale Identifier: CENTRAL GULF OF MEXICOSale Date : 15-MAR-2000Region Name : Gulf of Mexico OCS Region
SPFBDCAP
LA8AArea West Delta Area, South AdditionArea Name
G21691 4,999.97A 138 1 $266,948.00 $53.39 100.0000000276 Exxon Mobil Corporation
Bid TypeOCSNumber Block
BlockSize
BlockUnit Company Percent(%) Company Name
Amount Bid/Tract Unit
TotalBonus Rank
16 2/3% ROY

UNITED STATES DEPARTMENT OF THE INTERIORMINERALS MANAGEMENT SERVICE
GULF OF MEXICO REGION
POSTSALE21-JUN-2000PAGE: 29
Final Bid Recap (all Bids by Area/Tract)Sale Number : 175Sale Identifier: CENTRAL GULF OF MEXICOSale Date : 15-MAR-2000Region Name : Gulf of Mexico OCS Region
SPFBDCAP
LA9Area South Pass AreaArea Name
G21692
G21693
G21694
G21695
G21696
3,858.74
513.68
3,993.56
4,747.93
4,999.97
A
A
A
A
A
18
19
32
38
55
1
1
1
1
1
$324,500.00
$34,000.00
$321,000.00
$306,128.00
$292,500.00
$84.09
$66.19
$80.38
$64.48
$58.50
50.00000 50.00000
100.00000
100.00000
100.00000
100.00000
0068901777
01777
01777
02018
01103
Shell Offshore Inc.Ocean Energy, Inc.
Ocean Energy, Inc.
Ocean Energy, Inc.
Basin Exploration, Inc.
EOG Resources, Inc.
Bid TypeOCSNumber Block
BlockSize
BlockUnit Company Percent(%) Company Name
Amount Bid/Tract Unit
TotalBonus Rank
16 2/3% ROY
16 2/3% ROY
16 2/3% ROY
16 2/3% ROY
16 2/3% ROY

UNITED STATES DEPARTMENT OF THE INTERIORMINERALS MANAGEMENT SERVICE
GULF OF MEXICO REGION
POSTSALE21-JUN-2000PAGE: 30
Final Bid Recap (all Bids by Area/Tract)Sale Number : 175Sale Identifier: CENTRAL GULF OF MEXICOSale Date : 15-MAR-2000Region Name : Gulf of Mexico OCS Region
SPFBDCAP
LA9AArea South Pass Area, South and East AdditionArea Name
G21697
G21698
G21699
4,999.97
4,999.97
4,999.97
A
A
A
63
90
91
1
1
1
$163,020.00
$338,700.00
$178,700.00
$32.60
$67.74
$35.74
100.00000
50.00000 50.00000
50.00000 50.00000
00730
0023100730
0023100730
Walter Oil & Gas Corporation
Pogo Producing CompanyWalter Oil & Gas Corporation
Pogo Producing CompanyWalter Oil & Gas Corporation
Bid TypeOCSNumber Block
BlockSize
BlockUnit Company Percent(%) Company Name
Amount Bid/Tract Unit
TotalBonus Rank
16 2/3% ROY
16 2/3% ROY
16 2/3% ROY

UNITED STATES DEPARTMENT OF THE INTERIORMINERALS MANAGEMENT SERVICE
GULF OF MEXICO REGION
POSTSALE21-JUN-2000PAGE: 31
Final Bid Recap (all Bids by Area/Tract)Sale Number : 175Sale Identifier: CENTRAL GULF OF MEXICOSale Date : 15-MAR-2000Region Name : Gulf of Mexico OCS Region
SPFBDCAP
LA10Area Main Pass AreaArea Name
G21700
G21701
G21702
G21703
G21704
G21705
1,127.86
4,994.55
4,994.55
4,994.55
4,999.97
4,999.97
A
A
A
A
A
A
7
27
62
99
149
150
1
1
1
1
2
1
1
$628,296.00
$184,950.00
$201,900.00
$256,303.00
$203,005.00
$177,000.00
$163,000.00
$557.07
$37.03
$40.42
$51.32
$40.65
$35.40
$32.60
100.00000
100.00000
100.00000
100.00000
50.00000 50.00000
100.00000
100.00000
00105
02421
00231
01832
0022202189
01777
00730
Apache Corporation
Devon Energy Production Company, L.P.
Pogo Producing Company
Forcenergy Inc
Aviara Energy CorporationBellwether Exploration Company
Ocean Energy, Inc.
Walter Oil & Gas Corporation
Bid TypeOCSNumber Block
BlockSize
BlockUnit Company Percent(%) Company Name
Amount Bid/Tract Unit
TotalBonus Rank
$459,308.002*** *** TRACT TOTALSG21703 TOTAL BIDS TOTAL AMOUNT EXPOSED
16 2/3% ROY
16 2/3% ROY
16 2/3% ROY
16 2/3% ROY
16 2/3% ROY
16 2/3% ROY

UNITED STATES DEPARTMENT OF THE INTERIORMINERALS MANAGEMENT SERVICE
GULF OF MEXICO REGION
POSTSALE21-JUN-2000PAGE: 32
Final Bid Recap (all Bids by Area/Tract)Sale Number : 175Sale Identifier: CENTRAL GULF OF MEXICOSale Date : 15-MAR-2000Region Name : Gulf of Mexico OCS Region
SPFBDCAP
LA10BArea Breton Sound AreaArea Name
G21706 4,448.27A 54 1
2
$434,000.00
$115,000.00
$97.57
$25.85
100.00000
100.00000
00730
02066
Walter Oil & Gas Corporation
Ridgelake Energy, Inc.
Bid TypeOCSNumber Block
BlockSize
BlockUnit Company Percent(%) Company Name
Amount Bid/Tract Unit
TotalBonus Rank
$549,000.002*** *** TRACT TOTALSG21706 TOTAL BIDS TOTAL AMOUNT EXPOSED
16 2/3% ROY

UNITED STATES DEPARTMENT OF THE INTERIORMINERALS MANAGEMENT SERVICE
GULF OF MEXICO REGION
POSTSALE21-JUN-2000PAGE: 33
Final Bid Recap (all Bids by Area/Tract)Sale Number : 175Sale Identifier: CENTRAL GULF OF MEXICOSale Date : 15-MAR-2000Region Name : Gulf of Mexico OCS Region
SPFBDCAP
LA10AArea Main Pass Area, South and East AdditionArea Name
G21707
G21708
G21709
G21710
G21711
G21712
4,994.55
4,994.55
4,994.55
4,994.55
4,994.55
4,560.81
A
A
A
A
A
A
188
239
240
246
262
293
1
2
3
1
1
2
1
2
1
2
1
$441,900.00
$216,705.00
$153,150.00
$276,100.00
$777,777.00
$258,315.00
$258,815.00
$153,150.00
$202,298.00
$162,150.00
$367,000.00
$88.48
$43.39
$30.66
$55.28
$155.73
$51.72
$51.82
$30.66
$40.50
$32.47
$80.47
100.00000
100.00000
100.00000
100.00000
100.00000
100.00000
100.00000
100.00000
100.00000
100.00000
100.00000
00231
02025
02349
00003
02079
02025
02025
02349
01551
02349
00185
Pogo Producing Company
Coastal Oil & Gas USA, L.P.
Magnum Hunter Production, Inc.
Union Oil Company of California
CXY Energy Offshore Inc.
Coastal Oil & Gas USA, L.P.
Coastal Oil & Gas USA, L.P.
Magnum Hunter Production, Inc.
Santa Fe Snyder Corporation
Magnum Hunter Production, Inc.
Samedan Oil Corporation
Bid TypeOCSNumber Block
BlockSize
BlockUnit Company Percent(%) Company Name
Amount Bid/Tract Unit
TotalBonus Rank
$811,755.00
$1,036,092.00
$411,965.00
$364,448.00
3
2
2
2
***
***
***
***
*** TRACT TOTALS
*** TRACT TOTALS
*** TRACT TOTALS
*** TRACT TOTALS
G21707
G21709
G21710
G21711
TOTAL BIDS
TOTAL BIDS
TOTAL BIDS
TOTAL BIDS
TOTAL AMOUNT EXPOSED
TOTAL AMOUNT EXPOSED
TOTAL AMOUNT EXPOSED
TOTAL AMOUNT EXPOSED
16 2/3% ROY
16 2/3% ROY
16 2/3% ROY
16 2/3% ROY
16 2/3% ROY
16 2/3% ROY

UNITED STATES DEPARTMENT OF THE INTERIORMINERALS MANAGEMENT SERVICE
GULF OF MEXICO REGION
POSTSALE21-JUN-2000PAGE: 34
Final Bid Recap (all Bids by Area/Tract)Sale Number : 175Sale Identifier: CENTRAL GULF OF MEXICOSale Date : 15-MAR-2000Region Name : Gulf of Mexico OCS Region
SPFBDCAP
LA11AArea Chandeleur Area, East AdditionArea Name
G21713 5,000.00A 42 1 $456,256.00 $91.25 100.0000001138 El Paso Production GOM Inc.
Bid TypeOCSNumber Block
BlockSize
BlockUnit Company Percent(%) Company Name
Amount Bid/Tract Unit
TotalBonus Rank
16 2/3% ROY

UNITED STATES DEPARTMENT OF THE INTERIORMINERALS MANAGEMENT SERVICE
GULF OF MEXICO REGION
POSTSALE21-JUN-2000PAGE: 35
Final Bid Recap (all Bids by Area/Tract)Sale Number : 175Sale Identifier: CENTRAL GULF OF MEXICOSale Date : 15-MAR-2000Region Name : Gulf of Mexico OCS Region
SPFBDCAP
LA12Area Sabine Pass AreaArea Name
G21714 4,254.41A 9 1 $275,395.00 $64.73 65.00000 32.00000 3.00000
010010197801999
IP Petroleum Company, Inc.The William G. Helis Company, L.L.C.Houston Energy, Inc.
Bid TypeOCSNumber Block
BlockSize
BlockUnit Company Percent(%) Company Name
Amount Bid/Tract Unit
TotalBonus Rank
16 2/3% ROY

UNITED STATES DEPARTMENT OF THE INTERIORMINERALS MANAGEMENT SERVICE
GULF OF MEXICO REGION
POSTSALE21-JUN-2000PAGE: 36
Final Bid Recap (all Bids by Area/Tract)Sale Number : 175Sale Identifier: CENTRAL GULF OF MEXICOSale Date : 15-MAR-2000Region Name : Gulf of Mexico OCS Region
SPFBDCAP
NH16-04Area MobileArea Name
G21715 5,760.00A 945 1
2
$306,256.00
$167,040.00
$53.17
$29.00
100.00000
100.00000
01138
00078
El Paso Production GOM Inc.
Chevron U.S.A. Inc.
Bid TypeOCSNumber Block
BlockSize
BlockUnit Company Percent(%) Company Name
Amount Bid/Tract Unit
TotalBonus Rank
$473,296.002*** *** TRACT TOTALSG21715 TOTAL BIDS TOTAL AMOUNT EXPOSED
16 2/3% ROY

UNITED STATES DEPARTMENT OF THE INTERIORMINERALS MANAGEMENT SERVICE
GULF OF MEXICO REGION
POSTSALE21-JUN-2000PAGE: 37
Final Bid Recap (all Bids by Area/Tract)Sale Number : 175Sale Identifier: CENTRAL GULF OF MEXICOSale Date : 15-MAR-2000Region Name : Gulf of Mexico OCS Region
SPFBDCAP
NH16-07Area Viosca KnollArea Name
G21716
G21717
G21718
G21719
G21720
G21721
G21722
G21723
G21724
G21725
5,760.00
5,760.00
5,760.00
5,411.14
5,760.00
4,538.04
5,760.00
4,475.50
5,760.00
5,760.00
A
A
A
A
A
A
A
A
A
A
117
168
169
202
213
383
386
428
430
476
1
1
1
1
1
1
2
1
1
1
2
1
2
$253,440.00
$506,880.00
$869,760.00
$313,846.00
$195,840.00
$608,097.00
$175,000.00
$758,256.00
$179,020.00
$227,745.00
$156,000.00
$776,256.00
$607,685.00
$44.00
$88.00
$151.00
$58.00
$34.00
$134.00
$38.56
$131.64
$40.00
$39.54
$27.08
$134.77
$105.50
100.00000
100.00000
100.00000
100.00000
100.00000
100.00000
100.00000
100.00000
100.00000
100.00000
100.00000
100.00000
100.00000
00078
00078
00078
00078
00078
00078
02079
01138
02079
02025
00185
01138
02025
Chevron U.S.A. Inc.
Chevron U.S.A. Inc.
Chevron U.S.A. Inc.
Chevron U.S.A. Inc.
Chevron U.S.A. Inc.
Chevron U.S.A. Inc.
CXY Energy Offshore Inc.
El Paso Production GOM Inc.
CXY Energy Offshore Inc.
Coastal Oil & Gas USA, L.P.
Samedan Oil Corporation
El Paso Production GOM Inc.
Coastal Oil & Gas USA, L.P.
Bid TypeOCSNumber Block
BlockSize
BlockUnit Company Percent(%) Company Name
Amount Bid/Tract Unit
TotalBonus Rank
$783,097.00
$383,745.00
$1,383,941.00
2
2
2
***
***
***
*** TRACT TOTALS
*** TRACT TOTALS
*** TRACT TOTALS
G21721
G21724
G21725
TOTAL BIDS
TOTAL BIDS
TOTAL BIDS
TOTAL AMOUNT EXPOSED
TOTAL AMOUNT EXPOSED
TOTAL AMOUNT EXPOSED
16 2/3% ROY
16 2/3% ROY
16 2/3% ROY
16 2/3% ROY
16 2/3% ROY
16 2/3% ROY
16 2/3% ROY
16 2/3% ROY
16 2/3% ROY
16 2/3% ROY
UNITED STATES DEPARTMENT OF THE INTERIORMINERALS MANAGEMENT SERVICE
GULF OF MEXICO REGION
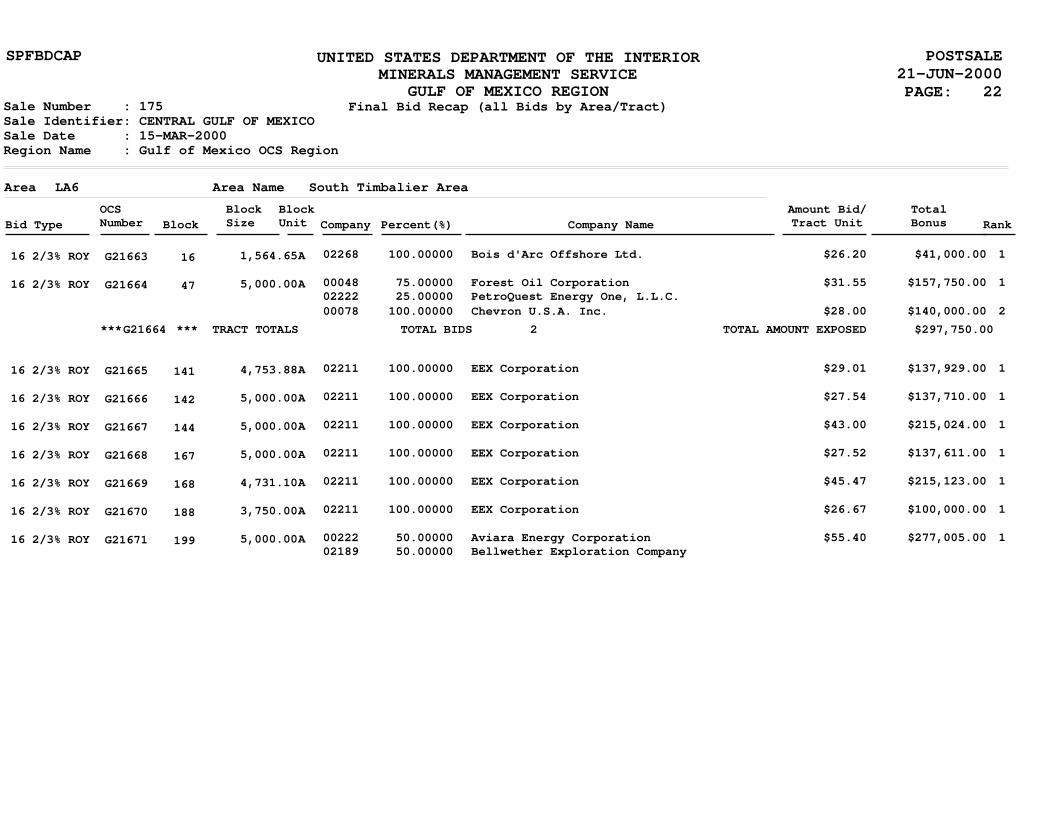
POSTSALE21-JUN-2000PAGE: 38
Final Bid Recap (all Bids by Area/Tract)Sale Number : 175Sale Identifier: CENTRAL GULF OF MEXICOSale Date : 15-MAR-2000Region Name : Gulf of Mexico OCS Region
SPFBDCAP
NH16-07Area Viosca KnollArea Name
G21726
G21727
G21728
G21729
G21730
G21731
G21732
5,760.00
5,138.08
5,760.00
5,760.00
5,760.00
5,760.00
5,760.00
A
A
A
A
A
A
A
477
520
521
522
566
829
908
1
1
2
1
2
3
1
2
3
1
2
3
1
1
$252,885.00
$1,100,000.00
$416,184.00
$656,640.00
$353,685.00
$205,000.00
$353,685.00
$236,160.00
$236,000.00
$2,453,760.00
$353,685.00
$236,160.00
$311,100.00
$153,000.00
$43.90
$214.09
$81.00
$114.00
$61.40
$35.59
$61.40
$41.00
$40.97
$426.00
$61.40
$41.00
$54.01
$26.56
100.00000
100.00000
100.00000
100.00000
100.00000
100.00000
100.00000
100.00000
100.00000
100.00000
100.00000
100.00000
100.00000
100.00000
02025
02079
00078
00078
02025
02079
02025
00078
00185
00078
02025
02079
00282
00185
Coastal Oil & Gas USA, L.P.
CXY Energy Offshore Inc.
Chevron U.S.A. Inc.
Chevron U.S.A. Inc.
Coastal Oil & Gas USA, L.P.
CXY Energy Offshore Inc.
Coastal Oil & Gas USA, L.P.
Chevron U.S.A. Inc.
Samedan Oil Corporation
Chevron U.S.A. Inc.
Coastal Oil & Gas USA, L.P.
CXY Energy Offshore Inc.
CNG Producing Company
Samedan Oil Corporation
Bid TypeOCSNumber Block
BlockSize
BlockUnit Company Percent(%) Company Name
Amount Bid/Tract Unit
TotalBonus Rank
$1,516,184.00
$1,215,325.00
$825,845.00
$3,043,605.00
2
3
3
3
***
***
***
***
*** TRACT TOTALS
*** TRACT TOTALS
*** TRACT TOTALS
*** TRACT TOTALS
G21727
G21728
G21729
G21730
TOTAL BIDS
TOTAL BIDS
TOTAL BIDS
TOTAL BIDS
TOTAL AMOUNT EXPOSED
TOTAL AMOUNT EXPOSED
TOTAL AMOUNT EXPOSED
TOTAL AMOUNT EXPOSED
16 2/3% ROY
16 2/3% ROY
16 2/3% ROY
16 2/3% ROY
16 2/3% ROY
12 1/2% RS2
12 1/2% RS1

UNITED STATES DEPARTMENT OF THE INTERIORMINERALS MANAGEMENT SERVICE
GULF OF MEXICO REGION
POSTSALE21-JUN-2000PAGE: 39
Final Bid Recap (all Bids by Area/Tract)Sale Number : 175Sale Identifier: CENTRAL GULF OF MEXICOSale Date : 15-MAR-2000Region Name : Gulf of Mexico OCS Region
SPFBDCAP
NH16-07Area Viosca KnollArea Name
G21733
G21734
G21735
G21736
G21737
5,760.00
5,760.00
5,760.00
5,760.00
5,760.00
A
A
A
A
A
916
951
952
987
1006
1
1
2
1
1
1
$251,000.00
$6,177,787.00
$177,000.00
$317,787.00
$634,000.00
$357,120.00
$43.58
$1,072.53
$30.73
$55.17
$110.07
$62.00
100.00000
100.00000
60.00000 40.00000
100.00000
100.00000
100.00000
02139
01855
0214801385
01855
00730
02219
Shell Deepwater Development Inc.
Vastar Resources, Inc.
Westport Oil and Gas Company, Inc.Chieftain International (U.S.) Inc.
Vastar Resources, Inc.
Walter Oil & Gas Corporation
Kerr-McGee Oil & Gas Corporation
Bid TypeOCSNumber Block
BlockSize
BlockUnit Company Percent(%) Company Name
Amount Bid/Tract Unit
TotalBonus Rank
$6,354,787.002*** *** TRACT TOTALSG21734 TOTAL BIDS TOTAL AMOUNT EXPOSED
12 1/2% RS2
12 1/2% RS1
12 1/2% RS2
16 2/3% RS
12 1/2% RS2

UNITED STATES DEPARTMENT OF THE INTERIORMINERALS MANAGEMENT SERVICE
GULF OF MEXICO REGION
POSTSALE21-JUN-2000PAGE: 40
Final Bid Recap (all Bids by Area/Tract)Sale Number : 175Sale Identifier: CENTRAL GULF OF MEXICOSale Date : 15-MAR-2000Region Name : Gulf of Mexico OCS Region
SPFBDCAP
NH15-12Area Ewing BankArea Name
G21738
G21739
G21740
5,760.00
5,760.00
5,760.00
A
A
A
871
949
951
1
1
1
$334,000.00
$548,000.00
$155,000.00
$57.99
$95.14
$26.91
100.00000
100.00000
100.00000
00730
00185
02169
Walter Oil & Gas Corporation
Samedan Oil Corporation
Spinnaker Exploration Company, L.L.C.
Bid TypeOCSNumber Block
BlockSize
BlockUnit Company Percent(%) Company Name
Amount Bid/Tract Unit
TotalBonus Rank
16 2/3% RS
16 2/3% RS
16 2/3% RS

UNITED STATES DEPARTMENT OF THE INTERIORMINERALS MANAGEMENT SERVICE
GULF OF MEXICO REGION
POSTSALE21-JUN-2000PAGE: 41
Final Bid Recap (all Bids by Area/Tract)Sale Number : 175Sale Identifier: CENTRAL GULF OF MEXICOSale Date : 15-MAR-2000Region Name : Gulf of Mexico OCS Region
SPFBDCAP
NH16-10Area Mississippi CanyonArea Name
G21741
G21742
G21743
G21744
G21745
G21746
G21747
G21748
G21749
G21750
G21751
G21752
G21753
5,760.00
5,760.00
5,760.00
3,843.66
5,760.00
5,760.00
5,760.00
5,760.00
5,760.00
5,760.00
3,824.47
5,760.00
5,760.00
A
A
A
A
A
A
A
A
A
A
A
A
A
40
65
73
107
152
162
163
235
240
241
278
299
386
1
1
1
1
1
1
1
1
1
1
1
1
1
2
$405,811.00
$180,157.00
$300,000.00
$109,164.00
$180,152.00
$1,759,000.00
$269,000.00
$261,465.00
$347,347.00
$300,003.00
$783,080.00
$835,500.00
$500,008.00
$300,000.00
$70.45
$31.28
$52.08
$28.40
$31.28
$305.38
$46.70
$45.39
$60.30
$52.08
$204.76
$145.05
$86.81
$52.08
100.00000
100.00000
100.00000
100.00000
100.00000
100.00000
100.00000
100.00000
100.00000
100.00000
100.00000
37.50000 37.50000 25.00000
100.00000
100.00000
01855
01680
02295
01680
01680
02139
02139
02025
02248
02139
00730
002820168902169
02139
02295
Vastar Resources, Inc.
BP Exploration & Oil Inc.
Exxon Asset Management Company
BP Exploration & Oil Inc.
BP Exploration & Oil Inc.
Shell Deepwater Development Inc.
Shell Deepwater Development Inc.
Coastal Oil & Gas USA, L.P.
Agip Petroleum Exploration Co. Inc.
Shell Deepwater Development Inc.
Walter Oil & Gas Corporation
CNG Producing CompanyMurphy Exploration & Production CompanySpinnaker Exploration Company, L.L.C.
Shell Deepwater Development Inc.
Exxon Asset Management Company
Bid TypeOCSNumber Block
BlockSize
BlockUnit Company Percent(%) Company Name
Amount Bid/Tract Unit
TotalBonus Rank
$800,008.002*** *** TRACT TOTALSG21753 TOTAL BIDS TOTAL AMOUNT EXPOSED
12 1/2% RS2
16 2/3% RS
12 1/2% RS2
16 2/3% RS
12 1/2% RS1
12 1/2% RS2
12 1/2% RS2
16 2/3% RS
12 1/2% RS1
12 1/2% RS2
16 2/3% ROY
12 1/2% RS2
12 1/2% RS2

UNITED STATES DEPARTMENT OF THE INTERIORMINERALS MANAGEMENT SERVICE
GULF OF MEXICO REGION
POSTSALE21-JUN-2000PAGE: 42
Final Bid Recap (all Bids by Area/Tract)Sale Number : 175Sale Identifier: CENTRAL GULF OF MEXICOSale Date : 15-MAR-2000Region Name : Gulf of Mexico OCS Region
SPFBDCAP
NH16-10Area Mississippi CanyonArea Name
G21754
G21755
G21756
G21757
G21758
G21759
G21760
G21761
G21762
G21763
5,760.00
5,760.00
5,760.00
5,760.00
5,760.00
5,760.00
5,760.00
5,760.00
5,760.00
5,760.00
A
A
A
A
A
A
A
A
A
A
400
401
406
422
448
449
450
466
489
493
1
1
1
1
1
2
1
2
1
1
1
2
1
$540,000.00
$265,000.00
$300,000.00
$500,000.00
$600,000.00
$597,900.00
$1,242,422.00
$1,000,000.00
$300,000.00
$500,000.00
$259,000.00
$145,100.00
$2,737,000.00
$93.75
$46.01
$52.08
$86.81
$104.17
$103.80
$215.70
$173.61
$52.08
$86.81
$44.97
$25.19
$475.17
100.00000
100.00000
100.00000
100.00000
100.00000
100.00000
100.00000
100.00000
100.00000
100.00000
60.00000 40.00000 100.00000
80.00000 20.00000
00981
00981
02295
02295
02295
00724
00724
02295
02295
02295
021480138500003
0168901513
Anadarko Petroleum Corporation
Anadarko Petroleum Corporation
Exxon Asset Management Company
Exxon Asset Management Company
Exxon Asset Management Company
Marathon Oil Company
Marathon Oil Company
Exxon Asset Management Company
Exxon Asset Management Company
Exxon Asset Management Company
Westport Oil and Gas Company, Inc.Chieftain International (U.S.) Inc.Union Oil Company of California
Murphy Exploration & Production CompanyCallon Petroleum Operating Company
Bid TypeOCSNumber Block
BlockSize
BlockUnit Company Percent(%) Company Name
Amount Bid/Tract Unit
TotalBonus Rank
$1,197,900.00
$2,242,422.00
$404,100.00
2
2
2
***
***
***
*** TRACT TOTALS
*** TRACT TOTALS
*** TRACT TOTALS
G21758
G21759
G21762
TOTAL BIDS
TOTAL BIDS
TOTAL BIDS
TOTAL AMOUNT EXPOSED
TOTAL AMOUNT EXPOSED
TOTAL AMOUNT EXPOSED
12 1/2% RS1
12 1/2% RS1
16 2/3% RS
12 1/2% RS2
12 1/2% RS1
12 1/2% RS1
12 1/2% RS1
12 1/2% RS2
12 1/2% RS1
12 1/2% RS1

UNITED STATES DEPARTMENT OF THE INTERIORMINERALS MANAGEMENT SERVICE
GULF OF MEXICO REGION
POSTSALE21-JUN-2000PAGE: 43
Final Bid Recap (all Bids by Area/Tract)Sale Number : 175Sale Identifier: CENTRAL GULF OF MEXICOSale Date : 15-MAR-2000Region Name : Gulf of Mexico OCS Region
SPFBDCAP
NH16-10Area Mississippi CanyonArea Name
G21764
G21765
5,760.00
5,760.00
A
A
508
509
1
2
3
4
5
6
7
8
1
2
3
4
5
6
7
8
$12,000,000.00
$8,300,000.00
$7,289,800.00
$5,393,892.00
$3,319,000.00
$3,131,650.00
$1,661,000.00
$911,880.00
$22,000,000.00
$8,444,700.00
$6,879,000.00
$5,400,000.00
$2,768,350.00
$2,011,327.00
$911,880.00
$788,525.00
$2,083.33
$1,440.97
$1,265.59
$936.44
$576.22
$543.69
$288.37
$158.31
$3,819.44
$1,466.09
$1,194.27
$937.50
$480.62
$349.19
$158.31
$136.90
100.00000
100.00000
100.00000
100.00000
100.00000
100.00000
37.50000 37.50000 25.00000 66.66700 33.33300
100.00000
100.00000
100.00000
100.00000
100.00000
100.00000
66.66700 33.33300 37.50000 37.50000 25.00000
02295
00001
00724
00078
02139
01680
0028201689021690190401855
02295
00724
02139
00001
01680
00078
0190401855002820168902169
Exxon Asset Management Company
Conoco Inc.
Marathon Oil Company
Chevron U.S.A. Inc.
Shell Deepwater Development Inc.
BP Exploration & Oil Inc.
CNG Producing CompanyMurphy Exploration & Production CompanySpinnaker Exploration Company, L.L.C.Burlington Resources Offshore Inc.Vastar Resources, Inc.
Exxon Asset Management Company
Marathon Oil Company
Shell Deepwater Development Inc.
Conoco Inc.
BP Exploration & Oil Inc.
Chevron U.S.A. Inc.
Burlington Resources Offshore Inc.Vastar Resources, Inc.CNG Producing CompanyMurphy Exploration & Production CompanySpinnaker Exploration Company, L.L.C.
Bid TypeOCSNumber Block
BlockSize
BlockUnit Company Percent(%) Company Name
Amount Bid/Tract Unit
TotalBonus Rank
$42,007,222.00
$49,203,782.00
8
8
***
***
*** TRACT TOTALS
*** TRACT TOTALS
G21764
G21765
TOTAL BIDS
TOTAL BIDS
TOTAL AMOUNT EXPOSED
TOTAL AMOUNT EXPOSED
12 1/2% RS2
12 1/2% RS2

UNITED STATES DEPARTMENT OF THE INTERIORMINERALS MANAGEMENT SERVICE
GULF OF MEXICO REGION
POSTSALE21-JUN-2000PAGE: 44
Final Bid Recap (all Bids by Area/Tract)Sale Number : 175Sale Identifier: CENTRAL GULF OF MEXICOSale Date : 15-MAR-2000Region Name : Gulf of Mexico OCS Region
SPFBDCAP
NH16-10Area Mississippi CanyonArea Name
G21766
G21767
G21768
G21769
5,760.00
5,760.00
5,760.00
5,760.00
A
A
A
A
512
531
532
554
1
1
1
1
2
3
4
5
$500,000.00
$156,500.00
$175,750.00
$3,777,900.00
$3,000,000.00
$2,200,000.00
$525,500.00
$317,376.00
$86.81
$27.17
$30.51
$655.89
$520.83
$381.94
$91.23
$55.10
100.00000
25.00000 25.00000 25.00000 25.00000
25.00000 25.00000 25.00000 25.00000
100.00000
100.00000
100.00000
50.00000 50.00000 50.00000 50.00000
02295
00981021170219002211
00981021170219002211
00724
02295
00001
00282016890007800771
Exxon Asset Management Company
Anadarko Petroleum CorporationEnterprise Oil Gulf of Mexico Inc.PanCanadian Gulf of Mexico Inc.EEX Corporation
Anadarko Petroleum CorporationEnterprise Oil Gulf of Mexico Inc.PanCanadian Gulf of Mexico Inc.EEX Corporation
Marathon Oil Company
Exxon Asset Management Company
Conoco Inc.
CNG Producing CompanyMurphy Exploration & Production CompanyChevron U.S.A. Inc.Texaco Exploration and Production Inc.
Bid TypeOCSNumber Block
BlockSize
BlockUnit Company Percent(%) Company Name
Amount Bid/Tract Unit
TotalBonus Rank
$9,820,776.005*** *** TRACT TOTALSG21769 TOTAL BIDS TOTAL AMOUNT EXPOSED
12 1/2% RS2
12 1/2% RS1
12 1/2% RS1
12 1/2% RS2

UNITED STATES DEPARTMENT OF THE INTERIORMINERALS MANAGEMENT SERVICE
GULF OF MEXICO REGION
POSTSALE21-JUN-2000PAGE: 45
Final Bid Recap (all Bids by Area/Tract)Sale Number : 175Sale Identifier: CENTRAL GULF OF MEXICOSale Date : 15-MAR-2000Region Name : Gulf of Mexico OCS Region
SPFBDCAP
NH16-10Area Mississippi CanyonArea Name
G21770
G21771
G21772
G21773
G21774
5,760.00
5,760.00
5,760.00
5,760.00
5,760.00
A
A
A
A
A
555
575
619
633
651
1
2
3
4
5
6
7
8
1
1
1
1
$23,000,000.00
$10,126,369.00
$4,485,370.00
$4,100,000.00
$3,630,245.00
$2,667,456.00
$2,075,500.00
$541,196.00
$227,850.00
$224,950.00
$315,750.00
$500,009.00
$3,993.06
$1,758.05
$778.71
$711.81
$630.25
$463.10
$360.33
$93.96
$39.56
$39.05
$54.82
$86.81
100.00000
100.00000
100.00000
100.00000
100.00000
50.00000 50.00000 50.00000 50.00000 100.00000
25.00000 25.00000 25.00000 25.00000
25.00000 25.00000 25.00000 25.00000
100.00000
100.00000
02295
00724
01680
00001
01904
0007800771002820168902139
00981021170219002211
00981021170219002211
02421
02139
Exxon Asset Management Company
Marathon Oil Company
BP Exploration & Oil Inc.
Conoco Inc.
Burlington Resources Offshore Inc.
Chevron U.S.A. Inc.Texaco Exploration and Production Inc.CNG Producing CompanyMurphy Exploration & Production CompanyShell Deepwater Development Inc.
Anadarko Petroleum CorporationEnterprise Oil Gulf of Mexico Inc.PanCanadian Gulf of Mexico Inc.EEX Corporation
Anadarko Petroleum CorporationEnterprise Oil Gulf of Mexico Inc.PanCanadian Gulf of Mexico Inc.EEX Corporation
Devon Energy Production Company, L.P.
Shell Deepwater Development Inc.
Bid TypeOCSNumber Block
BlockSize
BlockUnit Company Percent(%) Company Name
Amount Bid/Tract Unit
TotalBonus Rank
$50,626,136.008*** *** TRACT TOTALSG21770 TOTAL BIDS TOTAL AMOUNT EXPOSED
12 1/2% RS2
12 1/2% RS1
12 1/2% RS1
12 1/2% RS2
12 1/2% RS2

UNITED STATES DEPARTMENT OF THE INTERIORMINERALS MANAGEMENT SERVICE
GULF OF MEXICO REGION
POSTSALE21-JUN-2000PAGE: 46
Final Bid Recap (all Bids by Area/Tract)Sale Number : 175Sale Identifier: CENTRAL GULF OF MEXICOSale Date : 15-MAR-2000Region Name : Gulf of Mexico OCS Region
SPFBDCAP
NH16-10Area Mississippi CanyonArea Name
G21775
G21776
G21777
G21778
G21779
G21780
G21781
G21782
G21783
5,760.00
5,760.00
5,760.00
5,760.00
5,760.00
5,760.00
5,760.00
5,760.00
5,760.00
A
A
A
A
A
A
A
A
A
664
682
689
734
952
969
981
982
983
1
1
1
2
1
1
1
1
1
1
$173,350.00
$357,696.00
$1,000,000.00
$525,500.00
$2,140,000.00
$370,400.00
$307,811.00
$367,981.00
$381,000.00
$230,500.00
$30.10
$62.10
$173.61
$91.23
$371.53
$64.31
$53.44
$63.89
$66.15
$40.02
25.00000 25.00000 25.00000 25.00000
50.00000 50.00000
100.00000
50.00000 50.00000
37.50000 37.50000 25.00000
100.00000
100.00000
100.00000
100.00000
100.00000
00981021170219002211
0007800771
02295
0028201689
002820168902169
01689
01855
00078
02169
02169
Anadarko Petroleum CorporationEnterprise Oil Gulf of Mexico Inc.PanCanadian Gulf of Mexico Inc.EEX Corporation
Chevron U.S.A. Inc.Texaco Exploration and Production Inc.
Exxon Asset Management Company
CNG Producing CompanyMurphy Exploration & Production Company
CNG Producing CompanyMurphy Exploration & Production CompanySpinnaker Exploration Company, L.L.C.
Murphy Exploration & Production Company
Vastar Resources, Inc.
Chevron U.S.A. Inc.
Spinnaker Exploration Company, L.L.C.
Spinnaker Exploration Company, L.L.C.
Bid TypeOCSNumber Block
BlockSize
BlockUnit Company Percent(%) Company Name
Amount Bid/Tract Unit
TotalBonus Rank
$1,525,500.002*** *** TRACT TOTALSG21777 TOTAL BIDS TOTAL AMOUNT EXPOSED
12 1/2% RS1
12 1/2% RS2
12 1/2% RS2
12 1/2% RS2
12 1/2% RS2
12 1/2% RS1
12 1/2% RS2
12 1/2% RS2
12 1/2% RS2

UNITED STATES DEPARTMENT OF THE INTERIORMINERALS MANAGEMENT SERVICE
GULF OF MEXICO REGION
POSTSALE21-JUN-2000PAGE: 47
Final Bid Recap (all Bids by Area/Tract)Sale Number : 175Sale Identifier: CENTRAL GULF OF MEXICOSale Date : 15-MAR-2000Region Name : Gulf of Mexico OCS Region
SPFBDCAP
NG15-03Area Green CanyonArea Name
G21784
G21785
G21786
G21787
G21788
G21789
G21790
5,760.00
5,760.00
5,760.00
5,760.00
5,760.00
5,760.00
5,760.00
A
A
A
A
A
A
A
125
141
169
170
242
268
338
1
1
1
1
1
2
1
1
2
$500,700.00
$489,900.00
$1,200,700.00
$1,200,700.00
$1,400,700.00
$557,000.00
$415,890.00
$2,431,100.00
$832,250.00
$86.93
$85.05
$208.45
$208.45
$243.18
$96.70
$72.20
$422.07
$144.49
60.00000 40.00000
100.00000
60.00000 40.00000
60.00000 40.00000
80.00000 20.00000 100.00000
100.00000
37.50000 37.50000 25.00000 100.00000
0185502079
02148
0185502079
0185502079
018550207901777
02421
00282016890216901680
Vastar Resources, Inc.CXY Energy Offshore Inc.
Westport Oil and Gas Company, Inc.
Vastar Resources, Inc.CXY Energy Offshore Inc.
Vastar Resources, Inc.CXY Energy Offshore Inc.
Vastar Resources, Inc.CXY Energy Offshore Inc.Ocean Energy, Inc.
Devon Energy Production Company, L.P.
CNG Producing CompanyMurphy Exploration & Production CompanySpinnaker Exploration Company, L.L.C.BP Exploration & Oil Inc.
Bid TypeOCSNumber Block
BlockSize
BlockUnit Company Percent(%) Company Name
Amount Bid/Tract Unit
TotalBonus Rank
$1,957,700.00
$3,263,350.00
2
2
***
***
*** TRACT TOTALS
*** TRACT TOTALS
G21788
G21790
TOTAL BIDS
TOTAL BIDS
TOTAL AMOUNT EXPOSED
TOTAL AMOUNT EXPOSED
12 1/2% RS2
12 1/2% RS1
12 1/2% RS2
12 1/2% RS2
12 1/2% RS2
12 1/2% RS2
12 1/2% RS2

UNITED STATES DEPARTMENT OF THE INTERIORMINERALS MANAGEMENT SERVICE
GULF OF MEXICO REGION
POSTSALE21-JUN-2000PAGE: 48
Final Bid Recap (all Bids by Area/Tract)Sale Number : 175Sale Identifier: CENTRAL GULF OF MEXICOSale Date : 15-MAR-2000Region Name : Gulf of Mexico OCS Region
SPFBDCAP
NG15-03Area Green CanyonArea Name
G21791
G21792
G21793
G21794
G21795
5,760.00
5,760.00
5,760.00
5,760.00
5,760.00
A
A
A
A
A
339
345
388
389
430
1
2
1
2
1
2
3
1
2
3
4
1
$1,127,500.00
$832,250.00
$3,475,000.00
$307,811.00
$3,242,422.00
$2,890,000.00
$2,517,811.00
$7,578,000.00
$3,547,600.00
$1,917,811.00
$388,885.00
$253,268.00
$195.75
$144.49
$603.30
$53.44
$562.92
$501.74
$437.12
$1,315.63
$615.90
$332.95
$67.51
$43.97
37.50000 37.50000 25.00000 100.00000
100.00000
100.00000
100.00000
100.00000
100.00000
100.00000
100.00000
100.00000
100.00000
100.00000
00282016890216901680
02139
01855
00724
02139
01855
02139
00724
01855
02277
00078
CNG Producing CompanyMurphy Exploration & Production CompanySpinnaker Exploration Company, L.L.C.BP Exploration & Oil Inc.
Shell Deepwater Development Inc.
Vastar Resources, Inc.
Marathon Oil Company
Shell Deepwater Development Inc.
Vastar Resources, Inc.
Shell Deepwater Development Inc.
Marathon Oil Company
Vastar Resources, Inc.
BHP Petroleum (Deepwater) Inc.
Chevron U.S.A. Inc.
Bid TypeOCSNumber Block
BlockSize
BlockUnit Company Percent(%) Company Name
Amount Bid/Tract Unit
TotalBonus Rank
$1,959,750.00
$3,782,811.00
$8,650,233.00
$13,432,296.00
2
2
3
4
***
***
***
***
*** TRACT TOTALS
*** TRACT TOTALS
*** TRACT TOTALS
*** TRACT TOTALS
G21791
G21792
G21793
G21794
TOTAL BIDS
TOTAL BIDS
TOTAL BIDS
TOTAL BIDS
TOTAL AMOUNT EXPOSED
TOTAL AMOUNT EXPOSED
TOTAL AMOUNT EXPOSED
TOTAL AMOUNT EXPOSED
12 1/2% RS2
12 1/2% RS2
12 1/2% RS2
12 1/2% RS2
12 1/2% RS2

UNITED STATES DEPARTMENT OF THE INTERIORMINERALS MANAGEMENT SERVICE
GULF OF MEXICO REGION
POSTSALE21-JUN-2000PAGE: 49
Final Bid Recap (all Bids by Area/Tract)Sale Number : 175Sale Identifier: CENTRAL GULF OF MEXICOSale Date : 15-MAR-2000Region Name : Gulf of Mexico OCS Region
SPFBDCAP
NG15-03Area Green CanyonArea Name
G21796
G21797
G21798
G21799
G21800
G21801
5,760.00
5,760.00
5,760.00
5,760.00
5,760.00
5,760.00
A
A
A
A
A
A
433
461
474
486
506
518
1
2
3
1
1
2
3
1
2
1
1
2
$2,689,000.00
$938,885.00
$357,811.00
$1,000,700.00
$2,335,880.00
$507,811.00
$253,268.00
$322,560.00
$307,811.00
$300,700.00
$1,207,811.00
$419,731.00
$466.84
$163.00
$62.12
$173.73
$405.53
$88.16
$43.97
$56.00
$53.44
$52.20
$209.69
$72.87
100.00000
100.00000
100.00000
80.00000 20.00000
100.00000
100.00000
100.00000
100.00000
100.00000
80.00000 20.00000
100.00000
52.00000 30.00000 18.00000
02139
02277
01855
0185502079
01680
01855
00078
02219
01855
0185502079
01855
016800007802248
Shell Deepwater Development Inc.
BHP Petroleum (Deepwater) Inc.
Vastar Resources, Inc.
Vastar Resources, Inc.CXY Energy Offshore Inc.
BP Exploration & Oil Inc.
Vastar Resources, Inc.
Chevron U.S.A. Inc.
Kerr-McGee Oil & Gas Corporation
Vastar Resources, Inc.
Vastar Resources, Inc.CXY Energy Offshore Inc.
Vastar Resources, Inc.
BP Exploration & Oil Inc.Chevron U.S.A. Inc.Agip Petroleum Exploration Co. Inc.
Bid TypeOCSNumber Block
BlockSize
BlockUnit Company Percent(%) Company Name
Amount Bid/Tract Unit
TotalBonus Rank
$3,985,696.00
$3,096,959.00
$630,371.00
$1,627,542.00
3
3
2
2
***
***
***
***
*** TRACT TOTALS
*** TRACT TOTALS
*** TRACT TOTALS
*** TRACT TOTALS
G21796
G21798
G21799
G21801
TOTAL BIDS
TOTAL BIDS
TOTAL BIDS
TOTAL BIDS
TOTAL AMOUNT EXPOSED
TOTAL AMOUNT EXPOSED
TOTAL AMOUNT EXPOSED
TOTAL AMOUNT EXPOSED
12 1/2% RS2
12 1/2% RS2
12 1/2% RS2
12 1/2% RS2
12 1/2% RS2
12 1/2% RS2
UNITED STATES DEPARTMENT OF THE INTERIORMINERALS MANAGEMENT SERVICE
GULF OF MEXICO REGION
POSTSALE21-JUN-2000PAGE: 50
Final Bid Recap (all Bids by Area/Tract)Sale Number : 175Sale Identifier: CENTRAL GULF OF MEXICOSale Date : 15-MAR-2000Region Name : Gulf of Mexico OCS Region
SPFBDCAP
NG15-03Area Green CanyonArea Name
G21802
G21803
G21804
G21805
G21806
G21807
G21808
5,760.00
5,760.00
5,760.00
5,760.00
5,760.00
5,760.00
5,760.00
A
A
A
A
A
A
A
519
520
564
603
604
606
647
1
2
1
1
1
2
1
2
1
1
$813,139.00
$407,811.00
$248,427.00
$248,427.00
$325,500.00
$253,811.00
$377,811.00
$377,300.00
$9,375,000.00
$757,811.00
$141.17
$70.80
$43.13
$43.13
$56.51
$44.06
$65.59
$65.50
$1,627.60
$131.56
52.00000 30.00000 18.00000 100.00000
52.00000 30.00000 18.00000
52.00000 30.00000 18.00000
75.00000 25.00000 100.00000
100.00000
75.00000 25.00000
100.00000
100.00000
01680000780224801855
016800007802248
016800007802248
002820216901855
01855
0028202169
00981
01855
BP Exploration & Oil Inc.Chevron U.S.A. Inc.Agip Petroleum Exploration Co. Inc.Vastar Resources, Inc.
BP Exploration & Oil Inc.Chevron U.S.A. Inc.Agip Petroleum Exploration Co. Inc.
BP Exploration & Oil Inc.Chevron U.S.A. Inc.Agip Petroleum Exploration Co. Inc.
CNG Producing CompanySpinnaker Exploration Company, L.L.C.Vastar Resources, Inc.
Vastar Resources, Inc.
CNG Producing CompanySpinnaker Exploration Company, L.L.C.
Anadarko Petroleum Corporation
Vastar Resources, Inc.
Bid TypeOCSNumber Block
BlockSize
BlockUnit Company Percent(%) Company Name
Amount Bid/Tract Unit
TotalBonus Rank
$1,220,950.00
$579,311.00
$755,111.00
2
2
2
***
***
***
*** TRACT TOTALS
*** TRACT TOTALS
*** TRACT TOTALS
G21802
G21805
G21806
TOTAL BIDS
TOTAL BIDS
TOTAL BIDS
TOTAL AMOUNT EXPOSED
TOTAL AMOUNT EXPOSED
TOTAL AMOUNT EXPOSED
12 1/2% RS2
12 1/2% RS2
12 1/2% RS2
12 1/2% RS2
12 1/2% RS2
12 1/2% RS2
12 1/2% RS2

UNITED STATES DEPARTMENT OF THE INTERIORMINERALS MANAGEMENT SERVICE
GULF OF MEXICO REGION
POSTSALE21-JUN-2000PAGE: 51
Final Bid Recap (all Bids by Area/Tract)Sale Number : 175Sale Identifier: CENTRAL GULF OF MEXICOSale Date : 15-MAR-2000Region Name : Gulf of Mexico OCS Region
'R' Denotes Rejected Tract.
SPFBDCAP
NG15-03Area Green CanyonArea Name
G21809
G21810
G21811
G21812
G21813
G21814
G21815
G21816
G21817
5,760.00
5,760.00
5,760.00
5,760.00
5,760.00
5,760.00
5,760.00
497.48
5,760.00
A
A
A
A
A
A
A
A
A
648
652
679
680
723
724
745
746
768
1
2
1
1
1
2
1
1
1
1
1
$1,189,900.00
$757,811.00
$6,250,000.00
$1,133,000.00
$1,472,000.00
$1,400,000.00
$234,000.00
$358,000.00
$333,000.00
$52,700.00
$223,000.00
$206.58
$131.56
$1,085.07
$196.70
$255.56
$243.06
$40.63
$62.15
$57.81
$105.93
$38.72
100.00000
100.00000
100.00000
37.50000 37.50000 25.00000
100.00000
37.50000 37.50000 25.00000
100.00000
100.00000
75.00000 25.00000
75.00000 25.00000
100.00000
00724
01855
00981
002820168902169
00185
002820168902169
00185
00185
0168902169
0168902169
00185
Marathon Oil Company
Vastar Resources, Inc.
Anadarko Petroleum Corporation
CNG Producing CompanyMurphy Exploration & Production CompanySpinnaker Exploration Company, L.L.C.
Samedan Oil Corporation
CNG Producing CompanyMurphy Exploration & Production CompanySpinnaker Exploration Company, L.L.C.
Samedan Oil Corporation
Samedan Oil Corporation
Murphy Exploration & Production CompanySpinnaker Exploration Company, L.L.C.
Murphy Exploration & Production CompanySpinnaker Exploration Company, L.L.C.
Samedan Oil Corporation
Bid TypeOCSNumber Block
BlockSize
BlockUnit Company Percent(%) Company Name
Amount Bid/Tract Unit
TotalBonus Rank
$1,947,711.00
$2,872,000.00
2
2
***
***
*** TRACT TOTALS
*** TRACT TOTALS
G21809
G21812
TOTAL BIDS
TOTAL BIDS
TOTAL AMOUNT EXPOSED
TOTAL AMOUNT EXPOSED
12 1/2% RS2
12 1/2% RS2
12 1/2% RS2
12 1/2% RS2
12 1/2% RS2
12 1/2% RS2
12 1/2% RS2
12 1/2% RS2
12 1/2% RS2
R

UNITED STATES DEPARTMENT OF THE INTERIORMINERALS MANAGEMENT SERVICE
GULF OF MEXICO REGION
POSTSALE21-JUN-2000PAGE: 52
Final Bid Recap (all Bids by Area/Tract)Sale Number : 175Sale Identifier: CENTRAL GULF OF MEXICOSale Date : 15-MAR-2000Region Name : Gulf of Mexico OCS Region
'R' Denotes Rejected Tract.
SPFBDCAP
NG15-03Area Green CanyonArea Name
G21818
G21819
G21820
G21821
G21822
G21823
5,760.00
5,760.00
5,760.00
5,760.00
5,760.00
5,760.00
A
A
A
A
A
A
899
900
915
949
958
1001
1
1
2
1
2
3
1
1
1
2
$832,250.00
$832,250.00
$248,076.00
$3,203,136.00
$1,755,500.00
$327,858.00
$218,076.00
$6,280,800.00
$7,430,700.00
$2,631,100.00
$144.49
$144.49
$43.07
$556.10
$304.77
$56.92
$37.86
$1,090.42
$1,290.05
$456.79
100.00000
100.00000
100.00000
100.00000
31.25000 31.25000 25.00000 12.50000 100.00000
100.00000
31.25000 31.25000 25.00000 12.50000
100.00000
31.25000 31.25000 25.00000 12.50000
01680
01680
00003
00771
0028201689001850216902277
00003
00282016890018502169
00724
00282016890018502169
BP Exploration & Oil Inc.
BP Exploration & Oil Inc.
Union Oil Company of California
Texaco Exploration and Production Inc.
CNG Producing CompanyMurphy Exploration & Production CompanySamedan Oil CorporationSpinnaker Exploration Company, L.L.C.BHP Petroleum (Deepwater) Inc.
Union Oil Company of California
CNG Producing CompanyMurphy Exploration & Production CompanySamedan Oil CorporationSpinnaker Exploration Company, L.L.C.
Marathon Oil Company
CNG Producing CompanyMurphy Exploration & Production CompanySamedan Oil CorporationSpinnaker Exploration Company, L.L.C.
Bid TypeOCSNumber Block
BlockSize
BlockUnit Company Percent(%) Company Name
Amount Bid/Tract Unit
TotalBonus Rank
$1,080,326.00
$5,286,494.00
$10,061,800.00
2
3
2
***
***
***
*** TRACT TOTALS
*** TRACT TOTALS
*** TRACT TOTALS
G21819
G21820
G21823
TOTAL BIDS
TOTAL BIDS
TOTAL BIDS
TOTAL AMOUNT EXPOSED
TOTAL AMOUNT EXPOSED
TOTAL AMOUNT EXPOSED
12 1/2% RS2
12 1/2% RS2
12 1/2% RS2
12 1/2% RS2
12 1/2% RS2
12 1/2% RS2
R
R

UNITED STATES DEPARTMENT OF THE INTERIORMINERALS MANAGEMENT SERVICE
GULF OF MEXICO REGION
POSTSALE21-JUN-2000PAGE: 53
Final Bid Recap (all Bids by Area/Tract)Sale Number : 175Sale Identifier: CENTRAL GULF OF MEXICOSale Date : 15-MAR-2000Region Name : Gulf of Mexico OCS Region
SPFBDCAP
NG16-01Area Atwater ValleyArea Name
G21824
G21825
G21826
G21827
G21828
G21829
G21830
G21831
G21832
G21833
G21834
G21835
G21836
5,760.00
5,760.00
5,760.00
5,760.00
5,760.00
5,760.00
5,760.00
5,760.00
5,760.00
5,760.00
5,760.00
5,760.00
5,760.00
A
A
A
A
A
A
A
A
A
A
A
A
A
15
36
37
49
91
92
93
225
226
284
294
315
316
1
1
2
1
1
1
1
1
1
1
1
1
1
1
$311,000.00
$881,280.00
$421,000.00
$1,313,280.00
$282,400.00
$550,500.00
$3,555,300.00
$327,400.00
$222,400.00
$252,400.00
$242,496.00
$535,680.00
$244,811.00
$244,811.00
$53.99
$153.00
$73.09
$228.00
$49.03
$95.57
$617.24
$56.84
$38.61
$43.82
$42.10
$93.00
$42.50
$42.50
100.00000
100.00000
100.00000
100.00000
100.00000
100.00000
100.00000
100.00000
100.00000
100.00000
50.00000 50.00000
100.00000
100.00000
100.00000
02169
02219
02169
02219
02117
00282
00282
02117
02117
02117
0007800771
02219
01855
01855
Spinnaker Exploration Company, L.L.C.
Kerr-McGee Oil & Gas Corporation
Spinnaker Exploration Company, L.L.C.
Kerr-McGee Oil & Gas Corporation
Enterprise Oil Gulf of Mexico Inc.
CNG Producing Company
CNG Producing Company
Enterprise Oil Gulf of Mexico Inc.
Enterprise Oil Gulf of Mexico Inc.
Enterprise Oil Gulf of Mexico Inc.
Chevron U.S.A. Inc.Texaco Exploration and Production Inc.
Kerr-McGee Oil & Gas Corporation
Vastar Resources, Inc.
Vastar Resources, Inc.
Bid TypeOCSNumber Block
BlockSize
BlockUnit Company Percent(%) Company Name
Amount Bid/Tract Unit
TotalBonus Rank
$1,302,280.002*** *** TRACT TOTALSG21825 TOTAL BIDS TOTAL AMOUNT EXPOSED
12 1/2% RS2
12 1/2% RS2
12 1/2% RS2
12 1/2% RS2
12 1/2% RS2
12 1/2% RS2
12 1/2% RS2
12 1/2% RS2
12 1/2% RS2
12 1/2% RS2
12 1/2% RS2
12 1/2% RS2
12 1/2% RS2
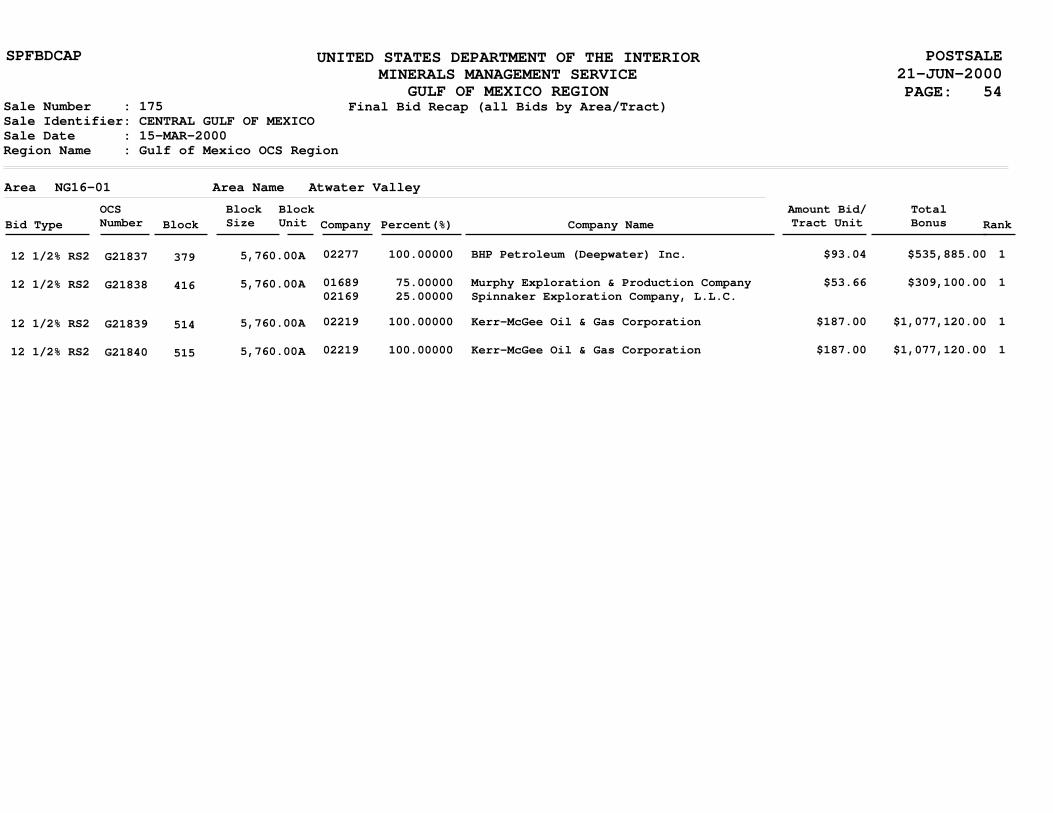
UNITED STATES DEPARTMENT OF THE INTERIORMINERALS MANAGEMENT SERVICE
GULF OF MEXICO REGION
POSTSALE21-JUN-2000PAGE: 54
Final Bid Recap (all Bids by Area/Tract)Sale Number : 175Sale Identifier: CENTRAL GULF OF MEXICOSale Date : 15-MAR-2000Region Name : Gulf of Mexico OCS Region
SPFBDCAP
NG16-01Area Atwater ValleyArea Name
G21837
G21838
G21839
G21840
5,760.00
5,760.00
5,760.00
5,760.00
A
A
A
A
379
416
514
515
1
1
1
1
$535,885.00
$309,100.00
$1,077,120.00
$1,077,120.00
$93.04
$53.66
$187.00
$187.00
100.00000
75.00000 25.00000
100.00000
100.00000
02277
0168902169
02219
02219
BHP Petroleum (Deepwater) Inc.
Murphy Exploration & Production CompanySpinnaker Exploration Company, L.L.C.
Kerr-McGee Oil & Gas Corporation
Kerr-McGee Oil & Gas Corporation
Bid TypeOCSNumber Block
BlockSize
BlockUnit Company Percent(%) Company Name
Amount Bid/Tract Unit
TotalBonus Rank
12 1/2% RS2
12 1/2% RS2
12 1/2% RS2
12 1/2% RS2

UNITED STATES DEPARTMENT OF THE INTERIORMINERALS MANAGEMENT SERVICE
GULF OF MEXICO REGION
POSTSALE21-JUN-2000PAGE: 55
Final Bid Recap (all Bids by Area/Tract)Sale Number : 175Sale Identifier: CENTRAL GULF OF MEXICOSale Date : 15-MAR-2000Region Name : Gulf of Mexico OCS Region
'R' Denotes Rejected Tract.
SPFBDCAP
NG15-06Area Walker RidgeArea Name
G21841
G21842
G21843
G21844
G21845
G21846
G21847
G21848
5,760.00
5,760.00
5,760.00
5,760.00
5,760.00
5,760.00
5,760.00
5,760.00
A
A
A
A
A
A
A
A
98
99
114
115
116
117
120
142
1
1
1
1
2
1
2
1
2
1
1
$440,076.00
$450,076.00
$226,400.00
$232,811.00
$218,076.00
$518,400.00
$218,076.00
$365,760.00
$218,076.00
$1,224,244.00
$330,076.00
$76.40
$78.14
$39.31
$40.42
$37.86
$90.00
$37.86
$63.50
$37.86
$212.54
$57.30
100.00000
100.00000
100.00000
33.33334 33.33333 33.33333 100.00000
33.33334 33.33333 33.33333 100.00000
33.33334 33.33333 33.33333 100.00000
100.00000
100.00000
00003
00003
02219
01855000590221900003
01855000590221900003
01855000590221900003
00724
00003
Union Oil Company of California
Union Oil Company of California
Kerr-McGee Oil & Gas Corporation
Vastar Resources, Inc.Amerada Hess CorporationKerr-McGee Oil & Gas CorporationUnion Oil Company of California
Vastar Resources, Inc.Amerada Hess CorporationKerr-McGee Oil & Gas CorporationUnion Oil Company of California
Vastar Resources, Inc.Amerada Hess CorporationKerr-McGee Oil & Gas CorporationUnion Oil Company of California
Marathon Oil Company
Union Oil Company of California
Bid TypeOCSNumber Block
BlockSize
BlockUnit Company Percent(%) Company Name
Amount Bid/Tract Unit
TotalBonus Rank
$450,887.00
$736,476.00
$583,836.00
2
2
2
***
***
***
*** TRACT TOTALS
*** TRACT TOTALS
*** TRACT TOTALS
G21844
G21845
G21846
TOTAL BIDS
TOTAL BIDS
TOTAL BIDS
TOTAL AMOUNT EXPOSED
TOTAL AMOUNT EXPOSED
TOTAL AMOUNT EXPOSED
12 1/2% RS2
12 1/2% RS2
12 1/2% RS2
12 1/2% RS2
12 1/2% RS2
12 1/2% RS2
12 1/2% RS2
12 1/2% RS2
R
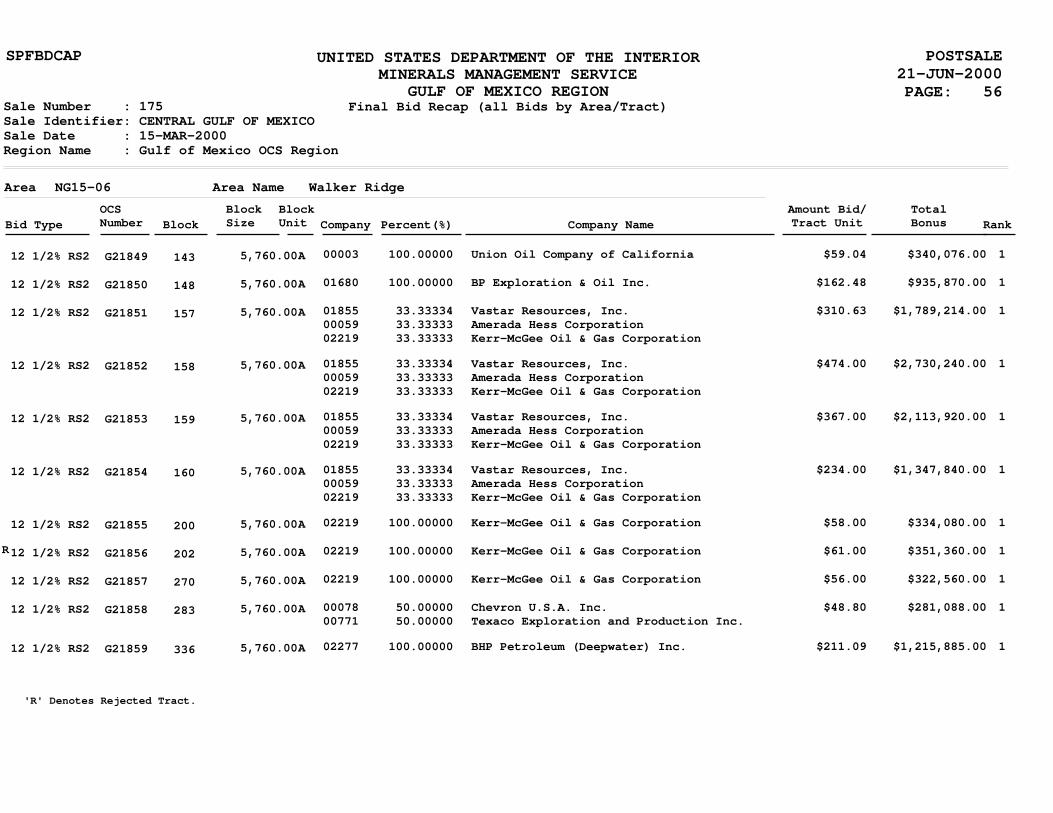
UNITED STATES DEPARTMENT OF THE INTERIORMINERALS MANAGEMENT SERVICE
GULF OF MEXICO REGION
POSTSALE21-JUN-2000PAGE: 56
Final Bid Recap (all Bids by Area/Tract)Sale Number : 175Sale Identifier: CENTRAL GULF OF MEXICOSale Date : 15-MAR-2000Region Name : Gulf of Mexico OCS Region
'R' Denotes Rejected Tract.
SPFBDCAP
NG15-06Area Walker RidgeArea Name
G21849
G21850
G21851
G21852
G21853
G21854
G21855
G21856
G21857
G21858
G21859
5,760.00
5,760.00
5,760.00
5,760.00
5,760.00
5,760.00
5,760.00
5,760.00
5,760.00
5,760.00
5,760.00
A
A
A
A
A
A
A
A
A
A
A
143
148
157
158
159
160
200
202
270
283
336
1
1
1
1
1
1
1
1
1
1
1
$340,076.00
$935,870.00
$1,789,214.00
$2,730,240.00
$2,113,920.00
$1,347,840.00
$334,080.00
$351,360.00
$322,560.00
$281,088.00
$1,215,885.00
$59.04
$162.48
$310.63
$474.00
$367.00
$234.00
$58.00
$61.00
$56.00
$48.80
$211.09
100.00000
100.00000
33.33334 33.33333 33.33333
33.33334 33.33333 33.33333
33.33334 33.33333 33.33333
33.33334 33.33333 33.33333
100.00000
100.00000
100.00000
50.00000 50.00000
100.00000
00003
01680
018550005902219
018550005902219
018550005902219
018550005902219
02219
02219
02219
0007800771
02277
Union Oil Company of California
BP Exploration & Oil Inc.
Vastar Resources, Inc.Amerada Hess CorporationKerr-McGee Oil & Gas Corporation
Vastar Resources, Inc.Amerada Hess CorporationKerr-McGee Oil & Gas Corporation
Vastar Resources, Inc.Amerada Hess CorporationKerr-McGee Oil & Gas Corporation
Vastar Resources, Inc.Amerada Hess CorporationKerr-McGee Oil & Gas Corporation
Kerr-McGee Oil & Gas Corporation
Kerr-McGee Oil & Gas Corporation
Kerr-McGee Oil & Gas Corporation
Chevron U.S.A. Inc.Texaco Exploration and Production Inc.
BHP Petroleum (Deepwater) Inc.
Bid TypeOCSNumber Block
BlockSize
BlockUnit Company Percent(%) Company Name
Amount Bid/Tract Unit
TotalBonus Rank
12 1/2% RS2
12 1/2% RS2
12 1/2% RS2
12 1/2% RS2
12 1/2% RS2
12 1/2% RS2
12 1/2% RS2
12 1/2% RS2
12 1/2% RS2
12 1/2% RS2
12 1/2% RS2
R

UNITED STATES DEPARTMENT OF THE INTERIORMINERALS MANAGEMENT SERVICE
GULF OF MEXICO REGION
POSTSALE21-JUN-2000PAGE: 57
Final Bid Recap (all Bids by Area/Tract)Sale Number : 175Sale Identifier: CENTRAL GULF OF MEXICOSale Date : 15-MAR-2000Region Name : Gulf of Mexico OCS Region
SPFBDCAP
NG15-06Area Walker RidgeArea Name
G21860
G21861
G21862
G21863
G21864
G21865
G21866
G21867
G21868
G21869
5,760.00
5,760.00
5,760.00
5,760.00
5,760.00
5,760.00
5,760.00
5,760.00
5,760.00
5,760.00
A
A
A
A
A
A
A
A
A
A
466
551
596
639
682
683
717
723
727
765
1
1
1
1
1
1
1
1
2
3
4
1
1
$408,555.00
$218,467.00
$226,693.00
$217,822.00
$224,726.00
$225,789.00
$1,509,683.00
$9,310,076.00
$6,526,080.00
$6,187,191.00
$4,862,016.00
$225,218.00
$1,207,560.00
$70.93
$37.93
$39.36
$37.82
$39.01
$39.20
$262.10
$1,616.33
$1,133.00
$1,074.17
$844.10
$39.10
$209.65
100.00000
100.00000
100.00000
100.00000
100.00000
100.00000
100.00000
100.00000
33.33334 33.33333 33.33333 100.00000
100.00000
100.00000
33.33334 33.33333 33.33333
02277
00724
00724
00724
00724
00724
00724
00003
00059018550190400078
00771
00724
000590185501904
BHP Petroleum (Deepwater) Inc.
Marathon Oil Company
Marathon Oil Company
Marathon Oil Company
Marathon Oil Company
Marathon Oil Company
Marathon Oil Company
Union Oil Company of California
Amerada Hess CorporationVastar Resources, Inc.Burlington Resources Offshore Inc.Chevron U.S.A. Inc.
Texaco Exploration and Production Inc.
Marathon Oil Company
Amerada Hess CorporationVastar Resources, Inc.Burlington Resources Offshore Inc.
Bid TypeOCSNumber Block
BlockSize
BlockUnit Company Percent(%) Company Name
Amount Bid/Tract Unit
TotalBonus Rank
$26,885,363.004*** *** TRACT TOTALSG21867 TOTAL BIDS TOTAL AMOUNT EXPOSED
12 1/2% RS2
12 1/2% RS2
12 1/2% RS2
12 1/2% RS2
12 1/2% RS2
12 1/2% RS2
12 1/2% RS2
12 1/2% RS2
12 1/2% RS2
12 1/2% RS2

UNITED STATES DEPARTMENT OF THE INTERIORMINERALS MANAGEMENT SERVICE
GULF OF MEXICO REGION
POSTSALE21-JUN-2000PAGE: 58
Final Bid Recap (all Bids by Area/Tract)Sale Number : 175Sale Identifier: CENTRAL GULF OF MEXICOSale Date : 15-MAR-2000Region Name : Gulf of Mexico OCS Region
SPFBDCAP
NG15-06Area Walker RidgeArea Name
G21870 5,760.00A 812 1 $228,080.00 $39.60 33.33334 33.33333 33.33333
000590185501904
Amerada Hess CorporationVastar Resources, Inc.Burlington Resources Offshore Inc.
Bid TypeOCSNumber Block
BlockSize
BlockUnit Company Percent(%) Company Name
Amount Bid/Tract Unit
TotalBonus Rank
12 1/2% RS2

UNITED STATES DEPARTMENT OF THE INTERIORMINERALS MANAGEMENT SERVICE
GULF OF MEXICO REGION
POSTSALE21-JUN-2000PAGE: 59
Final Bid Recap (all Bids by Area/Tract)Sale Number : 175Sale Identifier: CENTRAL GULF OF MEXICOSale Date : 15-MAR-2000Region Name : Gulf of Mexico OCS Region
'R' Denotes Rejected Tract.
SPFBDCAP
469 $ 454,929,870.00
NG16-04Area LundArea Name
G21871
G21872
G21873
5,760.00
5,760.00
5,760.00
A
A
A
875
876
920
1
1
1
$217,017.00
$217,017.00
$217,017.00
$37.68
$37.68
$37.68
100.00000
100.00000
100.00000
00078
00078
00078
Chevron U.S.A. Inc.
Chevron U.S.A. Inc.
Chevron U.S.A. Inc.
Bid TypeOCSNumber Block
BlockSize
BlockUnit Company Percent(%) Company Name
Amount Bid/Tract Unit
TotalBonus Rank
*** 15-MAR-2000 *** SALE TOTALS TOTAL AMOUNT EXPOSED
12 1/2% RS2
12 1/2% RS2
12 1/2% RS2
R
R
R