Speed booms detection for a ground vehicle with computer ... … · Speed booms detection for a...
7
Speed booms detection for a ground vehicle with computer vision JUAN MARTÍN RAYA BAHENA 1 , CARLOS AVILÉS CRUZ 2 , ARTURO ZÚÑIGA LÓPEZ 2 AND ANDRES FERREYRA-RAMIREZ 2 1 Electronics Department Instituto Politecnico Nacional ESIME Zacatenco Av. Instituto Politécnico Nacional s/n, Unidad Profesional "Adolfo López Mateos", Edif. 1, 2, 3, 4 y 5, Col. Lindavista, Del. Gustavo A. Madero, México, D.F. C.P. 07738 MÉXICO [email protected] http://www.esimez.ipn.mx 2 Signal Processing and Pattern Recognition Universidad Autónoma Metropolitana – Unidad Azcapotzalco San Pablo #180, Col. Reynosa Tamaulipas Delegación Azcapotzalco, México, D.F. MÉXICO 2 [email protected] http://newton.azc.uam.mx/mcc/ Abstract: - This article describes a new stereo vision system for ground vehicle to detect speed bumps. The damage for cross speed bumps fast can result in harms to people breakdowns to vehicles. In this paper we propose speed booms detection method using Disparity, Border detection, Morphological Image processing, Canny edge detector. The system was built using two web cameras. The importance of this work is to present a methodology to detect speed booms in a ground vehicle. Key-Words: - Stereo vision, Disparity map, Canny algorithm, Speed booms detection, Dilatation and erosion. 1 Introduction Every time that vehicle goes fast over a speed bump, it could be damaged; some of its mechanical parts could deteriorate progressively. For humans detect an obstacle is easy, it is not required a conscious effort, nevertheless for a computer machine is a complex task. Some factors like: different conditions of illumination, shadows, highlights and noise, makes difficult the obstacle detection. Due to vehicle movement the detection must be quickly in order to warn the driver on time to decrease speed prior to hit the speed bump. The present paper is looking to detect speed booms using computer vision to warn the driver. Hee, Chang y Moon [1], describe a system using computer vision for urban operation of unmanned ground vehicle, They locate lane mark and speed bumps to safely and autonomously navigate an urban roadway, to detect the lane mark, the Hough Transform is used and Color detection is used because speed bumps (in Korea) have a standard alterning white and orange color pattern. The reference [2] identifies unobstructed space in front of a moving passenger car by means of a single monochrome camera. The algorithm is divided in two main parts. For the first part a model is used to road border recognition, the second part is the detection of obstacles within the road boundaries. With a single monocular camera the range information of the distance between the vehicle and the obstacle is being missed. In [2] they work with odometry and optical flow. N.Suganuma, M.Shimoyama, N.Fujiwara in [3] propose road shape recognition method using Dynamic Programming, using virtual disparity objects can be detected eventhough if the vehicle has large roll movement. However, the system has still problem when a road shape cannot be approximated as a flat plane. Kunsoo Huh, Jaehak Park, Junyeon Hwang, Daegun Hong in [4] they present a system that utilizes feature matching, epipolar constraint and a feature aggregation in order to detect robustly the initial corresponding pairs. The proposed system can detect a front obstacle, a leading vehicle and a vehicle cutting into the lane. Then the position parameters of the obstacles and leading vehicles can be obtained. Myron Z. Brown, Darius Burschka and Gregory D. Hager in [5] review recent advances in computational stereo, focusing primarily on three important topics: correspondence methods, methods for occlusion, and real-time implementations. ADVANCES in MATHEMATICAL and COMPUTATIONAL METHODS ISSN: 1792-6114 258 ISBN: 978-960-474-243-1
Transcript of Speed booms detection for a ground vehicle with computer ... … · Speed booms detection for a...

Speed booms detection for a ground vehicle with computer vision
JUAN MARTÍN RAYA BAHENA1, CARLOS AVILÉS CRUZ2, ARTURO ZÚÑIGA LÓPEZ2 AND ANDRES FERREYRA-RAMIREZ2
1Electronics Department Instituto Politecnico Nacional ESIME Zacatenco
Av. Instituto Politécnico Nacional s/n, Unidad Profesional "Adolfo López Mateos", Edif. 1, 2, 3, 4 y 5, Col. Lindavista, Del. Gustavo A. Madero, México, D.F. C.P. 07738
MÉXICO [email protected] http://www.esimez.ipn.mx
2Signal Processing and Pattern Recognition Universidad Autónoma Metropolitana – Unidad Azcapotzalco
San Pablo #180, Col. Reynosa Tamaulipas Delegación Azcapotzalco, México, D.F. MÉXICO
[email protected] http://newton.azc.uam.mx/mcc/
Abstract: - This article describes a new stereo vision system for ground vehicle to detect speed bumps. The
damage for cross speed bumps fast can result in harms to people breakdowns to vehicles. In this paper we
propose speed booms detection method using Disparity, Border detection, Morphological Image processing,
Canny edge detector. The system was built using two web cameras. The importance of this work is to present a
methodology to detect speed booms in a ground vehicle.
Key-Words: - Stereo vision, Disparity map, Canny algorithm, Speed booms detection, Dilatation and erosion.
1 Introduction Every time that vehicle goes fast over a speed bump, it could be damaged; some of its mechanical parts could deteriorate progressively. For humans detect an obstacle is easy, it is not required a conscious effort, nevertheless for a computer machine is a complex task. Some factors like: different conditions of illumination, shadows, highlights and noise, makes difficult the obstacle detection. Due to vehicle movement the detection must be quickly in order to warn the driver on time to decrease speed prior to hit the speed bump. The present paper is looking to detect speed booms using computer vision to warn the driver. Hee, Chang y Moon [1], describe a system using computer vision for urban operation of unmanned ground vehicle, They locate lane mark and speed bumps to safely and autonomously navigate an urban roadway, to detect the lane mark, the Hough Transform is used and Color detection is used because speed bumps (in Korea) have a standard alterning white and orange color pattern. The reference [2] identifies unobstructed space in front of a moving passenger car by means of a single monochrome camera. The algorithm is divided in two main parts. For the first part a model is used to road border recognition, the second part is the
detection of obstacles within the road boundaries. With a single monocular camera the range information of the distance between the vehicle and the obstacle is being missed. In [2] they work with odometry and optical flow. N.Suganuma, M.Shimoyama, N.Fujiwara in [3] propose road shape recognition method using Dynamic Programming, using virtual disparity objects can be detected eventhough if the vehicle has large roll movement. However, the system has still problem when a road shape cannot be approximated as a flat plane. Kunsoo Huh, Jaehak Park, Junyeon Hwang, Daegun Hong in [4] they present a system that utilizes feature matching, epipolar constraint and a feature aggregation in order to detect robustly the initial corresponding pairs. The proposed system can detect a front obstacle, a leading vehicle and a vehicle cutting into the lane. Then the position parameters of the obstacles and leading vehicles can be obtained. Myron Z. Brown, Darius Burschka and Gregory D. Hager in [5] review recent advances in computational stereo, focusing primarily on three important topics: correspondence methods, methods for occlusion, and real-time implementations.
ADVANCES in MATHEMATICAL and COMPUTATIONAL METHODS
ISSN: 1792-6114 258 ISBN: 978-960-474-243-1

2 Methodology to detect speed booms The figure 1 shows the schematic diagram of the methodology proposal to detect speed booms.
Figure 1 Schematic of our methodology to
recognize the speed booms
2.1 Capture images a)b)c) These processes are represented by the blocks a) b) and c) in the figure 1, in our program of capture we get 50 pairs from two cameras web, the images are recorded in ram memory and after copy in hard disk for posterior calculates, the speed of capture is 27 frames per second so every 37 milliseconds we have a capture. We get the images in sequence left, right, left and so on. 2.2 Image cut d)e) These processes are represented by the blocks d) and e) in the figure 1, we look to recognize the road and we do not have interest in: the sky, trees, houses, in [1] and [2] they discriminate objects of no interest. In our work we cut the images with triangle shape, all the intensity of the pixels that are outside the triangle are set to zero. The triangle has constant coordinates because of this reason it could be think not always the road will be inside the triangle, however after testing different images is enough the triangle to get the road, in figure 2 we show our method to cut with triangle shape.
Figure 2 Cut images
2.3 Canny to left and right images f) g) These processes are represented by the blocks f) and g) in the figure 1, the canny algorithm is used to get the edges of the speed booms, and we used Matlab to apply canny, with good results. 2.3 Bottom edge detection h) i) These processes are represented by the blocks h) i) in the figure 1. For our purpose the speed booms can be modeled by truncated triangle figure 3. The longest edge is the speed booms bottom side. The algorithm canny is applied to get the speed booms edges and the horizontal line that has a graters number of pixels, is the one at the bottom of the speed booms.
Figure 3 Truncated triangle model of the speed
booms
2.3 Crop the images h) i) This process is edge alignment of left and right is represented by the block (j) in the figure 1. With the information given by the edges recognition, it is possible to calculate the displacement between the bottom edges from right to left speed booms images.
ADVANCES in MATHEMATICAL and COMPUTATIONAL METHODS
ISSN: 1792-6114 259 ISBN: 978-960-474-243-1

This displacement is originated because of the different time of capture for the two cameras in our case this time is approximately 27 milliseconds. The right image was displaced and had to be cut again with shape triangle. When we take disparity from left and right images, the cut triangle appears like and unreal objet that is not good result, for that reason we cut again the image like in block e) disappearing the triangle in the disparity map. If we had the coordinates of speed booms edges highest and lowest. It would be possible to contrast the colors between that coordinate. The speed booms in Mexico are usually painted white and yellow figure 4, we translate this colors to red and green respectively figure 5, to make easy the contrast between right and left images in calculate of disparity map, when the images left and right have been cut, aligned and painted we get the disparity map using the program Stereo Plus. This process is edge alignment of left and right the represented by the block (j) in the figure 1. With the information given by the recognition edges, it is possible to calculate the displacement between the bottom edges from right to left speed booms images. This displacement is originated for the different time of capture for the two cameras in our case this time is approximately 27 milliseconds. The right image was displaced and it has been cut again with shape triangle. When we take disparity from left and right images, the cut triangle appears like and unreal objet that is not good result, we cut again the image like in block e) disappearing the triangle in the disparity map.
Figure 4 Speed booms is painted with yellow and white
Figure 5 Speed booms colored to green and red
2.4 Dilatation and erosion k) This process is represented by the block (k). For isolate the speed booms disparity from other elements we apply erosion [6] two times with structural element [11111;11111] and [1 0 1 0 1 ] after that, we apply dilation [6] with structural element('octagon',3) and ('rectangle',[1 70]).
3 Results Test have been done with real speed booms with different distances from speed booms to vehicle, we used two cameras web Logitech pro 9000 Figure 10 and usb 2.0 and even the cameras can give a resolution of 1600x1200 pixels, a resolution of 320x240 pixels was used, we used a laptop Acer Aspire One, with processor Atolom 1.6GHZ and 1 GRam, we run in Windows XP and using OpenCvLibreries. The tests were carried out at 2 pm time of Mexico City, it was a sun day.
Figure 6 a) Two cameras, b) zoom to camera
3.1 Large distance speed booms Approximately at the middle of the figure 7 a speed booms can be seen. A little line far in distance in road and a wall is seen too. We applied the methodology describe before to recognize the obstacles.
Figure 7 Speed booms far a) left and b) right image taken in
Mexico City
In Figure 8 a) and b) left and right images can be seen only a triangle area. The roadway is gray and the speed booms looks like a thin clear horizontal line, a shade of a tree is in the bottom right image. A parabola open up is seen it is caused by the reflex board car. The result to apply canny algorithm to figure 8 a) and b) is shown in c) d), before we tested several thresholds for canny algorithm, we chose 0.1 because if we used 0 many edges appear, if we used 0.9 a black image would be obtained.
ADVANCES in MATHEMATICAL and COMPUTATIONAL METHODS
ISSN: 1792-6114 260 ISBN: 978-960-474-243-1
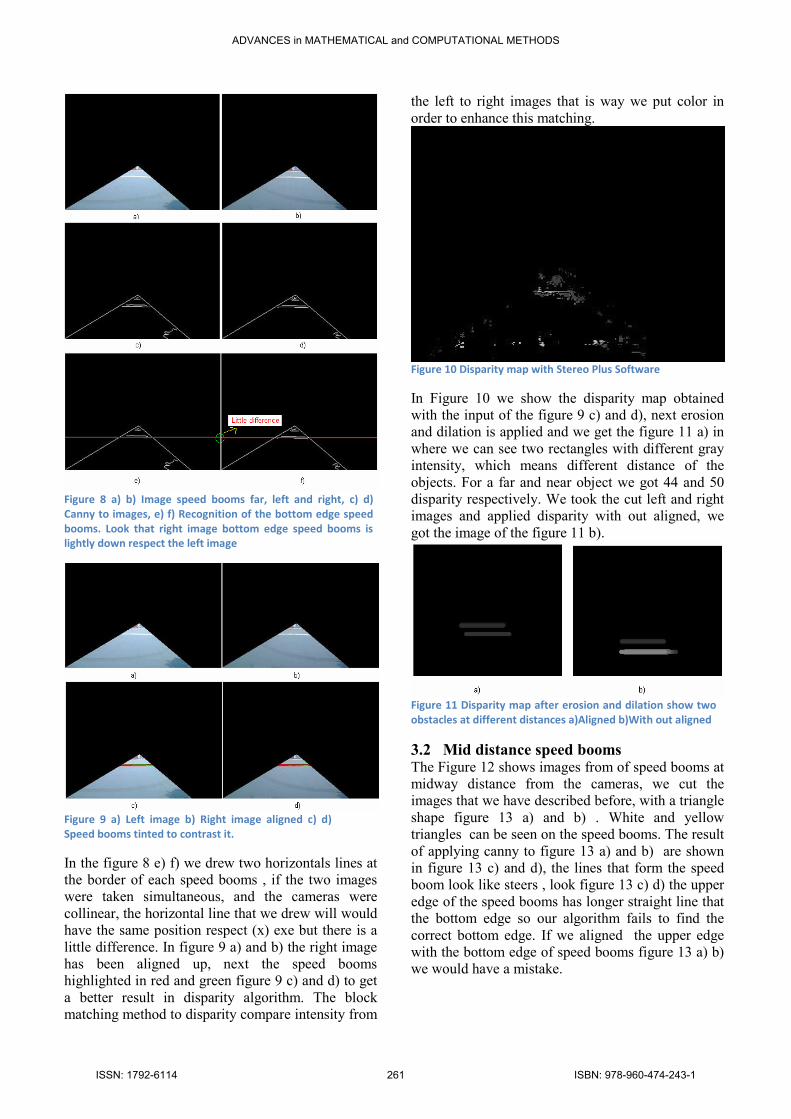
Figure 8 a) b) Image speed booms far, left and right, c) d)
Canny to images, e) f) Recognition of the bottom edge speed
booms. Look that right image bottom edge speed booms is
lightly down respect the left image
Figure 9 a) Left image b) Right image aligned c) d)
Speed booms tinted to contrast it.
In the figure 8 e) f) we drew two horizontals lines at the border of each speed booms , if the two images were taken simultaneous, and the cameras were collinear, the horizontal line that we drew will would have the same position respect (x) exe but there is a little difference. In figure 9 a) and b) the right image has been aligned up, next the speed booms highlighted in red and green figure 9 c) and d) to get a better result in disparity algorithm. The block matching method to disparity compare intensity from
the left to right images that is way we put color in order to enhance this matching.
Figure 10 Disparity map with Stereo Plus Software
In Figure 10 we show the disparity map obtained with the input of the figure 9 c) and d), next erosion and dilation is applied and we get the figure 11 a) in where we can see two rectangles with different gray intensity, which means different distance of the objects. For a far and near object we got 44 and 50 disparity respectively. We took the cut left and right images and applied disparity with out aligned, we got the image of the figure 11 b).
Figure 11 Disparity map after erosion and dilation show two
obstacles at different distances a)Aligned b)With out aligned
3.2 Mid distance speed booms The Figure 12 shows images from of speed booms at midway distance from the cameras, we cut the images that we have described before, with a triangle shape figure 13 a) and b) . White and yellow triangles can be seen on the speed booms. The result of applying canny to figure 13 a) and b) are shown in figure 13 c) and d), the lines that form the speed boom look like steers , look figure 13 c) d) the upper edge of the speed booms has longer straight line that the bottom edge so our algorithm fails to find the correct bottom edge. If we aligned the upper edge with the bottom edge of speed booms figure 13 a) b) we would have a mistake.
ADVANCES in MATHEMATICAL and COMPUTATIONAL METHODS
ISSN: 1792-6114 261 ISBN: 978-960-474-243-1

Figure 12 Mid distance speed booms, the speed
booms is drawn with triangles white and yellow
Figure 13 a) b) Image speed booms mid distance, left
and right, c) d) Canny to images.
Figure 14 Straight line that cause false recognition of speed
booms
It does not have sense to put color in the images with bad edge recognition, because our interest is to put color in the speed booms, not in others elements of the image.
Figure 15 Bad recognition of upper edge versus good
recognition of bottom edge
Figure 16 Right Image has been displaced up
Figure 17 Disparity map got with Stereo Plus and OpenCv
libraries with block matching algorithm
Figure 18 a) Erosion and dilation applied to aligned
map disparity b)Erosion and dilation applied to not
aligned images
In Figure 18 a) shows like would had been several objects , If we look the results not aligned of figure 18 b) we can see two obstacles, with the different intensity. It is shown that one is closer than the other so in this case is better not aligned.
3.2 Near distance speed booms In Figure 19 left and right images of a near speed booms are shown, we applied the same methodology that we have been using, because of speed booms is closer to the vehicle, the disparity is bigger than the disparity of midway speed booms.
ADVANCES in MATHEMATICAL and COMPUTATIONAL METHODS
ISSN: 1792-6114 262 ISBN: 978-960-474-243-1

Figure 19 Near speed booms left and right images respectively
Figure 20 a) b) Cut Image near speed booms, left and right
respectively c) d) Canny Edges
In the figure 20 c) and d) we can recognize two obstacles, at the bottom is the speed boom and the edges that form the white and yellow triangles are visible . In Figure 21 a) b) we drew a straight line at the bottom edge of each speed booms image and can be seen that the lines do not match each other. In Figure 22 we align the right image to match the left image.
Figure 21 a) Left b) Right the speed booms bottom edge has a
little difference between left and right images
Figure 22 The right image had been aligned to match the left
In figure 23 we put red color in yellow triangles of the speed booms with the goal of making easy the correlation in the block matching algorithm for the disparity calculation. We apply the stereo plus software to the figure 23 and we get the figure 24 a). In Figure 24 a) we can appreciate two objects one of them is the near speed booms. We apply erosion and dilation to Figure 24 a) and we get figure 24 b) we got two objects that represent two obstacles one with disparity of (143 to 173) and the other with disparity of 103 that mean that one is closer than other.
Figure 23 The original yellow triangles in a speed booms were
modified to red triangles
Figure 24 a) Disparity map with Stereo Plus b)Disparity map
after erosion and dilation
In figure 24 b) we did not align the images so we recognize two objects one with disparity of 140 to 172 and the other with disparity of 89, so one is closer than other.
4 Conclusion In this paper we propose a method to detect speed booms, using: disparity, canny, color recognition and align the right image to the left, we use two cameras web plugged by USB, one capture is first than other that is why we aligned the right image, we use as reference the bottom edge of a speed booms using canny algorithm to detect the bottom edge but is not always a straight line the bottom edge for that reason some times we fail to detect the bottom edge of the speed booms in that cases it is better not to aligned the images. When the vehicle is moving in conditions of real live, the left and right camera can receive different quantity of light, that is because shadows of trees and buildings cover one of the cameras or reflex of other vehicles etc, causing that the left or right image is shinier than the other, difficulting the block
ADVANCES in MATHEMATICAL and COMPUTATIONAL METHODS
ISSN: 1792-6114 263 ISBN: 978-960-474-243-1

matching algorithm to get correctly disparity. In several test that we did, we conclude that is enough to cut the images in shape triangle to get road navigation. There are some roads where there are not lanes like in figure 12.
References:
[1] Hee Chang Moon, Kyoung Moo Min and Jung Ha Kim, Vision System of Unmanned Ground Vehicle, International Conference on Control, Automation and Systems Seoul, Korea, 2008
[2] Basel Fardi, Tobias John, Hendrik Weigel, Marc Walessa, Gerd Wanielik. Unobstructed Space Recognition with a Monochrome Camera, 2008 IEEE Intelligent Vehicles Symposium, vol., no., 2008,pp.577-583
[3] N. Suganuma, M. Shimoyama, N. Fujiwara. Obstacle Detection Using Virtual Disparity Image for Non-flat Road, Intelligent Vehicles
Symposium, 2008 IEEE Eindhoven, 2008, pp. 596 - 601.
[4] Kunsoo Huh, Jaehak Park, Junyeon Hwang, Daegun Hong, A Stereo Vision-Based Obstacle Detection System in Vehicles, Optics and Lasers in Engineering. Volume 46, Issue 2, February 2008, Pages 168-178
[5] Brown, M.Z., Burschka, D., Hager, G.D. Advances in Computational Stereo, Pattern
Analysis and Machine Intelligence, vol.25, no.8, Aug. 2003, pp. 993- 1008, Aug. 2003
[6]Gonzalez, Woods, Eddins, Digital Image
Processing Using MATLAB, Prentice Hall, 2004 [7]Rocique Patricia Compañ, Estimación de la
Disparidad en Visión Estereoscópica Tratamiento
De Color, Universidad de Alicante, España, 2004 [8]Pajares Martinsanz Gonzalo, Visión por
Computador Imagenes Digitales y Aplicaciones, Alfaomega, 2008
[9] Klette Reinhard, Liu Zhifeng, Computer Vision for the Car Industry, Multimedia Imaging Report 9,The University of Auckland, 2008
[10] Ali Al-Sarraf, Videos of the sequence along with trajectories of the ego-vehicle, Image Sequence Analysis Test Site, http://www.mi.auckland.ac.nz/index.php?option=
com_content&view=article&id=45:enpeda-data-
set-1&catid=25:the-project
[11]Ramesh Jain, Rangachar Kasturi, Brian G. Schunck, Machine Vision, Mc. Graw Hill, 1995
[12]K.Hedenberg, B. Astrand, Obstacle Detection For Thin Horizontal Structures, Proceedings of the World Congress on Engineering and
Computer Science,San Francisco , USA, 2008 [13]Rosselot Donald, L. Hall Ernest, Processing real-
time stereo video for an autonomous robot using
disparity maps and sensor fusion, Center for Robotics Research Department of Mechanical,
Cincinnati USA
[14]Zitnick Lawrence, Kanade Takeo, A Cooperative Algorithm for Stereo Matching and Occlusion Detection, IEEE Transactions on Pattern Analysis and Machine Intelligence,Vol. 22, NO. 7
[15]Stephen T. Barnard, William B. Thompson, Disparity Analysis of Images, IEEE Transactions On Pattern Analysis And Machine Intelligence,, Vol. PAMI-2, No. 4, 1980, pp. 333-340.
ADVANCES in MATHEMATICAL and COMPUTATIONAL METHODS
ISSN: 1792-6114 264 ISBN: 978-960-474-243-1