
speech_aud
13
Slide 1 Vocal Audiometry in Hearing Aid Outcome Measurements Paul Corthals a,b Annika Degryse a Marijke De Bont a a Faculty of Medicine and Health Sciences, Ghent University, Ghent, Belgium b Faculty of Health Care ‘Vesalius’, University College Ghent, Ghent, Belgium Session Number: 0164 Day/Time: 11/20/09 -- 3:30PM-3:45PM Room: 346 Slide 2 2 Humes & Amos (2009)*: VALIDATING HEARING AID FITTINGS aided & unaided speech audiometry preferably in noise and representative of daily listening conditions data logging on hearing aid usage self-reported “benefaction” (benefit/satisfaction) • Humes, L.E. , Amos N.E. (2009): Are your hearing aid fittings “on target”? The ASHA Leader (14) p. 7 According to Humes and Amos, hearing aid verification should include three aspects. Speech audiometry in noise is one of them. This study is about speech audiometry in quiet. It is often used to validate hearing aid fitting with poorly performing clients. We will investigate what it is worth. Slide 3 3 PART I distribution of daily speech sound pressure levels PART II speech audiometry revisited PART III results (n=45)
-
Upload
brett-rodriguez -
Category
Documents
-
view
212 -
download
0
description
speech_aud
Transcript of speech_aud

Slide 1
Vocal Audiometry in Hearing Aid Outcome Measurements
Paul Corthalsa,b
Annika Degrysea
Marijke De Bonta
a Faculty of Medicine and Health Sciences, Ghent University, Ghent, Belgiumb Faculty of Health Care ‘Vesalius’, University College Ghent, Ghent, Belgium
Session Number: 0164Day/Time: 11/20/09 -- 3:30PM-3:45PM
Room: 346
Slide 2
2
Humes & Amos (2009)*:
VALIDATING HEARING AID FITTINGS
� aided & unaided speech audiometrypreferably in noise and representative of daily listening conditions
� data logging on hearing aid usage
� self-reported “benefaction” (benefit/satisfaction)
• Humes, L.E. , Amos N.E. (2009): Are your hearing aid fittings “on target”? The ASHA Leader (14) p. 7
According to Humes and Amos, hearing aid verification should
include three aspects. Speech audiometry in noise is one of
them. This study is about speech audiometry in quiet. It is often
used to validate hearing aid fitting with poorly performing
clients. We will investigate what it is worth.
Slide 3
3
PART I
distribution of daily
speech sound pressure levelsPART II
speech audiometry revisited
PART IIIresults (n=45)
Slide 4
4
PART I
distribution of daily
speech sound pressure levelsPART II
speech audiometry revisited
PART IIIresults (n=45)
Slide 5
5
• 400 volunteers (197 males, 203 females)
• between 7 and 65 years of age, some 65 +
• reflection of population pyramid in Belgium
• 70 word rainbow passage (approx. 1 minute of reading)
• Larson-Davis sonometer type 824
(1/2 inch condenser microphone, Bruel&Kjaer calibration apparatus)
• living room acoustics (ambient noise <40 dBA)
• mouth-to-mike distance 0.3 m
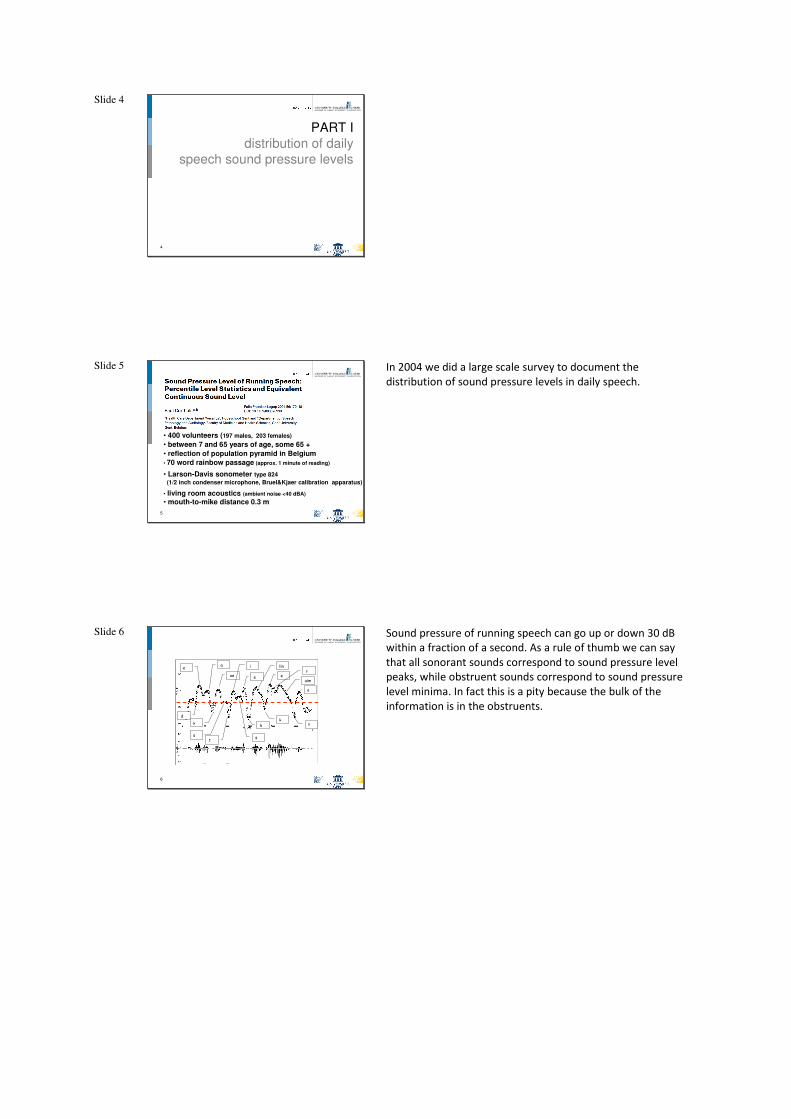
In 2004 we did a large scale survey to document the
distribution of sound pressure levels in daily speech.
Slide 6
6
d
k
s
k t
e lina
oe
i
e e
r
uim
e
ts
k
Sound pressure of running speech can go up or down 30 dB
within a fraction of a second. As a rule of thumb we can say
that all sonorant sounds correspond to sound pressure level
peaks, while obstruent sounds correspond to sound pressure
level minima. In fact this is a pity because the bulk of the
information is in the obstruents.

Slide 7
7
SPL
TIME
60 sec
1sec3sec0.2sec0.8sec1sec 6sec
L10
The L10 level is
• rather loud (open vowels, ...)
• speech is most often below it
6/60 is 10%
Ln duration percentile level for sound pressure
A state of the art sound level meter can follow all details and
produce several indices, for instance, the duration percentiles
of sound pressure level. Here we see the tenth percentile or
L10 (6 seconds of the 60 seconds measurement episode is 10 %
of measurement time).
Slide 8
8
SPL
TIME
60 sec
34sec20sec 54sec
L90
The L90 level is
• rather soft, quiet
• speech is almost always above it
54/60 is 90%
Ln duration percentile level for sound pressure
Slide 9
9
MEAN Standard deviation Minimum Maximum
L_1 76.91 4.23 67 91
L_10 73.50 4.00 64 87
L_20 72.03 3.97 63 86
L_30 70.86 3.90 61 85
L_40 69.72 3.92 60 83
L_50 68.46 3.90 59 82
L_60 67.00 3.86 54 80
L_70 64.83 4.07 49 79
L_80 61.07 3.98 47 74
L_90 56.33 3.88 45 71
L_99 50.94 3.51 42 65
These duration percentile levels are not all equally relevant.
The lower duration percentile levels (higher decibel values) are
rare, most of the time speech is softer. Moreover, since these
levels represent the loudest speech fragments, they are caused
by vowels, not by consonants. We all know that the bulk of
information is in the consonants, not in the vowels.

Slide 10
10
PART I
distribution of daily
speech sound pressure levelsPART II
speech audiometry revisited
PART IIIresults (n=45)
We will now try to implement this knowledge in the realm of
speech audiometry, particularly speech audiometry for the
purpose of hearing aid evaluation.
Slide 11
11
“muur”
hmm…wall
???
In speech audiometry, more sound pressure levels than just
those of daily speech can be presented.
Slide 12
12
The graph shows levels that in speech audiometry softer or
louder can be presented, but these clearly do not relate to daily
speech. They may be diagnostically relevant (for detecting the
roll over phenomenon for instance), but when it comes to
predict real life performance in hearing aid users they are
irrelevant because speech does not sit in that range.

Slide 13
13
Of course, we have to accept the fact that the position of the
representative zone is an approximation. For instance, the
acoustics of the room can change sound pressure level for a
listener at any given distance.
Slide 14
14
SPL = Ps + 10 log [(1/4 πr²)+(4/A)]
(Crandell & Smaldino)
Leq of running
speech at 30cm
This graph shows the effect of room acoustics. Depending on
the room’s absorption factor, sound pressure level varies.
When we compare a room with rather hard, reflecting walls
with a room with extremely absorbing wall surfaces at a typical
conversation distance( let’s say 1m), this variation is limited to
about 5 dB.
SPL (Crandell & Smaldino) = Ps + 10 log [(1/4 πr²)+(4/A)]
where Ps stands for the power of the sound source, r for the
speaker-listener distance and A for absorption in the room.
Slide 15
15
representative
sections of vocal
audiogram
adjusted for 1m
minimal absorption in room
rounded to nearest multiple of 5 dB
L50 70 dBSPL
L70 65 dBSPL
L90 55 dBSPL
L99 50 dBSPL
These are the most representative sections of the vocal
audiogram when it comes to predict performance for daily
speech

Slide 16
16
Even within the dynamic range of speech, the most relevant
part is the L99-L50 zone. It is there that speech sits most of the
time and it is there that the bulk of the information is to be
found. This was corroborated in a preliminary investigation
(Hilde Ooms, 2003): we found that the higher duration
percentile levels such as L99 and L90 (i.e. the softer sound
pressure levels that occur more often) correlated better with
questionnaire data on aided performance than the lower Ln
levels (louder sound pressure level that occur less often).
Slide 17
17
L 99....
L 50
This is why we decided to concentrate on test results in the
L99-L50 zone. We collected information from 45 hearing aid
users. We looked at the functional gain on their speech
audiogram. This concept of functional gain, i.e. the difference
between the free field aided and unaided results, can be
quantified in several ways.
Slide 18
18
UNAIDED
“prevailing” PBmax
(L50-L99)
• L50
• 60%
• 70 dB
Let us look at a fictional patient. These are his unaided results.
The best score (PBmax) within the most representative zone is
60% on 70 dB which corresponds to duration percentile level
50.

Slide 19
19
AIDED
“prevailing” PBmax
(L50-L99)
• L70
• 80%
• 65 dB
These are his aided results. The best score (PBmax) within the
most representative zone now is 80% on 65 dB which
corresponds to duration percentile level 70.
Slide 20
20
UNAIDED VS AIDED
“prevailing” PBmax
(L50-L99)
60% => 80%
Quantified as a percentage of words understood, his functional
gain is 20% (from 60 to 80%)
Slide 21
21
UNAIDED VS AIDED
“prevailing” PBmax
(L50-L99)
• 70 dB => 65 dB
Quantified as a jump on the decibel axis, his functional gain is
5dB (from 70 to 65dB)

Slide 22
22
UNAIDED VS AIDED
“prevailing” PBmax
(L50-L99)
• L50 => L70
Quantified as a jump on the duration percentile scale, his
functional gain is 20 percentiles (L50 to L70)
Slide 23
23
UNAIDED VS AIDED
L99 GAIN
• 20% => 70%
We could also quantify functional gain on discrete duration
percentile levels.
Slide 24
24
UNAIDED VS AIDED
L90 GAIN
• 35% => 75%

Slide 25
25
UNAIDED VS AIDED
L70 GAIN
• 55% => 80%
Slide 26
26
UNAIDED VS AIDED
L50 GAIN
• 60% => 80%
Slide 27
27
PART I
distribution of daily
speech sound pressure levelsPART II
speech audiometry revisited
PART IIIresults (n=45))

Slide 28
28
The question now is: which of these quantification schemes, if
any, is valid. One could say they are all provider-driven
estimates of fitting success. We should confront them with
consumer driven estimates of fitting success.
Slide 29
29
The best way to verify validity is to ask patients themselves.
The International Outcome Inventory for Hearing Aids (IOI-HA)
questionnaire (we used the authorized Dutch translation)
covers several domains. One of these domains is hearing aid
benefit.
Slide 30
30
• 45 hearing aid users
22 males, 23 females
between 31y5m and 87y6m
sensorineural hearing loss (see next slide)
12 unilateral, 33 bilateral fitting
1 to 11 years of experience with hearing aid(s))
• unaided & aided speech audiometry: provider driven
indices
• hearing aid benefit questionnaire: consumer driven
indices
• predictive value of provider indices: correlations,
regressions

Slide 31
31
Unaided hearing thresholds in R and L ear. Mostly symmetrical
sensorineural losses.
Slide 32
32
Correlations
1 ,216 ,570* ,633* ,529 -,531 ,773** ,274 ,274 -,317
,458 ,033 ,015 ,052 ,051 ,001 ,344 ,344 ,269
14 14 14 14 14 14 14 14 14 14
,216 1 ,250 -,341* -,216 ,342* -,267 ,103 ,328 ,431**
,458 ,098 ,022 ,154 ,022 ,076 ,551 ,051 ,003
14 45 45 45 45 45 45 36 36 45
,570* ,250 1 ,238 ,026 ,316* ,058 ,226 ,218 ,185
,033 ,098 ,116 ,868 ,035 ,703 ,185 ,201 ,223
14 45 45 45 45 45 45 36 36 45
,633* -,341* ,238 1 ,656** -,152 ,767** ,263 ,002 -,026
,015 ,022 ,116 ,000 ,320 ,000 ,121 ,990 ,866
14 45 45 45 45 45 45 36 36 45
,529 -,216 ,026 ,656** 1 -,159 ,965** -,381* -,362* ,137
,052 ,154 ,868 ,000 ,295 ,000 ,022 ,030 ,370
14 45 45 45 45 45 45 36 36 45
-,531 ,342* ,316* -,152 -,159 1 -,225 ,012 ,094 ,205
,051 ,022 ,035 ,320 ,295 ,138 ,943 ,586 ,178
14 45 45 45 45 45 45 36 36 45
,773** -,267 ,058 ,767** ,965** -,225 1 -,188 -,254 ,111
,001 ,076 ,703 ,000 ,000 ,138 ,273 ,136 ,468
14 45 45 45 45 45 45 36 36 45
,274 ,103 ,226 ,263 -,381* ,012 -,188 1 ,892** ,090
,344 ,551 ,185 ,121 ,022 ,943 ,273 ,000 ,601
14 36 36 36 36 36 36 36 36 36
,274 ,328 ,218 ,002 -,362* ,094 -,254 ,892** 1 ,226
,344 ,051 ,201 ,990 ,030 ,586 ,136 ,000 ,185
14 36 36 36 36 36 36 36 36 36
-,317 ,431** ,185 -,026 ,137 ,205 ,111 ,090 ,226 1
,269 ,003 ,223 ,866 ,370 ,178 ,468 ,601 ,185
14 45 45 45 45 45 45 36 36 45
Pearson Correlation
Sig. (2-tailed)
N
Pearson Correlation
Sig. (2-tailed)
N
Pearson Correlation
Sig. (2-tailed)
N
Pearson Correlation
Sig. (2-tailed)
N
Pearson Correlation
Sig. (2-tailed)
N
Pearson Correlation
Sig. (2-tailed)
N
Pearson Correlation
Sig. (2-tailed)
N
Pearson Correlation
Sig. (2-tailed)
N
Pearson Correlation
Sig. (2-tailed)
N
Pearson Correlation
Sig. (2-tailed)
N
GAIN srtlev el
GAIN L99
GAIN_L90
GAIN_L70
GAIN_L50
BEST % aided
GAIN Best % in %
GAIN Best % in Ln
GAIN Best % in dB
Antwoord vraag 2
GAIN srtlev el GAIN L99 GAIN_L90 GAIN_L70 GAIN_L50
BEST %
aided
GAIN Best
% in %
GAIN Best
% in Ln
GAIN Best
% in dB
Antwoord
vraag 2
Correlation is signif icant at the 0.05 lev el (2-tailed).*.
Correlation is s ignif icant at the 0.01 level (2-tailed).**.
The only question from the IOI questionnaire correlating
significantly with any of the speech audiometry indices was
question #2. Question #2 is about hearing aid benefit. You can
see the logic in that: better results on the vocal audiogram
results in consumer satisfaction. The striking points here are
that none of te other domains in the questionnaire relate to
speech audiometry, and secondly: it is the L99 region in
particular relates to hearing aid benefit.
Slide 33
33
Excluded Variables b
,125a
,580 ,566 ,100 ,500
,191a
1,100 ,279 ,188 ,746
,111a
,708 ,484 ,122 ,935
,132a
,799 ,430 ,138 ,841
,184a
,985 ,332 ,169 ,650
,125a
,580 ,566 ,100 ,500
,191a
1,100 ,279 ,188 ,746
,111a
,708 ,484 ,122 ,935
,132a
,799 ,430 ,138 ,841
,183a
,963 ,342 ,165 ,627
,171a 1,118 ,272 ,191 ,960
,189a 1,173 ,249 ,200 ,860
,187a 1,223 ,230 ,208 ,955
,099a ,593 ,557 ,103 ,822
,111a ,724 ,474 ,125 ,976
,174a 1,077 ,289 ,184 ,861
,041a ,270 ,789 ,047 ,989
,036a
,229 ,821 ,040 ,924
% COMPREHENSION on
L99 aided
% COMPREHENSION on
L90 aided
% COMPREHENSION on
L70 aided
% COMPREHENSION on
L50 aided
mean COMPREHENSION
aided
Ln weighted
COMPREHENSION on
L99 aided
Ln weighted
COMPREHENSION on
L90 aided
Ln weighted
COMPREHENSION on
L70 aided
Ln weighted
COMPREHENSION on
L50 aided
mean Ln weighted
COMPREHENSION aided
mean GAIN
mean Ln-weighted GAIN
GAIN L90
GAIN L70
GAIN L50
BEST % aided
GAIN Best % in Ln
RESIDUAL LOSS
BestLn-99
Model1
Beta In t Sig.
Partial
Correlation Tolerance
Collinearity
Statistics
Predictors in the Model: (Constant), GAIN L99a.
Dependent Variable: Answer # 2b.
We did stepwise multiple regressions, using all duration
percentile indices as potential predictors of hearing aid benefit.
Again all indices were rejected except one: speech audiometric
gain for duration percentile Level99. This does not mean that
the other indices are completely irrelevant. As the tolerance
coefficients show, the reason for their being absent in the final
model is multicollinearity. The concept of multicollinearity
refers to a high intercorrelation between one independent
variable and another one or a combination of others within the
set. Stated otherwise, multicollinearity signals a situation where
predictors, which are the so-called independent variables, are
in fact not entirely independent. The tolerance coefficient
shows how much variance a predictor can still explain on its
own after the contribution of all of its correlates has been
partialled out. These values are quite high for a lot of duration
percentile level indices.

Slide 34
34
Model Summary
Model R R Square Adjusted R
Square Std. Error of the Estimate
1 ,480(a) ,230 ,207 ,690
a Predictors: (Constant), GAIN L99 ANOVA(b)
Model Sum of Squares df Mean Square F Sig.
Regression 4,829 1 4,829 10,153 ,003(a)
Residual 16,171 34 ,476
1
Total 21,000 35
a Predictors: (Constant), GAIN L99 b Dependent Variable: Answer # 2 Coefficients(a)
Adjusted R² values point out that about one fifth of all variance
in consumer appreciation is determined by speech audiometric
gain expressed in % and measured on duration percentile
Level99.
Slide 35
35
Model Summary
Model R R Square Adjusted R
Square Std. Error of the Estimate
1 ,599(a) ,358 ,024 ,765
2 ,599(b) ,358 ,064 ,749
3 ,599(c) ,358 ,102 ,734
4 ,599(d) ,358 ,136 ,720
5 ,599(e) ,358 ,168 ,707
6 ,594(f) ,353 ,191 ,697
7* ,592(g) ,351 ,217 ,686
8* ,585(h) ,342 ,233 ,678
9* ,575(i) ,331 ,245 ,673
10** ,566(j) ,321 ,257 ,668
11** ,561(k) ,315 ,274 ,660
* p < 0.05 ** p < 0.01 g Predictors: Ln weighted COMPREHENSION on L50 aided, Ln weighted COMPREHENSION on L70 aided,
% COMPREHENSION on L99 aided, BEST % aided, % COMPREHENSION on L90 aided, mean %GAINED
h Predictors: Ln weighted COMPREHENSION on L50 aided, Ln weighted COMPREHENSION on L70 aided,
% COMPREHENSION on L99 aided, BEST % aided, mean %GAINED
i Predictors: Ln weighted COMPREHENSION on L70 aided, % COMPREHENSION on L99 aided, BEST % aided,
mean %GAINED
j Predictors: Ln weighted COMPREHENSION on L70 aided, COMPREHENSION on L99 aided, mean %GAINED
k Predictors: % COMPREHENSION on L99 aided, mean %GAINED
k Predictors: % COMPREHENSION on L99 aided, mean %GAINED ON ALL Ln
Another approach to the same question is a backward muiltiple
regression analysis. Just as in stepwise multiple regression, this
is a competition among variables or teams of variables and the
competition still is predicting self-ratings hearing aid benefit.
The difference between the two games is that stepwise
regression invites predictors one by one seeking one single
champion or a winning coalition, whereas backward regression
starts with all possible coalitions and individual players. The
result is that more possibilities pop up. The first six models are
not significant. The last model is the best one, since adjusted R²
values now climb to 27%. The combination of predictors is: (1)
comprehension on duration percentile Level99 and (2) overall
gain on all Ln levels from L50 to L99. Beta coefficients point out
that both weigh about equally. Again duration percentile L99 is
among the relevant predictors. When this metric is combined
with
Slide 36
36
Here we have thrown in an old favorite in the competition of
predictors (forward regression): prosthetic gain on SRT level,
i.e. shift of the PI-curve to the left measured in decibels at the
50% comprehension level, the so-called threshold of
intelligibility has been added. In contrast to all predictors up to
now, this is not a % score (upward shift of the PI-curve), this is a
decibel score (leftward shift of the PI-curve). There is one
caveat here, we could do this only for a subset of the database,
so the number of participants is less. When we introduced
extrapolated SRT values to expand the dataset, all coefficients
decreased. Anyhow, this team of predictors gives a boost to R²
values (the adjusted R² climbs to 47% of variance explained).
Note that even now there is a L99 duration percentile metric in
the winning team and, according to the Beta coefficients, it
outweighs the old dB-shift favorite.

Slide 37
37
If there is one hint for hearing aid evaluation procedures that
emerges from all of this, this is it: keep an eye on the results for
duration percentile level L99, which is near 50 dBSPL This level
correlates with consumer ratings of hearing aid benefit. It pops
up in all prediction schemes weighing considerably on the
equation. There is some logic in that: it is is the bottom level of
speech sound pressure level. Gain on even softer presentation
levels do not directly relate to speech intelligibility. The more
prosthetic gain on this level, the better the guarantee for
appropriate amplification of soft sounds, which carry the bulk
of the information.


