Speech Perception with Cochlear Implants
43
Shannon SHAR Chapter page 1 Speech Perception with Cochlear Implants Robert V. Shannon Qian-Jie Fu John Galvin Lendra Friesen House Ear Institute 2100 W. Third St. Los Angeles, CA 90057 Chapter 8 in Auditory Prostheses , F-G Zeng, AN Popper, and RR Fay, Eds. Springer Handbook of Auditory Research, Volume X Original Draft: 21 January 2002 Revision: 9 April 2003 Send Correspondence to: Robert V. Shannon House Ear Institute 2100 W. Third St. Los Angeles, CA 90057 USA Phone: (213) 353-7020 FAX: (213) 413-0950 e-mail: [email protected]
Transcript of Speech Perception with Cochlear Implants

Shannon SHAR Chapter page 1
Speech Perception with Cochlear Implants
Robert V. Shannon Qian-Jie Fu John Galvin
Lendra Friesen
House Ear Institute 2100 W. Third St.
Los Angeles, CA 90057
Chapter 8 in Auditory Prostheses, F-G Zeng, AN Popper, and RR Fay, Eds. Springer Handbook of Auditory Research, Volume X
Original Draft: 21 January 2002
Revision: 9 April 2003
Send Correspondence to: Robert V. Shannon House Ear Institute 2100 W. Third St. Los Angeles, CA 90057 USA Phone: (213) 353-7020 FAX: (213) 413-0950 e-mail: [email protected]
Shannon SHAR Chapter page 2
1.0 Introduction Cochlear implants, besides restoring hearing sensation to otherwise deaf
individuals, provide an excellent tool with which to investigate how the human central nervous system (CNS) processes complex patterns of sensory information. Throughout the lifetime of normal-hearing persons, the auditory CNS has been continually trained to extract meaningful speech (and other meaningful sounds) from a constant barrage of auditory sensory information. The CNS establishes networks to process auditory sensory information; for complex pattern recognition tasks, these networks can take as long as ten to twelve years to fully develop (see Hartmann and Kral, Chapter 6). Once these networks are fully mature, auditory pattern recognition is highly robust to degradations in the sensory signal, as revealed by decades of speech perception research. For example, military cryptologists in the 1940’s searched for a type of signal degradation that would render speech unintelligible during transmission (but could be decoded at the receiving end by reversing the degradation, thereby restoring intelligibility). To their amazement, even severe alterations to the speech signal did not destroy its intelligibility. One of the most well known examples is the work of Licklider and Pollack (1948) who eliminated all amplitude information of the speech signal by means of “infinite clipping” (the signal waveform was simply absent or present, according to an amplitude threshold). Although the speech signal was effectively reduced to zeros and ones, the speech remained highly intelligible.
When a person becomes severely hearing impaired or deaf, their central pattern recognition mechanisms do not receive enough sensory information to understand speech. But as Licklider’s experiment showed, considerable information can be deleted from the speech signal with only minor deleterious effects. In designing prosthetic devices for deaf or hearing-impaired listeners, we need to understand the relative importance of different acoustic features found in speech. Because present cochlear implant technology cannot preserve all the acoustic features found in speech, those features that are critically important for speech recognition must be preserved, while those that are less important may be sacrificed. The question is, which features are most important?
Consider the following example to clarify the interaction between the quality of information provided by the sensory system and the brain’s pattern recognition. Figure 1a shows a familiar picture that has been “pixelized”; the visual sensory information in the picture has been reduced to a coarse grid of shaded squares. Yet most people will recognize that this is a picture of a man, and many people (at least in the USA) will even be able to identify the man in the picture - Abraham Lincoln. We are able to identify Lincoln because this is not just any picture of the president – it is the most familiar picture of Lincoln: the one on the US $5 bill. If the same degree of pixelization were applied to a less familiar picture (even an unfamiliar picture of Lincoln), most people would not be able to identify the person in the picture. An unfamiliar picture would require much more sensory resolution (smaller pixels) before it was recognizable.

Shannon SHAR Chapter page 3
Auditory and visual pattern recognition seem to share some general properties. Speech recognition is a highly trained and well-practiced skill based on auditory pattern recognition, particularly for familiar talkers in the listener’s native language. Recognizing familiar speech may be analogous to the recognizing a familiar picture of Lincoln – a coarse representation may be enough. However, if the talker is unfamiliar, or speaking with a heavy accent, or talking in a noisy environment, additional sensory detail may be required to recognize the words, just as a less familiar picture would require additional visual detail.
With a prosthetic device like the cochlear implant, the sensory pattern provided to the brain may be coarse as well as distorted, due to idiosyncrasies in individuals’ surviving neural populations, the number and location implanted electrodes, and/or speech processing of the acoustic signal. Thus, for many cochlear implant patients, the brain must overcome both the reduced sensory resolution of and distortion to the auditory pattern. A visual analogy is provided in Figure 1b-d. Even if people were able to recognize the image of Lincoln when it is pixilated (Figure 1a), it is unlikely that they would be able to recognize a pixelized Lincoln that had been distorted by: bulging in the middle (Figure 1b), logarithmically warping along the horizontal axis (log-Lincoln, Figure 1c) or logarithmically warping along both horizontal and vertical axes (log-log Lincoln, Figure 1d). For some types of distortion, even better sensory resolution (smaller pixels) may not be sufficient to restore recognition. To design better cochlear implant speech processors, it is important to understand the factors and parameters that are most important for auditory pattern recognition.
2.0 Signal Processing for Cochlear Implants
Noise-band vocoders (Shannon et al. 1995) have been used to “pixelize”
the auditory spectrum in a manner that is analogous to the pixelized image of Lincoln. This type of processing is also similar to that performed by cochlear implant speech processors. Many of the experiments described in the following sections were performed with normal-hearing subjects listening to noise-band vocoders that simulated features of cochlear implant signal processing.
Figure 2 shows a block diagram of a noise-band vocoder and Figure 3 shows examples of speech processed with a 4-channel noise-band vocoder. First, the acoustic signal is spectrally analyzed by four bandpass filters (typically having 12 to 18 dB/octave filter slopes). Next, the time-amplitude envelope is extracted from each band by half-wave rectification, followed by low-pass filtering (typically, -6 to -12 dB/octave at 160 Hz). The extracted envelope from each channel is then used to modulate wide-band (white or pink) noise; each noise-band is then bandpass-filtered with the filters used to spectrally analyze the original acoustic signal. The result is a series of spectrally contiguous noise bands, each of which is modulated in time by the envelope of its respective acoustic spectral region. Figure 3a shows the spectrogram of the unprocessed phrase “shoo-cat”; Figure 3b shows the spectrogram of “shoo-cat” after processing by a 4-channel noise-band vocoder. Note that the gross spectral

Shannon SHAR Chapter page 4
distribution of energy and temporal envelope are preserved, but the fine structure in both the spectral and temporal domains is removed by this processing. Despite the dramatic reduction in spectral and temporal detail, 4-channel noise-vocoded speech remains highly intelligible (Shannon et al. 1995). Note the similarity between the pixelized picture of Lincoln shown in Figure 1a and the noise-band vocoded speech shown in Figure 3b: visual information is quantized in terms of shape and contrast across the receptor array (which corresponds to visual space), while auditory information is quantized in terms of frequency (which corresponds to distance across the auditory receptor array).
Cochlear implant speech-processing attempts to replace the function of the cochlea that is relevant for speech understanding. Acoustic signals are analyzed into different frequency bands and the speech information from each band is presented to an electrode along the scala tympani that represents the corresponding frequency region. In the 1970’s, most cochlear implants presented either an amplitude-compressed version of the acoustic signal directly to the electrodes, or attempted to extract important speech features from the acoustic signal and present the extracted information to the electrodes in coded form (see Wilson, Chapter 2 and Niparko, Chapter 3). The disadvantage of analog electrical stimulation was that electric fields from adjacent electrodes would add and subtract, depending on the instantaneous waveform presented to each electrode. This type of electric field interaction was so problematic with early implant designs that new strategies were designed in which the electrodes were stimulated non-simultaneously, with electric pulses interleaved in time. These non-simultaneous stimulation strategies evolved into the commonly used Continuous Interleaved Sampling (CIS) strategy. CIS processing is quite similar to the noise-band vocoder processing shown in Figure 2. However, in CIS processing for implants, an amplitude mapping function is utilized after the acoustic envelope extraction to map signal amplitudes from the acoustic into electric domains. In addition, in CIS processing for implants, the carrier signal is a biphasic electrical pulse train (rather than a noise band). The output of each CIS processing channel is a modulated electrical pulse train, which is delivered to an electrode placed in the cochlea.
In later-generation implant devices, increased processing speeds and stimulation rates allowed feature extraction processors to provide more speech information. These feature-extraction techniques evolved to be the presently used Spectral Peak (SPEAK) and ACE (Advanced Combined Encoder) strategies. These signal-processing strategies are discussed in more detail in Chapter 2. In this chapter, we will describe the types of acoustic cues necessary for speech recognition and how those cues are coded for cochlear implant listeners.
Many psychophysical capabilities of implant patients have been characterized in research laboratory settings (see McKay, Chapter 7). However, in a clinical setting, there is usually not enough time to measure all the psychophysical abilities of each patient. Thus, it is important to know which speech processor parameters are most critical for individual patients’ optimal use of the implant, and obtain psychophysical measures for those parameters in the

Shannon SHAR Chapter page 5
limited time available to clinicians (Allen, 1994). If speech recognition is relatively robust to a poorly set parameter, then the clinician need not spend time optimizing that parameter carefully for each individual patient. Rather, clinical time should be spent measuring those parameters that vary significantly across patients and that have a significant effect on speech recognition. In the following sections, we describe the results of speech processor manipulations to quantify the effects of various parameters on speech recognition in both normal-hearing (NH) and cochlear implant (CI) listeners: amplitude, temporal, spectral, and binaural cues. 3.0 Amplitude Cues Licklider and Pollak’s (1948) aforementioned “infinite clipping” studies suggest that amplitude cues are of little importance for speech recognition; speech remained perceptible despite the complete removal of amplitude information. However, amplitude cues may be more important for speech recognition by hearing-impaired listeners (Turner et al. 1995) and cochlear implant users (Fu and Shannon 1998; Zeng and Galvin 1999; Zeng et al. 2002). Hearing-impaired (HI) and implant listeners have greatly reduced dynamic ranges and distorted loudness growth functions, compared to those of NH listeners. If the prosthetic device (hearing aid or implant) does not map loudness correctly from the acoustic to the prosthetic domain, the relative loudness relations within speech sounds will be distorted, and possibly result in reduced recognition (Plomp 1988; Freyman et al. 1989, 1991; Drullman 1995). NH listeners may be more resistant to amplitude distortions because the full spectral processing mechanisms remain intact. A correct amplitude mapping may be more important for HI listeners who have reduced spectral selectivity (Van Tasell et al. 1987, 1992), or in implant listeners whose spectral selectivity is limited by the number of implanted electrodes (Zeng and Galvin 1999; Loizou et al. 2000a). Let us review some recent studies that have measured speech recognition as a function of parametric distortions to the amplitude mapping functions in CI listeners, and in NH subjects listening to implant simulations. 3.1 Loudness Mapping Function
Most contemporary commercial cochlear implant speech processors use a logarithmic function to map acoustic sound pressure to electrical current (in microamperes). Fu and Shannon (1998) investigated the effect of manipulations to this logarithmic amplitude mapping function on speech recognition. For all experimental speech stimuli, amplitudes were measured for the acoustic envelope extracted from each band of a multi-band speech processor, and a probability histogram was compiled for the frequency of occurrence of each amplitude value. The acoustic maximum (>99th percentile) was mapped to the electrically stimulated maximum comfortable loudness and the acoustic minimum (<1st percentile) was mapped to electrically stimulated threshold. Within these two endpoints, the acoustic amplitude levels (A) were mapped to electrical levels

Shannon SHAR Chapter page 6
(E) by a power law, E = Ap. Varying the value of the exponent p changes the shape of the acoustic-to-electric mapping function. Assuming that an optimal value of p best preserves the normal loudness relationships within speech sounds (Zeng and Shannon 1992, 1994, 1999; Zeng and Galvin, 1999; Zeng et al. 1998), values of p larger or smaller than this optimal value will distort the loudness relations within speech. Figures 4 and 5 show the results of varying the exponent p of the amplitude mapping function on consonant and vowel recognition (multi-talker sets of 16 medial consonants, a/C/a, and 12 medial vowels, h/V/d). Figure 4 shows average vowel and consonant recognition for 7 NH subjects listening with a 4-channel noise-band processor, and Figure 5 shows similar data for 3 CI subjects listening with custom 4-channel CIS cochlear implant processors.
Functions for both NH and CI listeners show a broad, shallow peak in performance. NH listeners performed best when the exponent p=1.0 (resulting in a linear amplitude mapping between the acoustic and simulated electric domains). CI listeners performed best when the exponent p=0.2 (slightly more compressive than logarithmic amplitude mapping used in their regular speech processors). Loudness growth functions were also measured in these implant listeners using magnitude estimation; the resulting estimates were well fit by a power function with an exponent of 2.72 (Fu and Shannon 1998). Because NH listeners’ loudness growth functions are generally well fit by a power function with an exponent of 0.6, the predicted cross-modal loudness match between acoustic and electric amplitude should have an exponent of the ratio between these two exponents (0.6/2.72 = 0.22). This value agrees quite well with the peak in the performance function of Figure 5, indicating that best performance is achieved when the loudness function is mapped properly from acoustic to electric amplitudes. However, note that performance drops only 10 to 15 percentage points even when the amplitude functions are mapped poorly with an exponent that is twice or half of the optimal value. Overall, these results show that while the best performance is achieved when loudness is properly mapped, the acoustic-to-electric amplitude mapping is not a critical parameter for speech perception by CI users (at least in quiet testing conditions). Mis-estimating the loudness exponent by as much as a factor of 2 will have only a relatively small effect on performance.
Note that even the amount of information transmitted via voicing, manner, and place cues (Miller and Nicely, 1955) was similar for implant and acoustic listeners (right panels of Figures 4 and 5), as a function of the amplitude mapping exponent p. In fact, the amount of information received via voicing and manner cues was almost identical for NH and CI listeners. The primary difference between NH and CI listeners’ overall level of performance was due to differences in the amount of information received from place cues (right panels).
3.2 Errors in Loudness Mapping on One Electrode
Fu (1997) measured the effect of local errors in amplitude mapping, i.e.
distortions to the acoustic-to-electric mapping on only one electrode in the array.

Shannon SHAR Chapter page 7
NH subjects listened to a 4-channel noise-band acoustic simulation of a cochlear implant speech processor. The gain of one of the four channels’ output was amplified/attenuated to simulate an erroneously measured dynamic range for one of four electrodes in a CI patient. The results (Figures 6 and 7) show that vowel recognition was remarkably robust to such an erroneously measured dynamic range. Speech recognition was only affected when one channel’s gain was amplified/attenuated more than 20 dB, relative to the other three channels (Figure 6). This effect was reduced as the number of electrodes was increased, as shown in Figure 7. With the 4-channel processor (Figure 7, left panel), attenuation of band 2 had the largest effect, most likely because this band contained the envelope from the second formant region of speech. In contrast, turning bands 1, 3, or 4 off (-80 dB) caused performance to drop by only 10 percentage points. With the 8-channel processor (Figure 7, right panel), performance dropped by less than 10 percentage points when any single band was turned off (-80 dB). However, amplifying (+40d dB) any one of bands 2 through 7 significantly degraded speech recognition; performance dropped as much as 30-percentage points when band 2 was amplified by 40 dB, presumably because of masking effects. Thus, with increased spectral resolution (i.e., more electrodes/channels) underestimating any single electrode’s dynamic range does not affect performance as much as overestimating an electrode’s dynamic range. 3.3 Custom Loudness Functions for Each Electrode
Cosendai and Pelizzone (2001) compared speech recognition between processors that implemented a standard logarithmic loudness function on all electrodes and one that implemented a customized loudness function on each electrode. Their results showed a modest improvement (10 - 15 percentage points) in sentence recognition with the custom loudness functions.
3.4 Peak Clipping and Center Clipping
If the parameters of the amplitude mapping function are not set properly in a cochlear implant, the amplitude envelopes of speech could be truncated, resulting in either peak clipping or center clipping. For example, underestimating the stimulation thresholds of electrodes would result in low-amplitude portions of the acoustic envelope being presented at sub-audible levels (i.e., center clipping). An overly compressive mapping would result in high-amplitude portions of the acoustic envelope being presented at or near the maximum comfort level of electrical stimulation (i.e., peak clipping).
Drullman (1995) studied the effects of peak and center clipping on the speech perception of 60 NH listeners. Center clipping was found to be slightly more detrimental than equivalent amounts of peak clipping, but neither truncation significantly affected speech recognition until the clipping was severe (> 50% amplitude range).
Shannon et al. (2001) studied the effects of peak and center clipping in conditions of reduced spectral resolution with NH listeners using acoustic noise-

Shannon SHAR Chapter page 8
band simulations of cochlear implant speech processors. The acoustic speech envelope amplitudes were measured for each frequency band of the 4-channel processors. The amplitude mapping functions were set to clip the input amplitudes at the 25th, 50th or 75th percentile of the total amplitude envelope distribution. Figure 8 shows recognition results for multi-talker vowels (10 male, 10 female talkers) and consonants (15 talkers) by 7 NH subjects. The left-most panel shows the results when the acoustic input was peak-clipped. The middle panel shows results when the peak-clipped acoustic input was then expanded across the entire output dynamic range. The right-most panel shows the results when the acoustic input was center-clipped. Note that 25% of the amplitude distribution could be peak- and/or center-clipped with only minimal effect on vowel or consonant recognition. Similar results were reported in cochlear implant users (Zeng and Galvin 1999; Zeng et al. 2002). 3.5 Amplitude Quantization
Zeng and Galvin (1999) reported the results of experiments that reduced the number of amplitude steps in Nucleus-22 implant patients fitted with the SPEAK processing strategy. Even when the amplitudes for each electrode were limited to just two levels (on or off), sentence recognition was not noticeably affected. This result may be partially due to the nature of the SPEAK processing strategy, in which only the six highest amplitude frequency bands are represented for each 4 ms interval. The SPEAK processing strategy implicitly performs center clipping on the acoustic input because only the highest energy peaks in the spectrum are selected for stimulation.
Loizou et al. (2000a) tested NH subjects listening to acoustic simulations of a 6-channel cochlear implant speech processor, in which the output amplitude range was compressed to have the same intensity resolution commonly found in CI patients (20 – 30 just-noticeably-different, or jnd steps in terms of intensity). Within this restricted intensity range, performance was similar between NH subjects listening to the implant simulation and better-performing CI listeners fitted with a 6-electrode CIS processor. Loizou et al. (1999, 2000b) also measured the effects of amplitude compression/quantization and limited spectral resolution in NH and CI listeners. They found that more amplitude resolution was necessary when spectral cues were highly limited. But when 6 or more channels of spectral information were available, speech recognition was highly resistant to amplitude compression and quantization. Only 4 - 8 discrete amplitude steps were necessary to achieve good speech recognition, as long a minimum of 4 - 6 channels of spectral information were provided. Even fewer amplitude steps are required if more spectral channels are available, as originally demonstrated by Licklider and Pollack’s (1948) “infinite clipping” experiments. 4.0 Temporal Factors
Rosen (1992) and Plomp (1983) have characterized the temporal information in speech to fall into three categories: envelope, periodicity, and fine

Shannon SHAR Chapter page 9
structure, corresponding to temporal fluctuations between 1-50 Hz, 50-500 Hz, and 500-5kHz, respectively. The capability of implant listeners to use the temporal information found in each of these categories is reviewed below. 4.1 Temporal Envelope Cues (1-50 Hz).
Steeneken and Houtgast (1980) measured the spectrum of the temporal envelope in running speech. They found a “bell-shaped” curve (when plotted in terms of log frequency) with a peak at about 4 Hz, corresponding to the average syllable rate observed in speech. Relatively few temporal fluctuations in speech were slower than 1 Hz or faster than 50 Hz. According to the temporal modulation transfer functions (TMTF) measured in implant listeners (Shannon 1992), CI users are able follow temporal fluctuations in this range. Overall, CI users’ perception of envelope fluctuations in this range is relatively normal as long as the loudness is mapped properly from acoustic to electric domains; center- or peak-clipping would necessarily reduce the degree of amplitude fluctuations. Thus, temporal envelope cues are largely dependent on amplitude coding, as discussed in the previous section. Several experiments have shown that temporal envelope information below 20 Hz is most important for speech recognition. Classic work using vocoded speech has shown that good quality speech could be reconstructed using only the temporal envelope information below 20 Hz from each frequency band. Shannon et al. (1995), testing NH subjects listening to an implant simulation, systematically reduced the low-pass cutoff frequency on the envelope filter for each frequency band; after the temporal envelope was extracted from each frequency band, the envelope was “smoothed” by applying a low-pass filter before modulating carrier-band noise. Even for processors having only four spectral channels, performance was unchanged as the cutoff frequency was reduced from 500 Hz to 50 Hz; only a small reduction in performance was observed when the cutoff frequency was further reduced to 16 Hz. Drullman et al. (1994a, 1994b) measured speech recognition in NH listeners when either slow or fast envelope modulations were parametrically removed from speech. Speech recognition was unchanged as long as the envelope fluctuations below 16 Hz were preserved. Further reductions in envelope frequencies below 16 Hz resulted in a significant decrement, primarily for consonant recognition.
4.2 Periodicity Cues (50-500 Hz).
Temporal fluctuations found between 50-500 Hz provide periodicity
information. NH listeners are able to perceive temporal fluctuations in this range purely in the temporal domain, i.e., without spectral analysis (Viemeister 1979; Burns and Viemeister 1976, 1981; Bacon and Viemeister 1985). CI patients are also able to perceive and discriminate temporal information in this range (Shannon 1983a, 1992; Shannon and Otto 1990; Zeng 2002), with some patients able to perceive and discriminate temporal information at rates as high as 1000 Hz (Wilson and colleagues, RTI; unpublished results). This range of temporal

Shannon SHAR Chapter page 10
information is critically important for CI listeners because the intra-cochlear electrodes are generally not inserted deep enough in the cochlea to reach tonotopic regions below 1000 Hz. Because speech information in the periodicity range cannot be delivered by a cochlear implant to the correct tonotopic location, it may be essential that periodicity information be delivered and perceived temporally. Periodicity cues up to 300 Hz might provide information about voice pitch and intonation contours, but would not include first-formant frequency information. If CI users were able to receive periodicity information up to 1000 Hz, first-formant distinctions might be possible using only temporal cues. Individual differences in the ability to make use of periodicity cues may account for some differences in performance between implant patients (Fu 2002).
4.3 Temporal Fine Structure: Time or Place?
While CI patients generally cannot detect temporal fluctuations faster than 300 - 500 Hz, some patients may be able to detect temporal fluctuations up to 800-1000 Hz. The ability to perceive temporal fine structure may be a key difference in performance between good and poor implant users. The frequency region between 500 and 1500 Hz is critical for speech perception, and CI users may not perform well if they are unable discriminate information in this frequency range, either temporally or spectrally. CI listeners who cannot access temporal information at frequencies higher than 500 Hz can only access information in this frequency range from the tonotopic place of the electrodes. It is likely that for all CI listeners, the temporal information above 1500 Hz will have to be represented spatially by the tonotopic place of activation rather than by temporal coding.
4.4 Pulse Rate Per Electrode
Modern cochlear implants generally use high pulse rates for electrical stimulation. High rates are used to convey the temporal properties of speech and to put the electrically stimulated auditory nerve into a mode of neural firing that is more like the normal acoustically stimulated nerve. As discussed in previous sections, CI listeners can access temporal information up to 300 - 500 Hz; stimulation rates greater than 1000 Hz should be high enough to accurately represent this information.
In addition, high stimulation rates allow for more stochastic firing patterns in electrically stimulated nerves than low stimulation rates (Rubinstein et al. 1999). It has been recently demonstrated that the refractory properties of the electrically stimulated auditory nerve (as inferred from intra-cochlear CAP recordings) are strongly affected by pulse rate (Wilson 1997; Wilson et al. 1997). At low pulse rates, the neural firing is highly synchronized to the pulse rate. At medium rates, the nerve refractory time and the stimulation rate can exhibit complex interactions and produce response patterns that alternate or “beat” between the pulse rate and the neural firing rate. At high pulse rates, the probabilistic recovery from adaptation de-synchronizes the neural response from the stimulation rate. The high stimulation rates may be necessary to avoid any

Shannon SHAR Chapter page 11
“aliasing” or “beating” effects between the nerve response and the stimulation rate.
While these neural phenomena are quite clear and well established, it is unclear whether they play any role in speech recognition. Significant improvements in speech recognition have been shown with stimulation rates as high as 4000 pulses/sec/electrode (ppse) (Brill et al. 1997). However, other studies found no change in performance for stimulation rates between 200 and 2500 ppse (Vandali et al. 2000; Friesen et al. 2001; Fu and Shannon 2001). Thus, although high stimulation rates undoubtedly improve the stochastic firing properties of auditory neurons, it remains unclear whether these stochastic response properties are important for higher-order feature extraction and pattern recognition in the nervous system.
4.5 Individual Differences in Temporal Processing
As suggested in previous sections, differences in temporal processing may account for differences in performance between good and poor implant users. Recent studies revealed differences in temporal processing between good and poor implant CI users (Chatterjee and Shannon 1998; Fu 2002).
Chatterjee and Shannon (1998) measured recovery from forward masking functions for 8 CI users. 3 patients with relatively poor speech recognition skills showed a significantly different recovery time constant than patients possessing good speech recognition skills. Paradoxically, the poorer-performing patients exhibited much faster recovery from masking - approximately twice as fast as the time constant found in the better-performing patients. Assumedly, faster recovery might provide some advantage in speech recognition, allowing the system to better respond to rapidly changing stimuli. However, such fast recovery might also indicate that these patients primarily have high spontaneous-rate (high-SR) neurons remaining (Relkin and Doucet, 1991), which may not be good for supra-threshold pattern recognition (Zeng et al. 1991). In normal acoustic environments, these high-SR neurons are mostly saturated at normal conversational speech levels, and therefore may not be useful for pattern recognition.
Fu (2002) measured the detection of a 100 Hz modulation rate as a function of the sensation level. The average modulation detection threshold across the entire perceptual dynamic range was highly correlated with speech recognition for nine CI listeners (see also Cazals et al. 1994). These results suggest that CI listeners’ psychophysically measured temporal resolution is related to their speech recognition abilities. Understanding this relation will undoubtedly contribute to future speech processor designs that strive to maximize CI users’ utilization of temporal cues. 5.0 Spectral (Tonotopic) Cues As mentioned in earlier in this chapter, complex pattern recognition may not always require the full resolution of the sensory system. But how much
Shannon SHAR Chapter page 12
resolution is needed for understanding speech? How much resolution is needed if the tonotopic pattern is slightly distorted? A cochlear implant can create a complex spectral pattern if each electrode stimulates an independent tonotopic neural region. If electrodes are not completely independent and stimulate overlapping neural regions, the tonotopic resolution of the spectral pattern will become “blurred”. In this section we report the results of experiments designed to measure the effects of electrical stimulation parameters on tonotopic selectivity and experiments to assess the effect of tonotopic selectivity on speech recognition. 5.1 Electrode Configuration
All electrical stimulation requires a pair of electrodes: a current source and a current sink (ground). A pair of electrodes that are closely spaced is typically called a bipolar pair. If one electrode of the pair is located outside the cochlea, the stimulation is called “monopolar” (see Wilson, Chapter 2). Because one of the electrodes is located outside the cochlea (the “ground” electrode in placed in the temporalis muscle), monopolar stimulation produces a broad current field and low thresholds. Many commercial implant devices presently use monopolar stimulation to achieve low power consumption in the speech processors, allowing behind-the-ear processors. Theoretically, monopolar stimulation should produce an even broader activation of auditory nerve fibers than widely spaced bipolar pairs, resulting in almost complete loss of tonotopic selectivity (van den Honert and Stypulkowski 1984, 1987).
The trade-off between sharp tonotopic resolution and stimulation level has yet to be fully explored. Recent data (Pfingst et al. 2001; Zwolan et al. 1996) show no clear advantage with either monopolar or bipolar stimulation, for either electrode discrimination or speech recognition measures. Surprisingly, several patients performed better with monopolar stimulation. This paradoxical finding may be partially explained by psychophysical measures that show little difference in tonotopic selectivity between bipolar and monopolar stimulation modes, when equated for loudness (Hanekom and Shannon 1998; Chatterjee et al. 2001).
Fu and Shannon (1999) measured speech recognition in cochlear implant patients as a function of the electrode configuration and as a function of the frequency assignments to electrodes. They found that the apical-most member of each bipolar pair was the most important in terms of determining the characteristic pitch. When frequency information is assigned to bipolar electrodes, the tonotopic location that should be matched is the location of the apical member of the pair.
5.2 Pulse Phase Duration and Tonotopic Selectivity
Threshold and loudness with electrical stimulation are related to the amount of electrical charge in each stimulating pulse. Thus, a pulse with a long phase duration requires a lower current amplitude to produce the same perceptual level as a pulse with a short phase duration. Low current amplitudes

Shannon SHAR Chapter page 13
may allow better tonotopic selectivity because the effective current field covers a smaller tonotopic region. However, for interleaved multi-electrode stimulation, long phase durations necessarily require slower overall pulse rates. So short pulses allow fast stimulation rates but may cause more electrode interaction than long pulses.
Studies of the trade-off between pulse phase duration and overall pulse rate have produced mixed results (Wilson et. al, 2000). Some patients appeared to achieve better performance with longer pulses at a slower overall rate, while others appeared to do best with the fastest possible rates, which require very short pulses. Loizou et al. (2000a) found that some patients achieved better performance with longer pulses at a slower overall rate, suggesting that the optimal performance in a given patient might be achieved with a custom combination of pulse rate and pulse duration. At the present time it is not clear if short pulses produce more electrode interaction than longer pulses, or if there is any effect on speech recognition.
5.3 Tonotopic Selectivity and Electrode Interaction
The normal cochlea exhibits exquisite frequency selectivity both physiologically and perceptually. It is estimated that the normal ear is capable of processing 30 - 50 independent channels of frequency information. In contrast, cochlear implants represent this spectral information by the relatively small number of implanted electrodes. If the output of those electrodes do not stimulate independent neural regions, the electrode interaction can further reduce the number of effective spectral “channels” of information. How many channels are necessary for speech understanding and how much “cross-talk” or interaction is tolerable between spectral channels?
Experiments with normal-hearing listeners indicate that spectral selectivity is not highly critical for speech recognition (e.g., Boothroyd et al. 1996; Dubno and Dorman 1987; ter Keurs et al. 1992, 1993). Boothroyd et al. (1996) “smeared” the spectral representation of speech by multiplying the speech waveform with low-pass noise. They found that a smearing bandwidth of 8000 Hz was necessary to reduce recognition to the level observed with no spectral cues. ter Keurs et al. (1992, 1993) smeared the spectral representation of speech using an FFT overlap-and-add method. They found no significant decrease in performance until the spectrum was smeared by more than one critical band. Speech recognition was reduced only moderately even when the spectrum was smeared over an octave. Dubno and Dorman (1987) selectively smeared the spectral representation of the first and second vowel formants and found that speech discrimination was remarkably robust to spectral smearing. These studies suggest that a sharp spectral representation is not required for good speech recognition. However, while the spectral cues were smeared in these studies, all other speech cues (amplitude, temporal, etc.) remained intact. Similar results were found in acoustic cochlear implant simulations by altering the slope of the noise carrier bands (Shannon et al. 1998; Fu and Shannon 1999).

Shannon SHAR Chapter page 14
Fu (1997) simulated the effects of electrode interaction in implants by altering the slope of the carrier bands in a noise-band processor. Spectral information was first quantized into four or six bands to simulate a 4- or 6-electrode implant. Electrode interaction was simulated by changing the slope of the carrier noise band filters from steep (100 dB/octave) to shallow (6 dB/octave). This manipulation simulated both the quantizing of the spectral information and the spectral smearing that would be produced by electrode interactions. The results (Figure 9, left panel) again demonstrate remarkable resistance to spectral smearing, even in the presence of spectral quantization. The right panel of Figure 9 shows that, for both the 4- and 6-channel processors, vowel recognition was largely unchanged when only one band of noise was broadened (simulating a local spectral smearing). Combining results from CI subjects, NH subjects listening to comparable implant simulations, and NH subjects listening to conditions of spectral smearing, sharp spectral resolution is not critical for speech recognition, at least for quiet testing conditions.
Actual measurements of interaction across electrodes in a cochlear implant are complex. When electrical signals are presented simultaneously to two electrodes the current fields can add and subtract directly. Since the dynamic range of perception with cochlear implants is so small, two electrical fields adding can produce an uncomfortable loud sensation even if each electrode alone only produces a soft or inaudible sound. But electrodes can also interact even if their stimulation occurs sequentially, as in the CIS processor strategy. If a pulse is presented on one electrode and neurons in that region are activated, then those neurons are not available to fire in response to a pulse on another electrode. To the extent that the neural populations excited by two electrodes are overlapping, then even nonsimultaneously presented stimulation can show interaction.
Figure 10 presents data from electrode interaction measures using five different techniques: electrode discrimination, gap detection (Hanekom and Shannon, 1998), forward masking (Shannon 1983b; Lim et al. 1989; Chatterjee and Shannon, 1998), loudness summation (Shannon, 1985), and simultaneous interleaved masking. In this plot a masker was placed on a central electrode in a Nucleus-22 array (10,12) and interaction was measured for a signal presented on all other electrodes, both apical and basal to the masker electrodes. The ordinate on each plot has been plotted in a direction to make each curve resemble a “tuning curve” and each panel has been arbitrarily scaled to make the depth of each curve similar for comparison. Each method measures a different aspect of the perceptual interaction across electrodes. Figure 10 shows results from two implant listeners – one with relatively good speech recognition (N4) and one with relatively poor speech recognition (N3). Although the different measures are slightly different from each other, all measures show that N4 had sharper tonotopic selectivity (less electrode interaction) than N3. Gap detection and electrode discrimination measures appear to be sensitive to any interaction between electrodes, showing the most sharply “tuned” patterns of excitation. Other measures show more broadly tuned patterns of interaction. It is not clear exactly how channel interaction is related to speech recognition. Acoustic

Shannon SHAR Chapter page 15
experiments indicate that considerable spectral smearing can be tolerated in quiet listening conditions, but excessive spectral smearing (channel interaction) probably reduces the number of effective spectral channels. 5.5 Effect of Number of Electrodes How many electrodes (or channels) are necessary for good speech recognition? The cost and complexity of implant devices increases as the number of electrodes increases (see Niparko, Chapter 3). Is there a point at which an increased number of electrodes provide no further benefit? Can CI listeners utilize all the spectral information presented on their electrodes? Are more electrodes beneficial when listening in noise? This section will review studies of speech recognition as a function of the number of spectral channels (or number of electrodes).
Historically, speech recognition and quality have been measured as a function of the number of frequency bands used to reconstruct a transmitted speech signal. For example, Hill et al. (1968) analyzed speech into different numbers of frequency bands and then used the envelope from each band to modulate a sinusoid at the center frequency of that analysis band. They found that six to eight modulated sinusoids were adequate for good speech recognition. Shannon et al. (1995) measured consonant, vowel, and sentence performance in NH subjects listening to a noise-band simulation of a cochlear implant having one to four channels. Performance increased dramatically between one to four channels, with four channels providing a high level of performance (> 90%) for all three recognition measures.
Dorman et al. (1997b; Dorman and Loizou 1998) measured speech recognition for vowels, consonants, and sentences in NH listeners as a function of the number of frequency bands used in the representation. They used both sinusoidal carriers (as in Hill et al.1968) and noise bands (as in Shannon et al. 1995) and found similar results for the two carriers: performance increased as the number of bands increased, up to about 6 bands. In summary, work in NH listeners suggests that only about 4-6 bands of frequency information are necessary to allow high levels of speech recognition, at least in quiet listening conditions.
Speech recognition with reduced number of spectral channels has also been measured directly in CI patients. Lawson et al. (1993, 1996) measured consonant recognition in 7 CI patients (1 Ineraid and 6 Nucleus-22, all with percutaneous plug devices). Between 1 - 6 channels of CIS processing was implemented in the Ineraid patient, and 2 - 12 channels of CIS processing in the Nucleus-22 patients. In the Ineraid patient, consonant recognition improved as the number of channels was increased from one to six; in the Nucleus-22 patients, consonant recognition improved up to four channels, after which performance asymptoted. Fishman et al. (1997) varied the number of electrodes in a SPEAK processor in 11 Nucleus-22 implant patients. Figure 11 shows Fishman et al.’s average data for sentence recognition. Performance increased from one to four

Shannon SHAR Chapter page 16
electrodes for all speech measures, and reached asymptotic levels with seven electrodes. They concluded that even patients with excellent tonotopic selectivity were not using the information from all 20 electrodes, and that (in quiet) there was no difference in performance between 7, 10, and 20 electrodes.
Overall, there is remarkable consistency across all studies. Historical vocoder studies, recent implant simulations, and implant results all show that about six channels of spectral information is adequate for good speech recognition in quiet. Performance improves rapidly as the number of channels are increased from one to six, and little or no improvement is observed as the number of channels (noise bands, electrodes) are increased beyond six.
5.6 Effects of Noise Although six channels of spectral information may be adequate for good speech recognition in quiet, additional spectral channels may be necessary in noisy listening conditions. Fu et al. (1998b) measured speech recognition in the presence of noise with three CI listeners and four NH subjects listening to a noise-band simulation of an implant processor. Figure 12 shows multi-talker medial vowel recognition by NH subjects as a function of noise level for three, four, eight, and 16 channels, as well as for the original unprocessed speech. The number of channels affected performance even in quiet: performance with 16 channels was significantly lower than that with the original speech. CI listeners’ performance in noise was comparable to that of NH subjects listening to implant simulations having the same number of channels (Eddington et al. 1997; Fu et al. 1998b) Friesen et al. (2001) measured phoneme, word, and sentence recognition in noise for 10 Nucleus-22 listeners, nine Clarion listeners, and five NH listeners (listening to a simulation of an implant CIS processor). For all groups, speech recognition was measured as a function of the number of electrodes (or noise bands) at various signal-to-noise ratios (SNRs). Figure 13 shows the results for vowel recognition. Note that CI listeners’ performance improved as the number of electrodes was increased up to about seven, with no significant improvement observed beyond 7-10 electrodes. In contrast, NH listeners’ performance continued to improve as the number of noise bands was increased to the maximum of 20 channels. This result suggests that the CI listeners were not able to make use of all the spectral cues presented to the multiple electrodes. It had been hypothesized that CI listeners might be able to make use of more channels of spectral information in challenging listening situations (such as noisy or reverberant environments). However, at all signal-to-noise ratios, implant performance reached asymptotic levels at 7-10 electrodes. The hatched area in Figure 13 shows the range of performance across all 19 CI listeners. Note that the top edge of the hatched area is in line with NH subjects’ results, suggesting that the best implant listeners were able to utilize all of the spectral information presented, at least up to seven channels. 5.7 Frequency to Electrode Mapping

Shannon SHAR Chapter page 17
Spectral information is normally represented at relatively fixed locations in the cochlea; i.e., the 1000 Hz information is always represented predominantly at the 1000-Hz tonotopic location. Thus, central pattern recognition mechanisms are trained over a lifetime of experience to depend on the stability of the cochlear tonotopic representation. However, in a cochlear implant, spectral information is often presented to electrodes that are more basally situated relative to the normal tonotopic locations (because of the limited insertion depth of the implanted electrodes). Thus, for CI listeners, the tonotopic representation of speech patterns may be shifted. In the following section, we review recent research on the effects of alterations to the frequency-to-place mapping of speech information in the cochlea. 5.7.1 Tonotopic Shift There is a long history of research into the effects of frequency-shifting on speech recognition (e.g., Blesser 1972, Braida et al. 1979). Researchers in the 1940-50’s noted that speech remained recognizable when the playback of tape recorder was sped up or slowed down, thereby changing both the frequency content and duration of the speech signal (Daniloff et al. 1968). Another example is that of deep-sea divers, who breathe a mixture of oxygen and helium that causes voices to sound higher-pitched because of the faster speed of sound in the oxygen/helium mixture than in air. While divers’ voices sound high-pitched and squeaky, they remain intelligible (Mendel et al. 1995). In the 1960-70’s, there was considerable interest in shifting speech frequencies down into the regions of residual hearing for patients with steeply-sloping high-frequency hearing loss. Daniloff et al. (1968) reported results of frequency-shifted speech, with and without duration compensation. NH listeners were able to tolerate larger frequency shifts when word duration shifted along with the frequency, suggesting that a central mechanism had already performed some normalization on the frequency-shifted speech duration. However, in implants (or any device for the hearing-impaired), temporal information is represented in real-time and would not be linked to the frequency shift. Figure 14 shows frequency-shifted speech recognition results from three studies in which temporal distortions were corrected such that word and phoneme durations were normal even though frequencies were shifted. Results for the three studies (Tiffany and Bennett 1961; Daniloff et al. 1968; Nagafuchi 1976) are remarkably consistent, showing that listeners can only tolerate a frequency shift of about 35 % before performance significantly worsens. When the speech frequencies were shifted by 60 %, speech recognition was reduced to about 20 % correct.
In cochlear implants, there is both a tonotopic shift of frequency information and a reduction in spectral resolution (due to the limited number of electrodes). Several investigators (Dorman et al. 1997a; Fu 1997; Shannon et al. 1998) have evaluated the effect of a tonotopic shift combined with reduced spectral resolution, using a noise-band simulation of an implant with NH listeners. Speech was first filtered into four or 16 bands and the envelope from each band

Shannon SHAR Chapter page 18
was extracted; these envelopes were then used to modulate bands of noise. The analysis bands were either matched to the noise carrier bands in terms of cochlear location and extent, or were shifted in mm relative to the noise carrier bands using Greenwood’s formula (1990). Figure 15 shows Fu’s results for vowel recognition. When both the analysis and the carrier bands were shifted together, performance was only mildly affected (as shown in the curves with square symbols and dotted lines). The mild decline in performance when both the analysis and the carrier bands were shifted basally was due to the loss of low-frequency speech information. In the implant simulation condition, the carrier bands were fixed to simulate an electrode location where the most apical electrode was located 22 mm from the base while the analysis bands were shifted in terms of cochlear location in mm. Performance decreased markedly as the analysis filters were shifted in the apical direction (which caused an upward frequency shift in the speech signal). The effect of tonotopic mismatch was even more pronounced for the 16-band processors than for the four-band processors. For both the 16- and four-band processors, vowel recognition was reduced to chance level when the analysis bands were shifted by six mm relative to the carrier bands. The effect of tonotopic mismatch is made clear when comparing the performance of matched and mismatched processors. For the matched processors, performance was only mildly affected as the matched analysis and carrier bands were shifted toward the cochlea base (removing increasing amounts of low-frequency speech information). For the mismatched processors, when the analysis filters were shifted by six mm (relative to the carrier bands), performance dropped to chance level, even though the apically-shifted analysis bands contained more low-frequency speech information. Thus, frequency information must be matched to its normal acoustic tonotopic location or speech recognition will suffer.
Figure 16 compares results of Nagafuchi’s (1976) frequency-shifted vowel recognition (full-spectrum speech) with the normalized results of Fu and Shannon (1999), who used noise-band implant simulations (spectrally-quantized speech). Note the similarity of all sets of data, demonstrating that speech recognition falls off sharply as a function of spectral shift in either the apical or basal direction, whether the shift is of whole speech, mildly spectrally-quantized speech (16 bands), or severely spectrally-quantized speech (four bands). These results indicate that a spectral shift can severely limit speech recognition, regardless of the degree of spectral resolution. A shift of an octave (about 4.5 mm) can reduce vowel recognition by more than 60 percentage points. For spectral shifts beyond 35% (about two mm), the reduction in performance is 10 percentage points per mm of shift. For cochlear implants, the analysis bands in the speech processor must be matched to the actual tonotopic location of the electrodes in the scala tympani of individual patients. Some of the variability in performance across patients may be due to the different electrode insertion depths, resulting in differing degrees of spectral mismatch across patients.
Listeners may be able to adapt to spectrally-shifted speech patterns and eventually compensate for deficits caused by a spectral mismatch. For example, Rosen et al. (1999) demonstrated that NH listeners were able to quickly

Shannon SHAR Chapter page 19
accommodate to frequency-shifted speech; after three hours of training with a six mm basal shift, performance improved from chance level to 30 % correct. Fu et al. (2002) measured CI listeners’ accommodation to a three-mm apical shift; speech recognition was measured over a three-month period during which the implant patients continuously wore the shifted speech processor. Fu et al.’s results suggested that there might be two adaptation periods: a short adaptation period that results in only a partial accommodation, and a longer adaptation period during which a full accommodation may or may not be possible. CI subjects were not able to achieve their baseline performance measured with their everyday processors even after three months of continuous use with the apically-shifted processors. The rapid recovery period (similar to that observed by Rosen et al.) may represent an adjustment to novel speech patterns. The longer time period may be measured in years (rather than months, as shown by Fu et al.), as an implant listener fully accommodates electrically stimulated speech patterns. The degree of spectral shift may also determine the time course needed to fully adapt to frequency-shifted speech; if the mismatch is not severe, adaptation may occur much more quickly. Intensive training and long-term experience with spectrally-shifted speech might also allow adult CI users to regain speech recognition at the “unshifted” performance levels. 5.7.2 Effects of Tonotopic Warping
An additional problem encountered in implant patients is that of non-uniform neural survival. Some pathologies may cause uniform nerve survival along the extent of the cochlea, while others may cause a more selective nerve loss in some tonotopic regions (See Leake, Chapter 4). The effects of uneven nerve survival are not clearly known in CI users, but have been simulated in NH subjects listening to noise-band speech processors (Shannon et al. 1998, 2001b). If there is a local nerve loss close to a stimulating electrode, then the current level on that electrode must be increased until the current spreads and activates surviving nerves in distant tonotopic locations. However, these activated nerves will then be stimulated with speech information from the wrong tonotopic location. Assuming that the remaining neural populations were to receive tonotopically-matched spectral information, there would be a “warping” of the distribution of spectral information (Shannon et al. 1998, 2001b; Skinner et al. 1995). The spectral information from the tonotopic region where nerves were missing would be “compressed” into a smaller region.
Fu (1997) simulated tonotopic warping of spectral patterns in NH listeners by mismatching the analysis and carrier filter bands in a noise-band processor. The overall spectral extent (in mm along the cochlea) was always the same for both the analysis and carrier bands, but the distribution of the filters within this range was different for the analysis filters and noise carrier bands. Figure 17 shows the effect of this mismatch on vowel recognition. The analysis filters were either distributed linearly (partition 0), logarithmically (partition 6), or somewhere between linear and log (partition 3); the carrier bands were systematically varied from a linear to a logarithmic distribution. Performance was always best when the

Shannon SHAR Chapter page 20
analysis and carrier partitions were matched, and decreased rapidly as the difference between the analysis and carrier partitions increased. 5.7.3 Effects of a “Hole” in the Tonotopic Representation
Some types of hearing loss can produce a localized loss of hair cells and may produce a localized loss of auditory neurons as well, sometimes termed “dead regions” (Moore and Glasberg 1997; Moore et al. 2000; Moore 2001; Moore and Alcantara 2001). When stimulating a dead region, thresholds will be elevated at the frequencies corresponding to the dead region. To compensate, gain is usually increased for that frequency region. In a hearing aid, the amplification would be increased in that frequency region, and in a cochlear implant, the electrical amplitude would be increased for the electrode in that cochlear location. Because the sensory cells and/or neurons are dead, no activation can actually occur within the dead region. Thus, when the amplitude is increased, the stimulation occurs instead at the edges of the dead region (or “hole”). In effect, this causes a local warping in the frequency-to-place mapping. The speech information from the frequency region of a hole is transmitted to the brain by neurons that normally respond to a different frequency region.
How does a hole in the tonotopic representation affect speech understanding? Lippmann (1996) demonstrated good speech recognition even when the entire mid-frequency region from 800 to 3000 Hz was removed. Warren et al. (1995) found that excellent speech recognition was possible when listening through only a few narrow spectral bands (slits). Clearly, large regions of spectral information can be dropped without disrupting speech recognition, due to the spectral redundancy of speech.
Shannon et al. (2001) measured the effect of such holes in the speech spectrum with CI listeners and in NH subjects listening to a 20-channel noise-band simulation. Holes were simulated by simply deleting several contiguous carrier bands (NH listeners) or by turning off electrodes in either the apical, middle, or basal cochlear region. Other experimental conditions reassigned the information lost in the hole to nearby electrodes in an attempt to preserve the speech information from that region. Figure 18 shows the results for vowel recognition, normalized to baseline performance (no hole). In general, the NH and CI results were similar, in that both types of listeners could tolerate a “hole” of up to three mm with relatively little decrease in recognition. Holes larger than three mm in the apical region produced large decrements in vowel recognition, while holes as large as six mm in the basal region produced almost no deficit. While it appears that NH listeners were more adversely affected than CI listeners by holes in the apical region, differences in baseline performance account for differences in the normalized scores (CI listeners had significantly lower baseline scores). With a six-mm apical hole, both NH and CI listeners’ vowel recognition dropped to chance level. Unfortunately, none of the re-mapping manipulations succeeded in “rescuing” the information from the hole region; performance was no different when the information was simply dropped. However, re-mapping information to the edges of the hole (as may often occur with CI patients) did not
Shannon SHAR Chapter page 21
produce a further decrement in performance. Thus, warping the distribution of spectral information around a hole did not produce a further deterioration in vowel recognition beyond the simple loss of spectral information from the hole region. 5.8 Summary – Spectral Information Speech can be recognized with great accuracy even with relatively coarse representations of spectral information, in good listening conditions. Four spectral channels are sufficient for good sentence recognition in quiet. However, in poor listening conditions, such as in background noise, higher-resolution spectral information is necessary for good speech recognition. CI listeners appear to utilize only four to seven channels of spectral information no matter how many electrodes are available in their implant. It remains unclear why they are unable to use all of the spectral information that is presented. For post-lingually deafened CI patients, it may be that the transformation of acoustic frequency to cochlear place is too dissimilar in the implant device from what they were previously accustomed to with acoustic hearing. When the frequency-to-place mapping is overly distorted, listeners may not be able to fully utilize all of the spectral channels that are available. If the warping of frequency-place mapping is severe, listeners may lose the ability to utilize spectral channels altogether. 6.0 Binaural Cochlear Implants One of the biggest complaints of CI patients is the difficulty they have understanding speech in noisy listening conditions. It has long been known that binaural hearing provides a large advantage for separating signals from background noise, and researchers have begun to investigate the advantages of binaural cochlear implants for speech recognition in noise. Van Hoesel et al. (1993, 1995, 1997) measured sentence recognition in quiet and in noise by CI users who had bilateral implants. Subjects were able to utilize interaural level differences (ILDs) to lateralize sounds; however, their ability to lateralize using interaural temporal differences (ITDs) was much poorer than NH listeners. Nonetheless, a small advantage was observed for the binaural processors in noise over either monaural processor. Many patients have since received binaural implants, and several research groups have studied their effectiveness. Sound source localization with binaural implants was recently measured in one CI patient (Long et al. 1998; Long 2000). The time delay, loudness difference, and electrode location was varied between the two implants. In this patient, sounds were localized towards the side that was stimulated first or was louder, similar to localization in normal hearing. This patient was able to utilize ITDs as short as 150 microseconds (µs) to lateralize sounds – a value that is comparable to that of NH listeners. However, these effects were only observed if the test electrodes from the two sides were matched in pitch, suggesting that the electrodes were stimulating the same tonotopic region in the two cochleae. If the
Shannon SHAR Chapter page 22
stimulating electrodes from the two implants elicited distinctly different pitch percepts, then localization was poor for all time or loudness differences between the two devices. This corresponds well to NH listeners, who can localize sounds only if they are presented to the same cochlear region of both ears, within a few mm (Nuetzel and Hafter 1981). In general, signals presented to two ears must stimulate tonotopic regions within a critical band of each other (one to two mm) for the central system to make full use of the ITD for localization. This result indicates that it is highly important to match the two implant devices in pitch (which presumably means cochlear location) to achieve the benefit of binaural processing. Lawson et al. (1998, 2001) measured binaural speech recognition in quiet and in noise in several CI listeners with binaural implants and found that, while some patients achieved better speech recognition in noise with two implants, others received no benefit over a single implant. Mixed results were also observed for binaural implant users’ ability to localize sounds, with some patients able to localize stimuli with ITDs as low as 50 µs, while others were unable to localize at any ITD. At the present time it is unclear how many patients might benefit from binaural cochlear implants. Even for patients who may ultimately benefit from two devices, the fitting process of binaural implants will be difficult, requiring not only the normal fitting of each individual implant, but also specialized fitting procedures to match the two devices in terms of cochlear place. Amplitude compression schemes commonly used in implant speech processors may have to be linked to produce the correct level difference between devices. The frequency-to-place mapping in each implant would also have to compensate for differences in electrode location between the two implants. Some patients may not have sufficient residual auditory capacity in the central nervous system to make use of binaural cues from two implants, even if they are properly matched in terms of loudness and pitch. Presently, it is difficult to estimate the proportion of patients that might benefit from binaural cochlear implants or to devise a method that might be used to predict this population prior to surgery. 7.0 Combined Acoustic and Electric Stimulation As cochlear implants have provided increasingly better speech recognition to patients over the years, patient selection criteria have been relaxed to allow for implantation of patients who have some residual hearing. Many cases have been reported in which the implant did not damage the residual acoustic hearing of the implanted ear (von Ilberg et al. 1999). Recent clinical trials have investigated whether a cochlear implant could be useful for patients who have only low-frequency residual hearing. Such patients generally do poorly with hearing aids, presumably because they have no remaining hair cells in the basal end of the cochlea. In these patients, a cochlear implant inserted into only the basal end of the cochlea might provide some benefit without destroying the residual hearing at the apical end of the cochlea. The residual acoustic low frequency hearing could be combined with electric stimulation of the higher-frequency regions in the

Shannon SHAR Chapter page 23
cochlea. Can patients effectively combine acoustic and electric stimulation in the same ear? The initial clinical trials have so far shown mixed results (Turner and Gantz 2001; Lawson et al. 2001). Some patients (under some conditions) were able to achieve better speech recognition with combined acoustic and electric hearing than with either type of stimulation alone, particularly in noise. However, other patients showed no improvement, and some even showed some deterioration in their residual acoustic hearing after implantation. The results of Turner and Gantz (2001) suggest that acoustic and electric stimulation should be contiguous for the combined stimulation to be beneficial. If there is a large gap in the tonotopic space that is not stimulated, or if the frequency information conveyed by the electric stimulation is not appropriate for the stimulated cochlear location, patients may receive little or no benefit. 8.0 Auditory Brainstem Implants Neurofibromatosis Type 2 (NF2) is a genetic disorder that produces bilateral benign tumors on the vestibular branch of the auditory nerves. These tumors can be removed surgically but the procedure often severs the eighth nerve, leaving these patients deaf and unable to benefit from a cochlear implant. Because these patients do not have a functioning auditory nerve, prosthetic stimulation of the auditory system must target the next stage of neural processing - the cochlear nucleus (CN) complex in the brainstem. The auditory brainstem implant (ABI) was developed for this patient population by the House Ear Institute in collaboration with the Huntington Medical Research Institutes in Pasadena, CA and Cochlear Corporation. The ABI is similar in design and function to a cochlear implant, but the electrode is placed on the cochlear nucleus rather than in the cochlea. The first ABI was a single-channel device pioneered by William House and William Hitselberger in 1979 (Edgerton et al. 1984; Eisenberg et al. 1987). The modest success of that first device lead to the development of multi-channel ABI devices (Brackmann et al. 1993; Shannon et al. 1993).
Presently, ABI devices are produced by all major cochlear implant companies (availability in the US is restricted to the device made by Cochlear Corp.). The Cochlear Corp. device has 21 electrodes on a silicone pad that is placed into the lateral recess of the fourth ventricle, which lies adjacent to the cochlear nucleus. Basic psychophysical performance is similar between ABI and CI patients (Shannon and Otto 1990; Zeng and Shannon 1992, 1994), but speech recognition performance is considerably poorer with the ABI (Otto et al. 1998, 2002). Although the ABI has 21 electrodes, patients do not seem able to use the multiple channels of spectral information. Most multi-channel ABI patients perform at levels similar to those of single-channel CI users. A few ABI patients (less than 10%) are able to understand a limited number of words in sentences– performance comparable to that with a 2- or 3-channel cochlear implant. It is possible that the difference in performance between CI and ABI is due to the lack of consistent pitch mapping in the ABI.

Shannon SHAR Chapter page 24
In the surface electrode ABI, electrically stimulated pitch percepts do not always increase in a regular fashion from one end of the electrode array to the other. For some ABI patients, pitch percepts increase from lateral to medial electrodes, while others show the reverse pattern; some patients show a disordered pattern of pitch percepts associated with electrodes, while others perceive little change in pitch across the entire electrode array (Otto et al. 1998). The variable relation between pitch and electrode location in the present ABI device is most likely due to the fact that the tonotopic dimension of the human CN is oriented orthogonal to the surface, while the electrode array lies parallel to the surface. To obtain better stimulation along the tonotopic axis of the CN, a new ABI with penetrating microelectrodes has been developed (McCreery et al. 2000). The penetrating microelectrodes will be of different lengths so that they will target different pitch regions of the CN. The first application of this penetrating electrode auditory brainstem implant (PABI) in humans is slated for 2003.
The PABI will present an interesting test of prosthetic design. If poor speech recognition performance by ABI patients is due to poor access to the CN tonotopic organization, then the PABI should correct this problem and PABI patients’ performance should be at levels more equivalent to that of CI patients. On the other hand, if poor ABI speech recognition is due to the lack of critical intrinsic neural mechanisms bypassed by the ABI device, there would be no improvement in PABI patients’ performance because the PABI device would also bypass these critical neural mechanisms. If the PABI produces CI-like levels of speech recognition, it may be possible to stimulate even higher auditory brainstem nuclei, such as the Inferior Colliculus, or even the auditory cortex, which might provide easier surgical access than the CN. 9.0 Implications for Implant Speech Processor Design Two factors emerge as major challenges for cochlear implant research and design: CI patients’ inability to utilize all channels of the spectral information provided by the implant, and patient outcome variability. Figure 9 shows that the best CI users were able to recognize speech at a similar level to NH subjects listening to a comparable number of channels. However, this similarity only holds for less than eight electrodes/channels. Beyond 8 channels/electrodes, NH listeners continued to improve while CI listeners did not. To improve patients’ speech recognition, it is critical to understand why CI listeners seem to be limited to 8 spectral channels. Next-generation implants that have more electrodes may not improve performance until the cause of this limitation can be determined.
Figure 9 also showed that, while some CI listeners were able to perform as well as NH subjects when listening to a comparable number of spectral channels, some were not. Understanding the causes of the large range in performance among CI patients is another priority for future speech processor design. Some CI listeners may simply have too much damage to their auditory nerve from the pathology that caused their deafness, or from its sequellae, and so may never be able to take full advantage of cochlear implant technology. For

Shannon SHAR Chapter page 25
these patients, an appropriate speech processor fitting protocol might include an assessment of their auditory perceptual capabilities, and tailor the parameters of the speech processor to best exploit those capabilities. For other poorly performing CI patients, the outlook may be much more optimistic. If poor performance is the result of speech processing that distorts the mapping of acoustic frequency information to cochlear place, then simple modifications to the signal processing may dramatically improve speech understanding. As shown earlier, experiments with NH listeners showed that a five mm mismatch in the frequency-to-place mapping, or a severe warping in the frequency-to-place mapping resulted in a total inability to use spectral information (Shannon et al. 1998; Fu and Shannon 1999). It is possible that the poor performance of some CI listeners is due to such spectral distortions; restoring the normal acoustic frequency-to-place mapping might result in improved speech recognition. Clinical fitting procedures must be developed to assess the optimal frequency-to-electrode mapping in individual CI patients.
Cochlear implants provide a surprisingly high level of functional hearing to deaf patients, and the sophistication of the implant hardware continues to improve rapidly. Some gains in implant performance over the past 20 years have been directly due to improvements in basic implant technology, such as faster speech processors and more electrodes. However, technological advances may be nearing the point of diminishing returns, given the high costs involved and limited additional benefits they may provide. The next phase of improvement in cochlear implant performance may come not from further development of the implant hardware, but from understanding how implant speech processors may be more effectively programmed and customized for individual patients, so that the capabilities that are already available may be fully utilized. 10.0 Overall Summary
The studies reviewed in this chapter demonstrate that amplitude mapping (Figures 4 to 8) and envelope filter frequency are not critical for speech recognition, at least in quiet listening conditions. Reduced temporal and amplitude cues can cause some reduction in speech recognition, but the effects are relatively small, even in cases where the spectral resolution is severely limited. When spectral cues are available, even severely reduced temporal and/or amplitude cues have almost no effect on speech recognition. However, there may be some differences in temporal processing that may account for some differences in implant patient performance. In terms of spectral resolution, relatively little improvement in speech recognition is observed in implant performance as the number of electrodes is increased beyond 7 or 8 (Figures 11 and 13), even for implant patients who have excellent electrode selectivity. Some as-yet-unknown factor appears to limit implant listeners’ ability to utilize all the spectral information that is provided by the implant. The two factors that appear to be most significant for implant speech recognition are: the tonotopic match between acoustic speech information and the location of stimulating electrodes (Figures 14-16), and the match between the relative bandwidth of the
Shannon SHAR Chapter page 26
frequency analysis bands and the extent of neural activation for each electrode (Figure 17). 11.0 References Allen JB (1994) How do humans process and recognize speech? IEEE Trans
Speech Audio Proc 2:567-577. Bacon SP, Viemeister NF (1985) Temporal modulation transfer functions in
normal-hearing and hearing-impaired listeners, Audiology 24:117-134. Blesser B (1972) Speech perception under conditions of spectral transformation:
I. Phonetic characteristics, J Speech and Hear Res 15:5-41. Boothroyd A, Mulhearn B, Gong J, Ostroff J (1996) Effects of spectral smearing
on phoneme and word recognition, J Acoust Soc Am 100:1807-1818. Brackmann DE, Hitselberger WE, Nelson RA, Moore JK, Waring M, Portillo F,
Shannon RV, Telischi F (1993) Auditory Brainstem Implant. I: Issues in Surgical Implantation, Otolaryngol - Head and Neck Surg 108: 624-634.
Braida LD, Durlach NI, Lippmann RP, Hicks BL, Rabinowitz WM, Reed CM (1979) Hearing aids – a review of past research on linear amplification, amplitude compression, and frequency lowering, ASHA Monograph 19:1-114.
Brill SM, Gstottner W, Helms J, von Ilberg C, Baumgartner W, Muller J, Kiefer J 1997 Optimization of channel number and stimulation rate for the fast continuous interleaved sampling strategy in the COMBI 40+. Am J Otol. 18(6 Suppl):S104-6
Burns EM, Viemeister NF (1976) Nonspectral pitch, J Acoust Soc Amer 60:863-869.
Burns EM, Viemeister NF (1981) Played-again SAM: Further observations on the pitch of amplitude-modulated noise, J Acoust Soc Amer 70:1655-1660.
Cazals Y, Pelizzone M, Saudan O, Boex C (1994) Low-pass filtering in amplitude modulation detection associated with vowel and consonant identification in subjects with cochlear implants J Acoust Soc Am 96(4):2048-54.
Chatterjee M, Shannon RV (1998) Forward masked excitation patterns in multielectrode cochlear implants J Acoust Soc Am 103(5): 2565-2572.
Chatterjee M, Shannon RV, Galvin JJ, Fu Q-J (2001) Spread of excitation and its influence on auditory perception with cochlear implants, Physiological and Psychological bases of Auditory Function: Proceedings of the 12th International Symposium on Hearing, A.J.M. Houtsma, A. Kohlrausch, V.F. Prijs, and R. Schoonhoven (Eds.), Shaker Publishing BV, Maastricht, NL, pp. 403-410.
Cosendai G, Pelizzone M (2001) Effects of the acoustical dynamic range on speech recognition with cochlear implants, Audiology 40:272-281.
Daniloff RG, Shiner TH, and Zemlin WR (1968) Intelligibility of vowels altered in duration and frequency, J Acoust Soc Amer 44:700-707.
Dorman MF, Loizou PC (1998) Identification of consonants and vowels by cochlear implant patients using a 6-channel continuous interleaved

Shannon SHAR Chapter page 27
sampling processor and by normal-hearing subjects using simulations processors with two to nine channels, Ear and Hear 19:162-166.
Dorman MF, Loizou PC, Rainey D (1997a) Simulating the effect of cochlear-implant electrode insertion depth on speech understanding, J Acoust Soc Am 102: 2993-2996.
Dorman MF, Loizou PC, Rainey D (1997b) Speech intelligibility as a function of the number of channels of stimulation for signal processors using sine-wave and noise-band outputs, J Acoust Soc Am 102:2403-2411.
Drullman R (1995) Temporal envelope and fine structure cues for speech intelligibility, J Acoust Soc Am 97:585-592.
Drullman R, Festen JM, Plomp R (1994a) Effect of temporal envelope smearing on speech perception, J Acoust Soc Am 95:1053-1064.
Drullman R, Festen JM, Plomp R (1994b Effect of reducing slow temporal modulations on speech perception, J Acoust Soc Am 95: 2670-2680.
Dubno JR, Dorman MF (1987) Effects of spectral flattening on vowel identification, J Acoust Soc Am 82:1503-1511.
Eddington DK, Rabinowitz WR, Tierney J, Noel V, Whearty M (1997) Speech Processors for Auditory Prostheses, 8th Quarterly Progress Report, NIH Contract N01-DC-6-2100.
Edgerton BJ, House WF, Hitselberger W (1984) Hearing by cochlear nucleus stimulation in humans, Ann Otol Rhinol Otolaryngol, 91[Suppl.]:117-124.
Eisenberg LS, Maltan AA, Portillo F, Mobley JP, House WF (1987) Electrical stimulation of the auditory brain stem structure in deafened adults, J Rehab Res Dev 24:9-22.
Fishman K, Shannon RV, Slattery WH (1997) Speech recognition as a function of the number of electrodes used in the SPEAK cochlear implant speech processor. J Speech Hear Res 40:1201-1215.
Freyman RL, Nerbonne GP (1989) The importance of consonant-vowel intensity ratio in the intelligibility of voiceless consonants, J Speech Hear Res 32:524-535.
Freyman RL, Nerbonne GP, Cote HC (1991) Effect of consonant-vowel ratio modification on amplitude envelope cues for consonant recognition, J Speech Hear Res 34:415-426.
Friesen L, Shannon RV, Baskent D, Wang X (2001) Speech recognition in noise as a function of the number of spectral channels: comparison of acoustic hearing and cochlear implants, J Acoust Soc Am 110:1150-1163.
Fu Q-J (1997) Speech Perception in Acoustic and Electric Hearing, Ph.D. Dissertation, University of Southern California, Los Angeles, CA.
Fu Q-J (2002) Temporal processing and speech recognition in cochlear implant users, NeuroReport, 13:1-5.
Fu Q-J, Shannon RV (1998) Effects of amplitude nonlinearities on speech recognition by cochlear implant users and normal-hearing listeners, J Acoust Soc Am 104:2570-2577.
Fu Q-J, Shannon RV (1999a) Effects of electrode configuration and frequency allocation on vowel recognition with the Nucleus-22 cochlear implant Ear & Hearing 20(4): 332-344.

Shannon SHAR Chapter page 28
Fu Q-J, Shannon RV (1999b) Recognition of spectrally degraded and frequency-shifted vowels in acoustic and electric hearing, J Acoust Soc Am 105:1889-1900.
Fu Q-J, Shannon RV (2000) Effect of stimulation rate on phoneme recognition in cochlear implants, J Acoust Soc Am 107(1): 589-597.
Fu Q-J, Shannon RV, Wang X (1998b) Effects of noise and number of channels on vowel and consonant recognition: Acoustic and electric hearing, J Acoust Soc Am 104:3586-3596.
Fu Q-J, Shannon RV, Galvin JJ, III (2002) Perceptual learning following changes in the frequency-to-electrode assignment with the Nucleus-22 cochlear implant, Journal of the Acoustical Society of America 112:1664-1674.
Greenwood DD (1990) A cochlear frequency-position function for several species - 29 years later, J Acoust Soc Am 87: 2592-2605.
Hanekom JJ, Shannon RV (1998) Gap detection as a measure of electrode interaction in cochlear implants, J Acoust Soc Am 104(4): 2372-2384.
Hill FJ, McRae LP, McClellan RP (1968) Speech recognition as a function of channel capacity in a discrete set of channels, J Acoust Soc Am 44:13-18.
Lawson D, Wilson B, Finley C (1993) New processing strategies for multichannel cochlear prostheses. In J.A. Allum, D.J. Allum-Mecklenburg, F.P. Harris, and R. Probst (Eds.), Natural and Artificial Control of Hearing and Balance, Progress in Brain Research, 97:313-321, Amsterdam: Elsevier.
Lawson DT, Wilson BS, Zerbi M, Finley CC (1996) Speech processors for auditory prostheses, Third Quarterly Progress Report, NIH Contract N01-DC-5-2103.
Lawson DT, Wilson BS, Zerbi M, van den Honert C, Finley CC, Farmer JC Jr, McElveen JT Jr., Roushe PA (1998) Bilateral cochlear implants controlled by a single speech processor, Amer. J. Otol. 19(6): 758-761.
Lawson DT, Brill S, Wolford R, Wilson BS, Schatzer R (2001) Speech processors for auditory prostheses, 9th Quarterly Progress Report, NIH Contract N01-DC-8-2105.�
Licklider JCR, Pollack I (1948) Effects of differentiation, integration, and infinite peak clipping on the intelligibility of speech, J Acoust Soc Am 20:42-51.
Lim HH, Tong YC, Clark GM (1989) Forward masking patterns produced by intracochlear stimulation of one and two electrode pairs in the human cochlea, J Acoust Soc Am 86: 971-980.
Lippmann RP (1996) Accurate consonant perception without mid-frequency energy, IEEE Trans. Speech Audio. Proc. 4:66-69.
Loizou PC, Dorman MF, Tu Z (1999) On the number of channels needed to understand speech, J Acoust Soc Am 106(4): 2097-2103.
Loizou PC, Poroy O, Dorman M (2000a) The effect of parametric variations of cochlear implant processors on speech understanding, J Acoust Soc Am 108(2): 790-802.
Loizou PC, Dorman M, Poroy O, Spahr T (2000b) Speech recognition by normal-hearing and cochlear implant listeners as a function of intensity resolution, J Acoust Soc Am 108:2377-2387.

Shannon SHAR Chapter page 29
Long CJ (2000) Bilateral Cochlear Implants: Basic Psychophysics. Massachusetts Institute of Technology, Ph.D. Dissertation.
Long CJ, Eddington DE, Colburn HS, Rabinowitz WM, Whearty ME, Kadel-Garcia N (1998) Speech processors for auditory prostheses, 11th Quarterly Progress Report, NIH Contract N01-DC-6-2100.
McCreery DG, Shannon RV, Moore JK, Chatterjee M, Agnew WF (1998) Accessing the tonotopic organization of the ventral cochlear nucleus by intranuclear microstimulation, IEEE Trans Rehab Eng 6:391-399.
Mendel LL, Hamill BW, Crepeau LJ, Fallon E (1995). Speech intelligibility assessment in a helium environment, J Acoust Soc Am 97:628-636.
Miller G, Nicely P (1955) An analysis of perceptual confusions among some English consonants. J Acoust Soc Am 27: 338-352.
Moore BCJ (2001) Dead regions in the cochlea: Diagnosis, perceptual consequences, and implications for the fitting of hearing aids. Trends in Amplification, 5:1-34.
Moore BCJ, Glasberg BR (1997) A model of loudness perception applied to cochlear hearing loss. Aud Neurosci 3:289-311.
Moore BCJ, Alcántara JI (2001) The use of psychophysical tuning curves to explore dead regions in the cochlea. Ear & Hearing, 22:268-278.
Moore BCJ, Huss M, Vickers DA, Glasberg BR, Alcántara JI (2000) A test for the diagnosis of dead regions in the cochlea. Brit J Audiol 34: 205-224.
Nagafuchi M (1976) Intelligibility of distorted speech sounds shifted in frequency and time in normal children, Audiology 15:326-337.
Nuetzel JM, Hafter, ER (1981) Discrimination of interaural delays in complex waveforms: Spectral effects, J Acoust Soc Am 69:1112-1118.
Otto SR, Shannon RV, Brackmann DE, Hitselberger WE, Staller S, Menapace C (1998) The multichannel auditory brainstem implant: Performance in 26 patients, Otolaryngol Head Neck Surg, 118:291-303.
Otto, SA, Brackmann, DE, Hitselberger, WE, Shannon, RV, Kuchta, J (2002) The multichannel auditory brainstem implant update: Performance in 60 patients, Journal of Neurosurgery, 96:1063-1071.
Pfingst BE, Franck KH, Xu L, Bauer EM, Zwolan TA (2001) Effects of electrode configuration and place of stimulation on speech perception with cochlear implants, J Assoc Res Otolaryngol, 2:87-103.
Plomp R (1983) The role of modulation in hearing, in Hearing – Physiological Bases and Psychophysics, R. Klinke and R. Hartmann, (Eds.), pp. 270-276, Springer-Verlag, Berlin.
Plomp R (1988) The negative effect of amplitude compression in multichannel hearing aids in light of the modulation-transfer function, J Acoust Soc Am 83:2322-2327.
Relkin EM and Doucet JR (1991) Recovery from prior stimulation. I. Relationship to spontaneous firing rates of primary auditory neurons, Hearing Res 55:215-222.
Rosen S (1992) Temporal information in speech and its relevance for cochlear implants, Philos Trans Royal Soc London Ser B Biol Sci 336:367.

Shannon SHAR Chapter page 30
Rosen S, Faulkner A, Wilkinson L (1999) Adaptation by normal listeners to upward spectral shifts of speech: Implications for cochlear implants, J Acoust Soc Am 106:3629-3636.
Rubinstein JT, Wilson BS, Finley CC, Abbas PJ (1999) Pseudospontaneous activity: Stochastic independence of auditory nerve fibers with electrical stimulation, Hearing Res 127:108-118.
Shannon RV (1983a) Multichannel electrical stimulation of the auditory nerve in man: I. Basic psychophysics, Hearing Res 11:157-189.
Shannon RV (1983b) Multichannel electrical stimulation of the auditory nerve in man: II Channel interaction. Hearing Res 12:1-16.
Shannon RV (1985) Loudness summation as a measure of channel interaction in a multichannel cochlear implant. In Cochlear Implants, RA Schindler and MM Merzenich, Eds., Raven Press, New York.
Shannon RV (1992) Temporal modulation transfer functions in patients with cochlear implants, J Acoust Soc Am 91:1974-1982.
Shannon RV, Otto SR (1990) Psychophysical measures from electrical stimulation of the human cochlear nucleus, Hearing Res 47:159-168.
Shannon RV, Fayad J, Moore J, Lo W, O’Leary M, Otto S, Nelson R (1993) Auditory brainstem implant: II. Postsurgical issues and performance. Otolaryngol Head Neck Surg 108:634-642.
Shannon RV, Zeng F-G, Kamath V, Wygonski J, Ekelid M (1995) Speech recognition with primarily temporal cues. Science 270:303-304.
Shannon RV, Zeng F-G, Wygonski J (1998) Speech recognition with altered spectral distribution of envelope cues, J Acoust Soc Amer, 104: 2467-2476.
Shannon RV, Fu Q-J, Wang X, Galvin J, Wygonski J (2001) Critical cues for auditory pattern recognition in speech: Implications for cochlear implant speech processor design, in Physiological and Psychological bases of Auditory Function: Proceedings of the 12th International Symposium on Hearing, DJ Breebaart, AJM Houtsma, A Kohlrausch, VF Prijs, and R Schoonhoven (Eds.), Shaker Publishing BV, Maastricht, NL, pp. 500-508.
Shannon RV, Galvin JG, and Baskent D (2001) Holes in hearing, J Assoc Res Otolaryngol, 3:185-199.
Skinner MW, Holden LK, Holden TA (1995) Effect of frequency boundary assignment on speech recognition with the SPEAK speech coding strategy, Ann Otol Rhinol Laryngol 104:Suppl. 166:307-311.
Steeneken HJM, Houtgast T (1980) A physical method for measuring speech-transmission quality, J Acoust Soc Am 67:318-326.
ter Keurs M, Festen JM, Plomp R (1992) Effect of spectral envelope smearing on speech reception. I, J Acoust Soc Amer 91:2872-2880.
ter Keurs M, Festen JM, Plomp R (1993) Effect of spectral envelope smearing on speech reception. II, J Acoust Soc Amer 93:1547-1552.
Tiffany WR, Bennett DA (1961) Intelligibility of slow-played speech, J Speech Hearing Res 4:248-258.

Shannon SHAR Chapter page 31
Turner, C. and Gantz, B. (2001). “Combining acoustic and electric hearing for patients with high frequency hearing loss,” Abstracts of the 2001 Conference on Implantable Auditory Prostheses, Asilomar, CA, p 33.
Turner CW, Souza PE, Forget LN (1995) Use of temporal envelope cues in speech recognition by normal and hearing-impaired listeners. J Acoust Soc Am. 97(4):2568-76.
Vandali AE, Whitford LA, Plant KL, Clark GM (2000) Speech perception as a function of electrical stimulation rate: Using the Nucleus 24 cochlear implant system, Ear Hear 21:608-624.
Van den Honert C, Stypulkowski PH (1984) Physiological properties of the electrically stimulated auditory nerve. II. Single fiber recordings, Hearing Res 14:225-243.
Van den Honert C, Stypulkowski PH (1987) Single fiber mapping of spatial excitation patterns in the electrically stimulated auditory nerve, Hear Res 29:195-206.
van Hoesel RJM, Clark GM (1995) Evaluation of a portable two-microphone adaptive beamforming speech processor with cochlear implant patients, J Acoust Soc Am 97:2498-2503.
van Hoesel RJM, Clark GM (1997) Psychophysical studies with two binaural cochlear implant subjects, J Acoust Soc Am 102:495-507.
van Hoesel RJM, Tong YC, Hollow RD, Clark GM (1993) Psychophysical and speech perception studies: A case report on a binaural cochlear implant subject, J Acoust Soc Am 94:3178-3189.
Van Tasell DJ, Greenfield DG, Logemann JJ, Nelson DA (1992) Temporal cues for consonant recognition: Training, talker generalization, and use in evaluation of cochlear implants, J Acoust Soc Am 92: 1247-1257.
Van Tasell DJ, Soli SD, Kirby VM, Widin GP (1987) Speech waveform envelope cues for consonant recognition, J Acoust Soc Amer 82:1152-1161.
Viemeister NF (1979) Temporal modulation transfer functions based upon modulation thresholds, J Acoust Soc Am 66:1364-1380.
von Ilberg C, Kiefer J, Tillein J, Pfenningdorff T, Hartmann R, Sturzebecher E, Klinke R (1999) Electric-acoustic stimulation of the auditory system. New technology for severe hearing loss. ORL J Otorhinolaryngol Relat Spec. 61(6):334-40.
Warren RM, Reiner KR, Bashford JA Jr, Brubaker BS (1995) Spectral redundancy: Intelligibility of sentences heard through narrow spectral slits, Percept. Psychophys. 57(2):175-182.
Wilson BS (1997) The future of cochlear implants, Brit J Audiol 31:205-225. Wilson BS, Finley CC, Lawson DT, Wolford RD, Eddington DK, Rabinowitz WM
(1991) New levels of speech recognition with cochlear implants, Nature 352:236-238.
Wilson BS, Lawson DT, Zerbi M, Finley CC, Wolford RD (1995) New processing strategies in cochlear implantation, Am J Otol 16:669-675.
Wilson BS, Finley CC, Lawson D, Zerbi M (1997) Temporal representations with cochlear implants, Am J Otol 18:(6 Suppl.)S30-S34.
Shannon SHAR Chapter page 32
Wilson BS, Wolford RD, Lawson DT (2000) Speech Processors for Auditory Prostheses, NIH Contract N01-DC-8-2105, 7th Quarterly Progress Report, June 2000.
Zeng F-G (2002) Temporal pitch in electric hearing. Hear Res. 174(1-2):101-6. Zeng F-G, Shannon RV (1992) Loudness balance between electric and acoustic
stimulation, Hearing Res 60:231-235. Zeng F-G, Shannon RV (1994) Loudness coding mechanisms inferred from
electric stimulation of the human auditory system, Science 264:564-566. Zeng F-G, Galvin J (1999) Amplitude mapping and phoneme recognition in
cochlear implant listeners, Ear Hear, 20:60-74. Zeng F-G, Shannon RV (1999) Psychophysical laws revealed by electric hearing,
NeuroReport 10(9): 1-5 Zeng FG, Turner CW, Relkin EM (1991) Recovery from prior stimulation. II:
Effects upon intensity discrimination. Hear Res. 55(2):223-30. Zeng F-G, Galvin J, Zhang C-Y (1998) Encoding loudness by electric stimulation
of the auditory nerve, NeuroReport 9(8): 1845-1848. Zeng F-G, Grant G, Niparko J, Galvin J, Shannon R, Opie J, Segel P (2002)
Speech dynamic range and its effect on cochlear implant performance. J Acoust Soc Am. 111(1 Pt 1):377-86.
Zwolan TA, Kileny PR, Ashbaugh C, Telian SA (1996) Patient performance with the Cochlear Corporation “20+2” implant: bipolar vs monopolar activation, Am J Otol 17:717-723.
Figure Captions Figure 1: Visual example of pattern recognition with reduced resolution. Familiar
picture of Abraham Lincoln is recognizable even when highly pixelated (A), but not when distorted by bulging (B), logarithmic skewing on one axis (C), or log-log skewing on both axes (D).
Figure 2: Block diagram of a noise-band vocoder. Signals are band-pass filtered,
the envelope is extracted from each channel by rectification and low-pass filtering, and the resulting envelope signal is used to modulate a noise band.
Figure 3: Spectrograms of a sentence comparing the original (A), with a noise-
band vocoded version of the same sentence in which the spectral resolution is reduced to 8 (B) or 2 (C) modulated noise bands.
Figure 4: Effect of amplitude mapping on consonant and vowel recognition by NH
listeners (N=7). From Fu and Shannon (1998). Figure 5: Effect of amplitude mapping on consonant and vowel recognition by CI
listeners (N=3). From Fu and Shannon (1998).

Shannon SHAR Chapter page 33
Figure 6: Effect of one mis-adjusted band in a four-channel noise-band processor on vowel recognition (N=4, from Fu, 1997).
Figure 7: Effect of amplitude mis-adjustment in one band of a multiband noise
processor. (N=4, from Fu, 1997)
Figure 8: Effect of center and peak clipping on vowel and consonant recognition (from Shannon et al. 2001)
Figure 9: Effect of changing slope of noise carrier bands (N=4, from Fu 1997). Figure 10: Five measures of electrode interaction for two implant listeners. A
comfortable masker was presented to electrode pair (10,12) and the indicated measure was collected from more apical and more basal electrode pairs. Individual panels are all oriented to resemble tuning curves and arbitrarily scaled to show comparable tuning depth.
Figure 11: Sentence recognition as a function of the number of electrodes (data
re-plotted from Fishman et al. 1997). Figure 12: Vowel recognition as a function of signal-to-noise ratio; the number of
spectral bands as the parameter. (From Fu et al. 1998b) Figure 13: Medial vowel recognition as a function of the number of electrodes for
10 Nucleus-22 listeners (filled symbols) and 9 Clarion listeners (open symbols). The dashed line shows normal-hearing listeners’ results with noise-band processors. From left to right, the panels show results for decreasing signal-to-noise ratios. (From Friesen et al. 2001)
Figure 14: Comparison of results from three studies that measured speech
recognition as a function of frequency compression, when temporal distortion was corrected.
Figure 15: Effect of a shift in envelope frequency information relative to the noise
carrier bands representing that information (from Fu, 1997). The abscissa shows the tonotopic location (in mm) of the most apical edge of the frequency analysis bands.
Figure 16: Comparison of vowel recognition for frequency expansion and
compression for original speech and for spectrally quantized speech. Figure 17: Effect of mismatched distribution of the analysis and carrier bands on
vowel recognition in a 4-channel noise-band processor. Carrier band partition condition 0 represents a linear division of the total frequency range, while condition 6 represents a logarithmic division. (From Fu 1997)
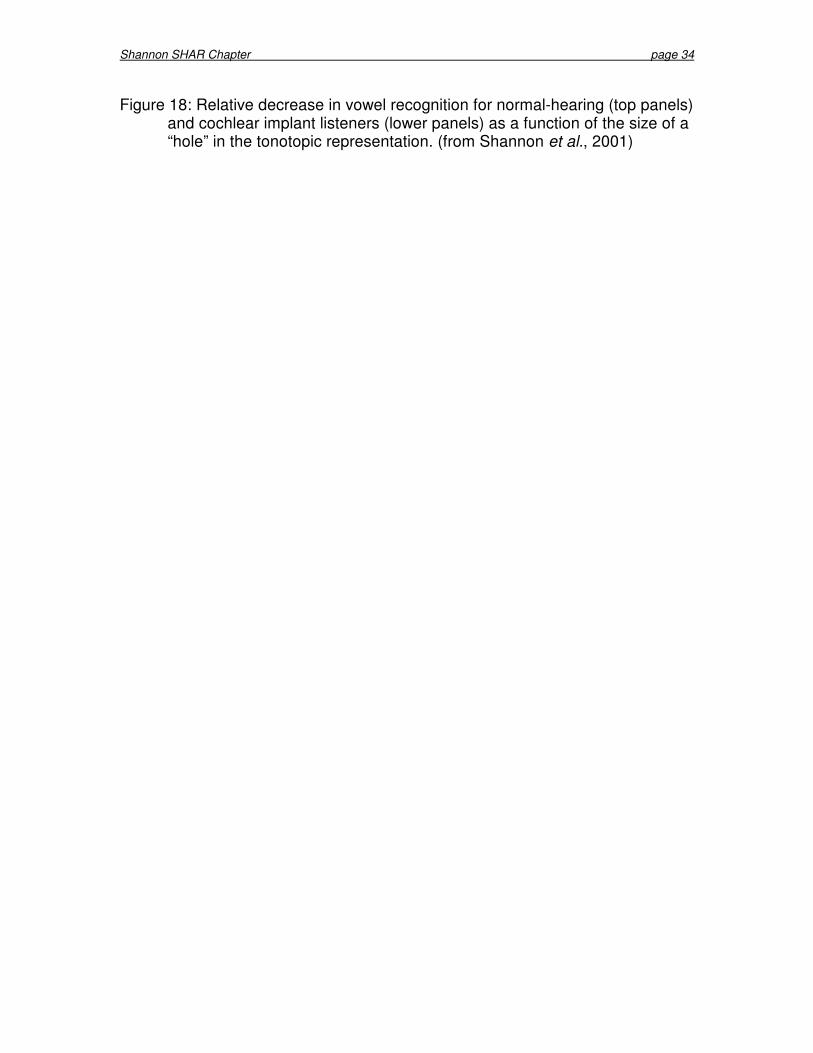
Shannon SHAR Chapter page 34
Figure 18: Relative decrease in vowel recognition for normal-hearing (top panels) and cochlear implant listeners (lower panels) as a function of the size of a “hole” in the tonotopic representation. (from Shannon et al., 2001)

Shannon SHAR Chapter page 35
Noise-
Bandpa
Envelo
Amplit
0
Ban
N
N
N
N
Shannon

Shannon SHAR Chapter page 36
0.3 0.5 0.8 2 31
Per
cent
Cor
rect
(%)
0
10
20
30
40
50
60
70
80
90
100
Consonant RecognitionVowel Recognition
Power function exponent (P)
0.3 0.5 0.8 2 31
VoicingMannerPlace
0.05 0.2 0.50.1
Per
cent
Cor
rect
(%)
0
10
20
30
40
50
60
70
80
90
100
Consonant RecognitionVowel Recognition
Power function exponent (P)0.05 0.2 0.50.1 1
VoicingMannerPlace

Shannon SHAR Chapter page 37
Level difference between analysis and carrier band (dB)
-80 -60 -40 -20 0 20 40
Per
cent
Cor
rect
(%
)
30
40
50
60
70
80
Band 1Band 2Band 3Band 4
Band Number
1 2 3 4
Per
cent
Cor
rect
(%)
30
40
50
60
70
80
90
100
4-Band: -80dB4-Band: +40dB4-Band
1 2 3 4 5 6 7 8
8-Band: -80dB8-Band: +40dB8-Band
A B

Shannon SHAR Chapter page 38
Filter Slope (dB/octave)
4 6 20 30 40 6010 100
Per
cent
Cor
rect
(%)
20
30
40
50
60
70
80
90
4-Channel6-Channel
Channel Number
1 2 3 4 5 6
4-Channel6-Channel
A B

Shannon SHAR Chapter page 39
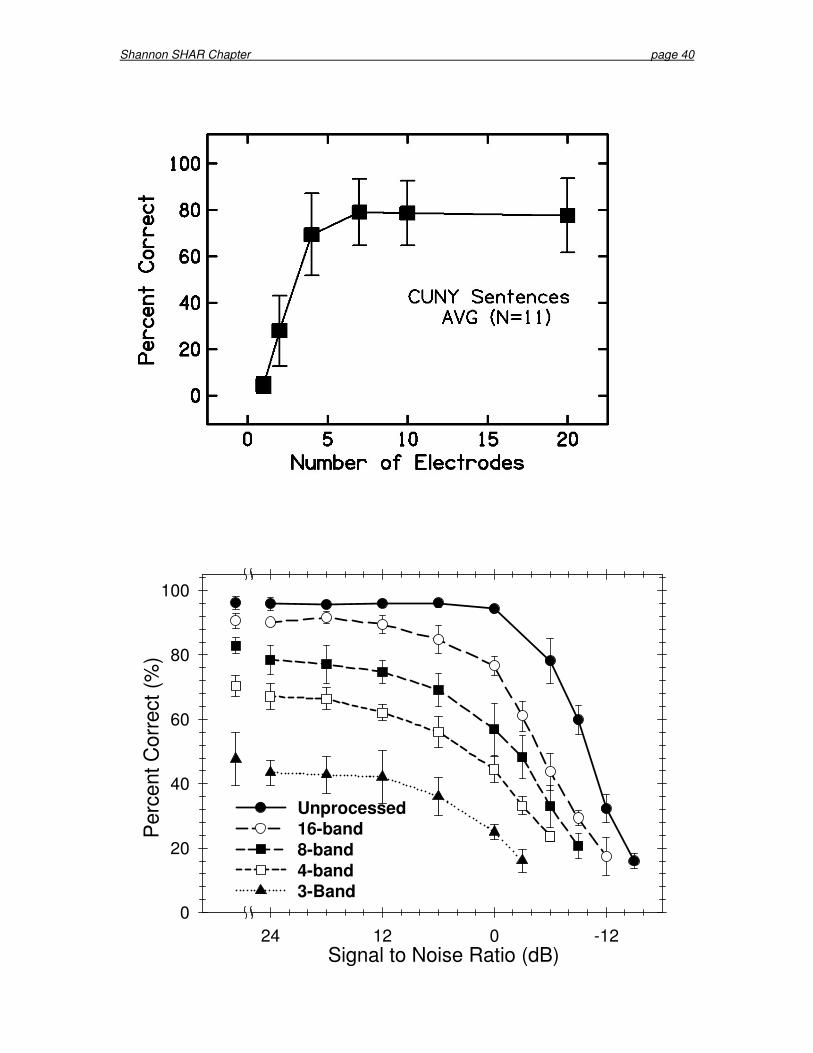
Shannon SHAR Chapter page 40
Signal to Noise Ratio (dB)-1201224
Per
cent
Cor
rect
(%)
0
20
40
60
80
100
Unprocessed16-band8-band4-band3-Band
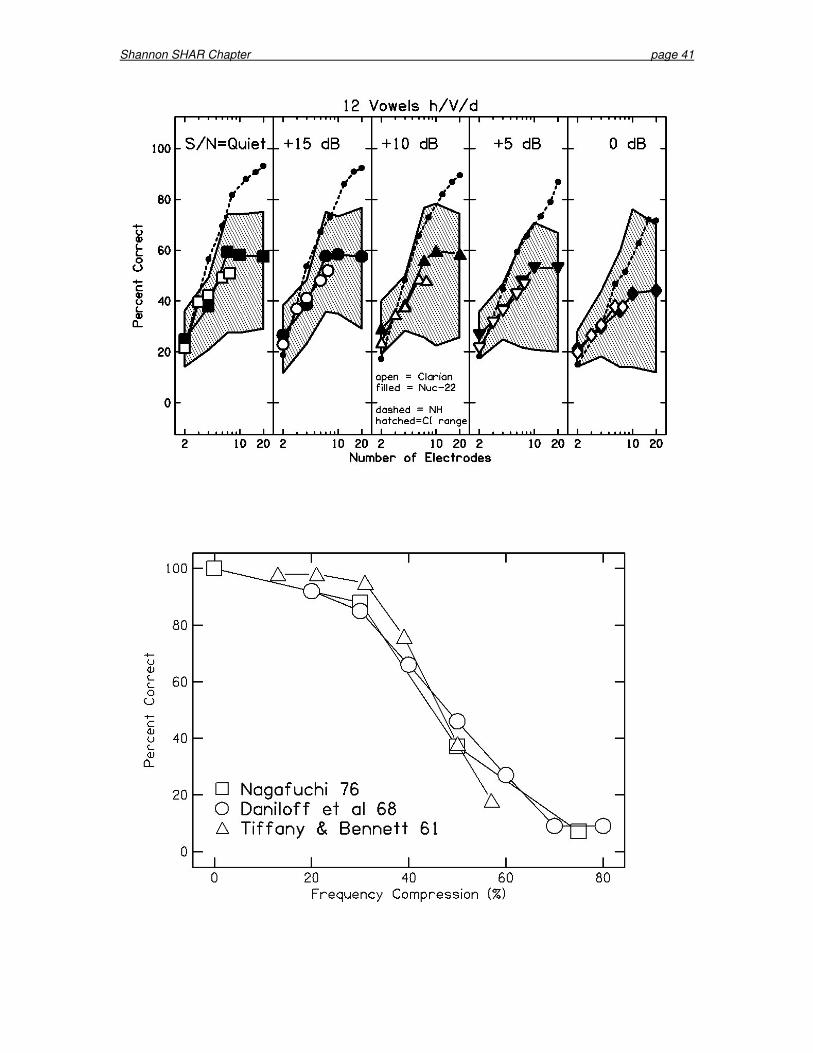
Shannon SHAR Chapter page 41
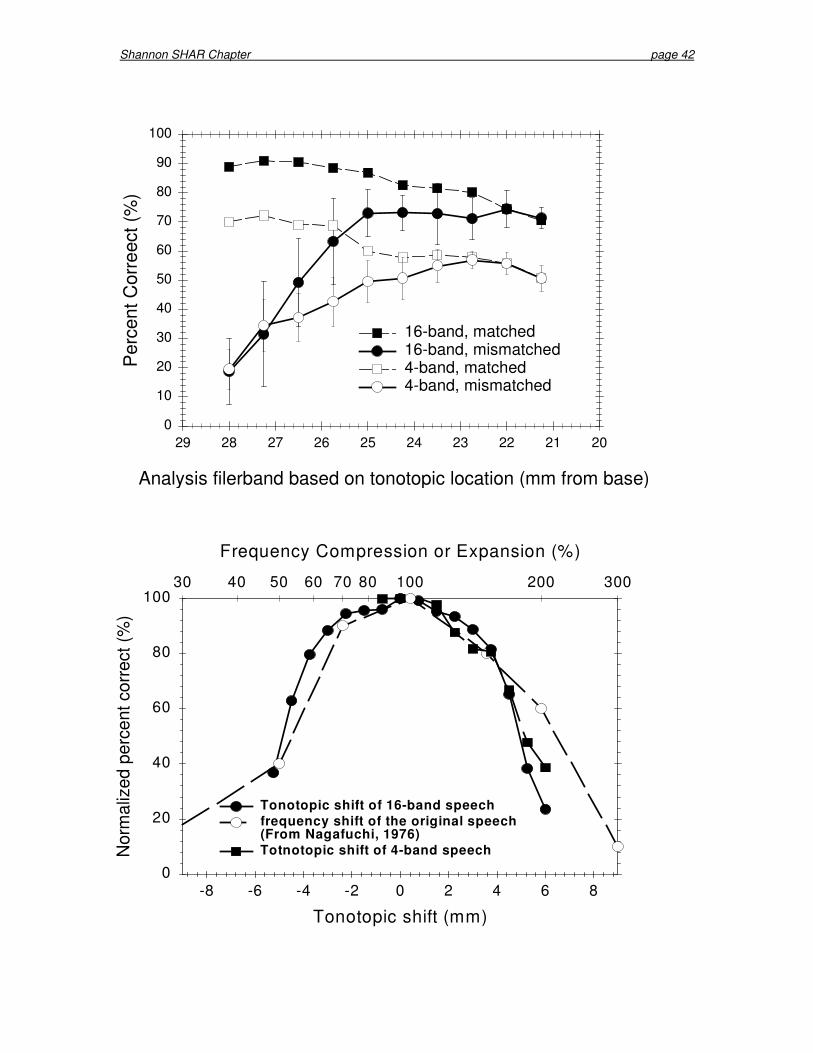
Shannon SHAR Chapter page 42
Analysis filerband based on tonotopic location (mm from base)
20212223242526272829
Per
cent
Cor
reec
t (%
)
0
10
20
30
40
50
60
70
80
90
100
16-band, matched16-band, mismatched 4-band, matched4-band, mismatched
Tonotopic shift (mm)
-8 -6 -4 -2 0 2 4 6 8
Nor
mal
ized
per
cent
cor
rect
(%)
0
20
40
60
80
100
Frequency Compression or Expansion (%)
30 40 50 60 70 80 200 300100
Tonotopic shift of 16-band speechfrequency shift of the original speech(From Nagafuchi, 1976)Totnotopic shift of 4-band speech
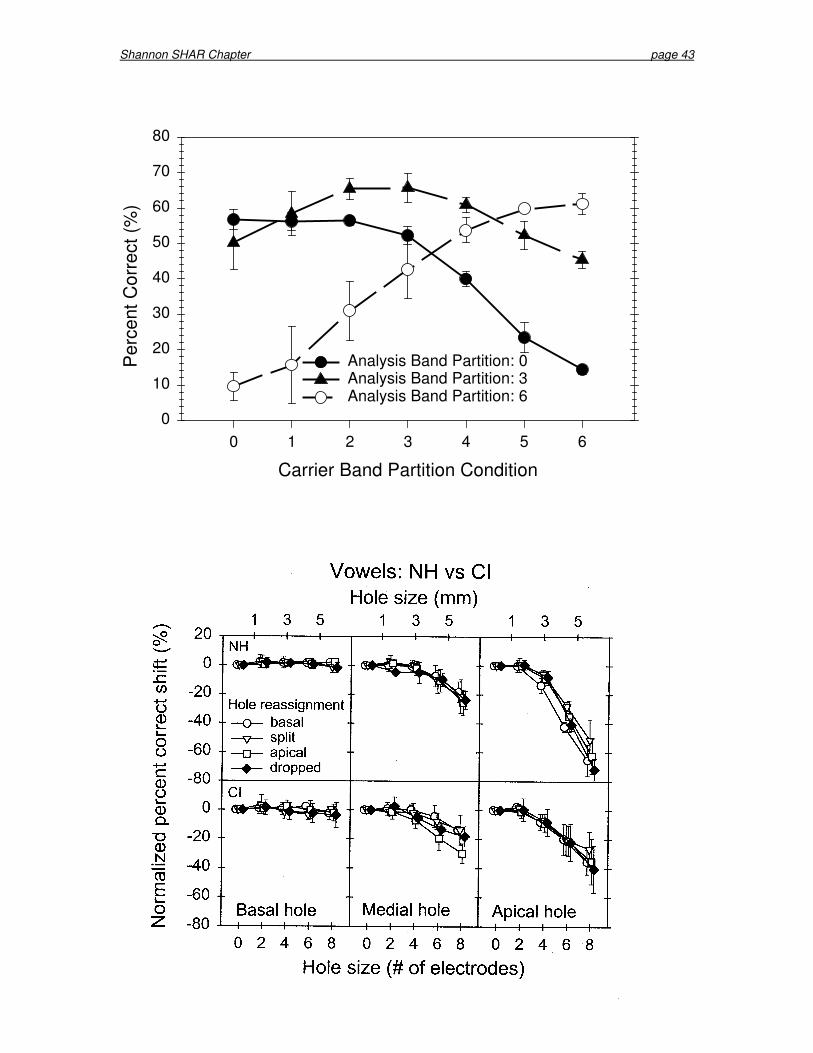
Shannon SHAR Chapter page 43
Carrier Band Partition Condition
0 1 2 3 4 5 6
Per
cent
Cor
rect
(%)
0
10
20
30
40
50
60
70
80
Analysis Band Partition: 0Analysis Band Partition: 3Analysis Band Partition: 6