Speech BASF analyst conference call Q2 2016 long
37
BASF 2nd Quarter 2016 Analyst Conference Call July 27, 2016, 11:00 a.m. (CEST) Ludwigshafen Analyst Conference Call Script – long version Kurt Bock Hans-Ulrich Engel The spoken word applies. BASF: Considerably higher earnings in chemicals business, Oil & Gas significantly below prior-year quarter Analyst Conference Call Q2 2016 July 27, 2016
-
Upload
basf -
Category
Investor Relations
-
view
274 -
download
2
Transcript of Speech BASF analyst conference call Q2 2016 long
BASF 2nd Quarter 2016 Analyst Conference Call July 27, 2016, 11:00 a.m. (CEST)
Ludwigshafen
Analyst Conference Call Script – long version
Kurt Bock Hans-Ulrich Engel
The spoken word applies.
150 years BASF: Considerably higher earnings in chemicals business, Oil & Gas significantly below prior-year quarter
Analyst Conference Call
Q2 2016
July 27, 2016

Page 2
BASF 2nd Quarter 2016 Analyst Conference Call July 27, 2016
150 years
BASF Q2 2016 Analyst Conference Call, July 27, 2016 2
Cautionary note regarding forward-looking statements
This presentation may contain forward-looking statements that are subject to risks anduncertainties, including those pertaining to the anticipated benefits to be realized from theproposals described herein. Forward-looking statements may include, in particular, statementsabout future events, future financial performance, plans, strategies, expectations, prospects,competitive environment, regulation and supply and demand. BASF has based these forward-looking statements on its views and assumptions with respect to future events and financialperformance. Actual financial performance could differ materially from that projected in theforward-looking statements due to the inherent uncertainty of estimates, forecasts andprojections, and financial performance may be better or worse than anticipated. Given theseuncertainties, readers should not put undue reliance on any forward-looking statements. Theinformation contained in this presentation is subject to change without notice and BASF doesnot undertake any duty to update the forward-looking statements, and the estimates andassumptions associated with them, except to the extent required by applicable laws andregulations.
150 years
BASF Q2 2016 Analyst Conference Call, July 27, 2016 3
Financial figures Q2 2016 Q2 2015 Change
Sales €14.5 billion €19.1 billion (24%)
EBITDA €2.8 billion €3.0 billion (7%)
EBIT before special items €1.7 billion €2.0 billion (16%)
EBIT €1.7 billion €2.0 billion (16%)
Net income €1.1 billion €1.3 billion (14%)
Reported EPS €1.19 €1.38 (14%)
Adjusted EPS €1.30 €1.49 (13%)
Operating cash flow €2.3 billion €2.8 billion (17%)
Sales development Volumes Prices Portfolio Currencies
Q2 2016 vs. Q2 2015 2% (7%) (16%) (3%)
Q2 2016: Financial figures for BASF Group
Page 3
BASF 2nd Quarter 2016 Analyst Conference Call July 27, 2016
Kurt Bock Ladies and gentlemen, good morning and thank you for joining us. [Chart 3: Q2 2016: Financial figures for BASF Group]
The macroeconomic environment improved slightly in the second
quarter and there seemed to be some modest improvement in market
confidence. The increase in oil price and a slight pickup in demand
since the end of March underline these developments. We
experienced robust demand from the automotive and construction
industries. However, the macroeconomic situation remains fragile. In
particular the UK’s recent Brexit decision has added to the overall
economic uncertainty and market volatility. More recently, the
situation in Turkey contributed to the political uncertainty.
Let’s look at the development in the regions.
In Europe, we saw moderate growth across all sectors. Demand in
North America was slightly lower than expected. However, the
economic environment can still be characterized as robust.
Economic development in South America remained very weak and
business confidence continued to be low. Brazil is still in a deep
recession, although that appears to be leveling off. While
fundamentals in Argentina improved, the country still suffered from
weak export demand, fiscal consolidation and high inflation.
In Asia, we saw an upward trend since the second half of March and
an overall improvement compared to the second half of 2015.
Growth in China remained below the high levels of previous years,
but was slightly higher than we had expected at the beginning of the
year.
Page 4
BASF 2nd Quarter 2016 Analyst Conference Call July 27, 2016
Page 5
BASF 2nd Quarter 2016 Analyst Conference Call July 27, 2016
Let me now highlight BASF’s business performance in Q2 2016:
Sales in the second quarter of 2016 decreased by 24 percent to
14.5 billion euros, in particular due to portfolio effects of minus
16 percent. These were mainly related to the asset swap with
Gazprom, which we completed at the end of September 2015. The
disposed gas trading and storage activities had accounted for
3.0 billion euros of sales in the prior-year quarter.
We were able to increase our sales volumes in all operating
segments, except for Agricultural Solutions, which continues to
face a tough market environment. In the chemicals business,
volumes were up by 4 percent, mainly driven by Functional
Materials & Solutions and Chemicals.
Sales prices declined by 7 percent following lower raw material
prices. Currency effects amounted to minus 3 percent. The
headwinds were in particular related to the U.S. dollar, Argentine
Peso and Chinese Renminbi.
EBITDA declined by 7 percent to 2.8 billion euros.
EBIT before special items came in at 1.7 billion euros, 16 percent
lower than in the prior-year quarter. Significantly higher earnings
in our chemicals business were driven by Performance Products
and Functional Materials & Solutions. However, this could not
compensate for the significant earnings drop in Oil & Gas.

Page 6
BASF 2nd Quarter 2016 Analyst Conference Call July 27, 2016
Page 7
BASF 2nd Quarter 2016 Analyst Conference Call July 27, 2016
Special items in EBIT amounted to plus 11 million euros. Disposal
gains from divestitures, including the sale of our polyolefin
catalysts business, were partially offset by expenses related to
restructuring measures and other operating charges.
EBIT declined by 16 percent to 1.7 billion euros.
Income taxes amounted to 414 million euros. The tax rate of
26.9 percent was at the level of the prior-year quarter.
At 1.1 billion euros, net income came in 14 percent lower than in
the second quarter of last year.
Reported earnings per share decreased from 1.38 euros to
1.19 euros in Q2 2016. Adjusted EPS amounted to 1.30 euros.
At 2.3 billion euros, operating cash flow in Q2 2016 was above
Q1 2016 but lower than in the prior-year quarter. Free cash flow
increased by about 130 million euros compared to the prior-year
quarter and came in at 1.3 billion euros. This resulted from lower
payments for investment projects in the second quarter of 2016.
Page 8
BASF 2nd Quarter 2016 Analyst Conference Call July 27, 2016
150 years
BASF Q2 2016 Analyst Conference Call, July 27, 2016 4
Milestones in Q2 2016
Startup of aspecialty amines plant
in Nanjing, China
Agreement to acquire global surface treatment
provider Chemetall
Completion of thepolyolefin catalysts
divestiture
Startup of a PolyTHF® plantin Korla, China
Page 9
BASF 2nd Quarter 2016 Analyst Conference Call July 27, 2016
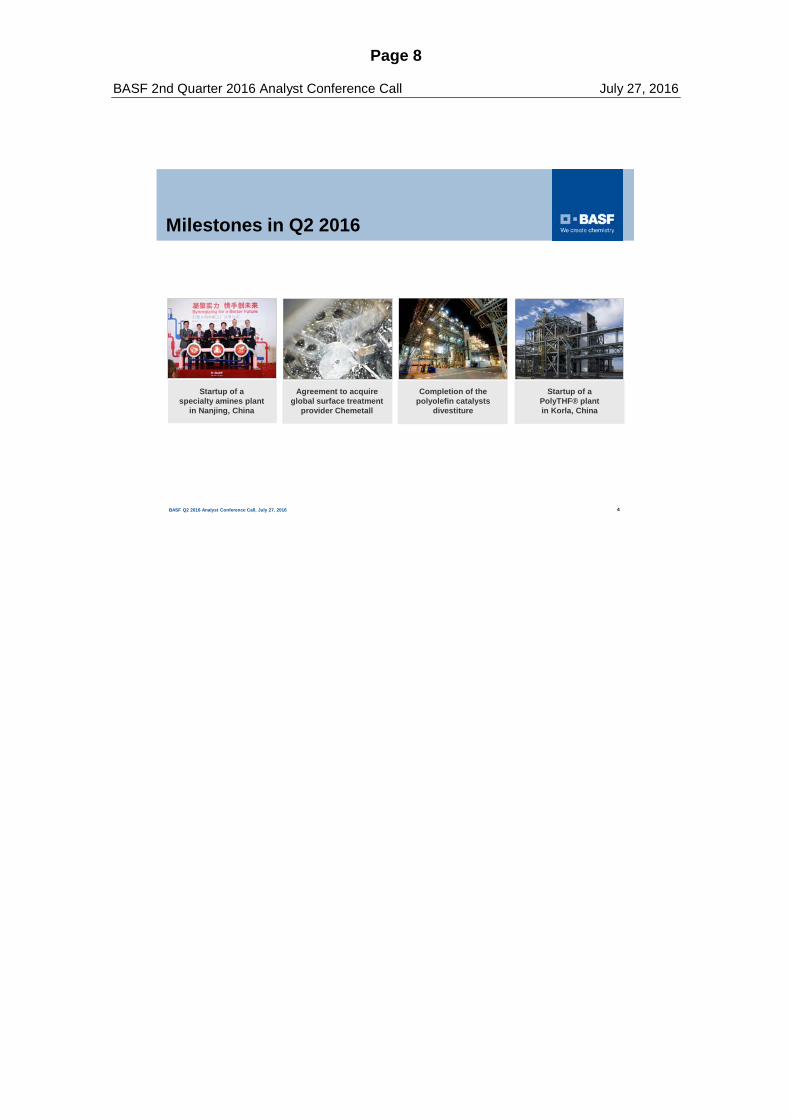
[Chart 4: Milestones in Q2 2016]
Ladies and gentlemen,
Let me highlight a few milestones of Q2 2016:
At the end of April, we started up our plant for the production of
specialty amines in Nanjing, China. This asset complements our
existing facilities in Germany and the U.S. and improves our ability
to flexibly serve our customers in Asia Pacific.
In mid-June, we signed an agreement to acquire Albemarle’s global
surface treatment business. Chemetall is a global technology and
innovation leader in the metals surface treatment market and
operates 21 production sites, 10 R&D locations and 24 sales offices
worldwide. The company offers a strong strategic fit for our
coatings business by complementing our current coatings portfolio.
The acquisition will support BASF’s aim to grow profitably in
downstream, innovation and solution-focused businesses. The
purchase price is 3.2 billion U.S. dollars. Closing is expected by the
end of 2016. The transaction is subject to approval by the relevant
authorities.
On June 30, we closed the previously announced transaction to
divest our polyolefin catalysts business to W. R. Grace & Co. The
transaction comprises technologies, patents, trademarks and the
transfer of production plants in Pasadena, Texas, and Tarragona,
Spain. The disposal gain is in a double-digit million euro range.

Page 10
BASF 2nd Quarter 2016 Analyst Conference Call July 27, 2016
Page 11
BASF 2nd Quarter 2016 Analyst Conference Call July 27, 2016
In early July, we started commercial production in the PolyTHF®
plant in Korla, China, which is part of a joint venture with Xinjiang
Markor. The plant provides an annual capacity of 50,000 tons and
complements BASF’s existing Asian production facilities in
Shanghai, China, and Ulsan, Korea. In Korla, BASF and Markor
are now jointly operating an integrated PolyTHF® production,
following the startup of the butanediol plant in January 2016. BDO
is a precursor for the production of PolyTHF®.
And now Hans will comment on the performance of the individual
business segments.
Page 12
BASF 2nd Quarter 2016 Analyst Conference Call July 27, 2016
150 years
BASF Q2 2016 Analyst Conference Call, July 27, 2016 5
ChemicalsHigher volumes, but continuing margin pressure
Intermediates680(8%)
Monomers1,371(13%)
Petrochemicals1,322(20%)
€3,373(15%)
EBIT before special items million €
548633
249
465 467
0
200
400
600
800
Q2 Q3 Q4 Q1 Q2
Sales development Volumes Prices Portfolio Currencies
4% (17%) 0% (2%)
20162015
Sales Q2 2016 vs. Q2 2015million €

Page 13
BASF 2nd Quarter 2016 Analyst Conference Call July 27, 2016
Hans-Ulrich Engel
Good morning ladies and gentlemen,
Let me highlight the financial performance of each segment in
comparison to the second quarter of 2015.
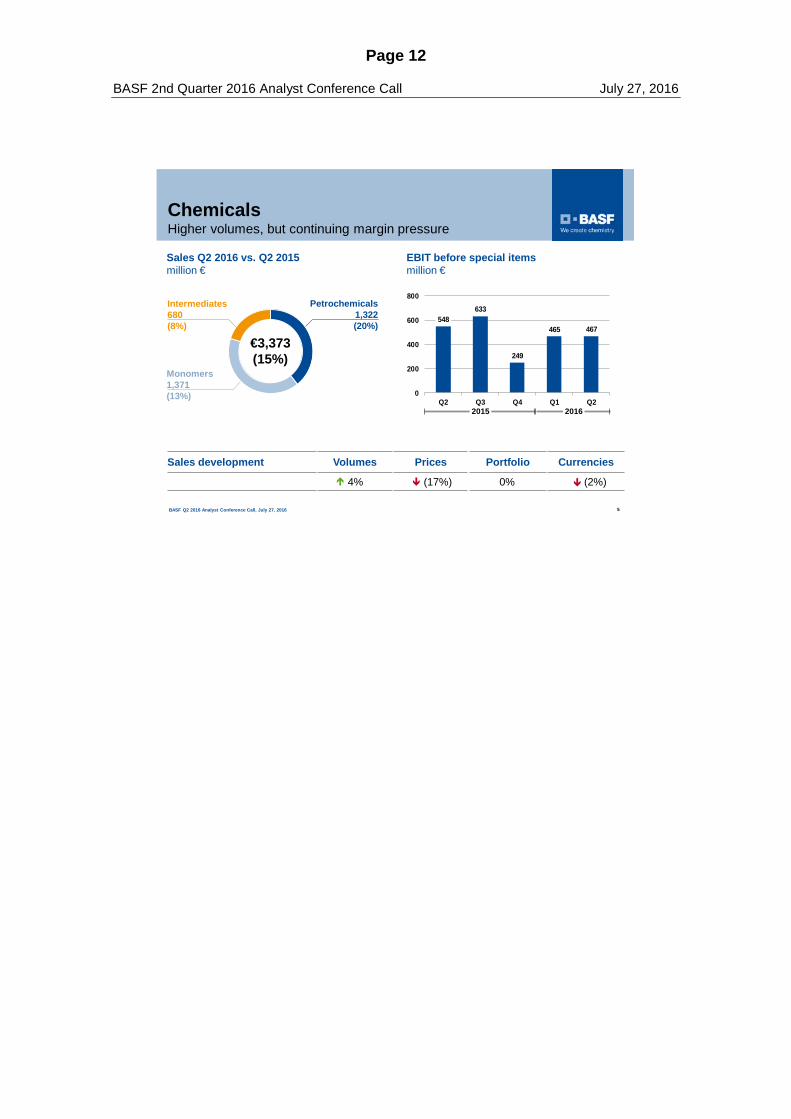
[Chart 5: Chemicals – Higher volumes, but continuing margin pressure]
Sales in the Chemicals segment declined considerably. Lower prices
in all divisions, resulting from lower raw material prices, and negative
currency effects, were the drivers for this development. In all divisions
volumes grew – supported by our new capacities. High cracker
margins in Europe and a significant improvement of the equity result
from our joint venture BASF YPC in Nanjing could not compensate
for lower cracker margins in North America and continued margin
pressure on key commodity product lines. EBIT before special items
therefore decreased considerably compared to the prior-year quarter.
Despite the costs for planned turnarounds and the startup of new
plants, fixed costs came in at the prior year level.
In the Petrochemicals division, sales decreased considerably.
Lower raw material costs, particularly for naphtha, led to reduced
sales prices in all product lines. Volumes growth was
predominantly driven by higher sales volumes from our acrylic acid
production complex in Camaçari, Brazil, as well as by the
resumption of operations at the plant in our Ellba joint operation in
Moerdijk, Netherlands. Primarily as a result of lower margins for
cracker products in North America, EBIT before special items was
considerably below the high level of the prior second quarter.
Page 14
BASF 2nd Quarter 2016 Analyst Conference Call July 27, 2016
Page 15
BASF 2nd Quarter 2016 Analyst Conference Call July 27, 2016
Increased margins in Europe and Asia, especially for cracker
products as well as alkylene oxides and glycols, were not able to
compensate for this. Fixed costs shrank slightly.
Sales in the Monomers division fell considerably year-on-year,
largely because of lower prices brought about by decreased raw
material costs. Higher sales volumes of MDI in all regions were
responsible for a boost in volumes. Reduced margins for products
from the polyamide value chain, and the scheduled turnaround of
the ammonia plant in Antwerp led to a considerable decline in EBIT
before special items. Fixed costs rose slightly through increased
expenses from the gradual startup of our new production facilities.
We also experienced a considerable sales decline in the
Intermediates division, mainly as a result of lower prices weighed
down by falling raw material costs. All product lines achieved higher
sales volumes, especially polyalcohols and amines. A favorable
product mix led to slightly higher EBIT before special items
compared with the previous second quarter. Yet ongoing market
overcapacity decreased margins for butanediol and its derivatives.
Fixed costs were brought down slightly.

Page 16
BASF 2nd Quarter 2016 Analyst Conference Call July 27, 2016
150 years
BASF Q2 2016 Analyst Conference Call, July 27, 2016 6
Performance Chemicals958(10%)
CareChemicals
1,178(3%)
€3,846(6%)Nutrition
& Health497(11%)
Dispersions& Pigments
1,213(3%)
304 319
228
547503
0
200
400
600
Q2 Q3 Q4 Q1 Q2
Sales development Volumes Prices Portfolio Currencies
2% (3%) (3%) (2%)
EBIT before special items million €
20162015
Sales Q2 2016 vs. Q2 2015million €
Performance ProductsSignificant increase in earnings driven by lower fixed costs, improved margins and higher volumes
Page 17
BASF 2nd Quarter 2016 Analyst Conference Call July 27, 2016
[Chart 6: Performance Products – Significant increase in earnings driven by lower fixed costs, improved margins and higher volumes]
Sales in Performance Products declined significantly. The slight
volume increase was more than offset by lower prices, currency
headwinds and negative portfolio effects resulting from the divestiture
of several businesses in 2015. Prices decreased due to lower raw
material costs. The competitive pressure in the hygiene business also
contributed to the lower prices. Despite this, we were able to increase
EBIT before special items by about 200 million euros or 65 percent,
supported by lower fixed costs, improved margins and higher
volumes.
In the Dispersions & Pigments division, sales were slightly below
the level of Q2 2015. This was essentially due to lower prices on
account of decreased raw material costs, coupled with negative
currency effects. Higher sales volumes of pigments, dispersions
and additives supported growth, and more than compensated for
the slight volumes decline in our businesses with resins and paper
chemicals. Improved margins overall enabled us to considerably
increase EBIT before special items.
Sales in the Care Chemicals division were slightly down compared
with Q2 2015. This was predominantly the result of price declines
brought about by lower raw material costs, although intense
competition in our hygiene business was also a factor. Negative
currency effects additionally dampened sales. Sales volumes were
particularly boosted by substantially higher volumes of ingredients
for the detergents and cleaners industry, as well as by greater
demand for oleochemical surfactants and fatty alcohols.

Page 18
BASF 2nd Quarter 2016 Analyst Conference Call July 27, 2016
Page 19
BASF 2nd Quarter 2016 Analyst Conference Call July 27, 2016
Higher volumes, stronger margins and reduced fixed costs allowed
us to considerably improve EBIT before special items.
Sales in the Nutrition & Health division saw a considerable year-
on-year decline, mainly due to the sale of parts of the
pharmaceutical ingredients and services business. A slight dip in
sales volumes was mostly attributable to lower demand in the
remaining pharmaceutical business and in the human nutrition
business, whereas volumes rose for animal nutrition. Currency
effects additionally dampened sales. We were able to raise price
levels by sharply increasing vitamin prices in the animal nutrition
business. Improved margins and substantially reduced fixed costs
– thanks especially to restructuring measures – led to a
considerable rise in EBIT before special items.
The Performance Chemicals division posted a considerable sales
decline, largely on account of the divestiture of the textile chemicals
business and the sale of the paper hydrous kaolin activities.
Decreased sales prices brought about by a sharp drop in raw
material prices, along with negative currency effects, also
dampened sales development. Volumes matched the level of the
previous second quarter. We were primarily able to increase sales
volumes in the fuel and lubricant additive business, as well as in
plastic additives, whereas demand declined in, for example, oilfield
and mining chemicals. EBIT before special items considerably
surpassed the level of Q2 2015. This was mostly due to significantly
reduced fixed costs thanks to restructuring measures and strict
fixed cost management, as well as to improved margins.
Page 20
BASF 2nd Quarter 2016 Analyst Conference Call July 27, 2016
150 years
BASF Q2 2016 Analyst Conference Call, July 27, 2016 7
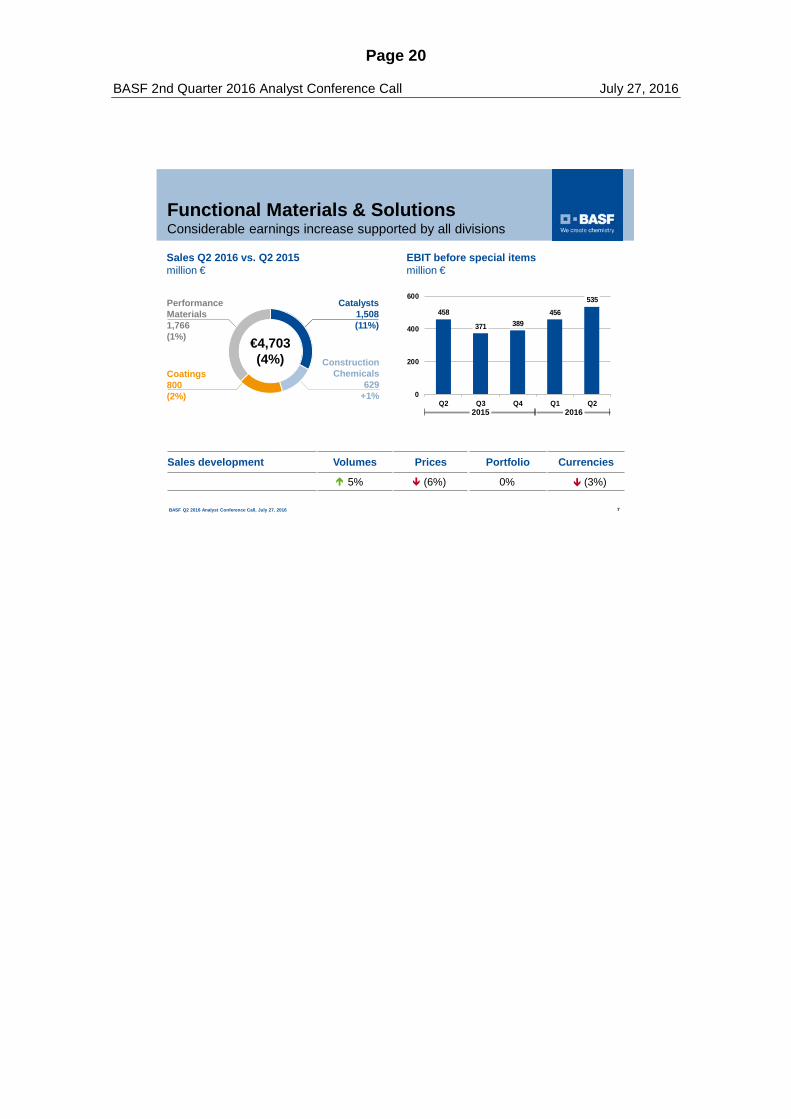
Functional Materials & SolutionsConsiderable earnings increase supported by all divisions
Catalysts1,508 (11%)
Coatings800(2%)
€4,703(4%)
Performance Materials1,766(1%)
458
371 389456
535
0
200
400
600
Q2 Q3 Q4 Q1 Q2
ConstructionChemicals
629+1%
EBIT before special items million €
Sales development Volumes Prices Portfolio Currencies
5% (6%) 0% (3%)
20162015
Sales Q2 2016 vs. Q2 2015million €

Page 21
BASF 2nd Quarter 2016 Analyst Conference Call July 27, 2016
[Chart 7: Functional Materials & Solutions – Considerable earnings increase supported by all divisions]
In the Functional Materials & Solutions segment, sales slightly
decreased. This was mainly driven by lower prices, especially in
precious metals trading, as well as negative currency effects. Sales
volumes, however, increased by 5 percent due to continued high
demand from the automotive and construction industries. EBIT before
special items rose by 17 percent. All divisions contributed to this
considerable increase, particularly Performance Materials.
Sales in the Catalysts division decreased considerably year-on-
year, primarily as a result of lower precious metal prices. Currency
effects also weighed down sales. We achieved volumes growth
overall, predominantly supported by sharply increased sales
volumes of mobile emissions catalysts. Lower precious metal
prices led to a sales decline in precious metal trading to 554 million
euros (Q2 2015: 666 million euros). The volumes growth allowed
us to considerably raise our EBIT before special items.
In the Construction Chemicals division, we posted slight sales
growth compared with the second quarter of 2015. This was largely
attributable to considerably higher sales volumes, especially in
North America. Volumes rose in Europe, as well, while they
declined slightly in Asia and the region South America, Africa,
Middle East. Currency effects had a negative impact, particularly in
Asia and in South America, Africa, Middle East. Prices fell slightly.
We were able to considerably improve EBIT before special items
as a result of increased sales volumes and positive margin
development.
Page 22
BASF 2nd Quarter 2016 Analyst Conference Call July 27, 2016
Page 23
BASF 2nd Quarter 2016 Analyst Conference Call July 27, 2016
Compared with Q2 2015, sales declined slightly in the Coatings
division. This was predominantly the result of negative currency
effects in all business areas. Volumes and prices rose slightly. We
achieved considerable volumes growth for automotive OEM
coatings in Europe and North America, as well as in the industrial
coatings business. Volumes of automotive refinish coatings slightly
exceeded the level of the previous second quarter. The difficult
environment in Brazil led to a significant decline in demand for
decorative paints. Thanks especially to increased volumes of
automotive OEM coatings, we were able to considerably raise EBIT
before special items.
The Performance Materials division’s sales were slightly below
the level of Q2 2015. This was largely due to declining sales prices
brought about by lower raw material costs as well as to negative
currency effects. We were able to improve sales volumes,
however. Our businesses with styrene foams, thermoplastic
polyurethanes, engineering plastics and Cellasto® saw especially
positive development. Demand from the automotive industry grew
significantly. Our businesses with the construction industry
remained at prior second-quarter levels, whereas sales volumes
declined in the consumer goods sector. EBIT before special items
rose considerably thanks to higher margins and lower fixed costs.
Page 24
BASF 2nd Quarter 2016 Analyst Conference Call July 27, 2016
150 years
BASF Q2 2016 Analyst Conference Call, July 27, 2016 8
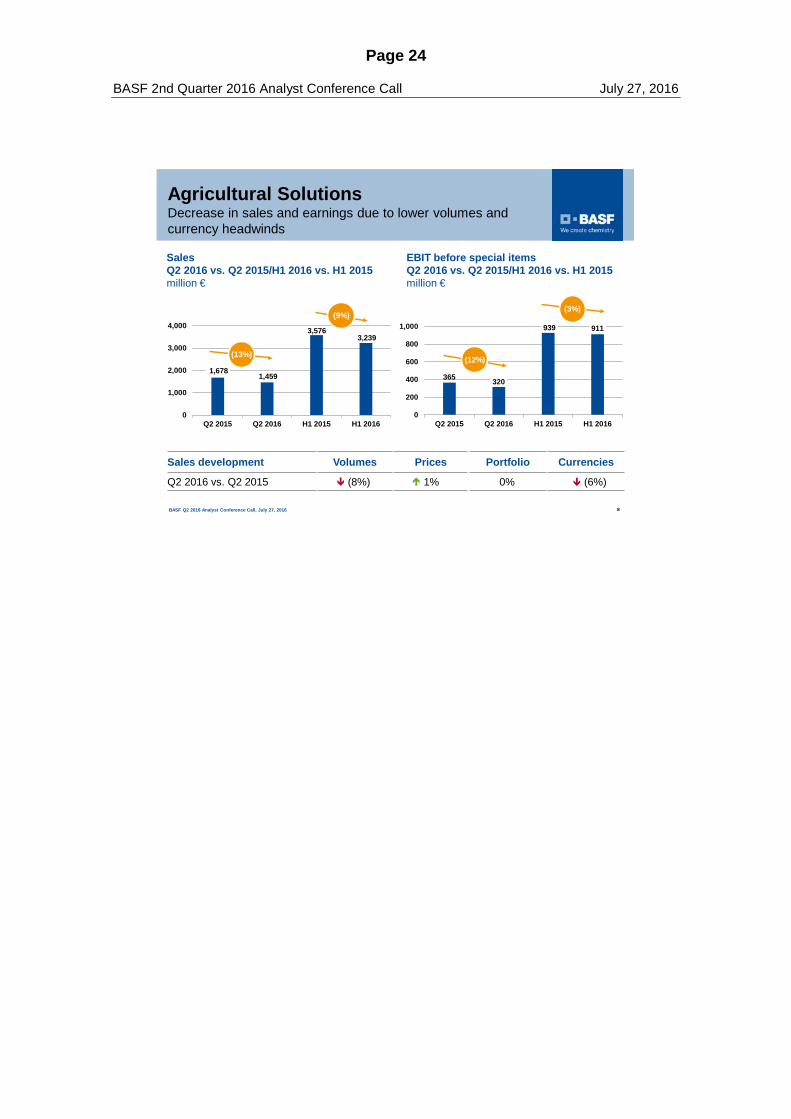
Agricultural SolutionsDecrease in sales and earnings due to lower volumes and currency headwinds
1,678 1,459
3,576 3,239
0
1,000
2,000
3,000
4,000
Q2 2015 Q2 2016 H1 2015 H1 2016
(9%)
365 320
939 911
0
200
400
600
800
1,000
Q2 2015 Q2 2016 H1 2015 H1 2016
(12%)
Sales Q2 2016 vs. Q2 2015/H1 2016 vs. H1 2015million €
EBIT before special items Q2 2016 vs. Q2 2015/H1 2016 vs. H1 2015million €
(13%)
Sales development Volumes Prices Portfolio Currencies
Q2 2016 vs. Q2 2015 (8%) 1% 0% (6%)
(3%)
Page 25
BASF 2nd Quarter 2016 Analyst Conference Call July 27, 2016
[Chart 8: Agricultural Solutions – Decrease in sales and earnings due to lower volumes and currency headwinds]
Agricultural Solutions continues to face a challenging market
environment, particularly in South America. Sales decreased
considerably due to lower volumes and negative currency effects,
while prices increased slightly. EBIT before special items declined
considerably, mainly due to lower volumes.
Sales declined considerably in Europe, mainly as a result of lower
sales volumes. This was particularly true for fungicides in Germany
and Poland, where demand was dampened by high customer
inventory levels and by the cool, wet weather in broad parts of the
region.
In North America, sales were slightly below the level of the prior
second quarter owing to negative currency effects and lower
prices. We were able to raise volumes slightly, thanks primarily to
increased demand for the fungicides Xemium® and F500® in
Canada and the United States.
Lower volumes in the insecticides and fungicides businesses were
primarily responsible for the considerable sales decline in South America. These in turn were largely attributable to high inventory
levels and the still critical situation of many customers, especially
in Brazil. We were only partly able to offset negative currency
effects with price increases.
Sales in Asia were slightly reduced by negative currency effects,
which could not be offset by considerable volumes growth,
especially of fungicides in China.

Page 26
BASF 2nd Quarter 2016 Analyst Conference Call July 27, 2016

Page 27
BASF 2nd Quarter 2016 Analyst Conference Call July 27, 2016
Looking at the first half of 2016, sales decreased by 9 percent. EBIT
before special items came in 3 percent lower than in the same period
of last year. For the remainder of 2016, we do not foresee a significant
improvement in the agricultural market.
Page 28
BASF 2nd Quarter 2016 Analyst Conference Call July 27, 2016
150 years
BASF Q2 2016 Analyst Conference Call, July 27, 2016 9
Oil & GasSignificantly lower sales and earnings
Natural Gas Trading
Exploration & Production
Net income
Sales development Volumes Prices/Currencies Portfolio
Q2 2016 vs. Q2 2015 2% (3%) (82%)
143
288
94250
1000
200
400
600
Q2 2015 Q2 2015 Q2 2016 Q2 2016
EBIT before special items, net income million €
Sales Q2 2016 vs. Q2 2015million €
431
2,964
617
704
0
1,000
2,000
3,000
4,000
5,000
Q2 Q220162015
Salesmillion €
(83%)
3,668
704
Natural Gas Trading
Exploration & Production
Page 29
BASF 2nd Quarter 2016 Analyst Conference Call July 27, 2016
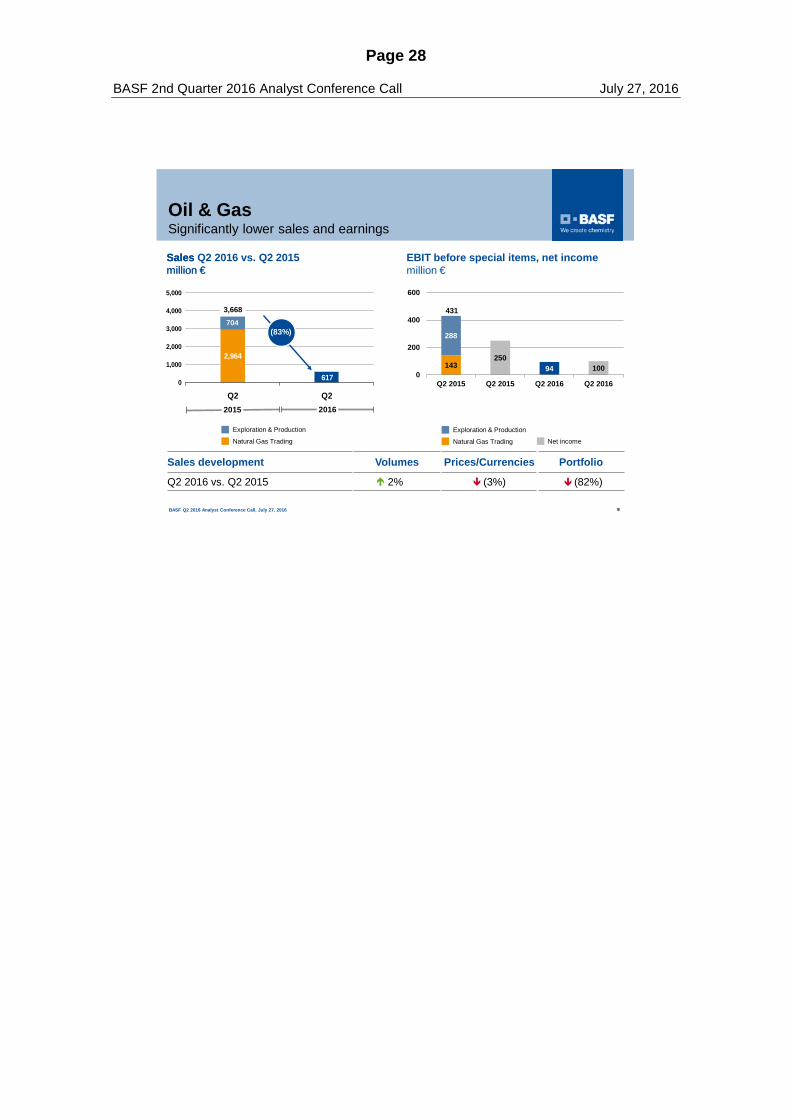
[Chart 9: Oil & Gas – Significantly lower sales and earnings]
Sales in Oil & Gas decreased significantly, mainly due to the missing
contributions from the natural gas trading and storage business
following the asset swap with Gazprom. In addition, lower oil and gas
prices contributed to the drop in sales. Higher production volumes
could not offset this price decline.
The average price of Brent crude in Q2 2016 was 46 U.S. dollars per
barrel compared with 62 U.S. dollars in the prior-year quarter. Gas
prices on the European spot markets also fell sharply compared with
the second quarter of 2015. Compared to Q1 2016 the average price
of Brent crude increased by 34 percent, while gas prices on the
European spot markets were almost stable and remained on a low
level of about 13 euros per megawatt hour.
In the continuing oil and gas business, price and currency effects
together were minus 18 percent in Q2 2016. A strong volume
increase of 9 percent driven by higher production in Norway was not
able to compensate for this.
Overall, EBIT before special items decreased from 431 million euros
to 94 million euros. Strict cost-containment measures partly
counterbalanced this decline.
Please keep in mind that throughout 2016 we will have lower earnings
from our share in the Yuzhno Russkoye natural gas field. This year,
the excess amounts received over the last years will be offset by
lower volumes, as contractually agreed with Gazprom.
Net income in Oil & Gas decreased from 250 million euros to
100 million euros.

Page 30
BASF 2nd Quarter 2016 Analyst Conference Call July 27, 2016
150 years
BASF Q2 2016 Analyst Conference Call, July 27, 2016 10
Review of “Other”
million € Q2 2016 Q2 2015
Sales 485 757
EBIT before special items (212) (63)
Thereof Corporate research costs (88) (102)
Costs of corporate headquarters (56) (64)
Foreign currency results, hedging andother measurement effects (116) 151
Other businesses 33 30
Special items 65 (20)
EBIT (147) (83)

Page 31
BASF 2nd Quarter 2016 Analyst Conference Call July 27, 2016
[Chart 10: Review of “Other”]
Sales in “Other” decreased to 485 million euros. This was largely
attributable to lower contributions from raw material trading. EBIT
before special items declined to minus 212 million euros, down from
minus 63 million euros. This was driven by a swing of over 200 million
euros related to our long-term incentive (LTI) program. While
earnings in Q2 2016 were negatively affected by an increase in
provisions, the prior-year quarter benefitted significantly from the
release of provisions for our LTI-program.
Special items in “Other” amounted to plus 65 million euros and were
mainly related to portfolio measures.

Page 32
BASF 2nd Quarter 2016 Analyst Conference Call July 27, 2016
150 years
BASF Q2 2016 Analyst Conference Call, July 27, 2016 11
Cash flow in 1st half 2016
million € H1 2016 H1 2015
Cash provided by operating activities 3,339 5,143Thereof changes in net working capital (1,045) 877
miscellaneous items (122) (32)Cash used in investing activities (1,988) (3,331)Thereof payments related to tangible/intangible assets (1,979) (2,845)
acquisitions/divestitures 51 (15)
Cash used in financing activities (1,814) (1,033)
Thereof changes in financial liabilities 944 1,723dividends (2,768) (2,803)
Page 33
BASF 2nd Quarter 2016 Analyst Conference Call July 27, 2016
[Chart 11: Cash flow in 1st half 2016]
Let me now turn to our cash flow in the first half of 2016.
Cash provided by operating activities decreased to 3.3 billion
euros. Please bear in mind our initiative to reduce net working
capital in 2015. This resulted in an extraordinarily high cash inflow
in the prior-year period. In addition, the divestiture of our natural
gas trading and storage business led to a new seasonality with
respect to our inventories and trade accounts receivable.
Cash used in investing activities declined by 1.3 billion euros to
2.0 billion euros. Payments related to tangible and intangible
assets amounted to 2.0 billion euros compared to 2.8 billion euros
in the first half of 2015. Acquisitions and divestitures resulted in a
net cash inflow of 51 million euros.
Financing activities led to a cash outflow of around 1.8 billion euros,
mainly due to the payment of the dividend.
Free cash flow amounted to 1.4 billion euros compared to 2.3 billion
euros in the first half of 2015, reflecting the new seasonality and
inventory reduction impacts that I mentioned for the first half of
2015.
Free cash flow in Q2 2016 exceeded the prior-year quarter by about
130 million euros and came in at 1.3 billion euros.

Page 34
BASF 2nd Quarter 2016 Analyst Conference Call July 27, 2016
150 years
BASF Q2 2016 Analyst Conference Call, July 27, 2016 12
Strong balance sheet
Total assets increased by €1.3 billion on higher trade accounts receivable and deferred taxes
Inventories were stable at €9.7 billion
Provisions for pension obligations increased by €3.3 billion
Net debt at €14.1 billion
Equity ratio: 40%
24.1 27.3
15.215.9
31.529.0
Dec 31,2015
June 30,2016
2.2 1.83.1 3.6
9.5 10.6
9.7 9.7
46.3 46.5
Dec 31,2015
June 30,2016
Liquid funds
Accountsreceivable
Long-termassets
Inventories
Other assets
70.8 72.2 70.8 72.2
Otherliabilities
Financialdebt
Equity
Balance sheet June 30, 2016 vs. December 31, 2015 billion €

Page 35
BASF 2nd Quarter 2016 Analyst Conference Call July 27, 2016
[Chart 12: Strong balance sheet]
Finally, let’s look at our balance sheet.
Compared to year-end 2015, total assets grew by 1.3 billion euros
to 72.2 billion euros. This was mainly due to the usual seasonal
increase in trade accounts receivable in our agricultural solutions
business and higher deferred taxes due to the increase in pension
obligations. Long-term assets were relatively stable at 46.5 billion
euros.
Total equity decreased by almost 2.6 billion euros to 29 billion
euros, driven by non-cash actuarial losses related to provisions for
pension obligations following the decline in interest rates.
As a result of the lower interest rates, provisions for pension
obligations increased by 3.3 billion euros.
Short-term liabilities increased from 14.2 billion euros to 15.6 billion
euros due to a reclassification of bonds from long to short-term and
a higher utilization of our commercial paper program.
Due to the dividend payment of around 2.7 billion euros, as well as
the seasonal pattern of our business, financial debt rose by
0.7 billion euros to 15.9 billion euros. Net debt increased by roughly
1.2 billion euros to 14.1 billion euros.
Our equity ratio remained at a healthy level and amounted to
40 percent.
And with that, back to Kurt for the outlook.

Page 36
BASF 2nd Quarter 2016 Analyst Conference Call July 27, 2016
150 years
BASF Q2 2016 Analyst Conference Call, July 27, 2016 13
Outlook 2016 for BASF Group confirmed
Outlook 2016 Sales will be considerably below prior year due to the divestiture of the natural gas trading
and storage activities and the lower oil and gas prices. We expect EBIT before special items to be slightly below the previous year level due to
significantly lower earnings in Oil & Gas.
Assumptions 2016 GDP growth: +2.3% Growth in industrial production: +2.0% Growth in chemical production (excl. pharma): +3.4% Exchange rate: $1.10 per euro Oil price (Brent): $40 per barrel

Page 37
BASF 2nd Quarter 2016 Analyst Conference Call July 27, 2016
Kurt Bock
[Chart 13: Outlook 2016 for BASF Group confirmed]
Our expectations for the global economic environment in 2016 remain
unchanged.
We are confirming our 2016 sales and earnings outlook for BASF
Group, as provided at the end of February:
Sales in 2016 will be considerably below prior year due to the
divestiture of the natural gas trading and storage activities as well
as lower oil and gas prices.
Excluding the effects of acquisitions and divestitures, we aim to
increase sales volumes, supported by our increased capacities.
We expect EBIT before special items to be slightly below the
previous year level due to significantly lower earnings in Oil & Gas.
In the current volatile and challenging macroeconomic environment,
we continue to regard our outlook for 2016 as ambitious and
particularly dependent on further oil price development.
With this in mind, we remain focused on cost-containment and
restructuring measures, which have proven effective in the first half
of 2016. Our recent portfolio measures will contribute to the mid and
long-term success of our company.
And now, we are happy to take your questions.