
SPECTRUM ANALYSIS OF THE PRODUCTION OF DATES IN...
41
SPECTRUM ANALYSIS OF THE PRODUCTION OF DATES IN THE REPUBLIC OF YEMEN by MOHAMMED AHMED SALEM BALHUWAISL Thesis submitted in fulfilment of the requirements for the degree of Master of Science February 2006
Transcript of SPECTRUM ANALYSIS OF THE PRODUCTION OF DATES IN...

SPECTRUM ANALYSIS OF THE PRODUCTION OF DATES IN THE REPUBLIC OF YEMEN
by
MOHAMMED AHMED SALEM BALHUWAISL
Thesis submitted in fulfilment of the requirements for the degree of Master of Science
February 2006

DEDICATION
Dedicated to
My parents,
My wife,
&
My daughter

ACKNOWLEDGEMENTS
First and foremost, I would like to express my sincere and heartfelt gratitude towards Allah
the Almighty for endowing me with the power, courage and determination in completing my
thesis. I wish to convey my most sincere appreciation to my supervisor, Dr. Anton
AbdulBasah Kamil, without whose guidance it wouid not have been possible for me to
complete this thesis in the present form. He has been a helpful guide, a severe critic and a
great friend. I will always be indebted to him for his patience, understanding and advice
throughout the preparation of this thesis.
I would also like to thank Hadhramout University for Science and Technology (HUST) for
granting me permission to conduct this study and for sponsoring my scholarship. I would
also like to extend my thanks to the staff members of the School of Mathematical Sciences
in Universiti Sains Malaysia for being a rich resource in giving me theoretical and practical
doses in designing and implementing this research. lowe a great deal of gratitude to the
Institute of Postgraduate Studies (IPS) as well as the University's Library.
I am extremely grateful to Mr. Hassan AL-Fadly, Mr. Abu-Baker AI-Haddad, Mr. Ahmed
Alabbsi and Mr. Saleh AI-Baloshi who helped me in the translation; Mr. Suhail Abdul
Azeez who helped me in using the Excel software. My profound thanks and appreciation to
Prof. Sameer Hajeer for his criticisms, suggestions and generous help. I am highly
indebted to Mr. Vasser AL-Gahwari for his valuable advice, suggestions and helpful review
of the thesis. I would also like to thank, in particular, Mr. Munir Bin Shamlan for his good
advice and cooperation. My sincere and heartfelt appreciation to Mr Rais Attamimi for his
constant encouragement, companionship and moral sustenance without which this thesis
would not have materialized.
III

My heartfelt appreciation also goes to all the other friends and colleagues who helped me,
in any way or form, until the research reached its conclusion. Finally and most importantly,
I would like to express my most sincere and warmest gratitude to my family and my
relatives for their prayers, assistance and encouragement throughout my study. I think
words can never adequately express how grateful I am to my parents. I can only say a
word of thanks to my father and mother for their prayers, patience and untiring support in
every way during my long absence from the family. I humbly acknowledge the patience,
perseverance and encouragement of my wife during my study. My gratitude is also
extended to both my grandmothers, brothers, sisters and uncles for their motivation and
confidence in me.
iv

DEDICATION
ACKNOWLEDGEMENTS
TABLE OF CONTENTS
LIST OF TABLES
LIST OF FIGURES
LIST OF SYMBOLS
ABSTRAK
ABSTRACT
TABLE OF CONTENTS
CHAPTER 1 - INTRODUCTION
1.1 Background
1.1.1 The History and Origin of Date Palm
1.1.2 Areas of Date Palm Cultivation
1.1.3 Date Palm Cultivation in the Republic of Yemen
1.1.3.1 Temperature
1.1.3.2 Rain
1.1.3.3 Air Humidity
1.1.3.4 Wind
1.1.3.5 Light
1.2 Statement of the Problem
1.3 Objectives
v
PAGE NUMBER
ii
iii
v
ix
xi
xii
xiv
xvi
1
1
3
4
6
6
7
8
9
9
10

•
.:'1
1.4 The Significance of the Study
1.5 Research Questions
1.6 Limitations of the Study
CHAPTER 2 - LITERATURE REVIEW
2.1 Date Palm Tree
2.1.1 Botanical Profile
2.1.2 Nutritional Value
2.1.3 Statistics
2.2 Time Series
2.2.1 An Introduction
2.2.2 Wavelets Model
2.2.2.1 Historical Perspective
2.2.2.2 Wavelets Theory
2.2.2.3 Wavelet Transform Basics
2.2.2.4 Wavelet Analysis
2.2.3 Cobb-Douglas Production Function
2.2.3.1 Cobb-Douglas Theory
2.2.3.2 Production Theory Basics
2.2.3.3 Production Factors
2.2.4 Spectrum Analysis
2.2.4.1 Stationary Time Series and Periodic Functions
2.2.4.2 Fourier Analysis Basics
2.2.4.3 Some Studies Using the Spectrum Analysis Model
vi
10
11
11
13
13
15
15
17
17
18
18
20
21
22
24
25
26
26
27
30
32
33

2.3 Multiple Regression
2.3.1 Geometrical Representation
2.3.2 Fit of the Multiple Regression Model
2.3.3 Statistical Inferences for the Model
2.4 Forecasting
2.4.1 Exponentia! Smoothing
2.4.1.1 Single Exponential Smoothing
2.4.1.2 Double Exponential Smoothing
2.4.1.3 Triple Exponential Smoothing
CHAPTER 3 - RESEARCH METHODOLOGY
3.1 Data Collection Sources
3.1.1 Hadhramout Governorate
3.1.2 AI-Hudayda Governorate (Tehamah Plain)
3.1.3 Shabwah Governorate
3.1.4 AI-Mahra Governorate
3.2 Data Collection Procedures
3.3 Methods of Analysis
3.3.1 Spectrum Analysis
3.3.2 The fourier and the Correlogram
3.3.3 Forecasting
3.3.3.1 Forecasting Formula
3.3.3.2 Bootstrapping of Forecasts
vii
39
41
42
43
44
45
45
47
47
49
50
51
51
52
53
56
56
58
70
70
71

CHAPTER 4 - RESULTS AND DISCUSSIONS
4.1 Results
4.1.1 Forecasting
4.1.1.1 Choosing the Smoothing Constant
4.2 Discussions
CHAPTER 5 - CONCLUSION AND RECOMMENDATIONS
5.1 Summary and Conclusions
5.2 Recommendations
5.3 Future Research
REFRENCES
APPENDICES
APPENDIX 1
APPENDIX 2
APPENDIX 3
viii
73
101
101
104
111
113
115
116
122
123
125

LIST OF TABLES
Table 2.1 Food value per 100 g of edible portion 15
Table 2.2 Date palm area and production in leading countries (2003) 16
Table 2.3 ANOVA Table for Multiple Regression 44
Table 3.1 Depicts date palm production in Yemen in (100) tonnes from 1985 to 2002 54
Table 3.2 Shows the values of time and climatic factors 55
Table 4.1 Depicts date palm production in Yemen in (100) tonnes 73
Table 4.2 Shows dates production in the Republic of Yemen by 100 tonnes during 1985-2002 and calculation of the correlation coefficient and means 75
Table 4.3 Shows the calculation of trend values measured by 100 tonnes 76
Table 4.4 Shows the calculation of coefficient of determination 77
Table 4.5 Shows the calculated values of angular frequencies ( Wi) 78
Table 4.6 Shows the calculation of the spectrum analysis results and the addition of the components 79
Table 4.7 Shows the calculated values of ai 80
Table 4.8 Shows the calculated values of f3i 80
Table 4.9 Shows the calculation of the values of amplitude (Ai) 80
Table 4.10 Shows the calculation of G;, phase CP;, f; and period Pi 81
Table 4.11 Shows the above results in spectrum analysis Table 82
Table 4.12 Shows the calculation of formula for each component 82
Table 4.13 Shows the calculation of the first component 83
Table 4.14 Shows the calculation of total and exponent variance after adding the first component 84
Table 4.15 Shows the calculation of the second component 86
Table 4.16 Shows the calculation of exponent variance after adding the
ix

second component 87
Table 4.17 Shows the calculation of the third component 89
Table 4.18 Shows the calculation of exponent variance after adding the third component 90
Table 4.19 Shows the descriptive statistics of values in Table 3.2 92
Table 4.20 Shows the correlations between production and climate factors 94
Table 4.21 Shows the coefficients or weights of regression 95
Table 4.22 Shows the difference between the observed and predicted scores 97
Table 4.23 Shows computation of root mean square percent error (RMSPE) 98
Table 4.24 The multiple correlation coefficient and coefficient of determination 99
Table 4.25 The ANOVA table of multiple regression 100
Table 4.26 Shows some values of smoothing constant (a) 101
Table 4.27 Shows the actual, predicted and error of predicted values for (1985-2002) 102
Table 4.28 Shows the prediction of production for next five years (2003-2007) 103
x

LIST OF FIGURES
Figure 2.1 Shows the structure of date palm tree 14
Figure 2.2 Periodic time series 28
Figure 3.1 Shows the situation and climatic zones -in Yemen 53
Figure 4.1 Shows scatter points of production by hundred of tonnes during the (1985-2002) periods 74
Figure 4.2 Depicts the trend function values 76
Figure 4.3 Shows the function after the addition of the first component 85
Figure 4.4 Depicts the fluctuation after the addition of the second component 88
Figure 4.5 Depicts the fluctuations after the addition of the third component 91
Figure 4.6 Shows the values of actual and predicted production 98
Figure 4.7 Shows the data after applying spectrum analysis and predicted data 103
XI

LIST OF SYMBOLS
Y: Values of the production of date palms.
Y: Values of production after added the components and trend function values.
c: The periodic component.
T: Values of time.
i: Number of values components.
N: Number of values of phenomenon.
L : The sum.
Jl : The mean of the production.
i} : Amplitude: the distance from the mean value of the series to the peak.
0) wave
p period : Period frequencies: the distance between each peak and other peak.
f frequency
:}: Phase: the distance between the nearest peak and the orig i n in time (y-axis).
y: The mean of the production when computing the trend function and correlation.
i : The mean of time.
Rty: The coefficient of correlation.
a: Constant of the trend function.
b: Constant of trend function which affects the dependent variable.
(j ty 2 : The total variance.
Xil

a y, 2: The exponent variance.
R2: The coefficient of determination.
xiii
ANALISIS SPEKTRUM KE AT AS PENGELUARAN TAMAR 01 REPUBLIK YAMAN
ABSTRAK
Kajian ini bertujuan menganalisis perubahan (naik-turun) dalam pengeluaran tamar di
Republik Yaman bagi jangkamasa 18 tahun, yang dikatakan berhubung-kait dengan faktor
semulajadi dan rawak. Kajian ini juga bertujuan untuk meramalkan tahap pengeluaran
tamar di Republik Yaman bagi tempoh lima tahun berikutnya (2003-2007).
Untuk menganalisis permasalahan kajian ini, kaedah analisis spektrum digunakan.
Keputusan yang diperolehi berdasarkan penggunaan kaedah ini diperlihatkan melalui
jadual, carta dan graf yang mengutarakan perubahan-perubahan yang berlaku terhadap
pengeluaran tamar dalam jangka mas a yang telah ditetapkan.
Keputusan kajian menunjukkan bahawa hubungkait di antara masa dan pengeluaran
tamar pada peringkat permulaan adalah tidak kukuh.
Perhubungan ini (masa dan pengeluaran) tidak dapat digunakan sebagai alat peramal
yang baik untuk mengesan perubahan dalam proses pengeluaran. Sebaliknya, hubungkait
antara masa dan pengeluaran tamar dapat dikenal pasti menunjukkan perubahan ketara
dengan menggunakan kaedah analisis spektrum yang melibatkan penggunaan tambahan
sembilan komponen tertentu.
Setiap komponen tersebut melibatkan aspek-aspek seperti perbezaan alam semulajadi,
aspek semulajadi dan faktor rawak yang turut mempengaruhi proses pengeluaran tamar.
XIV
Faktor-faktor terse but ialah seperti suhu, kelembapan relatif, hujan, cahaya, angin dan
lain-lain.
Perubahan ketara dalam menjelaskan hubung kait di antara masa dan tahap pengeluaran
tamar ini membenarkan data berkenaan dapat digunapakai untuk menerangkan
parhubungan antara tahap p9ngeluaran tamar dan perubahan (turun-naik) yang bermusim
dalam tempoh jangka mas a 18 tahun. Dengan aras yang sama, ia dapat digunakan untuk
meramalkan peningkatan dalam pengeluaran tamar bagi tempoh lima tahun berikutnya.
Peramalan ini adalah berdasarkan keputusan yang diperolehi daripada penggunaan
tambahan sembilan komponen tersebut dalam kaedah yang digunakan.
xv

SPECTRUM ANALYSIS OF THE PRODUCTION OF DATES IN THE REPUBLIC OF YEMEN
ABSTRACT
This study attempts to analyse the fluctuations in .the production of date palm in the
Republic of Yemen within a period of eighteen years. These fluctuations are due to natural
and random factors. The study also aims to predict the production in the next five years
(2003-2007).
The spectrum analysis model was employed to analyse this problem. The results obtained
by using this model are presented in tables, charts, and graphs which highlight the
changes in date palm production over that period of time.
The results of the study indicate that the coefficient of determination between time and
date palm production was initially weak. This relation cannot be utilised as a good
predictor for the changes in production. On the contrary, the coefficient of determination
between time and date palm production improved gradually using the spectrum analysis
model which involves the addition of three components. Each component included specific
parts of different natural and random factors which influence the date palm production.
These factors are temperature, relative humidity, rain, light. wind and so forth.
The strong improvement in the coefficient of determination between time and production
allows the data to be used to explain the relationship between production of date palms
and seasonal fluctuations within a period of eighteen years (1985-2002). Similarly, it was
predicted that the production will improve in the next five years (2003-2007). This
xvi

prediction was based on the results obtained from the addition of the third component in
the spectrum analysis model.
XVlI

CHAPTER 1
INTRODUCTION
This chapter begins with the background of the study which includes the historical
perspective of date palm trees. This is followed by an overview of date palm cUltivation
areas in the world and geographical and agro-climatic aspects of the Republic of Yemen.
The chapter concludes with a discussion on the statement of the problem, objectives of the
study, significance of the study, research questions, and limitations of the study.
1.1 Background
The background of the study presents the history and origin of date palm tree. It
progresses to provide an overview of areas of date palm tree cultivation in the world. It
concludes by giving a sketch of the geographical and agro-climatic aspects with reference
to date palm cultivation in the Republic of Yemen.
1.1.1 The History and Origin of Date Palm
It is still unknown from which plant species the date palm originates from. It may
have come from a mutation among the palm of the cockscomb which inhabits vast areas
ranging from West India to the Canary Islands (AI-Baker, 1972 and Jelan, 2003). However,
another opinion points out that the palm is a type of wild plant and the production of the
date palm is the result of a succession of natural hybridization between these different
types. In addition, man played a role in the existence of palms by the continuous selection
and artificial hybridization of the best types of trees. Nevertheless, these assumptions are
yet unconfirmed as a palm tree has yet to be found in the wild. Moreover, there are a lot of
similarities between some types of palms (AI-Baker, 1972 and Jelan, 2003). The exact
origin of the date palm (Phoenix Oactylifera) is considered to be lost in antiquity. However,
it is certain that the date palm was cultivated as early as 4000 B.C. since it was used for
the construction of the temple of the moon god near Ur in Southern Iraq - Mesopotamia
(Zaid and Jimellez, 2002). Ai-Baker (1972) and Abr2heem (1998c), considered the
leading expert in studying the palm family, mentions that the original habitat of the palm
was the Arab Gulf. Decandole (in AI-Baker, 1972), said that palm originated in the
prehistoric era in the temperate and tropical region that extends from Senegal to Andalusia
(Spain), which is located between latitudes 12°N to 30oN, therefore, investigation of the
origin and habitat of palm should be carried out in the region which Decandole referred to
as the most intensively cultivated date palm area.
The date palm tree, Genus Phoenix, which is from the palmaceae family, is one of the
most important fruit trees in the Republic of Yemen. Its history in Yemen can be traced
back to about 7000 years ago (Aljuraidi, 2002).
Finally and from a spiritual perspective, the religion that has stressed the holiness of the
date and date palm is Islam. The Holy Quran mentioned the date and date palm in 17
Suras (chapters), of the original 114 Suras and 20 verses of 6,263 verses (Zaid and
Jimenez, 2002, Bin-Break, 2002, Abraheem, 1998a, AI-hilali, 1417A.H and AI-Hadrami,
1992).
2

(Bakhwar, 1998b, Abraheem, 1998b, Falhoom, 2002 and AI-Baker, 1972) Prophet
Muhammed (P.B.U.H) is reported to have said that the best property is the date palm. He
also stated that dates are a palliative for many disorders, and he enjoined Muslims to eat
the date and tend it with care.
1.1.2 Areas of Date Palm Cultivation
The date palm is one of the oldest and most well-known agricultural products in
the world. It has great social and economic value. Moreover, it is an essential source of
required nutrients that provides human beings with the energy for physical activities. It is
worth mentioning that accurate statistics on the number of date palms are not always
available and not easy to compile. However, the total number of date palms in the world is
approximately 100 million, distributed in 30 countries, and producing between 2.5 and 4
million tonnes of fruit per year (Zaid and Jimenez, 2002 and Medhej, 1998).
Asia occupies the first position in global date palms distribution, with 60 million date palms
(Saudi Arabia, Bahrain, UAE, Iran, Iraq, Kuwait, Oman, Pakistan, Turkmenistan and
Yemen, etc.); while Africa is in the second position with 32.5 million date palms (Algeria,
Egypt, Libya, Mali, Morocco, Mauritania, Niger, Somalia, Sudan, Chad and Tunisia, etc.).
In terms of countries, Iraq leads with 22 million palms, followed by Iran, 21 million and
Saudi Arabia, 12 million, Algeria, 9 million, Egypt and Libya, 7 million each, Yemen, 5
million, Pakistan and Morocco, 4 million each. The remaining date growing countries have
less than 1 million palms each (Zaid and Jimenez, 2002 and Falhoom, 2002). Mexico and
the USA have 600,000 palms followed by Europe (Spain) with 32,000 and Australia with
30,000 (Zaid and Jimenez, 2002).
3

However, date growing countries located in the southern area of the Mediterranean Sea
have approximately 35 million palms (35% of the world's total). The total acreage of date
palm cultivation in the world has increased more than threefold (from 238,522 ha in 1961
to 770,795 ha in 1996) during a 35 year period which amounts to an average annual
increase of about 8.6% in date palm acreage. In 1996, the top 11 producing countries with
regard to harvested areas were: Iran (153,000 ha), Iraq (116,000 ha), Saudi Arabia
(95,000 ha), Algeria (87,000 ha), Pakistan (73,915 ha}, Morocco (44,400 ha), United Arab.
Emirates (31,005 ha), Tunisia (29,480 ha), Oman (28,000 ha), Egypt (26,000 ha) and
Yemen (15945 ha). The total cultivated acreage of these 11 ·countries comprises
approximately 88% of the world's total cultivated area (Zaid and Jimenez, 2002 and
8aghizal, 2002).
Regarding planting density, there is again a controversy about the prevailing cultivation
systems. There are modern plantations with fixed spacing as in the case of Tunisia or the
forest-type traditional planting system as in the case of Morocco, Pakistan, Somalia, for
example. In each case, the planting density varies tremendously from 50 palms/ha
(Morocco and Bahrain) to 577 palms/ha (Somalia). Between these two extremes, there are
Yemen, Algeria, Libya and Tunisia with density values of 400,200,254 and 133 palms/ha,
respectively (Zaid and Jimenez, 2002 and 8aghizal, 2002).
1.1.3 Date Palm Cultivation in the Republic of Yemen
The Republic of Yemen is located in the southwest corner of the Arabian Peninsula
covering a land area of 537,000 km2• According to the 1994 census, the total population of
the country is estimated at 15.8 million, with an annual growth rate of 3.7% and a
4
population density of 28fkm2• The five main Agro-ecological zones reflect variations of the
elevation from sea level to about 3,700 m and give rise to five Agro-ecological regions:
The Coastal Low Lands, the Southern Uplands, the Central Highlands, the Northern
Highlands and the Eastern Region (EI-Hassan, 2000).
The Agro-climatic conciitions in Yemen are classified as semi-arid, arid, and extremely
arid. The aridity depends on the tcpographical features. More rain and luxuriant vegetation
with rich bio-diversity are related to altitude, aspect, edifice and biotic factors (Munibari et
a/., 1998). Agriculture is still largely subsistence oriented and heavily dependent on
climatic conditions. Effects of climate and other environmental factors resulted in diversity
and heterogeneity of the vegetative cover structure and its density. This led to diversity in
natural vegetation. This diversity can be classified according to topography into five zones:
coastal areas, southern uplands, northern highlands, central uplands and Hadhramout
plateau rangelands (EI-Gouri eta/., 1996 and Khanbarei, 2002). There is a great variation
in the annual rainfall; the coastal area receives 50-100 mm of rainfall. In comparison, the
highlands receive more rainfall of between 400-1000 mm. Despite the shortage of rainfall,
the coastal area contributes approximately 39% to the total agricultural production of the
country. It has been reported that rain dependant agriculture has decreased by 40%.
Consequently, up to 30,000 wells have been bored in Yemen and most of these wells are
used for irrigation (Munibari et al., 1998).
The climate in Yemen, especially in the date palm cultivation areas, is characterized as
tropical with two distinctive seasons; a hot season from April to September with a
maximum temperature of 39.8°C and a cold season from October to March with a
minimum temperature of 14.9°C (Medhej, 2002).
5
More importantly, there are different climatic factors that influence date growth and
production in Yemen. These factors are temperature, rain, air humidity, wind and light. The
following sections explain the effect of each of these factors on date production.
1.1.3.1 Temperature
Temperature is considered the first climatic factor which affects ihe growth of
dates. The date growing areas are located in the regions with the highest maximum
temperatures and low humidity.
The mean annual temperature ranges from less than 12°C in the highlands to above 300e
in the coastal areas. In summer, the temperature may rise up to 400e in the low lands and
above 40°C in the deserts of the eastern region. In winter, the temperature may decrease
below zero °c in the highlands, ranging from 300e in arid zones of the eastern region to
above 45°e in coastal areas. Generally, temperatures decline in winter between January
and April (EI-Gouri et al., 1996). The daily evaporation and relative humidity are related to
the temperature and atmospheric pressure of the day and the monsoon season (AI
Gahwari, 2003).
1.1.3.2 Rain
Rain has an effect on pollination and fruiting. After pollination, rain is considered as
a cleansing agent that washes away most of the applied pollen. Another negative effect of
rain on fruiting, results from low temperatures that accompany or follow rain. A third factor
6

r.
is the reduction of the flower's receptivity when in contact with water (laid and Jimenez,
2002).
Date growers must assume that the rain will affect pollination/fruiting and any pollination
process must be repeated within 4 to 6 hours if preceded or followed by rain. Rain is also
responsible for increasing relative air humidity, thus creating favourable conditions for
cryptogrammic diseases that result in the rotting of inflorescences (laid and Jimenez,
2002).
In Yemen, in areas of date palm cultivation, rainfall and evaporation in spring and autumn,
on an average, do not exceed 76 mm. In fact, rainfall may exceed 100 mm between once
to 16 times annually (Falhoom, 2002, Mahdar, 1998, Khanbarei, 2002 and Rweeshed and
Raweeshed, 1998).
1.1.3.3 Air Humidity
Air humidity is considered as the third climatic factor where various advantages
and/or disadvantages are found. The date palm ecosystem is mostly of an arid nature
where relative humidity has a large influence (laid and Jimenez, 2002). Relative humidity
also affects date quality during the maturation process. At high humidity, fruits become soft
and sticky, while at low humidity they become very dry. This phenomenon is further
strengthened when low humidity is coupled with wet and dry winds. The relative air
humidity in Yemen is about 46% and the number of the daily sunny hours is 9.5 per day
(Medhej. 2002).
7
(.
1.1.3.4 Wind
Another influential factor is the wind which carries dust and sand that adheres to the
date fruits in their soft stage (Rutab and Tamar). In most date growing areas, the latter part
of the pollination season is usually characterized by severe hot and dry winds, which dry
out the stigmas of the female flowers. Cold winds disturb the pollen germination. The
falling down of an old date palm may be caused by strong winds but only in the following
cases (Zaid and Jimenez, 2002):
• if the palm is very tall with a large crown and grows in shallow soil;
• if a large number of offshoots are removed from the trunk of a palm at one time
leaving the palm without basal support; and
• if rats have gnawed away the roots on one side of the palm.
In Yemen, the strength of the wind may cause the dates to fall, break some date bunches,
and perhaps cause the fall of weak trees under certain circumstances. On the one hand,
wind also help in spreading some diseases such as O/igonychus Afrasiaficus
(Abdahoseen, 1985, 8aangood and 8ashieh, 1998 and Obad et a/., 2003). However, it
may help in the pollination, carrying the seeds between flowers; probably from one date
palm to another. It is preferable that tall trees be planted in the cultivated areas to serve as
wind breakers as strong wind are liable to damage date palm.
8

1.1.3.5 Light
The growth of the date palm is inhibited by light rays at the violet and yellow end of
the spectrum, but enhanced by rays at the other end of the spectrum i.e. red light. These
latter rays are most active in promoting photosynthesis.
Clouds could reduce light intensity, but unfortunately, the sky is un-clouded in the date
growing countries during the ripening period (July to October in the Northern Hemisphere
and February to May in the Southern Hemisphere) (laid and Jimenez, 2002).
1.2 Statement of the Problem
As mentioned in Section 1.1.3, several climatic factors and constraints might affect the
future of Yemen date palm industry, including:
• The increase in the average rainfall
• The strength of air humidity
• The percentage of temperature
• Wind
• The intensity of light
Such climatic factors and changes affect the production of dates negatively which led to
frequent production fluctuations. These date production fluctuatkms, in turn, affect the
national and personal incomes of the Yemeni farmers. Therefore, it is necessary to study
these fluctuations with an appropriate model to solve this problem. To this end, spectrum
analysis by Fourier time series was utilized because it is regarded to be the best model in
9

analyzing fluctuation phenomena which help in improving the level of production (Hujeir,
1997 and Bolch and Huang, 1974). This model will be discussed in more detail in Chapter
Two.
1.3 Objectives
The main objective of this study is to look at the possibility of using the spectrum analysis
model to analyse the production of date palms in the Republic of Yemen. Under the
climatic conditions specifically, the study aims:
• To investigate the fluctuations in date production.
• To identify the causes for these fluctuations.
• To forecast the dates production in Yemen for several years.
1.4 The Significance of the Study
As mentioned in Section 1.1.3, date palm cultivation in Yemen has a long history. Yet, the
efforts exerted by the Yemeni researchers on date palm production although significant,
are still insufficient and fall below expectations. In general, the product quantity is still low,
the field and post-harvest losses are high and the date products and by products utilization
need improvement. Therefore, the current status of date palm cultivation in Yemen and the
enhancement of production can be overemphasized.
To address the above mentioned constraints, Yemen ranked date palm as one of high
research priority as reflected in the priority setting for agricultural research in Central and
West Asia and North Africa. Therefore, the study on fluctuations in the production of dates,
in Yemen, is still very minimal and there is no statistical study that has been done yet in
10
this domain. This study is significant since it is the first study that addresses these issues.
Research literature in this area is minimal. Moreover, there are not many studies being
carried out, using the adopted model in this study- Spectrum Analysis Model. Therefore, it
is necessary that more studies are conducted in this area.
1.5 Research Questions
The main questions of this study are:
• What were the fluctuations in date production in Yemen?
• Why did these fluctuations occur?
• How will production during the coming five years become?
1.6 Limitations of the Study
This study focused on fluctuations of date palm production within a specific period of time
(1985-2002). Here, it is worth mentioning that the first year of the study (1985) was chosen
on the basis that it was the year for which full data records were found on date production
in the Republic of Yemen compared to its preceding years.
The study was restricted only to date production and it did not deal with climate and
workers data where the adopted model studies the fluctuations of date palm production
within the aforementioned period of time. This model investigates the effect of natural and
random factors on the production. The effect was identified through the increase in the
value of the coefficient of determination between production and time after adding the
spectrum analysis components. In other words, if the coefficient of determination
11
improves, this indicates that the production is affected by the natural and random factors
and vice versa.
In this study, the single exponential smoothing method was used to predict the production
of date palm from the year 2003 to 2007. The reason for adopting this method was that the
available data was limited. For further information see Section 3.2, Chapter 3.
12

CHAPTER 2
LITERATURE REVIEW
This chapter begins with a brief overview of the date palm tree. This is followed
by a discussion on some models of time series, i.e. the Wavelets model, the Cobb
Douglas production function model and the spectrum analysis model. This is followed
by a summary of some studies using the spectrum analysis mode!. Then, the chapter
presents with an emphasis on the spectrum analysis model and justifies the adoption of
such a model as a theoretical basis for the present study. Then, the chapter presents a
multiple regression model. The chapter concludes with a discussion on the single
exponential method which was employed in forecasting date palm production in
Yemen.
2.1 Date Palm Tree
In the Arabian Peninsula (AP) in which Yemen is situated, date palm varieties
had evolved over a long period, to adapt with environmental conditions. It is the most
tolerant tree to the harsh environments of the AP. The next sections describe the
botanical structure of the tree, culture and propagation of date palm, nutritional value of
dates, statistics of date palm tree, and climatic requirements of date palm.
2.1.1 Botanical Profile
Date Palm belongs to the species Phoenix Oacti/yfera and has about 19 known
genetic relatives. The most important ones are Canary Island Palm (P. canariensis);
Senegal Date Palm (P. reclinata) and Indian Sugar Date Palm (P. sylvestris). The
genus Phoenix belongs to the plant family Arecaceae and all are Monocotyledons
(William et a/., 200S). Date palms are dioecious; i.e. the male and female parts are on
13
t",
, ,,.
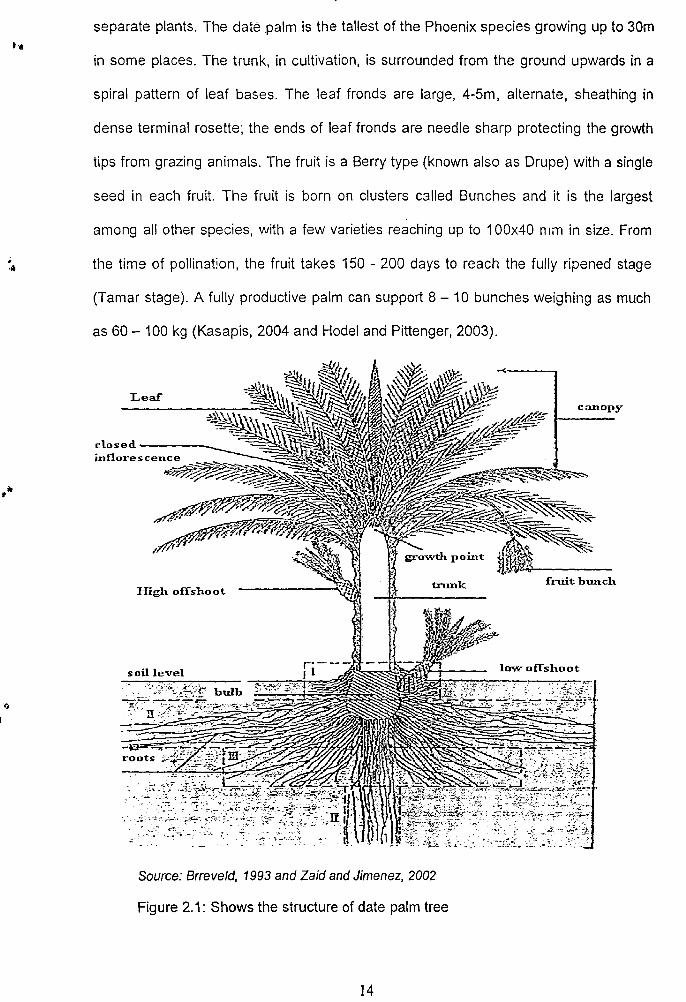
separate plants. The date palm is the tallest of the Phoenix species growing up to 30m
in some places. The trunk, in cultivation, is surrounded from the ground upwards in a
spiral pattern of leaf bases. The leaf fronds are large, 4-5m, alternate, sheathing in
dense terminal rosette; the ends of leaf fronds are needle sharp protecting the growth
tips from grazing animals. The fruit is a Berry type (known also as Drupe) with a single
seed in each fruit. The fruit is born on clusters called Bunches and it is the largest
among all other species, with a few varieties reaching up to 100x40 mm in size. From
the time of pollination, the fruit takes 150 - 200 days to reach the fully ripened stage
(Tamar stage). A fully productive palm can support 8 - 10 bunches weighing as much
as 60 - 100 kg (Kasapis, 2004 and Hodel and Pittenger, 2003).
Leaf canopy
closed ---_~
fruit bunch JIigh offshoot
- ..... :, • .0::" \_-,.'y, v
~:> •
Source: Brreveld, 1993 and Zaid and Jimenez, 2002
Figure 2.1: Shows the structure of date palm tree
14

2.1.2 Nutritional Value
Dates are rich in sugar ranging from 65% to 80% on dry weight basis mostly of
inverted form (glucose and fructose). Fresh varieties have a higher content of inverted
sugars; the semi dried varieties contain equal amounts of inverted sugars and sucrose,
while the dried varieties contain higher amounts of sucrose. Water content is between
7% (dried) and 79% (fresh) depending on the variety (William et al., 2005 and Kasapis,
2004).
Table 2.1: Food value per 100 g of edible portion
Fresh Dried Fresh Dried
Calories 142 274 -293 Phosphorus 350m9 63-105 mg
Moisture 31.9-78.59 7.0-26.1 Iron 6.0mg 3.0-13.7 mg
Protein 0.9-2.69 1.7-3.9g Potassium - 648mg
Fat 0.6-1.5g 0.1-1.29 Vitamin A(B 110-175 15.60 mg carotene) mcg
Carbohydrates 36.6 9 72.9 -77.6 9 Thiamine - 0.03 - 0.09 mg
Fiber 2.6-4.5 9 2.0 - 8.59 Ribof!avin - O.10-0.16mg
Ash 0.5-2.8 9 0.5 - 2.7 9 Niacin 4.4-6.9 mg 1.4 - 2.2 mg
Calcium 34mg 59 -103 mg Tryptophan - 10 -17 mg Source: FAO, 2004
2.1.3 Statistics
Date fruit is produced in hot arid regions of the world and is marketed all over
the world as a high value confectionery. It is considered an important sUbsistence crop
in most of the desert areas.
Worldwide date production has increased exponentially over the last three decades. In
1963, production was 1.8 million tonnes which increased to 2.6 and 6.7 millions by
1983 and 2003, respectively. The increase of 4.9 million tonnes since 1963 represents
an annual expansion of about 6.8%.
15

The top five producing countries in 2001 were Egypt, Iran, Saudi Arabia, Pakistan and
Iraq (FAO statistics 2002). This represents 69% of total world production. If the next six
most important countries are included, i.e. Algeria, United Arab Emirates, Sudan,
Yemen, Oman, and Morocco, then this percentage rises to 90%. This clearly indicates
that most of the world's date production is concentrated in a few countries in the same
region.
Most of the major date producing ccuntries had steadily expanded production over the
last 10 years, repr€ser.ting an increment of 43% over the period 1994 to 2001. Date
exports increased by only 25%, over the same period, especially in Oman, United Arab
Emirates, Egypt and Pakistan. Conversely, an output decrease has been observed in
Iraq and Morocco. In the Arab world, total date production is estimated to be 4,511,494
tonnes in 2003 (total production for Iraq is estimated at 400,000 tonnes, (FAO, 1997)
representing 67% of the global date production.
Some countries produced 1.9 million tonnes in 2003, which represent 28% of the
global production (FAO, 2004). Saudi Arabia and Emirates together produced 1.6
million tonnes in 2003.
Table 2.2: Date palm area and production in leading countries (2003)
Countries Production
% Countries Production % (Mt) (Mt)
World 6,749,356 100.0 Yemen 32,500 0.5
Egypt 1,115,000 16.5 Mauritania 24,000 0.4
Iran 875,000 13.0 Chad 18,000 0.3
Saudi Arabia 830,000 12.3 USA 17,600 0.3
UAE 760,000 11.3 Bahrain 16,508 0.2
Pakistan 650,000 9.6 Qatar 16,500 0.2
Algeria 420,000 6.2 Kuwait 10,400 0.2
Iraq* 400,000 5.9 Turkey 9,400 0.1
Sudan 330,000 4.9 Niger 7,700 0.1
Oman 238,611 3.5 Palestine, 5,500 0.1
Libyan 140,000 2.1 Spain 3,732 0.1
China 120,000 1.8 Mexico 3,600 0.1
Tunisia 115,000 1.7
Morocco 54,000 0.8 Others 536,305 7.9 ..
Source: FAO statIstIcs, 2003
16

2.2 Time Series Analysi~ 2.2.1 An Introduction
Time series analysis and its applications have become increasingly important in
various fields of research, such as business, economics, engineering, medicine,
environometrics, social sciences, politics, and others. Olson (2000) mentions that since
Box and Jenkins (1970, 1976) published the seminal book Time Senes Analysis:
Forecasting and Control, a number of books and a vast number of research papers
have been published in this area.
A time series is a collection of observations of well-defined data items obtained
through repeated measurements over time. An observed time series can be
decomposed into three components: the trend (long term direction), the seasonal
(systematic, calendar related movements) and the irregular (unsystematic, short term
fluctuations) (Liang, 2002).There are several techniques that are useful for analyzing
time series data. These techniques include sequences of measurements that follow
non-random orders. Unlike the analyses of random samples, according to Hujeir
(2001), the analysis of time series is based on the assumption that successive values
in the data file represent consecutive measurements taken at equally spaced time
intervals.
Time series analysis has two main goals: (a) identifying the nature of the
phenomenon represented by the sequence of observations, and (b) forecasting
(predicting future values of the time series variable) (Bolch and Huang, 1974). Both of
these goals require that the pattern of observed time series data is identified and more
or less formally described. Once the pattern is established, it can be interpreted and
. integrated with other data (Le., use it in our theory of the investigated phenomenon,
e.g., date palm fluctuations). Regardless of the depth of our understanding and the
validity of our interpretation (theory) of the phenomenon, the identified pattern can be
17
extrapolated to predict future events (Hameza, 1994 and AI-Jaacny et al. 1998). Most
importantly, there are different models used for the study of time series. In this study,
some of these models will be focused on, e.g. the wavelets model, the Cobb-Douglas
model, and the spectrum analysis model.
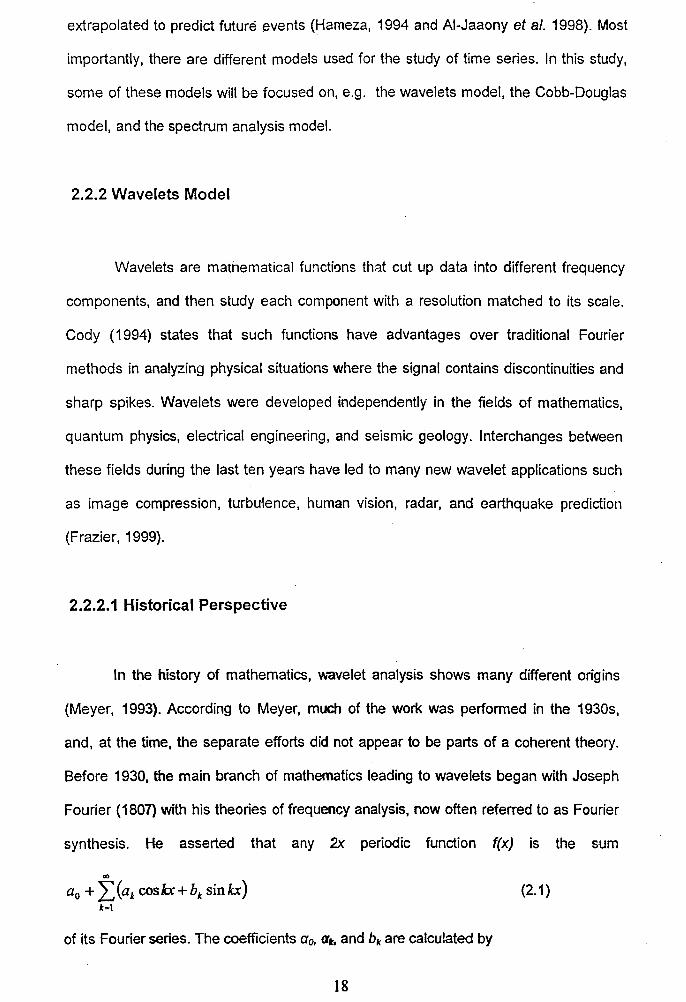
2.2.2 Wavelets Model
Wavelets are mathematical functions that cut up data into different frequency
components, and then study each component with a resolution matched to its scale.
Cody (1994) states that such functions have advantages over traditional Fourier
methods in analyzing physical situations where the signal contains discontinuities and
sharp spikes. Wavelets were developed independently in the fields of mathematics,
quantum physics, electrical engineering, and seismic geology. Interchanges between
these fields during the last ten years have led to many new wavelet applications such
as image compression, turbulence, human vision, radar, and earthquake prediction
(Frazier, 1999).
2.2.2.1 Historical Perspective
In the history of mathematics, wavelet analysis shows many different origins
(Meyer, 1993). According to Meyer, much of the work was performed in the 1930s,
and, at the time, the separate efforts did not appear to be parts of a coherent theory.
Before 1930, the main branch of mathematics leading to wavelets began with Joseph
Fourier (1807) with his theories of frequency analysis, now often referred to as Fourier
synthesis. He asserted that any 2x periodic function ((x) is the sum
GO
ao + :L(ak cosh + hk sinh) k=1
of its fourier series. The coefficients ao, at. and bk are calculated by
18
(2.1)

1 2/r 1 2/r- . 1 21T
ao = - ff(x)dx, ak = - ff(x)cos(kx)dx, bk = - ff(x)sin(kx)dx (2.2) 27r 0 7r 0 7r 0
Fourier's assertion played an essential role in the evolution of the ideas
mathematicians had about the functions. He opened up the door to a new functional
universe. After 1807, by exploring the meaning of functions, Fourier series
convergence, and orthogonal systems, mathematicians gradually were led from their
previous notion of frequency analysis to the notion of scale analysis. It turns out that
this sort of scale analysis is less sensitive to noise because it measures the average
fluctuations of the signal at different scales (Meyer, 1990 and Candes, 1998).
The first mention of wavelets appeared in an appendix to the thesis of A. Haar
(1909). One property of the Haar wavelet is that it has compact support, which means
that it vanishes outside of a finite interval. Unfortunately, Haar wavelets are not
continuously differentiable which somewhat limits their applications. In the 1930s,
several groups working independently researched the representation of functions using
scale-varying basis functions. Understanding the concepts of basis functions and
scale-varying basis functions is the key to understanding wavelets. By using a scale-
varying basis function called the Haar basis function, Paul Levy, a 1930s physicist,
investigated the Brownian motion, a type of random signal (Meyer, 1993 and
Wickerhauser, 1994). They found the Haar basis function superior to the Fourier basis
functions for studying small complicated details in the Brownian motion. Another 1930s
research effort by Littlewood, Paley, and Stein involved computing the energy of a
function ((x):
1 2r
energy = - flf(x)12 dx
2 0
(2.3)
The computation produced different results if the energy was concentrated around a
few pOints or distributed over a larger interval. This result disturbed the .scientists
19
because it indicated that energy might not be conserved. The researchers discovered a
function that can vary in scale and can conserve energy when computing the functional
energy. Their work provided David Marr with an effective algorithm for numerical image
processing using wavelets in the early 1980s.
Between 1960 and 1980, mathematicians Guido Weiss and Ronald R. Coifman
studied the simplest elements of a function space, called atoms, with the goal of finding
the atoms for a common function and finding the "assembly rules" that allow the
reconstruction of all the elements of the function space using these atoms. In 1980,
Grossman and Morlet, a physicist and an engineer, broadly defined wavelets in the
context of quantum physics. These two researchers provided a way of thinking for
wavelets based on physical intuition (Donoho and Duncan, 2000).
In 1989, Stephane Mallat gave wavelets an additional jump-start through his
work in digital Signal processing. He discovered some relationships between
quadrature mirror filters, pyramid algorithms, and orthonormal wavelet bases (more on
these later). Inspired in part by these results, Meyer (1993) constructed the first non
trivial wavelets. Unlike the Haar wavelets, the Meyer wavelets are continuously
differentiable; however they do not have compact support. A couple of years later,
Ingrid Daubechies used Mallat's work to construct a set of wavelet orthonormal basis
functions that are perhaps the most elegant, and have become the cornerstone of
wavelet applications today.
2.2.2.2 Wavelets Theory
The Wavelet theory is also a form of mathematical transformation, similar to the
Fourier Transform (FT) in that it takes a signal in time domain, and represents it in
frequency domain. Wavelet functions can be distinguished from other transformations
20

in that they not only dissect signals into their component frequencies, but also vary the
scale at which the component frequencies are analyzed. Therefore wavelets, as
component pieces used to analyze a signal, are limited in space. In other words, they
have definite stopping points along the axis of a graph--they do not repeat to infinity like
a sine or cosine wave does (Wickerhauser, 1994). As a result, working with wavelets
produces functions and operators that are Isp3rse" (small), which makes wavelets
excellently suited for applications such as data compression and noise reduction in
signals. The ability to vary the scale of the function as it addresses different
frequencies also makes wavelets better suited to signals with spikes or discontinuities
than traditional transformations such as the FT.
2.2.2.3 Wavelet Transform Basics
Basically, the wavelet transform (WT), according to Mallat, (1999), Truchetet
(1998), Vetterli and Kovacevic, (1995), Unser and Blu (2003), WT is a means of
obtaining a representation of both time and frequency content of a signal. But in WT,
the window function width is dependent on the central frequency. Therefore, for a given
analysis function, the best trade-off between time and frequency resolution can be
automatically obtained. A wavelet is a kernel function used in an integral transform.
The wavelet transform (WT) of a continuous signal x (t) is given by:
Wa,b (x) = C x(t)'f/* a,b (t)dt (2.4)
with the wavelet function defined by dilating and translating a "mother" function as:
1 t-b If a b (t) = rlf(-) , va a
(2.5)
If(t) being the "mother" wavelet, a is the dilation factor and b is the translation
parameter (both being real positive numbers). For practical reasons, these parameters
are often discretized leading to the so-call discrete wavelet transform (DWT). After
discretization the wavelet function is defined as:
21
(2.6)
The DWT is given by the inner product between signal and wavelet; the result being a
series of coefficients:
(2.7)
j and k being integer scale and translation factors. Daubechies (1992) and, in another
manner, Sweldens (1995), gave way to fast algorithm implementation of DWT (the only
one to be in use for computer imaging applications).
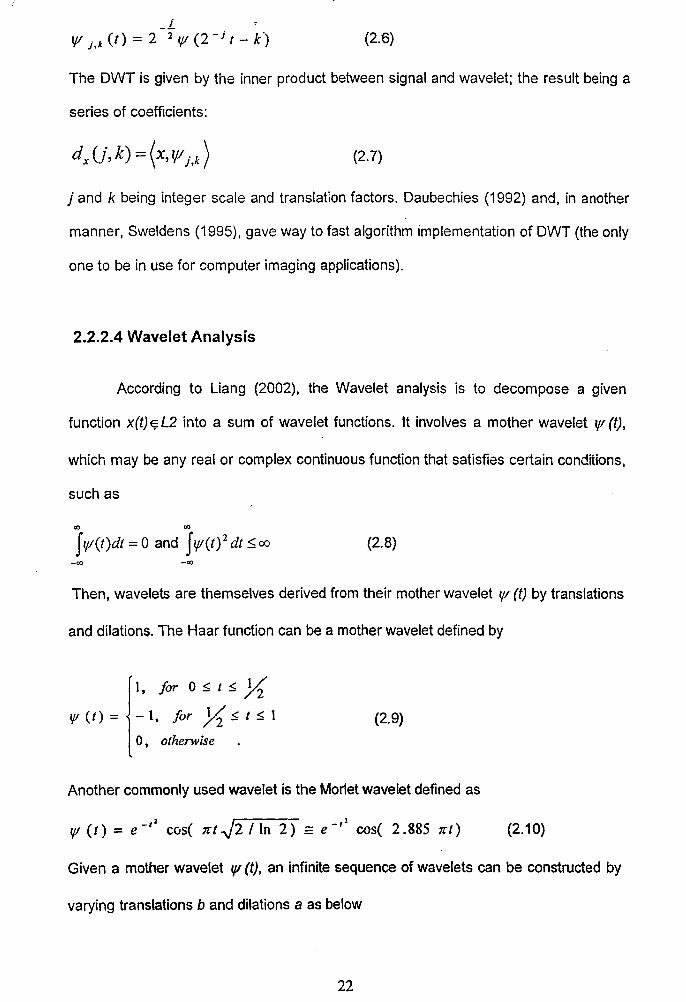
2.2.2.4 Wavelet Analysis
According to Liang (2002), the Wavelet analysis is to decompose a given
function x(t) ~ L2 into a sum of wavelet functions. It involves a mother wavelet f// (t),
which may be any real or complex continuous function that satisfies certain conditions,
such as
<I) <I)
f f//(t)dt = 0 and f If/(t) 2 dt ~ 00 (2.8) -<I) -<I)
Then, wavelets are themselves derived from their mother wavelet If/ (t) by translations
and dilations. The Haar function can be a mother wavelet defined by
1, for 0 ~ t ~ 7i' If (t) = - 1, for 7i' ~ t ~ 1
o , otherwise
(2.9)
Another commonly used wavelet is the Morlet wavelet defined as
(2.10)
Given a mother wavelet If/ (t), an infinite sequence of wavelets can be constructed by
varying translations b and dilations a as below
22
II-tl2 t-b ty a b (t) = a ty(-) , a (2.11 )
By defining the continuous wavelet transform W (a, b) as
'" W(a, b) = 1t x(t), ty a,b (I) ~ = f x(t)ty u,b (t)dt, (2.12)
x (t) can be represented as
x(t) = _l_j j a- 2 W (a, b)1f a,b (t)dadb (2.13) C 1 O-O!)
1 12 ., If(OJ)
Where C1 = f dt -<0 OJ
'" and If (aJ) = f ty (t)e -i{J)/ dt (2.14)
-co
When a and b take on discrete sets of values, the discrete wavelet transform can be
obtained similarly as
r/)
W(m, n) =1t x(t), If/ m,n (t) ~ = Jx(t)ty m,n(t)dt, (2.15) -00
'" co
and x ( t) = L L W m ,n If m ,n (t ) (2.16) ., = -GO n = -00
For an equally spaced time series data x = (x (1), x(2J, ... , x(N) ), approximate wavelet
transforms can be taken by replacing (2.15) by an estimate such as:
.., W (m, n) = f x(t)1f ".If (t)dt (2.17)
-<0
N
~ L x ( I)f// m n (l). 1=1
It follows that a class of discrete wavelet transform (OWT) for equally spaced time
series data can be implemented by using an efficient computational algorithm (Bruce
and Gao, 1996).
23
Finally, the wavelet analysis .is very powerful and efficient in the analysis of data or
functions, x (t) with gradual frequency changes. However, wavelets are not periodic
functions. For example, the Morlet wavelet is Fourier based but its oscillations are
_(2
dampened by the exponential factor e . Interestingly, the concepts of frequency and
periodicity have no precise meaning in wavelet analysis (Priestley, 1996).
2.2.3 Cobb-Douglas Production Function
The early history of the concept is not so well known. Textbooks and survey
articles largely ignore an extensive body of eighteenth and nineteenth century work on
production functions (Humphrey, 1997). Instead, they typically start with the famous
two-factor Cobb-Douglas version
P = b[L.sup.kJ[C.sup.1-kJ (2.18)
That version dates from 1927 when University of Chicago economist Paul Douglas,
and professor Charles W. Cobb suggested an equation describing the relationship
among the time series on manufacturing output, labour input, and capital input that
Douglas had assembled for the period 1889-1922.
For production, the function is Y = ALa KP (2.19)
Where:
• Y= output
• L = labour input
• K = capital input
• A, a and {3 are constants determined by technology.
If a plus {3 = 1, the production function has constant returns to scale (if Land K are
increased by 20%, Y increases by 20%). If a plus {3 is less than 1, returns to scale are
24


![EEU 104 – ELECTRICAL TECHNOLOGY [TEKNOLOGI ELEKTRIK]eprints.usm.my/30850/1/EEU104.pdf- 2 - [EEU 104] ENGLISH VERSION . 1. (a) Figure 1(a) shows a potentially dangerous situation.](https://static.fdocuments.us/doc/165x107/5c9f03cc88c9934b2d8cb335/eeu-104-electrical-technology-teknologi-elektrik-2-eeu-104-english-version.jpg)
