SPECTROSCOPY - SRM · PDF fileQuantitative analysis/Beer’s Law. ... Quantitative...
35
SPECTROSCOPY Light interacting with matter as an analytical tool III Pharm.D Department of Pharmaceutical Analysis SRM College Of Pharmacy,Katankulathur
Transcript of SPECTROSCOPY - SRM · PDF fileQuantitative analysis/Beer’s Law. ... Quantitative...

SPECTROSCOPY
Light interacting with matter as an analytical toolIII Pharm.D
Department of Pharmaceutical AnalysisSRM College Of Pharmacy,Katankulathur
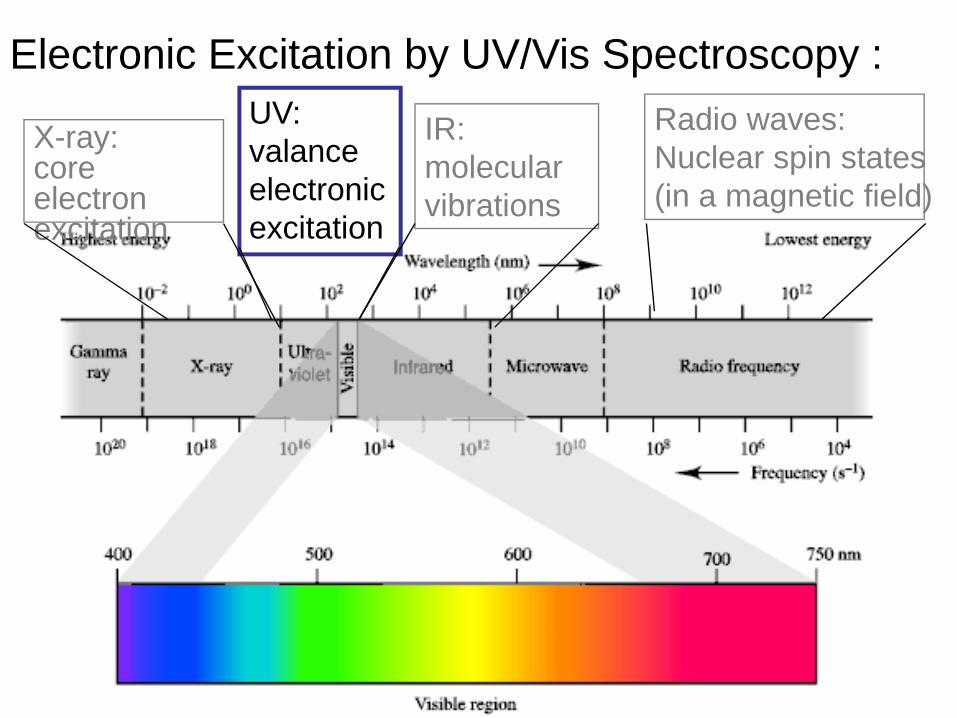
X-ray: core electron excitation
UV: valance electronic excitation
IR: molecular vibrations
Radio waves:Nuclear spin states(in a magnetic field)
Electronic Excitation by UV/Vis Spectroscopy :
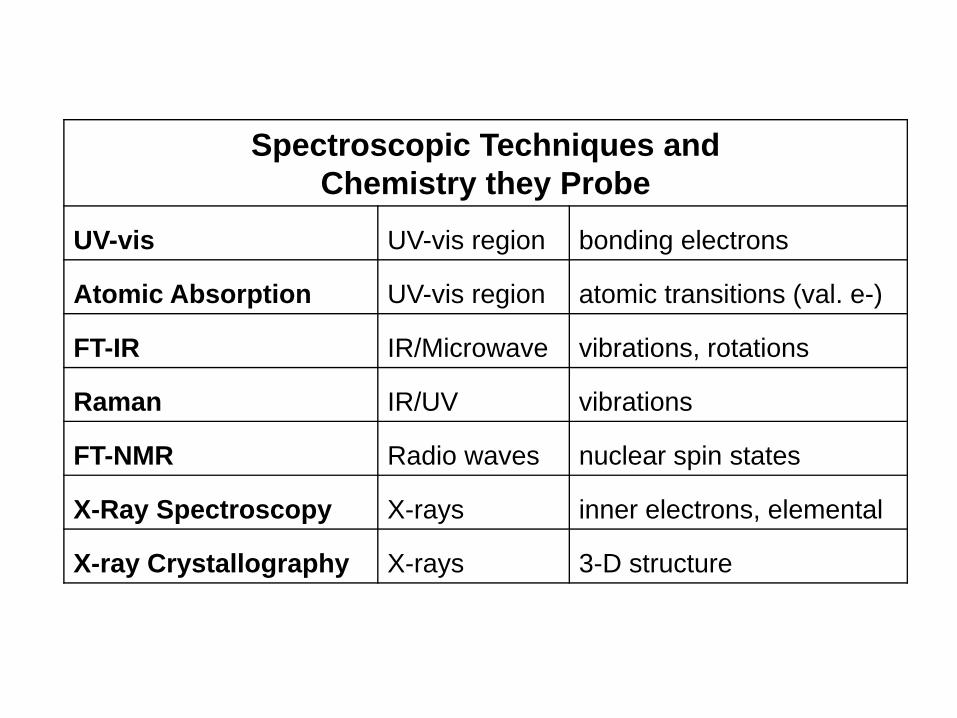
Spectroscopic Techniques and Chemistry they Probe
UV-vis UV-vis region bonding electrons
Atomic Absorption UV-vis region atomic transitions (val. e-)
FT-IR IR/Microwave vibrations, rotations
Raman IR/UV vibrations
FT-NMR Radio waves nuclear spin states
X-Ray Spectroscopy X-rays inner electrons, elemental
X-ray Crystallography X-rays 3-D structure

Spectroscopic Techniques and Common Uses
UV-vis UV-vis regionQuantitative
analysis/Beer’s Law
Atomic Absorption UV-vis regionQuantitative analysis
Beer’s Law
FT-IR IR/Microwave Functional Group Analysis
Raman IR/UVFunctional Group
Analysis/quant
FT-NMR Radio waves Structure determination
X-Ray Spectroscopy X-rays Elemental Analysis
X-ray Crystallography X-rays 3-D structure Anaylysis
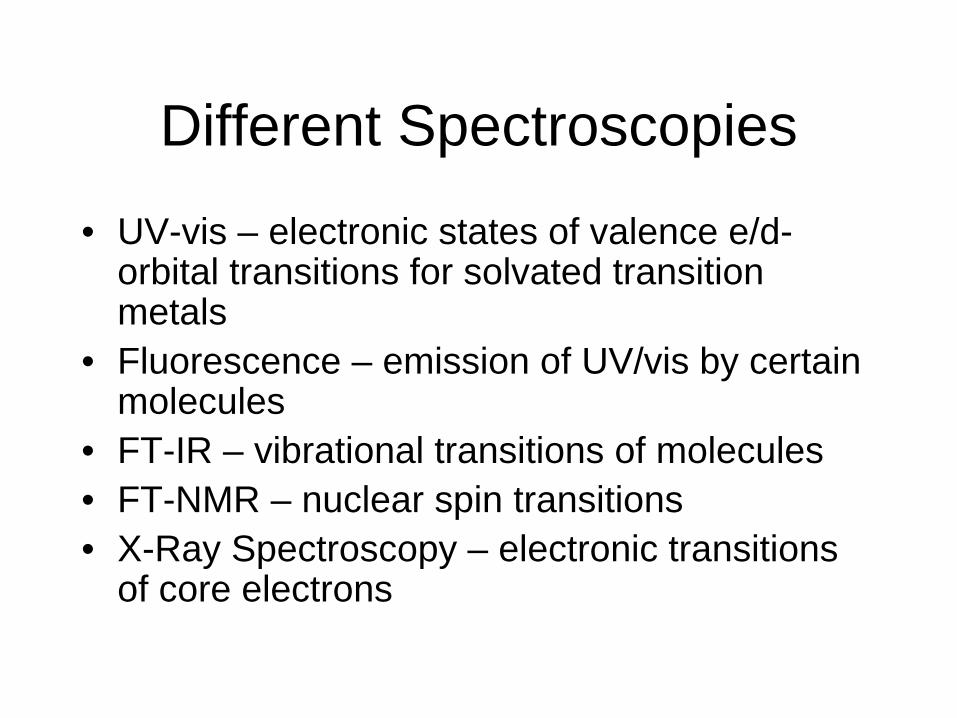
Different Spectroscopies
• UV-vis – electronic states of valence e/d-orbital transitions for solvated transition metals
• Fluorescence – emission of UV/vis by certain molecules
• FT-IR – vibrational transitions of molecules• FT-NMR – nuclear spin transitions• X-Ray Spectroscopy – electronic transitions
of core electrons

Quantitative Spectroscopy
• Beer’s LawAl1 = el1bce is molar absorptivity (unique for a given compound at l1)b is path lengthc concentration

Beer’s Law
• A = -logT = log(P0/P) = ebc• T = Psolution/Psolvent = P/P0
• Works for monochromatic light• Compound x has a unique e at different
wavelengths
cuvettesource
slit
detector

Characteristics of Beer’s Law Plots
• One wavelength• Good plots have a range of
absorbances from 0.010 to 1.000• Absorbances over 1.000 are not that
valid and should be avoided• 2 orders of magnitude
Standard Practice
• Prepare standards of known concentration
• Measure absorbance at λmax• Plot A vs. concentration• Obtain slope • Use slope (and intercept) to determine
the concentration of the analyte in the unknown
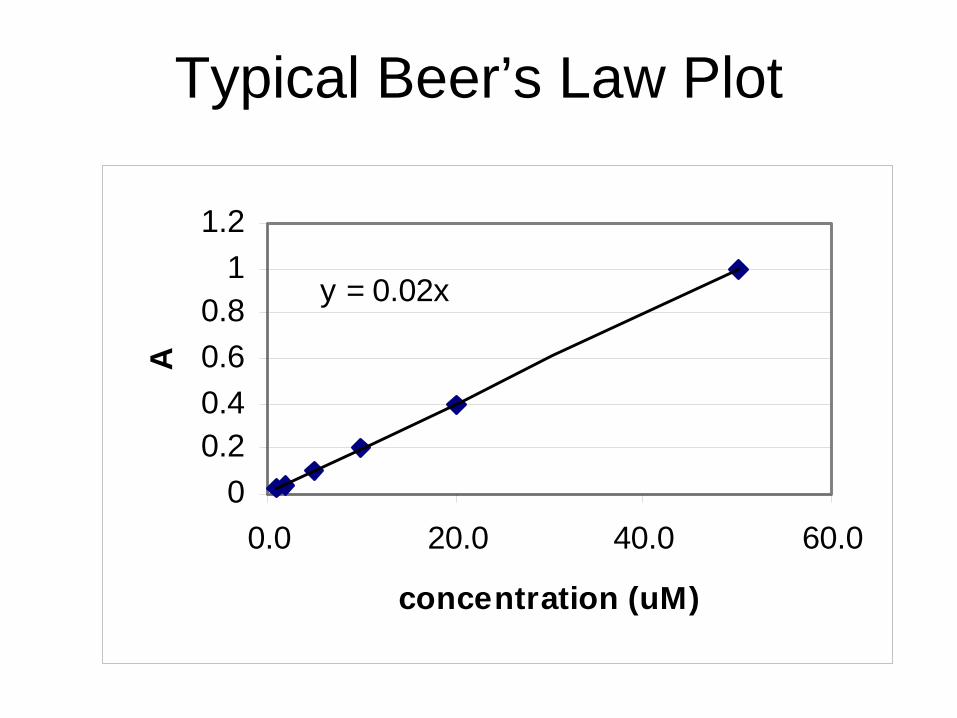
Typical Beer’s Law Plot
y = 0.02x
00.20.40.60.8
11.2
0.0 20.0 40.0 60.0
concentration (uM)
A

UV-Vis Spectroscopy
• UV- organic molecules– Outer electron bonding transitions– conjugation
• Visible – metal/ligands in solution– d-orbital transitions
• Instrumentation

Characteristics of UV-Vis spectra of Organic Molecules
• Absorb mostly in UV unless highly conjugated
• Spectra are broad, usually to broad for qualitative identification purposes
• Excellent for quantitative Beer’s Law-type analyses
• The most common detector for an HPLC
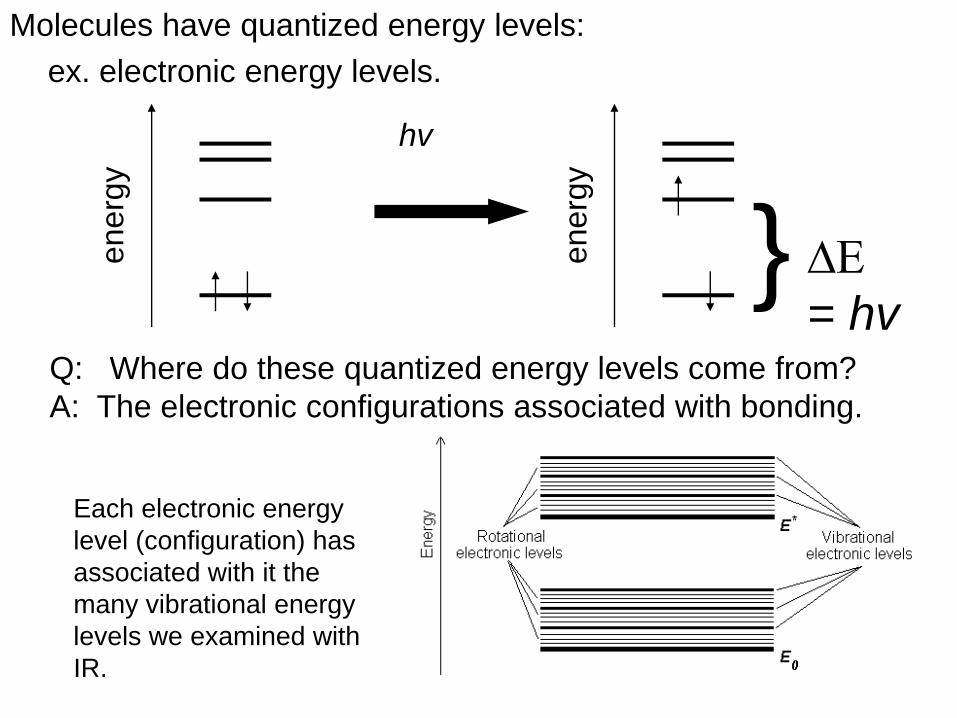
Molecules have quantized energy levels:ex. electronic energy levels.
ener
gyhv
ener
gy
} ΔΕ = hv
Q: Where do these quantized energy levels come from?A: The electronic configurations associated with bonding.
Each electronic energy level (configuration) has associated with it the many vibrational energy levels we examined with IR.

Broad spectra
• Overlapping vibrational and rotational peaks
• Solvent effects

Molecular Orbital Theory
• Fig 18-10

2s 2s
σ
σ∗
σ
σ∗
π∗
π
2p 2pn

λmax = 135 nm (a high energy transition)
Absorptions having λmax < 200 nm are difficult to observe because everything (including quartz glass and air) absorbs in this spectral region.
Ethane

Example: ethylene absorbs at longer wavelengths:λmax = 165 nm ε= 10,000
ΔΕ= hv=hc/λ

The n to pi* transition is at even lower wavelengths but is not as strong as pi to pi* transitions. It is said to be “forbidden.”Example:
Acetone: n−σ∗ λmax = 188 nm ; ε= 1860n−π∗ λmax = 279 nm ; ε= 15
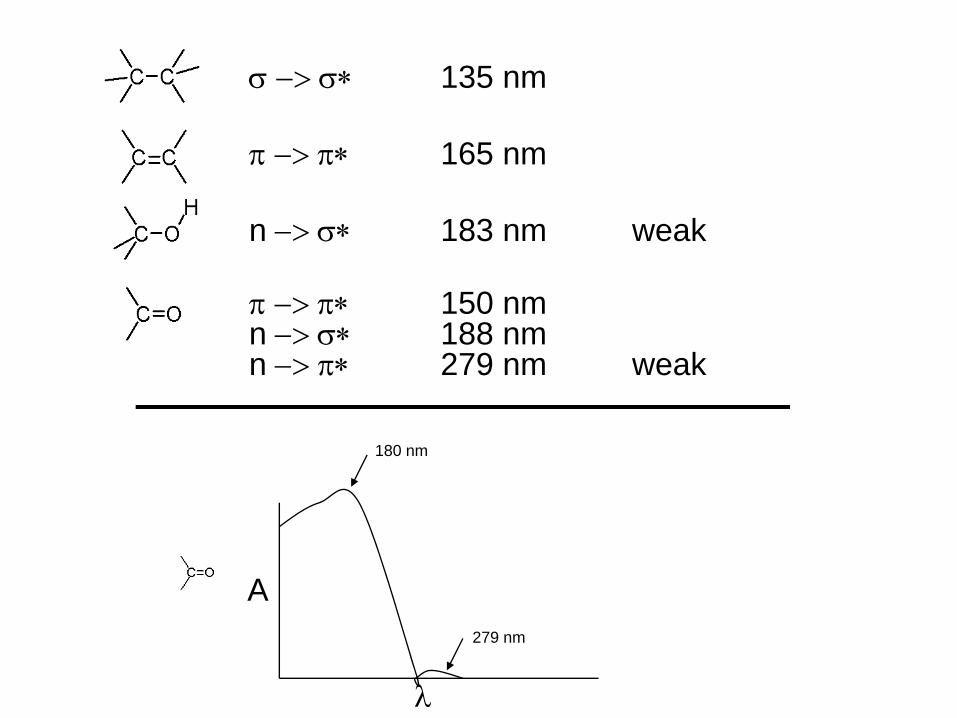
σ −> σ∗ 135 nm
π −> π∗ 165 nm
n −> σ∗ 183 nm weak
π −> π∗ 150 nmn −> σ∗ 188 nmn −> π∗ 279 nm weak
λ
A
180 nm
279 nm

Conjugated systems:
Preferred transition is between Highest Occupied Molecular Orbital (HOMO) and Lowest Unoccupied Molecular Orbital (LUMO).
Note: Additional conjugation (double bonds) lowers the HOMO-LUMO energy gap:Example:
1,3 butadiene: λmax = 217 nm ; ε= 21,0001,3,5-hexatriene λmax = 258 nm ; ε= 35,000
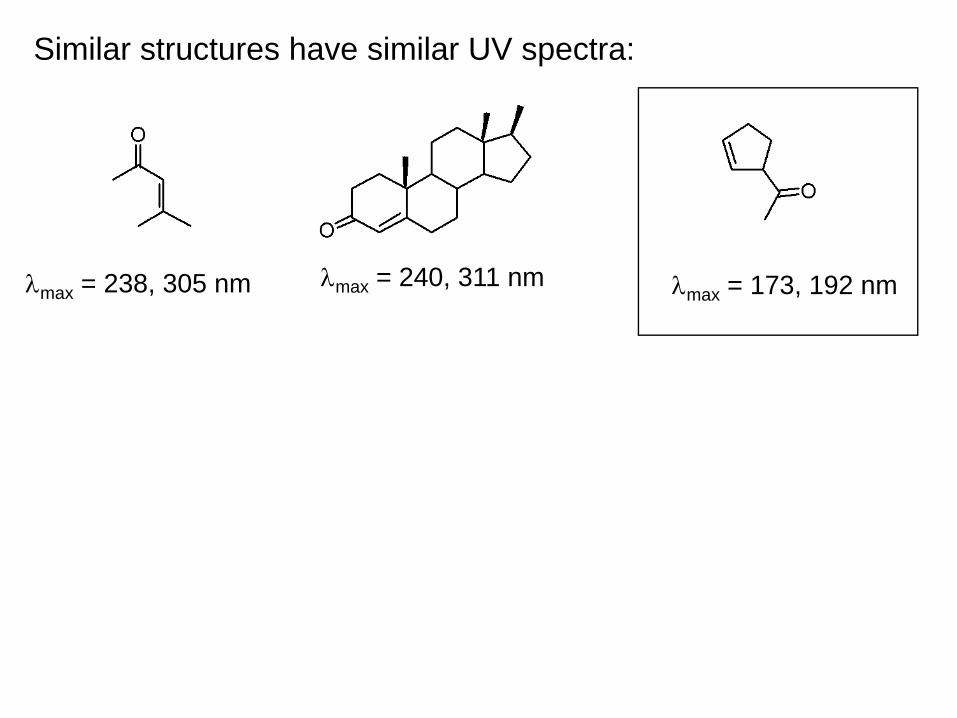
Similar structures have similar UV spectra:
λmax = 238, 305 nm λmax = 240, 311 nm λmax = 173, 192 nm
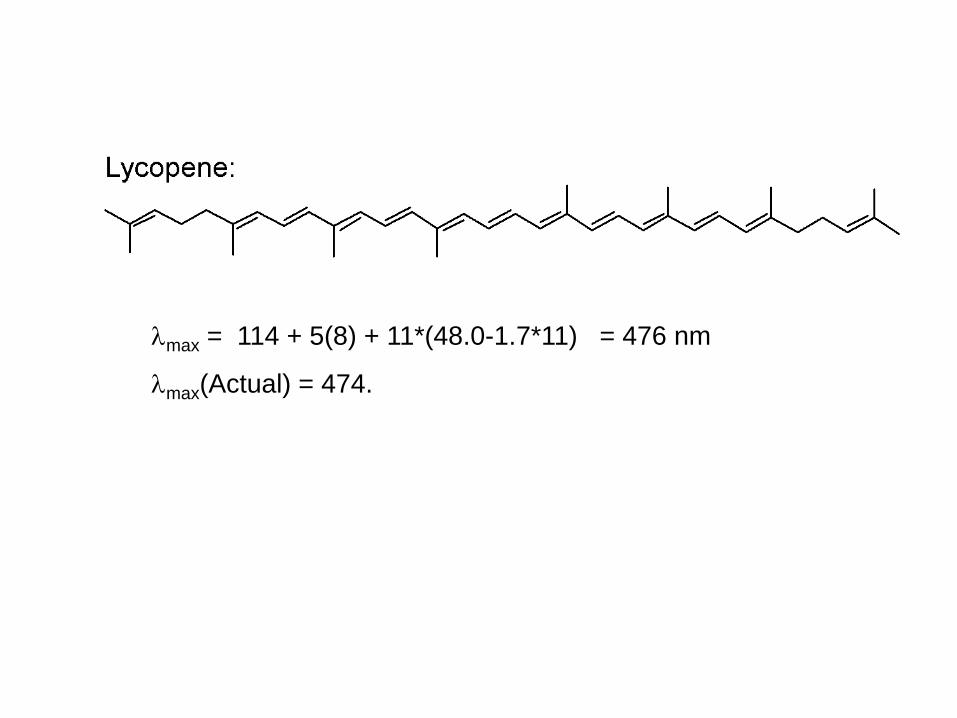
λmax = 114 + 5(8) + 11*(48.0-1.7*11) = 476 nm
λmax(Actual) = 474.
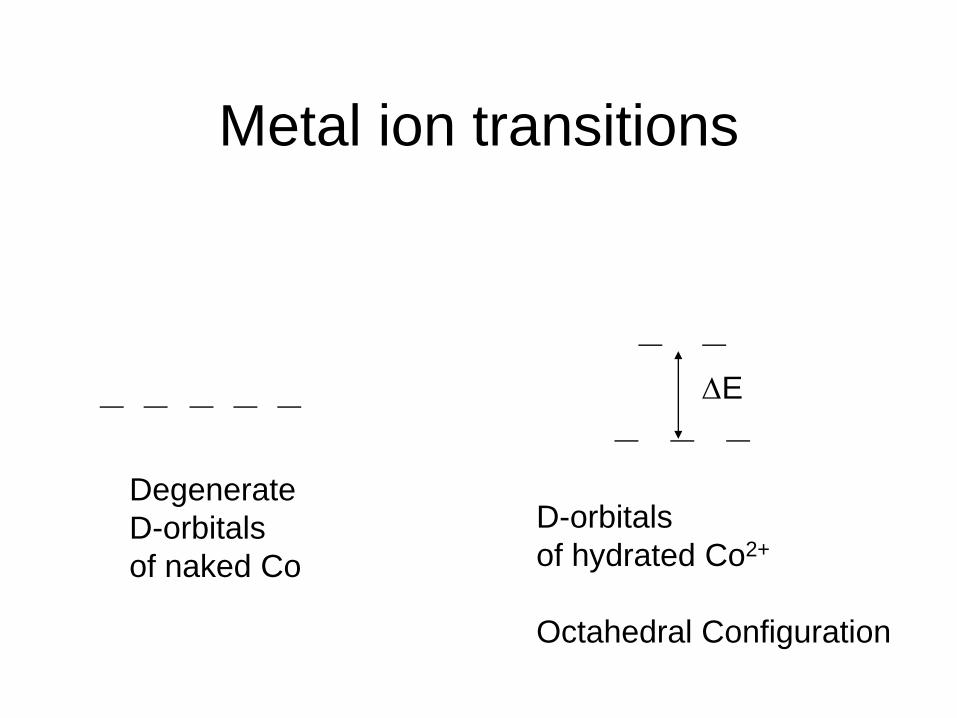
Metal ion transitions
Degenerate D-orbitalsof naked Co
D-orbitalsof hydrated Co2+
Octahedral Configuration
ΔE

Co2+
H2O
H2O
H2OH2O
H2O
H2O
Octahedral Geometry

Instrumentation
• Fixed wavelength instruments• Scanning instruments• Diode Array Instruments

Fixed Wavelength Instrument• LED serve as source• Pseudo-monochromatic light source• No monochrometer necessary/ wavelength selection
occurs by turning on the appropriate LED• 4 LEDs to choose from
photodyode
sample
beam of light
LEDs
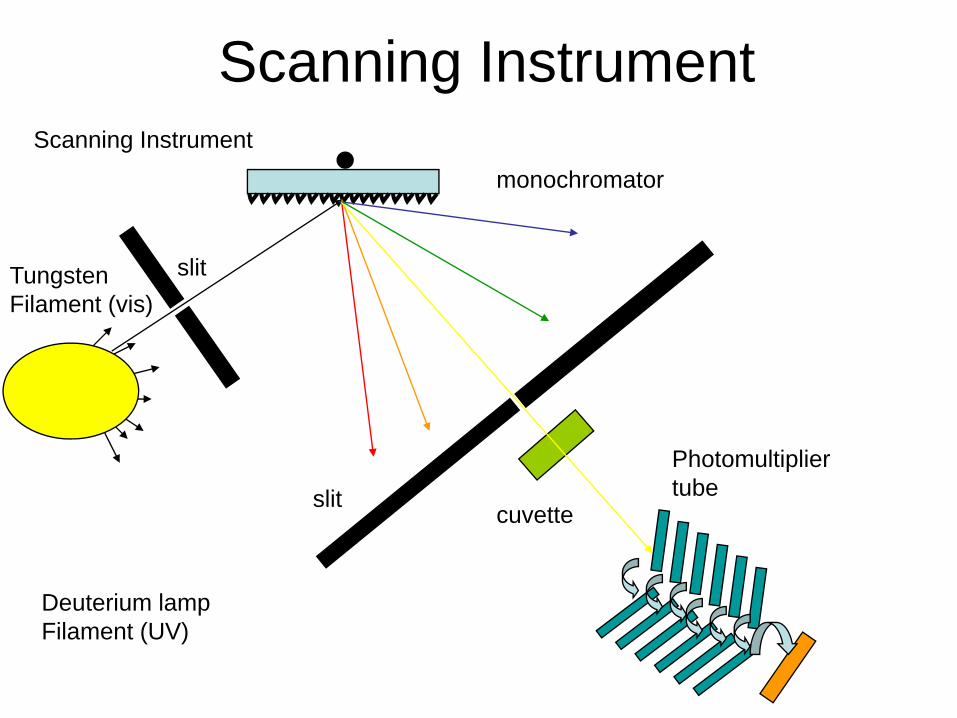
Scanning Instrument
cuvette
Tungsten Filament (vis)
slit
Photomultiplier tube
monochromator
Deuterium lampFilament (UV)
slit
Scanning Instrument

sources
• Tungten lamp (350-2500 nm)• Deuterium (200-400 nm)• Xenon Arc lamps (200-1000 nm)

Monochromator
• Braggs law, nl = d(sin i + sin r)• Angular dispersion, dr/dλ = n / d(cos r)• Resolution, R = λ/Δλ = nN, resolution is
extended by concave mirrors to refocus the divergent beam at the exit slit

Sample holder
• Visible; can be plastic or glass• UV; you must use quartz

Single beam vs. double beam
• Source flicker
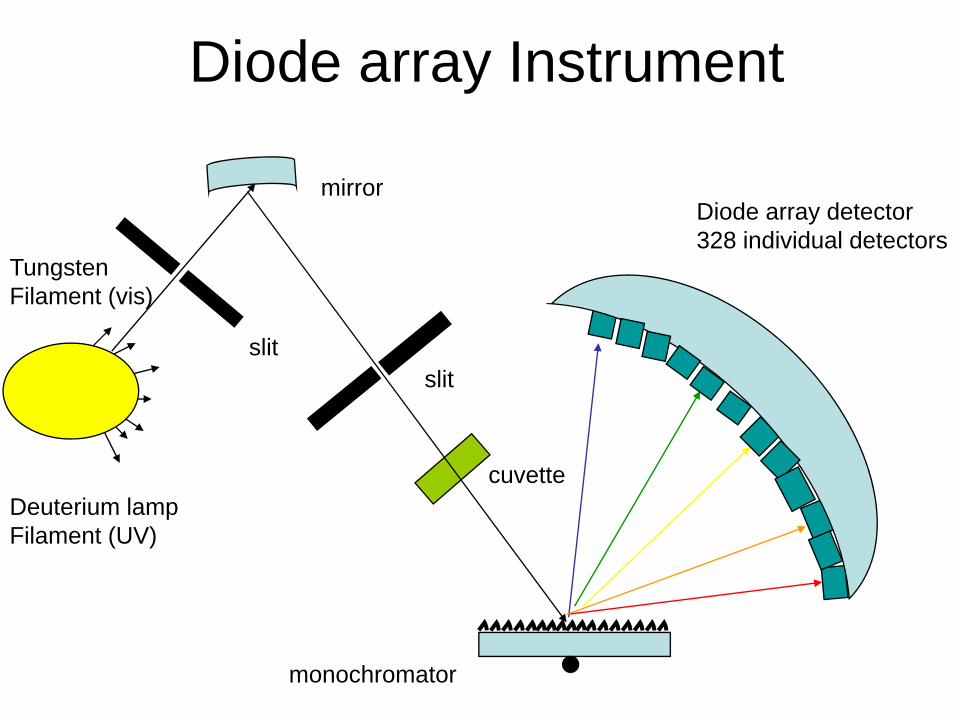
Diode array Instrument
cuvette
Tungsten Filament (vis)
slit
Diode array detector328 individual detectors
monochromator
Deuterium lampFilament (UV)
slit
mirror

Advantages/disadvantages• Scanning instrument
– High spectral resolution (63000), λ/Δλ– Long data acquisition time (several
minutes)– Low throughput
• Diode array– Fast acquisition time (a couple of
seconds), compatible with on-line separations
– High throughput (no slits)– Low resolution (2 nm)
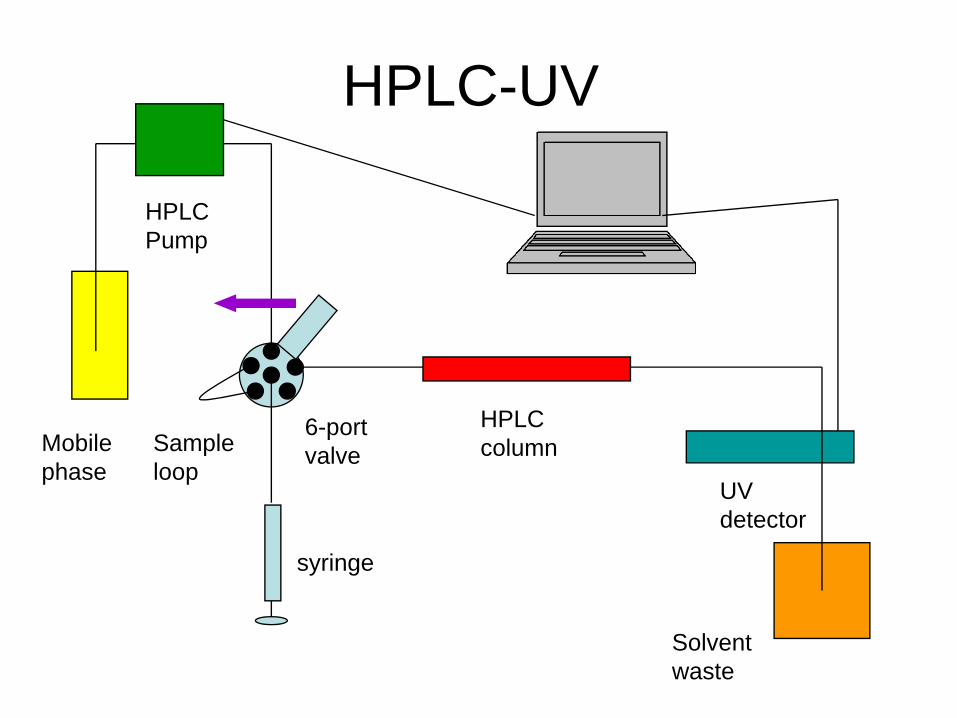
HPLC-UV
Mobile phase
HPLC Pump
syringe
6-port valveSample
loop
HPLC column
UV detector
Solvent waste