ELECTROMAGNETIC SPECTRUM. Song The electromagnetic spectrum song.

Chapter 1Spectroscopy and the ElectromagneticSpectrum
Corey N. Stedwell and Nicolas C. Polfer
1.1 Light and Matter
Electromagnetic radiation exhibits properties of both particles and waves, knownas the wave–particle duality. In the wave model, electromagnetic radiation ischaracterized by its frequency, m, wavelength, k, and velocity, c. These three valuesare related by the relationship
c ¼ mk ð1:1Þ
The value of c is constant in a given medium (e.g., 2.99 9 108 ms-1 in vac-uum), while the frequency and wavelength of light are inversely proportional toone another. The SI units for wavelength and frequency are the meter (m) and thehertz (Hz), respectively. Traditionally, spectroscopists also define electromagneticradiation by the unit wavenumbers, defined as
~m ¼ k�1 ð1:2Þ
where k denotes the wavelength in centimeters.The energy of a photon (quantum of electromagnetic radiation) depends solely
on its frequency (or wavelength) and is defined as
E ¼ hm ¼ hc
k¼ hc~m ð1:3Þ
where h is Planck’s constant (6.63 9 10-34 Js) [1]. Note that energy is directlyproportional to frequency and wavenumber, and inversely proportional to
C. N. Stedwell (&) � N. C. PolferDepartment of Chemistry, University of Florida, Gainesville, FL 32611, USAe-mail: [email protected]
N. C. Polfere-mail: [email protected]
N. C. Polfer and P. Dugourd (eds.), Laser Photodissociation and Spectroscopy ofMass-separated Biomolecular Ions, Lecture Notes in Chemistry 83,DOI: 10.1007/978-3-319-01252-0_1, � Springer International Publishing Switzerland 2013
1
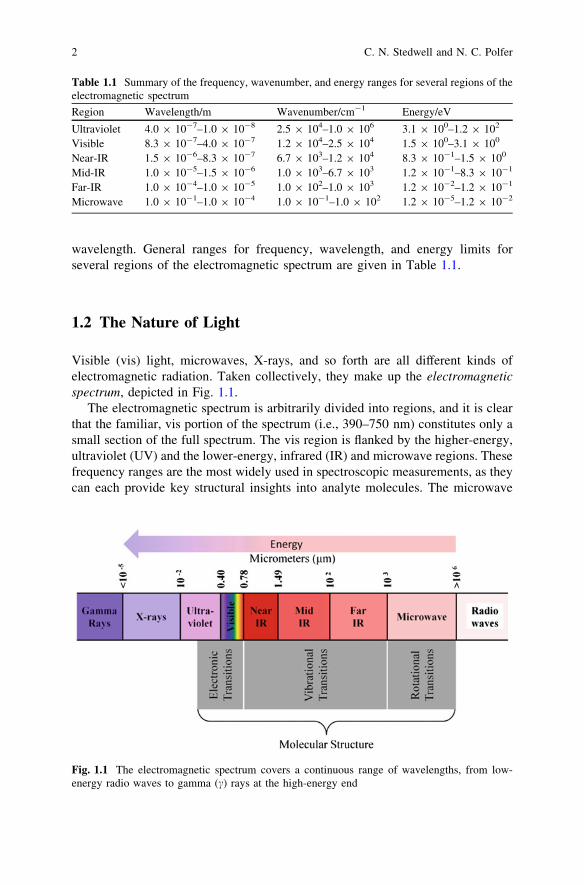
wavelength. General ranges for frequency, wavelength, and energy limits forseveral regions of the electromagnetic spectrum are given in Table 1.1.
1.2 The Nature of Light
Visible (vis) light, microwaves, X-rays, and so forth are all different kinds ofelectromagnetic radiation. Taken collectively, they make up the electromagneticspectrum, depicted in Fig. 1.1.
The electromagnetic spectrum is arbitrarily divided into regions, and it is clearthat the familiar, vis portion of the spectrum (i.e., 390–750 nm) constitutes only asmall section of the full spectrum. The vis region is flanked by the higher-energy,ultraviolet (UV) and the lower-energy, infrared (IR) and microwave regions. Thesefrequency ranges are the most widely used in spectroscopic measurements, as theycan each provide key structural insights into analyte molecules. The microwave
Table 1.1 Summary of the frequency, wavenumber, and energy ranges for several regions of theelectromagnetic spectrum
Region Wavelength/m Wavenumber/cm-1 Energy/eV
Ultraviolet 4.0 9 10-7–1.0 9 10-8 2.5 9 104–1.0 9 106 3.1 9 100–1.2 9 102
Visible 8.3 9 10-7–4.0 9 10-7 1.2 9 104–2.5 9 104 1.5 9 100–3.1 9 100
Near-IR 1.5 9 10-6–8.3 9 10-7 6.7 9 103–1.2 9 104 8.3 9 10-1–1.5 9 100
Mid-IR 1.0 9 10-5–1.5 9 10-6 1.0 9 103–6.7 9 103 1.2 9 10-1–8.3 9 10-1
Far-IR 1.0 9 10-4–1.0 9 10-5 1.0 9 102–1.0 9 103 1.2 9 10-2–1.2 9 10-1
Microwave 1.0 9 10-1–1.0 9 10-4 1.0 9 10-1–1.0 9 102 1.2 9 10-5–1.2 9 10-2
Fig. 1.1 The electromagnetic spectrum covers a continuous range of wavelengths, from low-energy radio waves to gamma (c) rays at the high-energy end
2 C. N. Stedwell and N. C. Polfer

region of the electromagnetic spectrum is associated with rotational spectroscopy,while the UV and vis portions correspond to molecular electronic transitions. TheIR region, which is typically broken into near-, mid-, and far-IR, is utilized invibrational spectroscopy, as the frequencies of radiation therein correspond tomolecular vibrations.
1.3 Vibrations
1.3.1 Background
There are two general types of molecular vibrations, namely stretching andbending. The stretching frequency of a bond can be approximated by Hooke’s law[2, 3]. In this approximation, two atoms and the connecting bond are treated as asimple harmonic oscillator composed of two masses (atoms) joined by a spring (achemical bond). This is illustrated for atoms, labeled A and B, in Fig. 1.2.
These two atoms have some equilibrium distance, re, and as the atoms aredisplaced from their equilibrium distance, they will experience a restoring force, F,that opposes the motion. If we assume that the system behaves according toclassical mechanics, the restoring force will be proportional to the displacementfrom equilibrium distance, Dr, and vary according to Hooke’s law
F ¼ �kDr ð1:4Þ
where k is the force constant. At some point, the restoring force will cause themolecular motion to cease, and subsequently, the atoms will begin moving in theopposite direction. This creates a smooth oscillatory motion known as a vibration.
Fig. 1.2 Motions of adiatomic oscillator AB
1 Spectroscopy and the Electromagnetic Spectrum 3
The frequency of vibration of the system is related to the mass and the forceconstant of the spring, by
m ¼ 12p
ffiffiffi
k
l
s
ð1:5Þ
where l is the reduced mass and is defined as
l ¼ mAmB
mA þ mBð1:6Þ
with mA and mB being the mass of atoms A and B, respectively.In the classical harmonic oscillator, the energy of the vibration is given by
E ¼ 12
kDr2 ¼ hm ð1:7Þ
Thus, the energy (or frequency) is dependent on how far one stretches orcompresses the spring. In a classical picture, any value of r is possible. If thismodel were true, a molecule could absorb energy of any wavelength. However,vibrational motion is quantized (it must follow the rules of quantum mechanics),and the only allowed transitions fit the equation
EðvÞ ¼ vþ 12
� �
hm ð1:8Þ
where m is the frequency of the vibration and v is the vibrational quantum number(0, 1, 2, 3, …). The concept of the quantum-mechanical harmonic oscillatorpotential energy curve is illustrated in Fig. 1.3, indicating the vibrational states.
Note that m does not depend on the value of the quantum number v. Hence, themolecular vibrational frequency is the same in all states, even though the energyE changes with v in Eq. (1.8). The lowest possible energy level, v0, resides abovethe bottom of the energy curve; this difference is known as the zero-point energy.
The gross selection rule for vibrational transitions stipulates that the electricdipole moment of the molecule must change during the course of a vibration. Inother words, the so-called transition dipole moment, lfi; between states i andf must be non-zero. More rigorously,
lfi ¼Z
W�f l̂Wi 6¼ 0 ð1:9Þ
where Wi and Wj are wavefunctions describing the ith and jth states, * denotes thecomplex conjugate of the wavefunction, and l̂ is the electric dipole momentoperator. If the value of this integral is non-zero, then the vibrational mode is saidto be IR active, meaning that the transition is allowed and hence observed. Avibrational mode is said to be IR inactive if the dipole moment of the moleculedoes not change during the vibration, as for instance in a homonuclear diatomicmolecular vibration.
4 C. N. Stedwell and N. C. Polfer

The specific selection rule for the harmonic oscillator limits changes in thevibrational quantum number to Dv ¼ �1: Substituting any state v and v ? 1 inEq. (1.8), we can see that the energy difference between any two states is
DE
hc¼ m
c¼ ~m ð1:10Þ
(i.e., the energy of the vibrational transition in wavenumbers is the same as themolecule’s vibrational frequency).
In reality, molecules are not perfect harmonic oscillators. In other words, thevariation in the potential energy of the system with internuclear separation is notperfectly symmetric, but rather tends to have a skewed appearance, similar to thatof the Morse potential, as shown in Fig. 1.4. This type of potential energydependence describes the behavior of an anharmonic oscillator, where the spacingbetween subsequent energy levels is reduced for higher-energy states [4].
Similar to the harmonic oscillator, Schrödinger’s equation can be solved for theMorse potential, resulting in the following expression for energy states
E ¼ hm vþ 12
� �
� xe vþ 12
� �2
þ � � �" #
ð1:11Þ
where xe is called the anharmonicity constant. In general, higher-order terms inEq. (1.11) are usually small and are routinely omitted. Energy-state separationbetween any two successive states can then be given by
DE ¼ hm 1� 2xe vþ 1ð Þ½ � ð1:12Þ
Fig. 1.3 Quantum-mechanical harmonicoscillator indicatingallowable energy levels
1 Spectroscopy and the Electromagnetic Spectrum 5

where v is taken as the vibrational quantum number for the lower-energy state. Inmost cases, xe is a positive number, so that the separation of successive statesbecomes progressively smaller as v increases.
The frequency recorded for a molecular vibration by IR spectroscopy corre-sponds to the energy difference between two vibrational states. The transitionbetween v = 0 and v = 1 is known as the vibrational fundamental. For the IRabsorption corresponding to the fundamental transition, we can see fromEq. (1.12) that the energy of the observed transition will be
DE ¼ hm 1� 2xe½ � ð1:13Þ
At the limit when xe ! 0; one can easily see that harmonic oscillator behavioris restored (i.e., DE ¼ hm), and the observed vibrational frequency is the same asthe molecular vibrational frequency.
Thus far, we have discussed harmonic and anharmonic representations of adiatomic molecule. Let us now consider the molecular motions of a polyatomicmolecule with n atoms. The motions of each atom can be resolved into compo-nents along the three directions in the Cartesian coordinate system. Therefore, anymolecule composed of n atoms has 3n degrees of freedom. These 3n degrees offreedom encompass vibrations, rotations, and translations. The vibrational motionsof atoms can be expressed as fundamental vibrational modes of the entire mole-cule, known as normal modes. The number of vibrational modes will be 3n minusthe number of non-vibrational modes. For linear molecules, which have threetranslational and two rotational motions, they possess 3n-5 normal modes. Incontrast, nonlinear molecules possess three rotational and three translationalmotions and hence have 3n-6 vibrational modes. Apart from the general
Fig. 1.4 Potential energy curve of an anharmonic oscillator (Morse potential). Energy-levelseparations decrease as v increases
6 C. N. Stedwell and N. C. Polfer

classification of stretching and bending modes, the bending modes can be furtherspecified as scissoring, rocking, wagging, and twisting vibrations. The differentkinds of IR-active vibrations are illustrated in Fig. 1.5 for the example of a CH2
moiety.
1.3.2 Biomolecular Vibrations
As can be visualized from Fig. 1.5, along with the total number of molecularnormal modes, it is easy to see that biomolecules can contain a large number of IR-active vibrational modes. Since most biomolecules contain a permanent dipolemoment and have low symmetry, most normal modes are IR active. The stronger,measurable vibrational modes can lend key insights into molecular structure (i.e.,
Fig. 1.5 Types of molecularvibrational motions shownfor a CH2 moiety
1 Spectroscopy and the Electromagnetic Spectrum 7
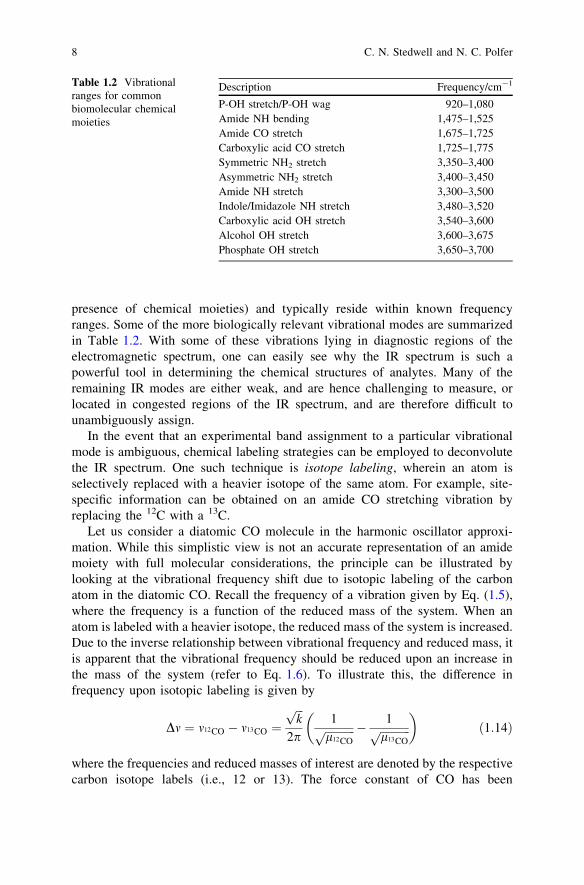
presence of chemical moieties) and typically reside within known frequencyranges. Some of the more biologically relevant vibrational modes are summarizedin Table 1.2. With some of these vibrations lying in diagnostic regions of theelectromagnetic spectrum, one can easily see why the IR spectrum is such apowerful tool in determining the chemical structures of analytes. Many of theremaining IR modes are either weak, and are hence challenging to measure, orlocated in congested regions of the IR spectrum, and are therefore difficult tounambiguously assign.
In the event that an experimental band assignment to a particular vibrationalmode is ambiguous, chemical labeling strategies can be employed to deconvolutethe IR spectrum. One such technique is isotope labeling, wherein an atom isselectively replaced with a heavier isotope of the same atom. For example, site-specific information can be obtained on an amide CO stretching vibration byreplacing the 12C with a 13C.
Let us consider a diatomic CO molecule in the harmonic oscillator approxi-mation. While this simplistic view is not an accurate representation of an amidemoiety with full molecular considerations, the principle can be illustrated bylooking at the vibrational frequency shift due to isotopic labeling of the carbonatom in the diatomic CO. Recall the frequency of a vibration given by Eq. (1.5),where the frequency is a function of the reduced mass of the system. When anatom is labeled with a heavier isotope, the reduced mass of the system is increased.Due to the inverse relationship between vibrational frequency and reduced mass, itis apparent that the vibrational frequency should be reduced upon an increase inthe mass of the system (refer to Eq. 1.6). To illustrate this, the difference infrequency upon isotopic labeling is given by
Dm ¼ m12CO � m13CO ¼ffiffiffi
kp
2p1ffiffiffiffiffiffiffiffiffiffiffi
l12CO
p � 1ffiffiffiffiffiffiffiffiffiffiffi
l13CO
p� �
ð1:14Þ
where the frequencies and reduced masses of interest are denoted by the respectivecarbon isotope labels (i.e., 12 or 13). The force constant of CO has been
Table 1.2 Vibrationalranges for commonbiomolecular chemicalmoieties
Description Frequency/cm-1
P-OH stretch/P-OH wag 920–1,080Amide NH bending 1,475–1,525Amide CO stretch 1,675–1,725Carboxylic acid CO stretch 1,725–1,775Symmetric NH2 stretch 3,350–3,400Asymmetric NH2 stretch 3,400–3,450Amide NH stretch 3,300–3,500Indole/Imidazole NH stretch 3,480–3,520Carboxylic acid OH stretch 3,540–3,600Alcohol OH stretch 3,600–3,675Phosphate OH stretch 3,650–3,700
8 C. N. Stedwell and N. C. Polfer

experimentally determined to be k = 1,854 N/m. Hence, a quick calculation yieldsa frequency redshift of Dm = 48 cm-1 upon 13C labeling of a CO diatomic. Notethat this frequency shift is the maximum possible frequency shift for a singleoscillator. In larger molecules, a normal mode often involves oscillation of mul-tiple subentities of the molecule. Due to the larger overall reduced mass, the effectof the isotopic substitution is markedly diminished, thus lessening the observedfrequency shift.
1.4 Electronic Transitions
1.4.1 Background
The interaction between UV and vis light with matter generally entails an elec-tronic transition (i.e., promotion of electrons from the electronic ground state [S0]to a higher-energy state [e.g., S1]) [5]. For a molecule, A, this process can bevisualized by
Aþ hm! A� ð1:15Þ
where m is the frequency of radiation and A* represents an excited electronic stateof A. Molecules containing p-electrons or non-bonding electrons can absorbenergy from an UV or vis light source, which promotes electrons to higher-energyantibonding molecular orbitals. A schematic representation of the different typesof transitions is given in Fig. 1.6. In general, there are three types of transitions;r! r� transitions usually occur in the vacuum UV (i.e., \200 nm) and will notbe considered here. The lower-energy n! p� and p! p�; read ‘‘n to p startransition’’ and ‘‘p to p star transition,’’ typically reside in the200 nm \ k \ 750 nm (UV–vis) region. The lowest energy transition is a pro-motion from the highest occupied molecular orbital (HOMO) to the lowestunoccupied molecular orbital (LUMO). For the example given in Fig. 1.6, the non-bonding orbital is the highest energy orbital that contains an electron and the p�
antibonding orbital is the lowest energy unoccupied orbital, which gives rise to then! p� HOMO–LUMO transition.
Another important aspect of electronic transitions is the fast timescale on whichthe absorption occurs (e.g., 10-15–10-18 s). In general, electronic transitions occurseveral orders of magnitude faster than atomic vibrations (*10-13 s). Accordingto the Franck–Condon principle, electronic transitions are considered instanta-neous when compared to nuclear motions. In other words, absorptions, as shownon a potential energy curve, are essentially vertical transitions and the nuclearcoordinates remain effectively unchanged during electronic excitations (seeFig. 1.7). Radiation of frequency m can be absorbed if the energy difference hmcorresponds to the energy difference between a quantized energy level in theexcited state and a quantized energy level in the ground state.
1 Spectroscopy and the Electromagnetic Spectrum 9
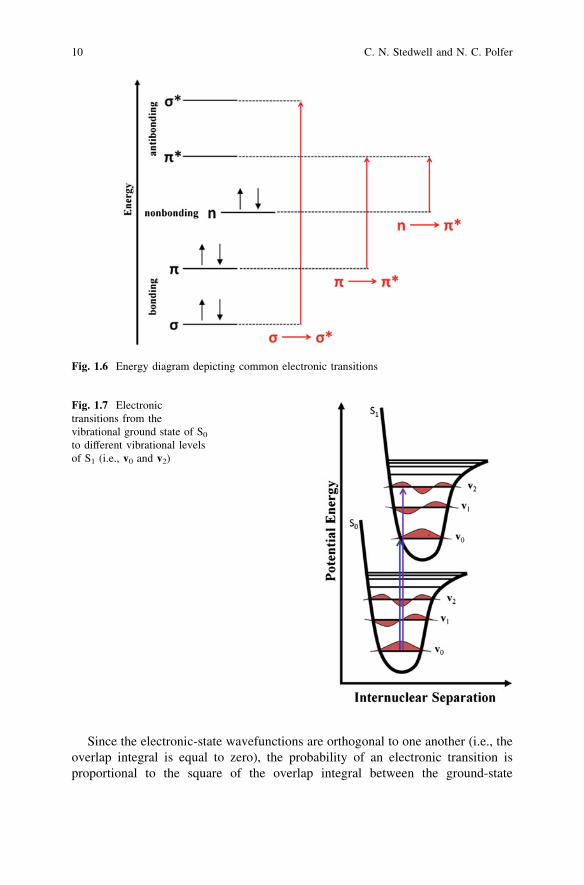
Since the electronic-state wavefunctions are orthogonal to one another (i.e., theoverlap integral is equal to zero), the probability of an electronic transition isproportional to the square of the overlap integral between the ground-state
Fig. 1.6 Energy diagram depicting common electronic transitions
Fig. 1.7 Electronictransitions from thevibrational ground state of S0
to different vibrational levelsof S1 (i.e., v0 and v2)
10 C. N. Stedwell and N. C. Polfer

vibrational wavefunction and the excited-state vibrational wavefunction. Thevibrational-state overlap integral is referred to as the Franck–Condon factor andgoverns the strength of electronic transitions based on the compatibility of thenuclear coordinates in the initial and final states of the transition. Hence, theprobability of a transition is significantly reduced if the initial and final statescorrespond greatly to differing interatomic distances, as the nuclei would berequired to undergo significant spatial changes accompanying the electronictransition. For the example illustrated in Fig. 1.7, one would expect the vibronictransition v0 ? v2 (purple arrow) to be stronger than the origin band v0 ? v0
(blue arrow), based on greater overlap, and a larger Franck–Condon factor, in theground- and excited-state wavefunctions in the former case. For a more detaileddiscussion of the Franck–Condon principle, the reader is referred to relevant lit-erature [3, 6].
1.4.2 Applications to Biomolecular Systems
For UV–vis spectroscopy to be applicable to biomolecular systems, a keyrequirement must be met. The system must contain a UV chromophore capable ofabsorbing photons in the UV–vis frequency range. For biological systems, thisrequirement is met in numerous cases. For instance, several amino acids act as UVchromophores (e.g., histidine, tyrosine, and tryptophan). Therefore, most systems(isolated amino acids, peptides, and proteins) that include these subunits willexhibit adequate UV absorption cross-sections. In addition, the peptide bond itselfhas the ability to absorb UV photons in the 190–230 nm range. On the other hand,saccharides do not exhibit absorption in the typical UV–vis range. Hence, suchmolecules must be subjected to chemical derivatization to be detected by UVspectroscopy. Since UV–vis spectra tend to contain superpositions of variousvibronic transitions, and contributions from various conformers, absorption peakstend to be broad and a limited amount of structural information can be obtainedfrom these measurements. Some steps can be taken to sharpen the electronictransition bands and obtain structural (even conformer specific) information, apoint that will be discussed further in Sect. 1.6.
1.5 Absorption Spectroscopy
To this point, we have discussed various types of transitions, both vibrational andelectronic. Let us now turn our attention to the practical aspects of measuring theaforementioned transitions. First, we will consider the traditional absorptionspectroscopy experiment. Absorption of photons by a species is governed by theBeer–Lambert law [5]
1 Spectroscopy and the Electromagnetic Spectrum 11
� log Tð Þ ¼ A ¼ elc ð1:16Þ
where T is the transmittance of light through the substance, A is the absorbance, eis the molar absorptivity coefficient, l is the distance of interaction (i.e., the pathlength), and c is the molar concentration of the absorbing species. A simplemeasurement of T can be performed by measuring
T ¼ I
I0ð1:17Þ
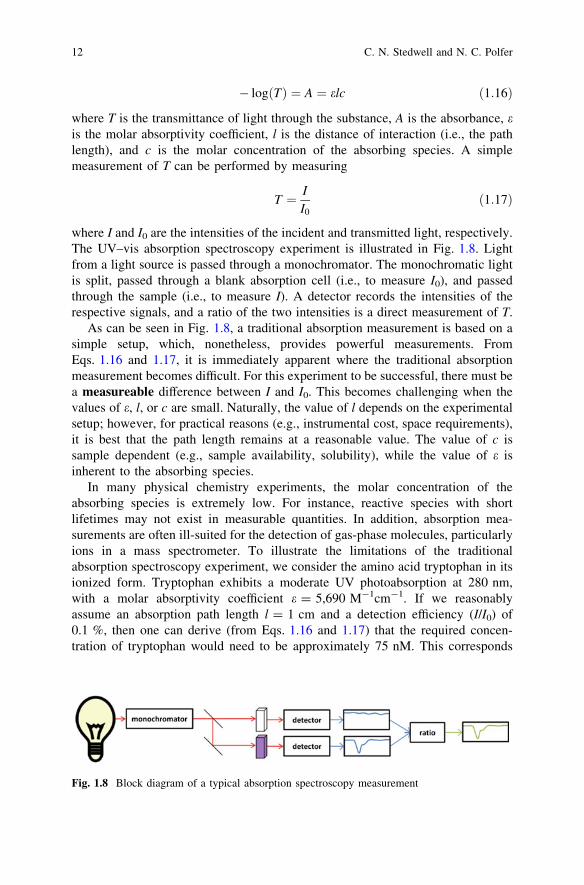
where I and I0 are the intensities of the incident and transmitted light, respectively.The UV–vis absorption spectroscopy experiment is illustrated in Fig. 1.8. Lightfrom a light source is passed through a monochromator. The monochromatic lightis split, passed through a blank absorption cell (i.e., to measure I0), and passedthrough the sample (i.e., to measure I). A detector records the intensities of therespective signals, and a ratio of the two intensities is a direct measurement of T.
As can be seen in Fig. 1.8, a traditional absorption measurement is based on asimple setup, which, nonetheless, provides powerful measurements. FromEqs. 1.16 and 1.17, it is immediately apparent where the traditional absorptionmeasurement becomes difficult. For this experiment to be successful, there must bea measureable difference between I and I0. This becomes challenging when thevalues of e, l, or c are small. Naturally, the value of l depends on the experimentalsetup; however, for practical reasons (e.g., instrumental cost, space requirements),it is best that the path length remains at a reasonable value. The value of c issample dependent (e.g., sample availability, solubility), while the value of e isinherent to the absorbing species.
In many physical chemistry experiments, the molar concentration of theabsorbing species is extremely low. For instance, reactive species with shortlifetimes may not exist in measurable quantities. In addition, absorption mea-surements are often ill-suited for the detection of gas-phase molecules, particularlyions in a mass spectrometer. To illustrate the limitations of the traditionalabsorption spectroscopy experiment, we consider the amino acid tryptophan in itsionized form. Tryptophan exhibits a moderate UV photoabsorption at 280 nm,with a molar absorptivity coefficient e = 5,690 M-1cm-1. If we reasonablyassume an absorption path length l = 1 cm and a detection efficiency (I/I0) of0.1 %, then one can derive (from Eqs. 1.16 and 1.17) that the required concen-tration of tryptophan would need to be approximately 75 nM. This corresponds
Fig. 1.8 Block diagram of a typical absorption spectroscopy measurement
12 C. N. Stedwell and N. C. Polfer
to *4.6 9 1013 tryptophan ions per mL of probed solution, which contrasts to amaximum of *107 ions that can typically be trapped in a mass spectrometer. Thevastly lower concentrations of ions in mass spectrometers clearly preclude spec-troscopic interrogation via conventional absorption detection schemes. One musttherefore turn to more sensitive spectroscopic methods—referred to as ‘‘conse-quence’’ or ‘‘action’’ spectroscopy—to enable these experiments.
1.6 Consequence Spectroscopy
1.6.1 Background
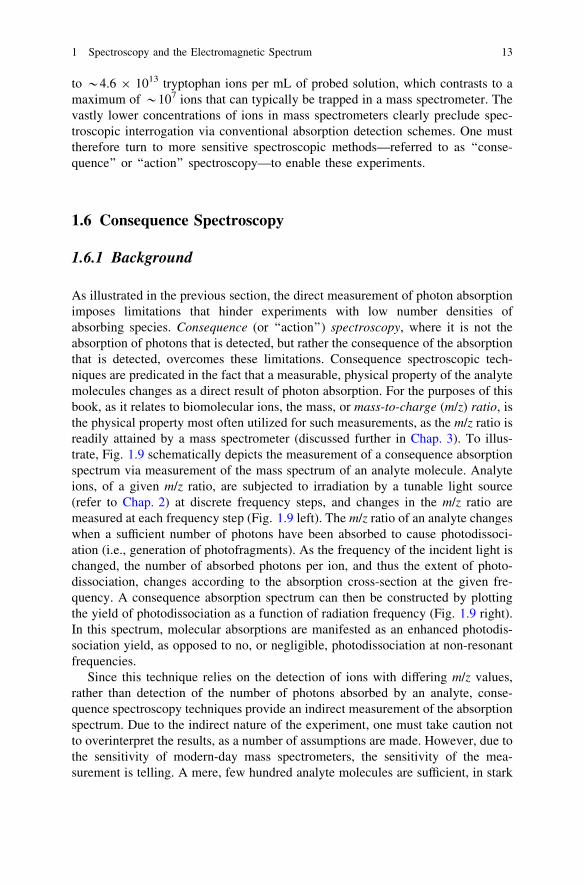
As illustrated in the previous section, the direct measurement of photon absorptionimposes limitations that hinder experiments with low number densities ofabsorbing species. Consequence (or ‘‘action’’) spectroscopy, where it is not theabsorption of photons that is detected, but rather the consequence of the absorptionthat is detected, overcomes these limitations. Consequence spectroscopic tech-niques are predicated in the fact that a measurable, physical property of the analytemolecules changes as a direct result of photon absorption. For the purposes of thisbook, as it relates to biomolecular ions, the mass, or mass-to-charge (m/z) ratio, isthe physical property most often utilized for such measurements, as the m/z ratio isreadily attained by a mass spectrometer (discussed further in Chap. 3). To illus-trate, Fig. 1.9 schematically depicts the measurement of a consequence absorptionspectrum via measurement of the mass spectrum of an analyte molecule. Analyteions, of a given m/z ratio, are subjected to irradiation by a tunable light source(refer to Chap. 2) at discrete frequency steps, and changes in the m/z ratio aremeasured at each frequency step (Fig. 1.9 left). The m/z ratio of an analyte changeswhen a sufficient number of photons have been absorbed to cause photodissoci-ation (i.e., generation of photofragments). As the frequency of the incident light ischanged, the number of absorbed photons per ion, and thus the extent of photo-dissociation, changes according to the absorption cross-section at the given fre-quency. A consequence absorption spectrum can then be constructed by plottingthe yield of photodissociation as a function of radiation frequency (Fig. 1.9 right).In this spectrum, molecular absorptions are manifested as an enhanced photodis-sociation yield, as opposed to no, or negligible, photodissociation at non-resonantfrequencies.
Since this technique relies on the detection of ions with differing m/z values,rather than detection of the number of photons absorbed by an analyte, conse-quence spectroscopy techniques provide an indirect measurement of the absorptionspectrum. Due to the indirect nature of the experiment, one must take caution notto overinterpret the results, as a number of assumptions are made. However, due tothe sensitivity of modern-day mass spectrometers, the sensitivity of the mea-surement is telling. A mere, few hundred analyte molecules are sufficient, in stark
1 Spectroscopy and the Electromagnetic Spectrum 13
contrast to the macroscopic number of analyte molecules required for a traditionalabsorption measurement.
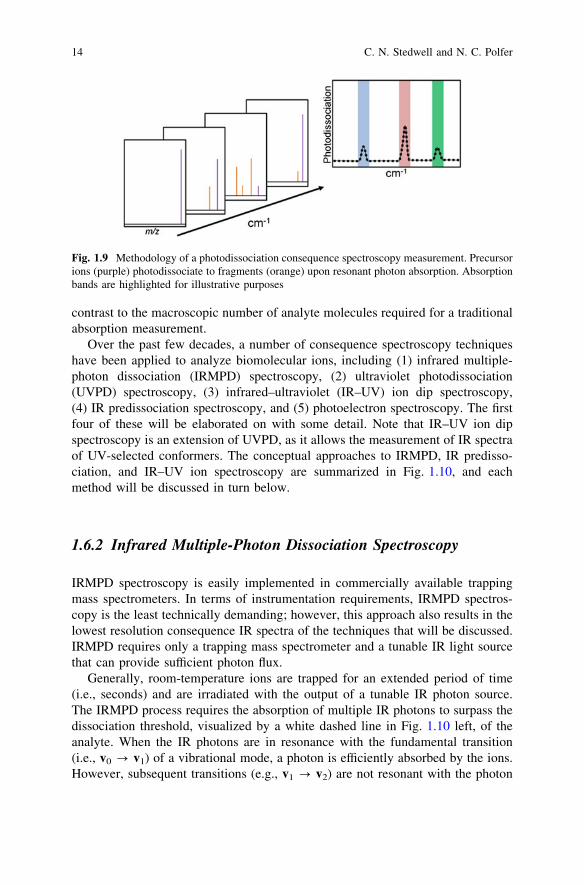
Over the past few decades, a number of consequence spectroscopy techniqueshave been applied to analyze biomolecular ions, including (1) infrared multiple-photon dissociation (IRMPD) spectroscopy, (2) ultraviolet photodissociation(UVPD) spectroscopy, (3) infrared–ultraviolet (IR–UV) ion dip spectroscopy,(4) IR predissociation spectroscopy, and (5) photoelectron spectroscopy. The firstfour of these will be elaborated on with some detail. Note that IR–UV ion dipspectroscopy is an extension of UVPD, as it allows the measurement of IR spectraof UV-selected conformers. The conceptual approaches to IRMPD, IR predisso-ciation, and IR–UV ion spectroscopy are summarized in Fig. 1.10, and eachmethod will be discussed in turn below.
1.6.2 Infrared Multiple-Photon Dissociation Spectroscopy
IRMPD spectroscopy is easily implemented in commercially available trappingmass spectrometers. In terms of instrumentation requirements, IRMPD spectros-copy is the least technically demanding; however, this approach also results in thelowest resolution consequence IR spectra of the techniques that will be discussed.IRMPD requires only a trapping mass spectrometer and a tunable IR light sourcethat can provide sufficient photon flux.
Generally, room-temperature ions are trapped for an extended period of time(i.e., seconds) and are irradiated with the output of a tunable IR photon source.The IRMPD process requires the absorption of multiple IR photons to surpass thedissociation threshold, visualized by a white dashed line in Fig. 1.10 left, of theanalyte. When the IR photons are in resonance with the fundamental transition(i.e., v0 ? v1) of a vibrational mode, a photon is efficiently absorbed by the ions.However, subsequent transitions (e.g., v1 ? v2) are not resonant with the photon
Fig. 1.9 Methodology of a photodissociation consequence spectroscopy measurement. Precursorions (purple) photodissociate to fragments (orange) upon resonant photon absorption. Absorptionbands are highlighted for illustrative purposes
14 C. N. Stedwell and N. C. Polfer

source, as the spacing between vibrational modes is reduced, due to anharmo-nicity. This ‘‘anharmonic bottleneck’’ prohibits dissociation via the so-calledladder-climbing process (i.e., v0 ? v1 ? v2 ? …? dissociation). On the otherhand, if other normal modes couple with the initially absorbing normal mode,energy can be dispersed throughout the molecule by internal vibrational redis-tribution (IVR). Through IVR, energy is quickly (i.e., ps timescale) dissipatedthroughout the bath of normal modes of the molecule, effectively depopulating thev1 state and returning the molecule to the vibrational ground state. The absorptionof a subsequent photon at the fundamental frequency is then possible, again fol-lowed by dissipation of the energy throughout the molecule. This cycle is repeatedmany times (i.e., tens to hundreds), in the process raising the internal energy of themolecule to exceed the dissociation threshold of the molecule, and thus inducesphotodissociation into one, or multiple, fragmentation channels.
The IRMPD technique is based on a slow, sequential absorption of photons,causing a gradual increase in the internal energy (i.e., heating) of the ions.Therefore, in most cases, ions dissociate by the lowest energy dissociationthreshold, such as the loss of a labile chemical moiety. In other words, higher-energy dissociation pathways are typically not accessible, due to the rapid ran-domization of energy that occurs via IVR. Moreover, while a particular chemicalbond or moiety resonantly absorbs the photon energy, this group may not disso-ciate in the process, but rather other, more labile groups are involved in covalent-bond cleavage. The extent of photodissociation by IRMPD, or IRMPD yield, isquantified by
Fig. 1.10 Summary of infrared consequence spectroscopy techniques. Figure adapted from [7]
1 Spectroscopy and the Electromagnetic Spectrum 15
IRMPD yield ¼P
photofragmentsð ÞP
precursor þ photofragmentsð Þ ð1:18Þ
or
IRMPD yield ¼ � ln 1�P
photofragmentsð ÞP
precursor þ photofragmentsð Þ
� �
ð1:19Þ
where R represents the sum of the integral intensities of the respective ion signals.Given that the IRMPD yield is limited by the initial ion population of the precursorion that is irradiated, the yield is expected to follow pseudo-first-order kinetics. Inthis sense, the logarithmic yield (Eq. 1.19) gives a better approximation of therelative yields, even if the linear approximation for yield (Eq. 1.18) givesnumerically comparable results in cases where the IRMPD yield is low. In reality,IRMPD band intensities are affected by nonlinear processes, and hence, spectralintensities are often (slightly) distorted when compared to linear absorptionspectra.
Due to the thermal distribution of the probed ion population, multiple con-formers (e.g., rotamers) of the analyte ions are usually present, each with a slightlydifferent absorption spectrum. Measured vibrational features in an IRMPD spec-trum result from a superposition of multiple conformers, accounting for significantbroadening ([15 cm-1). An additional broadening effect arises from ion heatingduring multiple-photon absorption, as hotter ions have redshifted and broaderabsorption bands. In summary, the band-broadening effects in IRMPD are a resultof both the conformational envelope (accessible at a particular temperature) priorto laser irradiation and the anharmonic effects (i.e., redshifting, broadening) duringlaser excitation. IRMPD spectroscopy is often well positioned to address questionson the chemical structures of ions, such as confirming the presence (or absence) ofchemical moieties in analytes. However, the technique is less suitable to interro-gate gas-phase conformations, for which other consequence spectroscopy tech-niques, which probe cold, conformationally restricted ions, are necessary.
1.6.3 Ultraviolet Photodissociation Spectroscopy
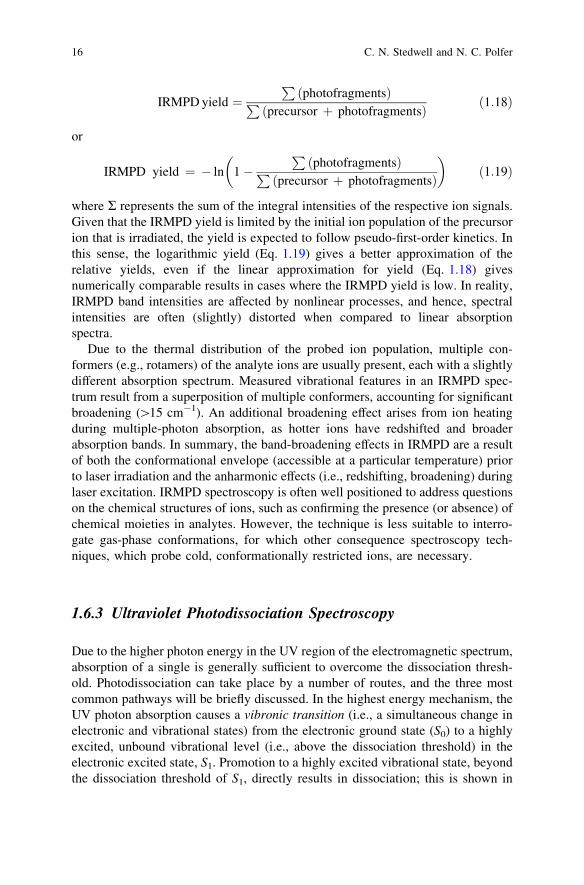
Due to the higher photon energy in the UV region of the electromagnetic spectrum,absorption of a single is generally sufficient to overcome the dissociation thresh-old. Photodissociation can take place by a number of routes, and the three mostcommon pathways will be briefly discussed. In the highest energy mechanism, theUV photon absorption causes a vibronic transition (i.e., a simultaneous change inelectronic and vibrational states) from the electronic ground state (S0) to a highlyexcited, unbound vibrational level (i.e., above the dissociation threshold) in theelectronic excited state, S1. Promotion to a highly excited vibrational state, beyondthe dissociation threshold of S1, directly results in dissociation; this is shown in
16 C. N. Stedwell and N. C. Polfer

Fig. 1.11 (left). The second mechanism differs only in that dissociation proceedsfrom the ground electronic state, following an internal conversion (i.e., electronicenergy is converted into vibrational energy) from the electronically excited state.This can occur by
a. internal conversion directly to a highly excited vibrational state (i.e., above thedissociation threshold) of S0
b. internal conversion to S1 v0, followed by relaxation to a highly excited vibra-tional state of S0
and is shown schematically in Fig. 1.11 (center). The third mechanism proceedsvia a potential energy curve crossing to a dissociative state (DS), which has no, oronly a shallow potential energy minimum, hence causing dissociation (Fig. 1.11right). This results in so-called predissociation or dissociation below normal dis-sociation thresholds. Electronically excited molecules may also be deexcited,without undergoing photodissociation, by the emission of a photon (i.e., fluores-cence) or emission of an electron, depending on the energy of the incomingphoton, and the charge state and polarity of the ion.
Naturally, UVPD experiments require a coupled tunable UV light source and atrapping mass spectrometer. A UVPD spectrum is measured by monitoring thephotodissociation yield as a function of incident UV photon frequency. The rel-atively high-energy nature of the photons in the UV region permits single-photon(i.e., linear) dissociation. While structural information can be obtained from theelectronic spectrum of a room-temperature ion, UVPD spectroscopy tends to resultin broader spectral features, due to the multitude of available vibronic transitions
Fig. 1.11 Three potential dissociation mechanisms upon absorption of a UV photon. Dissoci-ation thresholds are indicated via red, dashed lines
1 Spectroscopy and the Electromagnetic Spectrum 17

that are available. Similar to IRMPD spectroscopy, UVPD spectroscopy on room-temperature ions is more suitable for elucidating chemical structures, as opposedto characterizing conformations.
1.6.4 Infrared–Ultraviolet Ion Dip Spectroscopy
To obtain higher-resolution IR spectra than is possible by UVPD spectroscopy, akey detail must be addressed—the internal energy of the analyte molecules mustbe decreased to reduce conformational inhomogeneity. High-resolution UVspectra can be collected on cryogenically cooled ions, where sharp transitionscorrespond to origin and vibronic bands from a population of gas-phase con-formers. In order to assign structures to specific UV transitions, it is useful torecord the corresponding IR spectra. In IR–UV ion dip spectroscopy, conformer-specific IR absorption spectra can be collected by employing a two-laser photo-dissociation scheme.
Trapped ions are cooled to cryogenic temperatures prior to interrogation by IR–UV spectroscopy. In addition, IR–UV requires the use of a pulsed UV light sourceto photodissociate specific molecular conformers trapped within a mass spec-trometer. Since the electronic (UV) transitions are intimately coupled withmolecular structure, any two conformers will have slightly differing UV absorp-tions. The premise of the technique rests on the assumption that a particular UVtransition is selective for a specific gas-phase conformation. As is implied, thistechnique is only applicable to analyte molecules that contain a chromophorecapable of absorbing UV photons.
To obtain conformer-specific IR spectra, the UV light source is fixed to aunique UV transition, causing constant photodissociation of the selected con-former. Meanwhile, a tunable, pulsed IR light source is scanned to probe theanalyte molecules. If the IR pulse precedes the UV pulse (e.g., by approximately100 ns), and the IR frequency is in resonance with a v0 ? v1 vibrational transitionof the conformer, an IR photon is absorbed, effectively depleting the groundvibrational state (S0 v0). In a population of ions, a significant depletion of theground vibrational state means fewer analyte molecules are in resonance with theUV photon frequency, therefore reducing the amount of measured UVPD (i.e., a‘‘dip’’ in measured UV photofragmentation yield). In other words, as the frequencyof the IR photons is scanned, each dip in the measured UV dissociation corre-sponds to a different vibrational transition in the molecular conformer beingprobed by the UV laser. This is visualized graphically in Fig. 1.10 (right). The IRspectrum can be recorded for multiple UV transitions, each potentially corre-sponding to a different molecular conformer.
IR–UV ion dip spectroscopy is the most sophisticated of the techniques men-tioned here. In addition to the mass spectrometer and a cryogenic cooling appa-ratus, two light sources are required (UV and IR), both of which must be tunableand pulsed. The utility of these types of experiments can be witnessed in the high-
18 C. N. Stedwell and N. C. Polfer
resolution, conformer-specific absorption spectra that are generated (illustratedfurther in Chap. 4).
1.6.5 Infrared Predissociation Spectroscopy
Another spectroscopic technique that utilizes cold ions is IR predissociationspectroscopy, which uses a ‘‘messenger’’ or ‘‘tag’’ species (e.g., Ar, He, H2) toreport on photon absorption and requires that analyte molecules be cooled tocryogenic temperatures so that the messenger species can bind non-covalentlyprior to laser irradiation. A careful choice of tag species ensures that (1) theabsorption bands of the analyte are not perturbed significantly by the presence ofthe tag and (2) the analyte molecules are sufficiently cold prior to binding, due tothe low binding energy between the analyte and tag molecules. Cryogenicallycooled analyte molecules have limited internal energy, reducing the number ofpossible conformations, and hence the spectral complexity. In addition, the lowbinding energy between the tag and analyte ensures that a single photon causesphotodissociation, due to the dramatically reduced dissociation energy threshold(see Fig. 1.10 center). The linearity of this method also allows for the directcomparison of experimental results with ab initio electronic structure calculations,which are heavily relied upon to deduce structural information from experimentaldata.
As one may surmise, IR predissociation spectroscopy is more technicallydemanding than IRMPD spectroscopy, as in addition to a tunable IR light sourceand a trapping mass spectrometer, a means is required to cool analyte molecules tocryogenic temperatures. However, significantly higher resolution can be obtained,with feature bandwidths circa a few cm-1. In addition, the predictable nature of thephotodissociation channels (i.e., the loss of the tag molecule) allows the experi-ment to be multiplexed. In contrast to IRMPD and IR–UV ion dip spectroscopy,where numerous photofragments can be generated, predissociation generallyresults in the loss of a single tag molecule without subsequent dissociation. Ifoverlaps in analyte m/z do not occur, in principle, the absorption spectra of severalmolecules can be measured simultaneously, dramatically increasing data collec-tion efficiency (discussed further in Chap. 4).
References
1. Lide DR (2011) CRC handbook of chemistry and physics: a ready-reference book of chemicaland physical data. CRC Press, Boca Raton
2. Giancoli D (2005) Physics: principles with applications. Upper Saddle River, Pearson/PrenticeHall
3. Atkins P, de Paula J (2006) Physical chemistry, 8th edn. W.H. Freeman, New York4. Carter R (1998) Molecular symmetry and group theory. J. Wiley, New York
1 Spectroscopy and the Electromagnetic Spectrum 19

5. Harris D (2007) Quantitative chemical analysis. W.H. Freeman and Co, New York6. Laidler K (1987) Chemical kinetics. Harper & Row, New York7. Stedwell CN, Galindo JF, Roitberg AE, Polfer NC (2013) Structures of biomolecular ions in
the gas phase probed by infrared light sources. Ann. Rev. Anal. Chem. 2013. 6:267–285.
20 C. N. Stedwell and N. C. Polfer

http://www.springer.com/978-3-319-01251-3