Spectroscopic photoacoustic imaging of lipid-rich plaques ... · Journal of Biomedical Optics...
11
Spectroscopic photoacoustic imaging of lipid-rich plaques in the human aorta in the 740 to 1400 nm wavelength range Thomas J. Allen Andrew Hall Amar P. Dhillon James S. Owen Paul C. Beard Downloaded from SPIE Digital Library on 21 May 2012 to 128.40.160.157. Terms of Use: http://spiedl.org/terms
Transcript of Spectroscopic photoacoustic imaging of lipid-rich plaques ... · Journal of Biomedical Optics...
Spectroscopic photoacoustic imaging oflipid-rich plaques in the human aorta inthe 740 to 1400 nm wavelength range
Thomas J. AllenAndrew HallAmar P. DhillonJames S. OwenPaul C. Beard
Downloaded from SPIE Digital Library on 21 May 2012 to 128.40.160.157. Terms of Use: http://spiedl.org/terms

Spectroscopic photoacoustic imaging of lipid-richplaques in the human aorta in the 740 to 1400 nmwavelength range
Thomas J. Allen,a Andrew Hall,b Amar P. Dhillon,b James S. Owen,c and Paul C. Bearda
aUniversity College London, Department of Medical Physics and Bioengineering, Gower Street, WC1E 6BT London, United KingdombRoyal Free Campus, UCL Medical School, Department of Cellular Pathology, Rowland Hill Street, NW3 2PF London, United KingdomcRoyal Free Campus, UCL Medical School, Division of Medicine, Rowland Hill Street, NW3 2PF London, United Kingdom
Abstract. Spectroscopic photoacoustic imaging has the potential to discriminate between normal and lipid-richatheromatous areas of arterial tissue by exploiting the differences in the absorption spectra of lipids and normalarterial tissue in the 740 to 1400 nm wavelength range. Identification of regions of high lipid concentration wouldbe useful to identify plaques that are likely to rupture (vulnerable plaques). To demonstrate the feasibility of visua-lizing lipid-rich plaques, samples of human aortas were imaged in forward mode, at wavelengths of 970 and1210 nm. It was shown that the structure of the arterial wall and the boundaries of lipid-rich plaques obtainedfrom the photoacoustic images were in good agreement with histology. The presence of lipids was also confirmedby comparing the photoacoustic spectra (740 to 1400 nm) obtained in a region within the plaque to the spectralsignature of lipids. Furthermore, a lipid-rich plaque was successfully imaged while illuminating the sample through2.8 mm of blood demonstrating the possibility of implementing the photoacoustic technique in vivo. © 2012 Society of
Photo-Optical Instrumentation Engineers (SPIE). [DOI: 10.1117/1.JBO.17.6.061209]
Keywords: photoacoustic imaging; photoacoustic spectroscopy; vulnerable plaques; lipid-rich plaques; atherosclerosis; intravascularimaging.
Paper 11527SSP received Sep. 20, 2011; revised manuscript received Nov. 18, 2011; accepted for publication Jan. 12, 2012; publishedonline May 7, 2012.
1 IntroductionAtherosclerosis is a chronic disease characterized by the pro-gressive buildup of plaque that begins in the inner lining ofthe arterial wall (intima).1,2 Most infarctions are instigated bythe rupturing of one or more atherosclerotic plaques, leadingto the formation of a partial or complete occlusive thrombus.Plaques that exhibit a greater propensity to rupture are termedvulnerable plaques and are usually characterized by a thinfibrous cap overlaying a soft lipid pool and an increased abun-dance of macrophages.3,4 In order to identify these plaquesunambiguously prior to rupture, knowledge of their composi-tion, as well as morphology, would be beneficial. Angiographyis widely used to determine the location of a stenosis dueto plaque buildup but does not provide structural or composi-tional information. Intravascular ultrasound (IVUS)5 canimage directly the full thickness of the arterial wall with highspatial resolution (<100 μm). Although it can reveal plaquemorphology and identify the presence of calcification, it pro-vides limited information relating to other constituents ofatherosclerotic plaques, such as lipids. Intravascular opticalcoherence tomography (OCT)6–8 can visualize plaque in coron-ary arteries with high spatial resolution (<10 μm). However, thepenetration depth is limited to approximately 1 mm due to opti-cal scattering, so it is unable to create images through the thick-est plaques. The ability of OCT to discriminate unambiguouslybetween lipid pools and calcifications can also be limited as both
provide similar contrast (low backscattering), resulting in thesharpness of boundaries being the principal means to distinguishbetween the two tissue types.7,9,10 It also requires the additionalstep of flushing the lumen of the vessel with saline to remove theblood prior to image acquisition. Other intravascular imagingmodalities include angioscopy, thermography, Raman spectro-scopy, and near-infrared (NIR) spectroscopy.9,11,12 These canprovide information relating to the superficial composition ofthe plaque, but not detailed depth resolved structural informa-tion. Non-invasive imaging methods include magnetic reso-nance imaging (MRI) and ultra-fast computed tomography(UFCT).11–13 MRI can provide information regarding thecomposition of the plaque, but it generally suffers from motionartifacts when imaging the coronary artery, and it requireslong acquisition times to obtain high-resolution images(<400 μm).14,15 UFCT imaging methods provide adequate reso-lution, and acquisition times are sufficiently short to minimizemotion artifacts but are limited to the detection of calciumdeposits and require ionizing radiation.
Photoacoustic imaging can provide both structural and com-position-related information based on optical absorption andthus offers the prospect of overcoming the limitations ofother methods16 for detecting vulnerable plaques. The techniqueinvolves illuminating the target tissue with nanosecond (ns)pulses of laser light. Absorption of the light creates a small loca-lized temperature increase followed by an initial pressure risethat subsequently relaxes, resulting in the emission of broad-band ultrasound waves. The detected photoacoustic signal pro-vides a measure of the spatial distribution of the absorbedAddress all correspondence to: Thomas J. Allen, University College London,
Department of Medical Physics and Bioengineering, Gower Street, WC1E 6BTLondon, United Kingdom. Tel.: +44 2076790291; E-mail: [email protected] 0091-3286/2012/$25.00 © 2012 SPIE
Journal of Biomedical Optics 061209-1 June 2012 • Vol. 17(6)
Journal of Biomedical Optics 17(6), 061209 (June 2012)
Downloaded from SPIE Digital Library on 21 May 2012 to 128.40.160.157. Terms of Use: http://spiedl.org/terms

optical energy, which is dependent principally upon the opticalabsorption properties of the tissue. By varying the wavelength ofthe laser source, spatially resolved spectroscopic informationcan therefore be obtained. The fundamental advantage of photo-acoustic imaging is that, by encoding optical contrast on toacoustic waves, it avoids the limited penetration depth of purelyoptical imaging techniques such as OCT since acoustic waves arescattered much less than light. At the same time, the spectro-scopic nature of the technique allows it to provide significantlyhigher contrast and specificity than conventional ultrasoundimaging. An early study showed that atheroma could be identi-fied using photoacoustic methods by exploiting the strong pre-ferential absorption that lipid-rich plaques exhibit in thewavelength range 420 to 530 nm17—the source of contrastbeing the presence of carotenoids, which are related to the pro-cess of lipid accumulation. However, as well as being a some-what indirect route to lipid detection, the use of these excitationwavelengths results in limited penetration depth in vascular tis-sue. They are also strongly absorbed by hemoglobin in blood.This would necessitate the use of a saline flush to deliver suffi-cient light to the vessel wall if implemented in vivo using anintravascular probe in a manner analogous to IVUS or OCT.Structural photoacoustic images of ex vivo vascular tissueshave been obtained at 532 nm, although it offers no discerniblediscriminatory ability in terms of composition.17 The 680 to900 nm spectral range has also been explored,18 the rationalebeing that features in the absorption spectrum of lipids withinthis wavelength range can be employed for discriminatory pur-poses. However, these spectral features are rather indistinct, sothe discrimination is relatively weak. In addition, although opti-cal absorption by blood is lower than that in the visible wave-length range, it is still sufficiently high to require the use of asaline flush.
Following these early studies, attention turned to the morepromising longer near infrared (NIR) wavelength range 740to 1400 nm, inspired by NIR spectroscopic studies of vasculartissue.19–22 There are several factors that suggest this spectralrange may be optimal for imaging lipid-rich plaques. First,the lipid absorption spectrum is well differentiated from thespectra of other constituents of vascular tissue, such as water,elastin, and collagen. This is particularly so at 1210 nm,where there is a large absorption peak. Second, although lipidsexhibit relatively strong absorption in this wavelength range, itis not so high as to limit penetration depth excessively, thusoffering the prospect of imaging through the full wall thicknessof even a severely stenosed vessel. Third, in this spectral range,absorption by blood is low and dominated by water rather thanhemoglobin and thus may obviate the need for a saline flush inan intravascular implementation. The prospect of exploiting the740 to 1400 nm wavelength range for photoacoustic imaging ofatherosclerosis was first reported by Allen and Beard in preli-minary studies23,24 and has since been explored in ex vivo studiesof rabbit aorta,25,26 porcine coronary arteries,27 and fresh humancoronary arteries.28 The purpose of the study reported in thispaper is twofold. The first goal is to corroborate these prelimin-ary findings by undertaking a study using a dedicated laboratorybench-top tissue characterization setup. The second is to obtainan indication of the imaging performance and discriminationthat might ultimately be achieved using an optimized detector,a rigorous approach to image reconstruction and processing andappropriate spectral analysis. To this end, spectroscopic photo-acoustic images in the range 740 to 1400 nm that reveal the full
thickness of postmortem human aortic samples and unambigu-ously visualize the shape and location of lipid pools in athero-matous plaques in accordance with histology were obtained. Afurther objective was to test the hypothesis that it is possible toobtain images of lipid-rich plaques through several millimetersof blood.
The spectral properties of the constituents of arterial tissuesas a basis for discrimination are discussed in Sec. 2, the experi-mental imaging system used is described in Sec. 3, and theresults of the tissue characterization studies undertaken are pre-sented in Sec. 4.
2 Optical Properties of Arterial TissueThe central hypothesis of this work is that the absorption spectraof lipids are sufficiently well differentiated from those of theconstituents of normal arterial tissue in the 740 to 1400 nmwavelength range to permit the detection of lipid-rich plaquesusing spectroscopic photoacoustic imaging. This hypothesisis supported by several studies in which the optical absorptionspectra of arterial tissue and lipids in the visible,29–32 andNIR33–35 wavelength range were measured. In the 740 to1400 nm wavelength range, these studies have reported absorp-tion peaks around 970 and 1180 nm in normal arterial tissue.These peaks correspond to the vibrational overtone of theO–H bonds of the water molecules (see Fig. 1), which compose70% of normal arterial tissue.36 The other principal chromo-phores present in normal arterial tissue are collagen and elastin.Their spectral signatures, also shown in Fig. 1, are relatively flatin the 900 to 1100 nm wavelength range with an absorption peakaround 1180 nm. Collagen and elastin together make up lessthan 25% of normal arterial tissue, and therefore their contri-bution to the absorption spectrum of normal arterial tissue issignificantly less than that of water. Lipids present in athero-sclerotic lesions are mostly composed of cholesteryl ester(48%), phospholipids (26%), cholesterol (20%), and, to a lesserextent, triglyceride (6%).37 The absorption spectra of these dif-ferent lipids are relatively similar and characterized by threeabsorption peaks around 920, 1040, and 1210 nm, which cor-respond to overtones of the stretching vibration mode of the C-Hbonds.19 These spectral features, especially the large absorp-tion peak at 1210 nm, suggest this wavelength range can beexploited to detect lipid rich plaques. In addition, absorptionby blood beyond 1100 nm is dominated by water absorption
Fig. 1 Absorption coefficient spectra of lipid, water, elastin, andcollagen.35
Journal of Biomedical Optics 061209-2 June 2012 • Vol. 17(6)
Allen et al.: Spectroscopic photoacoustic imaging of lipid-rich plaques : : :
Downloaded from SPIE Digital Library on 21 May 2012 to 128.40.160.157. Terms of Use: http://spiedl.org/terms

and is therefore relatively low. For example, at an excitationwavelength of 1210 nm, the penetration depth in blood, definedas the depth at which the irradiance has decreased by 1∕e, isapproximately 1.14 mm, whereas at an excitation wavelengthof 600 nm, the penetration is approximately 0.28 mm.38,39
This suggests that it may be possible to image the arterialwall through blood without the need for a saline flush.
3 Experimental Method
3.1 Experimental Setup
In this study, the acoustic resolution photoacoustic microscopy(AR-PAM) mode of photoacoustic imaging was used.16,40 Thisemploys a focused ultrasound receiver and mechanical scanningto map the photoacoustic signals over the tissue surface. A sche-matic of the experimental setup used to generate and detectphotoacoustic signals in arterial tissue is shown in Fig. 2.A fiber-coupled tuneable optical parametric oscillator (OPO)–based laser system was used to generate ns pulses in the 740to 1400 nm wavelength range. The fluence was approximately60 mJ∕cm2 when operating at an excitation wavelength of970 nm and 40 mJ∕cm2 when operating at an excitation wave-length of 1210 nm. The excitation pulses were delivered via aglass window to the intimal side of the tissue sample, which wasimmersed in a saline bath. The beam incident on the tissue sur-face was approximately 5 mm in diameter. A spherically focusedbroadband polyvinylidene fluoride (PVDF) ultrasound detector(25 MHz), with a focal spot diameter of approximately 240 μmand a focal length of approximately 24 mm, was used to detectthe generated photoacoustic signals in transmission mode.To obtain 2-D images, the tissue sample was mounted on acomputer-controlled translation stage and mechanically scannedalong a line in the x direction in steps of 500 μm. For eachscan step, the detected photoacoustic signal was amplified(40 dB), signal-averaged 20 times, and then downloaded to apersonal computer (PC). The axial resolution (limited by thetransducer bandwidth) was 75 μm. The lateral resolution is lim-ited ultimately by the 240 μm spot size of the transducer,although in this study, it was defined by the 500 μm scanstep size used to acquire the images. Photoacoustic spectrawere also obtained at a number of different points along thescan line, in the 740 to 1400 nm wavelength range and incre-ments of 20 nm. The spectra were corrected for the wavelength-dependent pulse energy of the laser system and normalized to
the amplitude of the measurements obtained at 960 nm. Thespectra were plotted using a spline curve interpolation method.
To investigate the possibility of generating and detectingphotoacoustic signals when illuminating the tissue samplethrough several millimeters of human blood to mimic intravas-cular conditions, the experimental setup was modified. The sal-ine bath was partitioned in two sections: one containing salineand the other containing outdated human blood obtained from ablood bank (see Fig. 3). The partition was an acoustically trans-parent wall made from a 5 μm thick polyvinyl chloride (PVC)film. Blood that had exceeded the expiry date of thirty dayssince donation was obtained from the local hospital and dilutedwith phosphate-buffered saline, providing a hematocrit concen-tration of at least 30%. The red blood cells were kept constantlycirculating, using a pump, to keep them from settling at thebottom of the cuvette.
3.2 Image Reconstruction and Processing
The detected photoacoustic signals were low-passed filtered(25 MHz), mapped to distance using the acoustic speed ofsound in normal arterial tissue (1; 575 m∕s41), and any dc-offsetremoved. The signals were then integrated to obtain a depth pro-file of the absorbed optical energy density. Each depth profile orA-line was corrected for the exponential decay of the light dis-tribution through tissue in a manner analogous to time-gaincompensation in ultrasound imaging. The correction wasachieved by dividing the A-lines by an exponential function,whose decay constant was selected to match that of theA-line in a region identified as normal tissue (near the rear bound-ary of the arterial wall). For the measurements obtained whenimmersing the tissue sample in blood, it was necessary to mod-ify the method used to correct for the light attenuation, due to thestrong background photoacoustic signal generated in blood.For these measurements, the rate of decay of the exponentialfunction was selected to match that of the A-line in an areaidentified as containing blood. Correcting for the light distribu-tion in this way prevented the background signal from dominat-ing the photoacoustic image allowing for the structure of thearterial wall to be revealed. A 2-D image was then formedfrom the corrected A-lines by converting the amplitude of thesignal to a grayscale and the low end of the scale bar wasset to zero to threshold negative image intensity values. Toreduce the image pixilation caused by the relatively large scan-ning steps (500 μm), the number of A-lines was also increased
Fig. 2 Schematic of the experimental setup. The tissue sample was scanned by translating it along the x direction.
Journal of Biomedical Optics 061209-3 June 2012 • Vol. 17(6)
Allen et al.: Spectroscopic photoacoustic imaging of lipid-rich plaques : : :
Downloaded from SPIE Digital Library on 21 May 2012 to 128.40.160.157. Terms of Use: http://spiedl.org/terms

by interpolation. The interpolation was performed using alow-pass filtering method provided by the “interp” functionwithin Matlab.
3.3 Tissue Preparation
The tissue samples were sections of human aortas fixed in for-malin and suspended in ethanol and were obtained from the UKHuman Tissue Bank (UKHTB). The start and finish points of thescan were marked on the tissue samples so that they could beregistered with histological sections. After the experiments, thetissue samples were embedded in a paraffin wax matrix, sec-tioned at 4 μm and stained using hematoxylin and eosin (H&E).
4 Results
4.1 Normal Arterial Tissue
A section of human aorta identified by visual inspection as nor-mal was opened out flat [Fig. 4(a)] and scanned over a distanceof 10 mm in steps of 500 μm. Figure 4(b) and 4(c) shows 2-Dphotoacoustic images obtained at excitation wavelengths of 970and 1210 nm, respectively. The excitation light was delivered tothe intimal surface of the tissue [the top surface in Fig. 4(b) and4(c)]. Both photoacoustic images show a wall thickness ofapproximately 2 mm and near uniform contrast. The latteris a consequence of water being the dominant chromophorein each of the three layers of normal arterial tissue (intima,
Fig. 3 Schematic of the experimental setup used when illuminating the sample through blood. The tissue sample was scanned by translating it along thex direction.
Fig. 4 (a) Photograph of a sample of normal human aorta. The horizontal dashed line represents the photoacoustic scan line. (b) Photoacoustic imageobtained at 970 nm. The irradiated side is the top surface. (c) Photoacoustic image obtained at 1,210 nm. (d) Histological section; the inset shows amagnified (630×) photograph of the media (A: elastic fiber, B: smooth muscle cell). (e) Photoacoustic spectra obtained at three different points (P1, P2,and P3).
Journal of Biomedical Optics 061209-4 June 2012 • Vol. 17(6)
Allen et al.: Spectroscopic photoacoustic imaging of lipid-rich plaques : : :
Downloaded from SPIE Digital Library on 21 May 2012 to 128.40.160.157. Terms of Use: http://spiedl.org/terms
media, adventitia) at both 970 and 1210 nm. The histologicalsection of the sample, which was obtained after the experiment,is shown in Fig. 4(d). This shows that the imaged cross-sectionis macroscopically relatively homogeneous, with no evidence ofatheromatous plaque in agreement with the photoacousticimages. In addition, an inset shows a magnified (630×) photo-graph of a region, where finer structures such as elastic fibersand smooth muscle cells (SMCs) that are characteristic of themedia in normal arterial tissue are evident.
Photoacoustic spectra (740 to 1400 nm) were obtained atthree different spatial points, as indicated on Fig. 4(c). The spec-tra are shown in Fig. 4(e). For all three points, the spectra arebroadly similar, with two main absorption peaks evident at 970and 1180 nm. These peaks correspond to the absorption peaks ofwater, which is the dominant chromophore in arterial tissue atthese wavelengths.
4.2 Atheromatous Plaques
To demonstrate the ability of the technique to characterize thestructure and composition of atheromatous plaques, two differ-ent samples of human aortas displaying raised soft atherosclero-tic lesions (as identified by visual inspection) were selected. 2-Dcross-sectional images were then acquired at 970 and 1210 nm.
Photoacoustic spectra in the 740 to 1400 nm spectral range werealso obtained at selected points within the lesion and the normalsurrounding tissue. The photoacoustic data were then comparedto histological sections of the tissue.
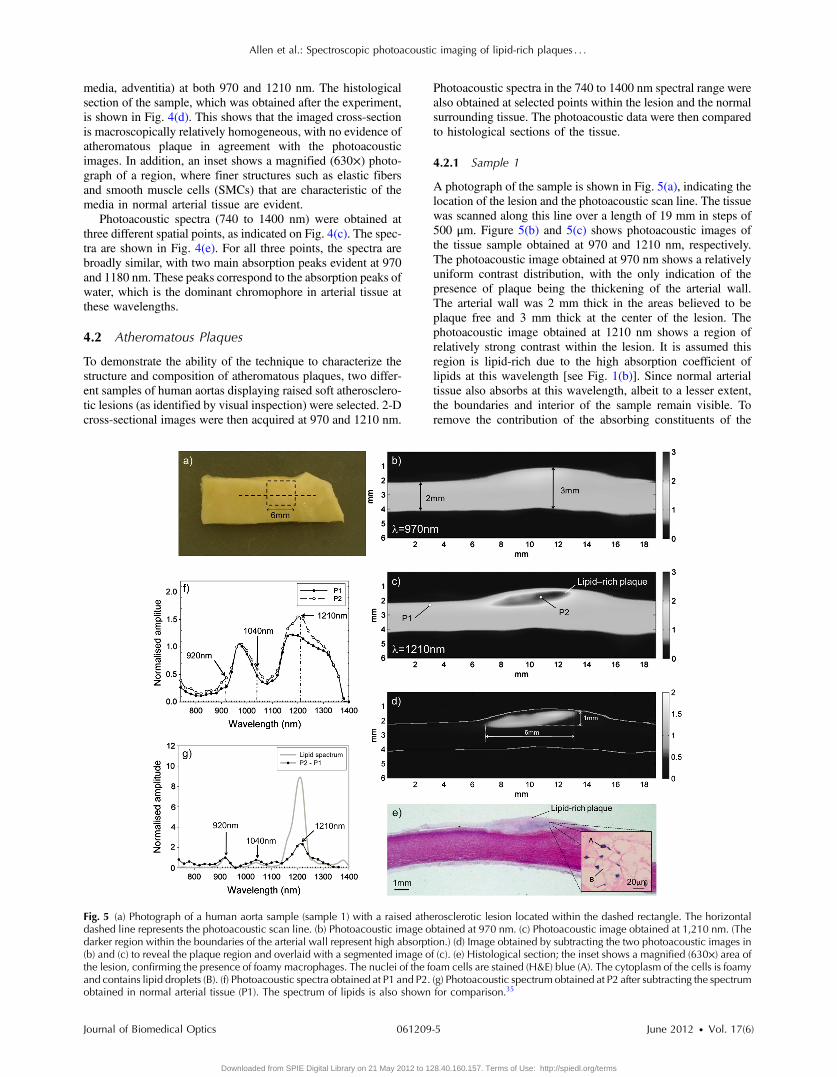
4.2.1 Sample 1
A photograph of the sample is shown in Fig. 5(a), indicating thelocation of the lesion and the photoacoustic scan line. The tissuewas scanned along this line over a length of 19 mm in steps of500 μm. Figure 5(b) and 5(c) shows photoacoustic images ofthe tissue sample obtained at 970 and 1210 nm, respectively.The photoacoustic image obtained at 970 nm shows a relativelyuniform contrast distribution, with the only indication of thepresence of plaque being the thickening of the arterial wall.The arterial wall was 2 mm thick in the areas believed to beplaque free and 3 mm thick at the center of the lesion. Thephotoacoustic image obtained at 1210 nm shows a region ofrelatively strong contrast within the lesion. It is assumed thisregion is lipid-rich due to the high absorption coefficient oflipids at this wavelength [see Fig. 1(b)]. Since normal arterialtissue also absorbs at this wavelength, albeit to a lesser extent,the boundaries and interior of the sample remain visible. Toremove the contribution of the absorbing constituents of the
Fig. 5 (a) Photograph of a human aorta sample (sample 1) with a raised atherosclerotic lesion located within the dashed rectangle. The horizontaldashed line represents the photoacoustic scan line. (b) Photoacoustic image obtained at 970 nm. (c) Photoacoustic image obtained at 1,210 nm. (Thedarker region within the boundaries of the arterial wall represent high absorption.) (d) Image obtained by subtracting the two photoacoustic images in(b) and (c) to reveal the plaque region and overlaid with a segmented image of (c). (e) Histological section; the inset shows a magnified (630×) area ofthe lesion, confirming the presence of foamy macrophages. The nuclei of the foam cells are stained (H&E) blue (A). The cytoplasm of the cells is foamyand contains lipid droplets (B). (f) Photoacoustic spectra obtained at P1 and P2. (g) Photoacoustic spectrum obtained at P2 after subtracting the spectrumobtained in normal arterial tissue (P1). The spectrum of lipids is also shown for comparison.35
Journal of Biomedical Optics 061209-5 June 2012 • Vol. 17(6)
Allen et al.: Spectroscopic photoacoustic imaging of lipid-rich plaques : : :
Downloaded from SPIE Digital Library on 21 May 2012 to 128.40.160.157. Terms of Use: http://spiedl.org/terms

normal tissue and isolate the lipid-rich region, the imagesobtained at 1210 nm and at 970 nm were subtracted fromeach other, as shown in Fig. 5(d). This difference image isalso overlaid with a segmented image of Fig. 5(b) to illustratethe location of the plaque within the boundaries of the arterialwall. The dimensions of the plaque were approximately 6 mm inlength and 1 mm in thickness. Figure 5(e) shows a photographof the histology section of the tissue sample. This confirms thepresence of a lipid-rich plaque of similar shape and size. Theinset shows a magnified image of a small region (110×130 μm2) of the lesion confirming the presence of lipid-engorged macrophages, called “foam cells,” which are one ofthe main constituents of lipid plaques. These cells have theirnucleus stained blue by the H&E and are characterized bythe foaminess of their cytoplasm which contains small vacuolesof lipid droplets.
Photoacoustic spectra were obtained at two different spatialpoints at wavelengths between 740 to 1400 nm as indicated onFig. 5(c). P1 corresponds to a region free of plaque, whereas P2corresponds to a region within the plaque. Figure 5(f) shows thespectra obtained at both of these points. The spectrum obtainedat P1 is similar to that shown in Fig. 4(e), where the broadabsorption peaks of water at 970 and 1180 nm are dominant.These water absorption peaks are also visible in the spectrumobtained at P2; however, increases in absorption are also evidentat 920, 1040, and 1210 nm, which correspond to the absorp-tion peaks of lipids. These absorption peaks are not as distinctiveas those in the lipid absorption spectrum in Fig. 1 becauseatherosclerotic plaques are complex lesions composed of a num-ber of different constituents, such as lipids, macrophages, andcalcium deposits as well as elastin, collagen, and water foundin normal tissue.1,2 Each of these constituents contributes to
Fig. 6 (a) Photograph of a human aorta sample (sample 2) with a raised atherosclerotic lesion located within the dashed rectangle. The horizontaldashed line represents the photoacoustic scan line. (b) Photoacoustic image obtained at 970 nm. (c) Photoacoustic image obtained 1,210 nm. (Thedarker region within the boundaries of the arterial wall represent high absorption.) (d) Image obtained by subtracting the two photoacoustic images in(b) and (c) to reveal the plaque region and overlaid with a segmented image of (c). The arrow labeled A indicates an area of extravascular fat. (e) Photo-acoustic spectra obtained at P1, P2, and P3. (f) Photoacoustic spectra obtained at P2 and P3 after subtracting the spectra obtained from normal arterialtissue (P1). The spectrum of lipids is also shown for comparison. (g) Photograph of the paraffin block prior to histological analysis. Photographs obtainedfrom the histology slide of (h) foam cells (A: nucleus of the foam cells and B: lipids contained in the cytoplasm of a foam cell), (i) cholesterol clefts (C:clefts) and (j) fibrous tissue and smooth muscle cells (D: nucleus of smooth muscle cells). The location of these foam cells, cholesterol clefts, and fibroustissue in (g) are labeled h, i, and j, respectively.
Journal of Biomedical Optics 061209-6 June 2012 • Vol. 17(6)
Allen et al.: Spectroscopic photoacoustic imaging of lipid-rich plaques : : :
Downloaded from SPIE Digital Library on 21 May 2012 to 128.40.160.157. Terms of Use: http://spiedl.org/terms

the photoacoustic spectra masking the absorption peaks oflipids. To observe the three absorption peaks of lipids moreclearly, the spectral features attributed to normal arterial tissuewere removed by normalizing the spectra obtained at P1 and P2to the 970-nm water absorption peak and subtracting the spec-trum obtained at P1 from that obtained at P2. The resultingdifference spectrum is shown in Fig. 5(g) and is in broad agree-ment with the spectra of lipids, providing further configurationof lipid content.
These results show that the technique can image the fullthickness of an atheromatous lesion with high contrast and spa-tial resolution and reveal the presence and morphology of apredominantly lipid-rich subsurface plaque.
4.2.2 Sample 2
The second tissue sample with a raised lesion was imaged alonga length of 20 mm in steps of 500 μm. A photograph ofthe sample is shown in Fig. 6(a). Figure 6(b) and 6(c) shows2-D photoacoustic images obtained at 970 and 1210 nm, respec-tively. The photoacoustic images obtained at 970 nm showrelatively uniform contrast, and once again, the only indicationof the presence of plaque is the thickening of the arterial wall.The wall thickness was measured from the photoacoustic imageto be 2 mm in the region believed to be plaque free and 2.7 mmat the center of the lesion. The photoacoustic image obtainedat 1210 nm shows an area of strong contrast suggesting the
presence of lipids. Figure 6(d) shows the location of the lipidpool within the boundaries of the vessel. As describedpreviously, this was obtained by subtracting the photoacousticimage obtained at 1210 nm from that obtained at 970 nm andoverlaying with a segmented image of Fig. 6(c). In Fig. 6(d), aregion of enhanced contrast was also present near the rearboundary of the arterial wall [labeled (A)], indicating the pre-sence of a region of extravascular fat. Photoacoustic spectrawere obtained from three different spatial points, as indi-cated on Fig. 6(c). P1 was taken from an area believed to beplaque-free, P2 and P3 were taken from areas believed tobe lipid-rich. All three spectra are shown in Fig. 6(e). The spec-trum obtained at P1 is very similar to that previously shown inFigs. 4(e) and 5(f) for plaque-free regions and dominated by theabsorption peaks of water at 970 and 1180 nm. The spectraobtained at P2 and P3 display dominant absorption peaks at970 and 1180 nm, which are also due to water absorption, aswell as less prominent peaks at 920, 1040, and 1210 nm,which suggest the presence of lipids in these regions. Onceagain, the absorption peaks of lipids are more apparent in thespectra obtained at P2 and P3 [see Fig. 6(f)] after subtractingthe normalized photoacoustic spectra obtained from a plaque-free region.
When the sample was initially being prepared for histologicalexamination, it was found to contain significant calcification,which would need to be dissolved in order to section the tissue
Fig. 7 Comparison of photoacoustic images of a human aorta sample (sample 2) with a raised lipid-rich plaque obtained when illuminating throughsaline and blood. Images obtained when illuminating the tissue sample through saline using an excitation wavelength of (a) 970 nm and (b) 1,210 nm.(The darker region within the boundaries of the arterial wall represent high absorption.) Photoacoustic images obtained through 2.8 mm of blood usingan excitation wavelength of (c) 970 nm and (d) 1,210 nm. (e) Photoacoustic image obtained at 1,210 nm when imaging through blood, overlaid with asegmented image of (c).
Journal of Biomedical Optics 061209-7 June 2012 • Vol. 17(6)
Allen et al.: Spectroscopic photoacoustic imaging of lipid-rich plaques : : :
Downloaded from SPIE Digital Library on 21 May 2012 to 128.40.160.157. Terms of Use: http://spiedl.org/terms
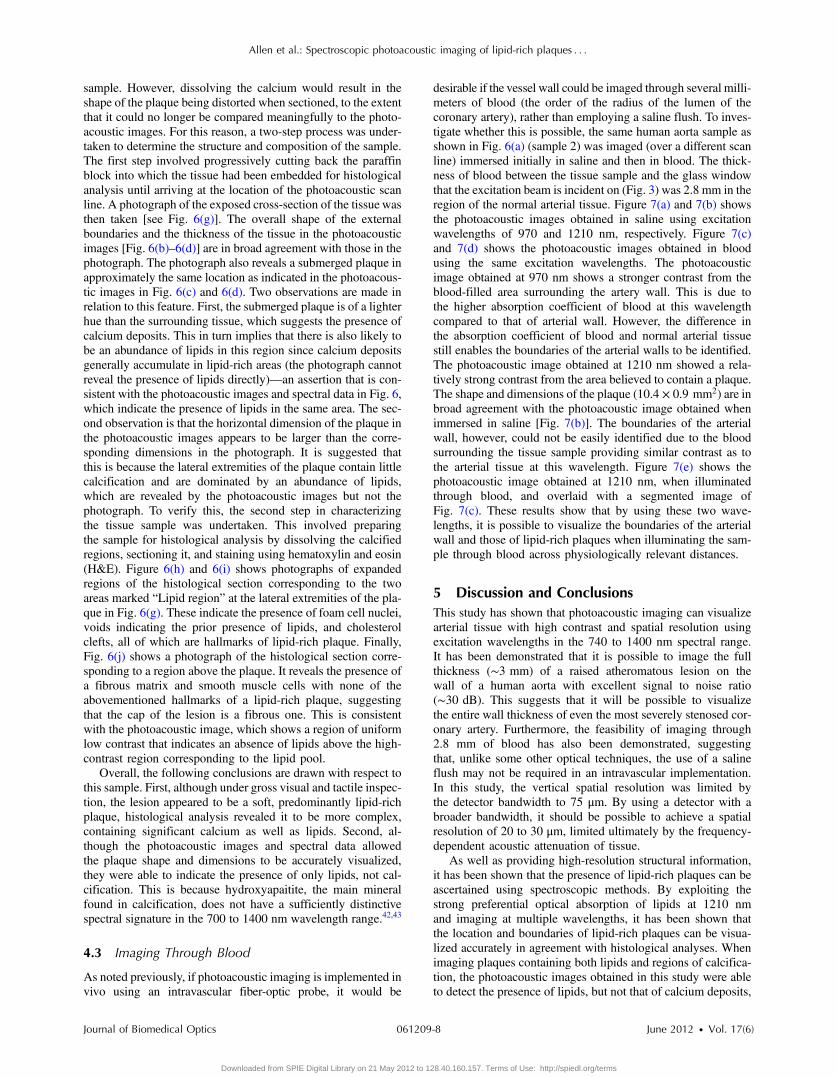
sample. However, dissolving the calcium would result in theshape of the plaque being distorted when sectioned, to the extentthat it could no longer be compared meaningfully to the photo-acoustic images. For this reason, a two-step process was under-taken to determine the structure and composition of the sample.The first step involved progressively cutting back the paraffinblock into which the tissue had been embedded for histologicalanalysis until arriving at the location of the photoacoustic scanline. A photograph of the exposed cross-section of the tissue wasthen taken [see Fig. 6(g)]. The overall shape of the externalboundaries and the thickness of the tissue in the photoacousticimages [Fig. 6(b)–6(d)] are in broad agreement with those in thephotograph. The photograph also reveals a submerged plaque inapproximately the same location as indicated in the photoacous-tic images in Fig. 6(c) and 6(d). Two observations are made inrelation to this feature. First, the submerged plaque is of a lighterhue than the surrounding tissue, which suggests the presence ofcalcium deposits. This in turn implies that there is also likely tobe an abundance of lipids in this region since calcium depositsgenerally accumulate in lipid-rich areas (the photograph cannotreveal the presence of lipids directly)—an assertion that is con-sistent with the photoacoustic images and spectral data in Fig. 6,which indicate the presence of lipids in the same area. The sec-ond observation is that the horizontal dimension of the plaque inthe photoacoustic images appears to be larger than the corre-sponding dimensions in the photograph. It is suggested thatthis is because the lateral extremities of the plaque contain littlecalcification and are dominated by an abundance of lipids,which are revealed by the photoacoustic images but not thephotograph. To verify this, the second step in characterizingthe tissue sample was undertaken. This involved preparingthe sample for histological analysis by dissolving the calcifiedregions, sectioning it, and staining using hematoxylin and eosin(H&E). Figure 6(h) and 6(i) shows photographs of expandedregions of the histological section corresponding to the twoareas marked “Lipid region” at the lateral extremities of the pla-que in Fig. 6(g). These indicate the presence of foam cell nuclei,voids indicating the prior presence of lipids, and cholesterolclefts, all of which are hallmarks of lipid-rich plaque. Finally,Fig. 6(j) shows a photograph of the histological section corre-sponding to a region above the plaque. It reveals the presence ofa fibrous matrix and smooth muscle cells with none of theabovementioned hallmarks of a lipid-rich plaque, suggestingthat the cap of the lesion is a fibrous one. This is consistentwith the photoacoustic image, which shows a region of uniformlow contrast that indicates an absence of lipids above the high-contrast region corresponding to the lipid pool.
Overall, the following conclusions are drawn with respect tothis sample. First, although under gross visual and tactile inspec-tion, the lesion appeared to be a soft, predominantly lipid-richplaque, histological analysis revealed it to be more complex,containing significant calcium as well as lipids. Second, al-though the photoacoustic images and spectral data allowedthe plaque shape and dimensions to be accurately visualized,they were able to indicate the presence of only lipids, not cal-cification. This is because hydroxyapaitite, the main mineralfound in calcification, does not have a sufficiently distinctivespectral signature in the 700 to 1400 nm wavelength range.42,43
4.3 Imaging Through Blood
As noted previously, if photoacoustic imaging is implemented invivo using an intravascular fiber-optic probe, it would be
desirable if the vessel wall could be imaged through several milli-meters of blood (the order of the radius of the lumen of thecoronary artery), rather than employing a saline flush. To inves-tigate whether this is possible, the same human aorta sample asshown in Fig. 6(a) (sample 2) was imaged (over a different scanline) immersed initially in saline and then in blood. The thick-ness of blood between the tissue sample and the glass windowthat the excitation beam is incident on (Fig. 3) was 2.8 mm in theregion of the normal arterial tissue. Figure 7(a) and 7(b) showsthe photoacoustic images obtained in saline using excitationwavelengths of 970 and 1210 nm, respectively. Figure 7(c)and 7(d) shows the photoacoustic images obtained in bloodusing the same excitation wavelengths. The photoacousticimage obtained at 970 nm shows a stronger contrast from theblood-filled area surrounding the artery wall. This is due tothe higher absorption coefficient of blood at this wavelengthcompared to that of arterial wall. However, the difference inthe absorption coefficient of blood and normal arterial tissuestill enables the boundaries of the arterial walls to be identified.The photoacoustic image obtained at 1210 nm showed a rela-tively strong contrast from the area believed to contain a plaque.The shape and dimensions of the plaque (10.4 × 0.9 mm2) are inbroad agreement with the photoacoustic image obtained whenimmersed in saline [Fig. 7(b)]. The boundaries of the arterialwall, however, could not be easily identified due to the bloodsurrounding the tissue sample providing similar contrast as tothe arterial tissue at this wavelength. Figure 7(e) shows thephotoacoustic image obtained at 1210 nm, when illuminatedthrough blood, and overlaid with a segmented image ofFig. 7(c). These results show that by using these two wave-lengths, it is possible to visualize the boundaries of the arterialwall and those of lipid-rich plaques when illuminating the sam-ple through blood across physiologically relevant distances.
5 Discussion and ConclusionsThis study has shown that photoacoustic imaging can visualizearterial tissue with high contrast and spatial resolution usingexcitation wavelengths in the 740 to 1400 nm spectral range.It has been demonstrated that it is possible to image the fullthickness (∼3 mm) of a raised atheromatous lesion on thewall of a human aorta with excellent signal to noise ratio(∼30 dB). This suggests that it will be possible to visualizethe entire wall thickness of even the most severely stenosed cor-onary artery. Furthermore, the feasibility of imaging through2.8 mm of blood has also been demonstrated, suggestingthat, unlike some other optical techniques, the use of a salineflush may not be required in an intravascular implementation.In this study, the vertical spatial resolution was limited bythe detector bandwidth to 75 μm. By using a detector with abroader bandwidth, it should be possible to achieve a spatialresolution of 20 to 30 μm, limited ultimately by the frequency-dependent acoustic attenuation of tissue.
As well as providing high-resolution structural information,it has been shown that the presence of lipid-rich plaques can beascertained using spectroscopic methods. By exploiting thestrong preferential optical absorption of lipids at 1210 nmand imaging at multiple wavelengths, it has been shown thatthe location and boundaries of lipid-rich plaques can be visua-lized accurately in agreement with histological analyses. Whenimaging plaques containing both lipids and regions of calcifica-tion, the photoacoustic images obtained in this study were ableto detect the presence of lipids, but not that of calcium deposits,
Journal of Biomedical Optics 061209-8 June 2012 • Vol. 17(6)
Allen et al.: Spectroscopic photoacoustic imaging of lipid-rich plaques : : :
Downloaded from SPIE Digital Library on 21 May 2012 to 128.40.160.157. Terms of Use: http://spiedl.org/terms

due to the spectrally indistinct nature of hydroxyapaitite in the700 to 1400 nm wavelength range. The acoustic properties of cal-cium deposits, however, are significantly different from those ofsoft tissue, so one might expect them to produce reverberation-type distortions in the photoacoustic image, which could poten-tially be exploited to signify the presence of calcification. That itwas not observed in this study may be because the relative con-centration of hydroxyapaitite was insufficiently large. Furtherstudies using a large number of samples with a greater varietyof lesions types are required to explore this in more detail. Ifphotoacoustic imaging is truly insensitive to this plaque compo-nent, then a multimodal approach combining photoacoustic ima-ging with pulse echo ultrasound or OCT may be required.
There are several future directions that may prove fruitful interms of increasing the diagnostic sensitivity and specificity ofthe technique. In this study, a relatively unsophisticated ad hocspectroscopic approach was employed: either a single excitationwavelength at the 1210 nm lipid absorption peak was employedto enhance selectively the contrast yielded by lipid-rich plaquesor difference imaging was used to isolate the plaque boundary.While this simple approach serves to reveal the spatial distribu-tion of the plaque, it does not provide a quantitative indication ofits lipid content. However, using a model-based inversion spec-troscopic inversion of the type previously used to quantifyhemoglobin and other chromospheres,44,45 it should be possibleto provide images of the absolute concentration of lipids. Aswell as providing a quantitative measure of lipid content,which may be related to plaque vulnerability, this may help dis-tinguish between plaques that are predominantly lipid-rich andthose that are more complex (containing, for example, fibrous orcalcified tissue as well as lipids). Although lipids represent themost obvious endogenous chromophore to target, other tissueconstituents with more subtle spectral features, such as collagenand elastin, could potentially be identified and quantified usingsuch spectroscopic methods, which are more sensitive than thesimple method used in this study. This would also assist in pro-viding more specific composition-related information for plaquecharacterization purposes. The strong optical absorption ofblood at wavelengths below 1000 nm could also be exploitedto visualize the structure and oxygen status of the vasa vasorumand detect intramural hemorrhages and explore their role inarterial disease. Through the use of spectrally distinct exogenouscontrast agents there is further potential to detect other compo-nents such as macrophages46–48 or specific biomolecules impli-cated in atherosclerosis.49
The challenge ahead in implementing the technique in vivolies in achieving the necessary level of miniaturization for intra-vascular use. Several miniature photoacoustic probes basedupon piezoelectric and optical ultrasound detectors of compar-able dimensions to those required for intravascular imaging inhuman coronary arteries have now been developed and evalu-ated in tissue phantoms and ex vivo tissues.28,50–52
In summary, it is considered that intravascular spectroscopicphotoacoustic imaging may find a role in the clinical detection,diagnosis, and treatment of arterial disease, either as a stand-alone technique or combination with existing intravascular ima-ging modalities.
AcknowledgmentsThe authors would like to thank Adrien Desjardins for his infor-mative comments. This work was funded by the Engineeringand Physical Sciences Research Council, UK. The authors
would like to acknowledge Dr. Richard Caro of TangibleFutureInc. for helpful early discussions relating to this work.
References1. C. K. Glass and J. L. Witztum, “Atherosclerosis. The road ahead,” Cell
104(4), 503–516 (2001).2. A. J. Lusis, “Atherosclerosis,” Nature 407(6801), 233–241 (2000).3. F. D. Kolodgie et al., “The thin-cap fibroatheroma: a type of vulnerable
plaque: the major precursor lesion to acute coronary syndromes,” Curr.Opin. Cardiol. 16(5), 285–292 (2001).
4. A. Tanaka, G. J. Tearney, and B. E. Bouma, “Challenges on the frontierof intracoronary imaging: atherosclerotic plaque macrophage measure-ment by optical coherence tomography,” J. Biomed. Opt. 15(1),011104 (2010).
5. S. E. Nissen and P. Yock, “Intravascular ultrasound: novel pathophysio-logical insights and current clinical applications,” Circulation 103(1),604–616 (2001).
6. G. J. Tearney, I.-K. Jang, and B. E. Bouma, “Optical coherence tomo-graphy for imaging the vulnerable plaque,” J. Biomed. Opt. 11(2),021002 (2006).
7. H. Yabushita, “Characterization of human atherosclerosis by opticalcoherence tomography,” Circulation 106(13), 1640–1645 (2002).
8. S. H. Yun et al., “Comprehensive volumetric optical microscopy invivo,” Nat. Med. 12(12), 1429–1433 (2006).
9. A. Maehara, G. S. Mintz, and N. J. Weissman, “Advances in intravas-cular imaging,” Circulation Cardiovasc. Interv. 2(5), 482–490 (2009).
10. I.-K. Jang et al., “Visualization of coronary atherosclerotic plaques inpatients using optical coherence tomography: comparison with intravas-cular ultrasound,” J. Am. Coll. Cardiol. 39(4), 604–609 (2002).
11. Z. A. Fayad and V. Fuster, “Clinical imaging of the high-risk or vulner-able atherosclerotic plaque,” Circ. Res. 89(4), 305–316 (2001).
12. F. Sharif and R. T. Murphy, “Current status of vulnerable plaque detec-tion,” Catheter. Cardiovasc. Interv.: Official Journal of the Society forCardiac Angiography and Interventions 75(1), 135–144 (2010).
13. J. Sanz and Z. A. Fayad, “Imaging of atherosclerotic cardiovascular dis-ease,” Nature 451(7181), 953–957 (2008).
14. K. C. Briley-Saebo et al., “Magnetic resonance imaging of vulnerableatherosclerotic plaques: current imaging strategies and molecular ima-ging probes,” J. Magn. Reson. Imaging 26(3), 460–479 (2007).
15. T. Saam et al., “The vulnerable, or high-risk, atherosclerotic plaque:noninvasive MR imaging for characterization and assessment,” Radiol-ogy 244(1), 64–77 (2007).
16. P. Beard, “Biomedical photoacoustic imaging,” Interface Focus 1(4),602–631 (2011).
17. P. C. Beard and T. N. Mills, “Characterization of post mortem arterialtissue using time-resolved photoacoustic spectroscopy at 436, 461 and532 nm,” Phys. Med. Biol. 42(1), 177–198 (1997).
18. S. Sethuraman et al., “Spectroscopic intravascular photoacousticimaging to differentiate atherosclerotic plaques,” Opt. Express 16(5),3362–3367 (2008).
19. J. D. Caplan et al., “Near-infrared spectroscopy for the detection of vul-nerable coronary artery plaques,” J. Am. Coll. Cardiol. 47(8), C92–C96(2006).
20. S. Waxman, “Near-infrared spectroscopy for plaque characterization,”J. Intervent. Cardiol. 21(6), 452–458 (2008).
21. P. R. Moreno, Detection of lipid pool, thin fibrous cap, and inflamma-tory cells in human aortic atherosclerotic plaques by near-infrared spec-troscopy.,” Circulation 105(8), 923–927 (2002).
22. J. Wang et al., “Near-infrared spectroscopic characterization of humanadvanced atherosclerotic plaques,” J. Am. Coll. Cardiol. 39(8), 1305–1313 (2002).
23. T. J. Allen and P. C. Beard, “Photoacoustic characterisation of vasculartissue at NIR wavelengths,” Proc. SPIE 7177, 71770A1–71770A9(2009).
24. T. J. Allen et al., “Photoacoustic imaging of lipid rich plaques in humanaorta,” Proc. SPIE 7564, 75640C1 (2010).
25. B. Wang et al., “On the possibility to detect lipid in atherosclerotic pla-ques using intravascular photoacoustic imaging,” Conf. Proc.: AnnualIntl. Conf. IEEE Eng. Med. Biol. Soc. 2009, pp. 4767–4770, IEEE,Minneapolis (2009).
Journal of Biomedical Optics 061209-9 June 2012 • Vol. 17(6)
Allen et al.: Spectroscopic photoacoustic imaging of lipid-rich plaques : : :
Downloaded from SPIE Digital Library on 21 May 2012 to 128.40.160.157. Terms of Use: http://spiedl.org/terms

26. B. Wang et al., “Detection of lipid in atherosclerotic vessels using ultra-sound-guided spectroscopic intravascular photoacoustic imaging,” Opt.Exp. 18(5), 4889–4897 (2010).
27. H.-W. Wang et al., “Label-free bond-selective imaging by listening tovibrationally excited molecules,” Phys. Rev. Lett. 106(23), 1–4 (2011).
28. K. Jansen et al., “Intravascular photoacoustic imaging of human coron-ary atherosclerosis,” Opt. Lett. 36(5), 597–599 (2011).
29. M. Keijzer et al., “Fluorescence spectroscopy of turbid media:Autofluorescence of the human aorta,” Appl. Opt. 28(20), 4286–4292(1989).
30. M. J. van Gemert et al., “Optical properties of human blood vessel walland plaque,” Lasers Surg. Med. 5(3), 235–237 (1985).
31. M. R. Prince et al., “Preferential light absorption in atheromas invitro. Implications for laser angioplasty,” J. Clin. Invest. 78(1), 295–302(1986).
32. R. L. P. van Veen et al., “Determination of visible near-IR absorptioncoefficients of mammalian fat using time- and spatially resolved diffusereflectance and transmission spectroscopy,” J. Biomed. Opt. 10(5),054004 (2011).
33. I. F. Cilesiz and A. J. Welch, “Light dosimetry: effects of dehydrationand thermal damage on the optical properties of the human aorta,” Appl.Opt. 32(4), 477–487 (1993).
34. A. M. Nilsson et al., “Near infrared diffuse reflection and laser-inducedfluorescence spectroscopy for myocardial tissue characterisation,” Spec-trochimica acta. Part A, Mol. Biomol. Spectrosc. 53A(11), 1901–1912(1997).
35. C. Tsai, J. Chen, and W. Wang, “Near-infrared absorption propertyof biological soft tissue constituents,” J. Med. Biol. Eng. 21(1), 7–13(2001).
36. F. Duck, Physical Properties of Tissue: A Comprehensive ReferenceBook, Academic Press, Inc., San Diego (1990).
37. A. Orekhov et al., “Lipids in cells of atherosclerotic and uninvolvedhuman aorta,” Exp. Mol. Pathol. 42(1), 117–137 (1985).
38. A. Roggan et al., “Optical properties of circulating human blood in thewavelength range 400-2500 nm.,” J. Biomed. Opt. 4(1), 36–46 (1999).
39. M. Cope, “The application of near infrared spectroscopy to non invasivemonitoring of cerebral oxygenation in the newborn infant,” PhD thesisUniversity College London (1991).
40. H. F. Zhang et al., “Functional photoacoustic microscopy for high-reso-lution and noninvasive in vivo imaging,” Nat. Biotechnol. 24(7), 848–851 (2006).
41. Y. Saijo et al., “Acoustic properties of atherosclerosis of human aortaobtained with high-frequency ultrasound,” Ultra. Med. Biol. 24(7),1061–1064 (1998).
42. T. M. Coelho et al., “Characterization of natural nanostructured hydro-xyapatite obtained from the bones of Brazilian river fish,” J. Appl. Phys.100(9), 094312 (2006).
43. E. A. Genina, A. N. Bashkatov, and V. V. Tuchin, “Optical clearing ofcranial bone,” Adv. Opt. Technol. 2008, 1–8 (2008).
44. J. Laufer et al., “Quantitative spatially resolved measurement of tissuechromophore concentrations using photoacoustic spectroscopy: appli-cation to the measurement of blood oxygenation and haemoglobin con-centration,” Phys. Med. Biol. 52(1), 141–168 (2007).
45. J. Laufer et al., “Quantitative determination of chromophore concentra-tions from 2D photoacoustic images using a nonlinear model-basedinversion scheme,” Appl. Opt. 49(8), 1219–1233 (2010).
46. E. Yantsen et al., “Intravascular photoacoustic imaging with gold nano-particles,” 2007 IEEE Ultrasonics Symp. Proc., pp. 848–851, IEEE,New York, NY (2007).
47. B. Wang et al., “Plasmonic intravascular photoacoustic imaging fordetection of macrophages in atherosclerotic plaques,” Nano Lett.9(6), 2212–2217 (2009).
48. K. Douma, R. T. A. Megens, and M. A. M. J. van Zandvoort, “Opticalmolecular imaging of atherosclerosis using nanoparticles: shedding newlight on the darkness,” Wiley Interdisciplinary Reviews. Nanomed.Nanobiotechnol. 3(4), 376–388 (2011).
49. D. Razansky et al., “Multispectral optoacoustic tomography of matrixmetalloproteinase activity in vulnerable human carotid plaques,” Mol.Imaging Biol. (2011) 10.1007/s11307-011-0502-6.
50. A. B. Karpiouk, B. Wang, and S. Y. Emelianov, “Development of acatheter for combined intravascular ultrasound and photoacoustic ima-ging,” Rev. Sci. Instrum. 81(1), 014901 (2010).
51. B.-Y. Hsieh et al., “Integrated intravascular ultrasound and photoacous-tic imaging scan head,” Opt. Lett. 35(17), 2892–2894 (2010).
52. E. Z. Zhang and P. C. Beard, “Aminiature all-optical photoacoustic ima-ging probe,” Proc. SPIE 7899, 78991F (2011).
Journal of Biomedical Optics 061209-10 June 2012 • Vol. 17(6)
Allen et al.: Spectroscopic photoacoustic imaging of lipid-rich plaques : : :
Downloaded from SPIE Digital Library on 21 May 2012 to 128.40.160.157. Terms of Use: http://spiedl.org/terms