Spectroscopic Distinguishability, Forced Degradation ...
684
Spectroscopic Distinguishability, Forced Degradation Kinetics and LC-MS/MS degradation product characterizations involving 5-Fluorouracil and similar or affiliated compounds in relation to Environmental Concerns A Dissertation Presented to The faculty of the Graduate School University of Missouri-Columbia In Partial Fulfillment Of the Requirements for the Degree Doctor of Philosophy by Eddie LaReece Pittman Drs. Renee JiJi & Chung-Ho Lin Dissertation Supervisors MAY 2015
Transcript of Spectroscopic Distinguishability, Forced Degradation ...
i
Spectroscopic Distinguishability, Forced Degradation Kinetics and LC-MS/MS
degradation product characterizations involving 5-Fluorouracil and similar or
affiliated compounds in relation to Environmental Concerns
A Dissertation
Presented to
The faculty of the Graduate School
University of Missouri-Columbia
In Partial Fulfillment
Of the Requirements for the Degree
Doctor of Philosophy
by
Eddie LaReece Pittman
Drs. Renee JiJi & Chung-Ho Lin Dissertation Supervisors
MAY 2015
ii
The undersigned, appointed by the Dean of the Graduate School, have examined the dissertation entitled
Spectroscopic Distinguishability, Forced Degradation Kinetics and LC-MS/MS
degradation product characterizations involving 5-Fluorouracil and similar or
affiliated compounds in relation to Environmental Concerns
Presented by Eddie LaReece Pittman
A candidate for the degree of Doctor of Philosophy
And hereby certify that in their opinion it is worthy of acceptance.
________________________________________
Professor Renee JiJi, Advisor
_________________________________________
Professor Chung-Ho Lin, Co-Advisor
________________________________________
Professor Michael Greenlief
_______________________________________
Professor Carol Deakyne
________________________________________
Professor Gary Baker

iii
ACKNOWLEDGMENTS
I would like to pay special thanks to both advisors, Drs. Renee JiJi and
Chung Ho Lin, for their guidance and insight throughout this PhD process. The
process was not smooth nor was it easy but I was always told that anything worth
having would not be easy. My situation is kind of unique in that I was granted the
opportunity to get valuable supervision from two not just one adept researchers.
I would also like to express thanks to the entire JiJi/Cooley research group
for their steadfast support. A special thanks goes to recently departed Dr. Jian
Xiong, current group members, Ms. Mia Brown and Mr. Olayinka Oshokoya for
their beyond the call of duty support.
Finally, I would like to pay respect to my entire research committee for
devoting some of their valuable time towards my advancement towards this
academic achievement. Equal regard goes to the Graduate Admittance
Committee for giving me an opportunity to pursue my studies here when most
programs would not. I also want to express great gratitude to Disability Services
for their commitment towards assisting me with my advancement. Disability
services here at Mizzou are much more supportive than their average
counterparts at other major institutions. I also want to pay thanks to all of the
various miscellaneous programs and departments here at Mizzou which are
there to provide assistance in all those intangible areas which may have at least
an indirect effect on the progress of a student.
ii

iv
TABLE OF CONTENTS
Page
Acknowledgements page……………………………………………………………..ii
List of tables…………………………………………………………………………....v
List of figures…………………………………………………………………………..vi
List of schemes……………………………………………………………………….viii
Academic abstract……………………………………………………………………..ix
Chapters:
I. INTRODUCTION……………………………………………………………………...1
II. Spectroscopic Distinguishing……………………………………………………....10
ll.1 Introduction……………………………………………………………………….10
II.2 Experimental…………………………………………………………………......11
II.3 Results………………………………………………………………………...….15
II.4 Summary……………………………………………………………………........44
III. Forced Degradation Kinetics……………………………………………..…………45
lll.1 Introduction……………………………………………………………………….45
III.2 Experimental……………………………………………………………………..46
III.3 Results………………………………………………..…………………………..49
III.4 Summary……………………………………………………………………….…67
IV. LC-MS/MS Characterizations………………………………………………………..69
lV.1 Introduction…………………………………………………………………….....69
iii

v
IV.2 Experimental………………………………………………………….…………70
IV.3 Results………………………………………………………………………......76
IV.4 Summary……………………………………………………………………......98
References…………………………..……………………………………………...104
Appendix…………………………………………………………….. ………...107-671
Vita…………………………………………………………………………………....672
iv

vi
LIST OF TABLES
1 Experimental and Theoretical IR and Raman results……………………………30
2 Calculated cross sections (5-FU)…………………………………………………..34
3 Calculated cross sectional results for GCV……………………………………….39
4 5-FU tautomeric data ……………………………………………………………….43
5 LC Ion MRM analysis………………………………………………………………..72
6 Degradation study table……………………………………………………………102
v

vii
1 UV experimental and theoretical spectra (5-FU)…………………………………17
2 UV experimental and theoretical spectra (GCV)………………………………….20
3 IR experimental and theoretical spectra (5-FU)…………………………………..21
4 Raman experimental and theoretical spectra (5-FU)…………………………….25
5 IR experimental and theoretical spectra (FBAL)………………………………….26
6 IR experimental and theoretical spectra (GCV)…………………………………..27
7 Raman experimental and theoretical spectra (GCV)…………………………….31
8 Raman cross sectional spectra (5-FU)…………………………………………….35
9 Raman excitation profile for GCV…………………………………………………..38
10 NMR experimental and theoretical spectra (5-FU)……………………………….40
11 UV spectra for Thermal/Alkali study………………………………………………..51
12 UV deviation from mean spectra for Thermal/Alkali study……………………….52
13 UV spectra for Thermal/Acidic study……………………………………………….54
14 UV deviation from mean spectra for Thermal/Acidic study……………………...55
15 UV spectra for Thermal/Saline study………………………………………………56
16 UV deviation from mean spectra for Thermal/Saline study……………………..57
17 UV spectra for Photo/Alkali study………………………………………………….60
18 UV deviation from mean spectra for Photo/Alkali study…………………………61
19 Preliminary 5-FU in NH4OH, Urea and (NH4)2SO results……………………...62
20 C13nmr of 5-FU-Tris………………………………………………………………...63
21 ACD nmr predictions for 5-FU-Tris via nitrogen………………………………….64
22 ACD nmr predictions for 5-FU-Tris………………………………………………...65
23 (b,c,f,i,l) LC method development graphs……………………………………73,74;75
LIST OF FIGURES
vi

viii
24 (a-d) LC calibration (concentration) graphs(rest in Appendix)………………78; 79
25 (a-iii;iii(1-90)) LC calibration product chromatograms(in Appendix)……….107-256
26 (a-d) LC Thermal/Alkaline study graphs(P.C.G in Appendix/257-371)…….80-83
27 (a-d) LC Thermal/Acidic study graphs(P.C.G. in Appendix/372-466)…..….86-89
28 (a-d) LC Thermal/Saline study graphs(P.C.G. in Appendix/467-566)………90-93
29 (a-d) Photo/Alkali study LC graphs(P.C.G. in Appendix/567-671)………….94-97
vii

ix
LIST OF SCHEMES
1 5-FU structure…………………………………………………………………3
2 GCV structure…………………………………………………………………6
3 FBAL structure………………………………………………………………..9
viii

x
ACADEMIC ABSTRACT
5-Fluorouracil (5-FU) is a commonly used antiviral and anticancer drug. 5-
FU is believed to exist in various tautomeric forms, which are believed to
contribute to 5-FU’s cytotoxicity. In order to understand the activity of 5-FU in
biological and environmental settings, a combined theoretical and experimental
approach was used to determine the predominant tautomer in aqueous
environments. Spectral characterization of 5-FU will enable development of
improved analytical methods for 5-FU. The structures of the 6 most relevant
tautomers of 5-FU were optimized using DFT (B3LYP/6-311++G(d, p)) and their
respective UV absorption, IR, Raman and NMR spectra calculated. The UV
resonance Raman spectrum of 5-FU is also reported. The C=O (1711(cm-1)),
C=C (1673(cm-1)) and C-N (1463(cm-1)) and N-H (1510(cm-1)) stretching
frequencies are strongly enhanced in the deep UV resonance Raman spectrum
of 5-FU. Comparison of the theoretical spectra with measured UV absorption, IR,
UV Raman and NMR indicate that the 5-FU keto tautomer is the predominant
species in aqueous environments.
Four applicable set of environmental conditions were applied towards 5-
FU which all produced results that can be used to help further the overall
agenda. Thermal/Saline and Photolytic/Alkali both completely degraded 5-FU but
Thermal/Saline did it quicker. While the Thermal/Alkali caused some degradation
over the course of a week, Thermal/Acidic didn’t come close to matching over the
same period of time. Synergism was demonstrated and definitely raises even
more concerns regarding the realistic adverse potential these sort of compounds
ix

xi
may have once they make their way into the environment; thus, this study’s
statement was mad
x
1
CHAPTER 1
1.1 INTRODUCTION
Until recently, the Environmental Protection Agency (EPA) and other
similar authorities have been primarily concerned with monitoring and regulating
a relatively small number of “priority” pollutants in the nation’s air, water and soil
[1]. This effort has largely ignored Pharmaceutical and Personal Care Products
(PPCPs) that may enter the environment via sewage, waste water plants and
hospital estuaries making PPCPs a risk of great importance. Once exposed to
the environment, they may undergo unpredictable transformations when mixed
with either other PPCPs, or their metabolites. Some PPCPs alone have been
shown to be endocrine disruptors [2-4], cause neurological toxicity in humans.
Additionally, these agents are known to cause ecological problems [2]. Thus,
there is a clear demand for increased knowledge in this area.
Miege et al.[5] reviewed 117 research papers and reports examining the
removal of PPCPs at wastewater treatment plants (WWTPs). The reports largely
focused (115 out of 117) on the removal of hydrophilic PPCPs from the aqueous
phase. Hormones, analgesics, and antibiotics were reported with the greatest
frequency. They studied the processes that are designed to remove hydrophilic
PPCPs within WWTPs but acknowledged they only took into account a fraction of
PPCPs that may be in WWTPs. Identifying and quantifying hydrophobic PPCPs
first requires appropriate detection methods.

2
5-fluorouracil (5-FU) is a cytostatic pharmaceutical (Scheme 1) known to cause
toxic reactions. It undergoes multiple reaction pathways and typically has
adverse side effects when it is administered to patients [6]. 5-FU was selected for
this study due to its widespread use and potentially far reaching environmental
effects. It is believed that this investigation will also serve to compliment the work
done [5].

3
N
N
O
OH
F
H
H
A B C
D E F
N
N
O
O
F
H
H
H
5-Fluorouracil(5FU)
Scheme 1. Cytostatic drug 5-fluorouracil (5-FU) and it’s 6 most recognized
tautomers [6].
N
N
O
OH
F
H
H
N
N
OH
O
F
H
H
N
N
OH
O
F
H
HN
N
OH
OH
F
H

4
Although some investigations of this, and similar compounds have already
commenced, there exists a great need for better understanding 5-FU’s fate and
how it degrades in the environment. Hirahara, et al. [7] performed a
photodegradation study on some environmentally hazardous pharmaceuticals,
including fenthion (O,O-Dimethyl O-[3-methyl-4-(methylsulfanyl)phenyl]
phosphorothioate), an organothiophosphate insecticide and avicide that is
structurally similar to 5-FU with a six-membered ring with three substituents.
Fenthion, is also known to be neurotoxic like 5-FU and was shown to
photodegrade via two pathways to yield fenthion sulfoxide and 3-methyl-4-
methylthiophenol (MMTP). Hirahara et al. [7] then correlated that finding to
suggest that fenthion may easily degrade in river water or an eutrophic lake.
Bernadou et al. [8], used 19F NMR spectroscopy to study the urinary excretion of
5-FU and found a minimum metabolite concentration of 15 µM during the first 30
minutes and 3 µM after 12 hours.
Until recently, EPA and others have been primarily concerned with
monitoring and regulating a relatively small number of “priority” pollutants in the
nation’s air, water and soil [1]. Unfortunately, this effort has overlooked
Pharmaceutical and Personal Care Products (PPCPs) that may enter the
environment from a variety of sources (i.e. sewage, waste water plants and
hospital estuaries) making PPCPs a risk to public health. Ganciclovir
(GCV/Scheme 2) fits within the general scope of the PPCP category and is
specifically an antiviral used to treat infections of the eye. These compounds are
currently unregulated and their potential to interact with other agents in the

5
environment poses great risks to the health and safety of the general population.
5-FU is currently one of the popular anticancer agents with a usage rate of 74 to
300 kg/year for greater 23 million people[9]. On the other hand Ganciclovir is a
not as popular antiviral used to treat sight disorders and infection, but it is
categorized as a human carcinogen (cytoxic drug)[10]. This study is part of an
overall plan set to examine the combined application of computational methods,
liquid chromatography and Raman methods to study the properties of this
compound in an effort to better identify and quantify it. Since non-aqueous
solvents such as acetonitrile were used at various stages, this study may
complement the work of Miege et al. [5] by providing data on non-water soluble
compounds.
5-Fluorouracil is a commonly used cytostatic drug used to treat
chemotherapy patients, neck/gastrointestinal disorders and breast cancer[11]. 5-
Fluorouracil and another antineoplastic drug, tamoxifen together are the two
most commonly used anticancer drugs internationally. Cytotostatic agents are
indiscriminant in their arrest of the cell cycle. Therefore, the drugs intended effect
in a limited population of malignant cells has wider reaching unintended negative
consequences for healthy cells. Toxicity is severe, varied and can indeed be
lethal. Many drugs have thus far been detected in aquatic environments but only
a few cytostatic substances and no ecotoxicology data on cytostatic agents has
been reported. One unique challenge in the study of toxicology

6
Ganciclovir(GCV) [4]
Scheme 2. Anti-Viral drug Ganciclovir [4].

7
presents itself as drugs are metabolized. In addition to parent compound toxicity,
metabolic intermediaries, produced in vivo, may also exhibit cytotoxicity. 5-
Fuorouracil is known to break down to fluroacetaldehyde (Facet), fluoroacetic acid
(FAC), fluoromalonaldehydic acid (FMASAld), α-Fluoro-β-Alanine (FBAL/
Scheme3) and fluoride (F-). There is still much ambiguity regarding the in vivo
metabolic breakdown of 5-FU preceding the activity against preferably cancerous
cells. However, it is clear that FAC is the metabolite or chemical that directly acts
on cells and it is believed FBAL may be directly involved as well. However, the
scientific community has not reached consensus. Facet and FMASAID strongly
influence generation of FAC which ultimately leads to apoptosis. It is generally
established that potentially toxic drugs are detected within the environment within
the range of µg/L – ng/L [1] and 5-FU specifically has been measured with limit of
detection (LOD) and limit of quantification (LOD) at 0.02 ug/mL and 0.5 µg/mL
(LOQ), respectively [2]. Since there is a chance for 5-FU or any of its metabolites
to interact with each other or other compounds with similar mechanisms, there is
the risk for producing synergistic effects. There is a dire need to not only detect
the degradation products, but also to understand that these processes may occur
within the environment. This could help pave the way for ecotoxicological data
required for risk assessment plan to be published and eventual regulation of 5-
FU. Therefore, the research objectives for this research agenda are to
demonstrate systematic ways similar compounds may be distinguished, show the
effects combinations of various conditions may have on the degradation of 5-FU
8
and to characterize any degradation products formed from these degradation
processes.

9
α-fluoro-β-alanine
Scheme 3. 5-FU metabolite α-fluoro-β-alanine [6].

10
CHAPTER ll
SPECTROSCOPIC DISTINGUISHABILITY
ll.1 INTRODUCTION
This area of the research agenda may be the most fundamental because
identifying compounds spectroscopically in environmental matrices can be
complicated. Pharmaceuticals with similar functional groups as well as chemical
reactive groups may behave similarly with respect to interactive patterns with
other environmental constituents and conditions. Environmental transport and
ultimate fate obviously may also be similar with respect to similar drug analytes,
therefore; the ability to discern different analytes within these complicated
matrices is an uphill battle.
The experimental approach here involves the use of a variety of
spectroscopic techniques which may, not only confirm, but provide
complementary information. For example, Raman and IR analysis may have very
similar or identical patterns peak formations from identical modes or functional
groups when analyzing the same sample. However, the intensity levels of each
mode may be vastly different between the two techniques. The use of different
techniques is beneficial where sampling matrices are different; for example water
vs. sludge.

11
ll.2 EXPERIMENTAL
ll.2a) UV spectroscopy was carried out on a Cary 50 UV Varian system 50
Bio UV-Vis Spectrophotometer. 5-fluorouracil (5-FU)(99%/Aldrich Chem. Co./
Milwaukee, WI) was prepared to ~ 0.1mM in aqueous solvent for UV analysis.
Ganciclovir (GCV) (InVivo Gen/ San Diego, CA) was prepared to ~ 0.0666mM in
aqueous solvent for UV analysis. Spectroscopic UV-Vis measurements were
recorded within the wavelength range of 190-900 nm for both prepared samples
along with respective blanks (18 MΩ water).
ll.2b) FT-IR spectroscopy was carried for solid state samples in form of
KBr pellets which were recorded from 400-4000(cm-1) on a Thermo Nicolet FTIR
Spectrometer (Madison WI, 53744). The KBr (sample) pellets were made using
5-FU, GCV; -Fluoro--Alanine(FBAL)(individually) solid sample and KBr which
together were first finely mixed using a mortar/pestle system then an amount
(only determined by the system itself and quality pellet desired through trial and
error) was compressed between 2 bolts within a large nut. The large nut (bolts
taken out) with the pellet still suspended in it was situated in the sample holder
area of the instrument so the pellet could be analyzed with the IR beam.
ll.2c) Ultra Violet resonance Raman (UVRR) analysis was carried out on a
custom designed UVRR spectrometer similar to those in prior literature[12, 13].
An adjustable frequency-quadrupled titanium-sapphire laser (Coherent Inc.,
Santa Clara, CA) was designated as the excitation source. The Ti: sapphire laser
was guided to a second harmonic generator (SHG) which doubles the frequency

12
via the use of a lithium triborate crystal. A dichroic mirror was then used to filter
the remaining IR laser beam from the SHG produced beam. These two beams
were then spatially overlapped within the third harmonic generator (THG) which
provided a beam of lower wavelength. The resultant beam was split from the rest
of the IR beam with another dichroic mirror. These two beams were spatially
overlapped which in turn yielded a frequency mixing within the fourth harmonic
generator (FHG) that produced a beam of lower wavelength. This beam which is
incident was then reflected was then mirror reflected in order to irradiate the
sample.
The samples circulated through a thermo-controlled chamber with kept
constant temperature at 4C. A thin layer of sample was produced as result of
the solution flowing through a 19 gauge needle and between two thin nitinol
wires. This layer of sample was irradiated directly by the locally reflected
incidental beam while a continuous stream of nitrogen gas eliminated ambient
oxygen from the sample chamber. The Raman scattering was collected within a
135 backscattering geometry and dispersed via a 1.25 meter spectrometer
(Horiba Jobin Yvon Inc., Edison, NJ) equipped with a 3600 grove/mm grating. At
the sample chamber, the laser power was kept below 0.5 mW by monitoring the
power with a Fieldmax II-TOTM laser power meter in order to avoid degrading the
sample. Each spectrum was collected over 180 minutes which produced 72
individual spectra that were averaged. The spectra were collected and exported
via a CSV format using Synergy software (Horiba Jobin Yvon Inc., Edison NJ).
The cyclohexane spectrum and the peak positions published by Ferraro and

13
Nakamoto were used for calibration of the spectra. A calibration spectrum was
collected for every collection session.
For the independent analysis, a 0.60mM 5-FU sample along with a
buffered blank was analyzed at an excitation wavelength of 197nm. For the
Raman Excitation Profile for the 197 series, spectroscopic analyses were
performed on 3-4 ml aliquots of the pre-prepared 0.50mM 5-FU and 50mM
HClO4– solution, at excitation wavelengths of 197, 199, 201, 203 and 205nm.
Aliquots of the corresponding buffer solution were also analyzed at each
excitation wavelength. For the Raman Excitation Profile for the 263 series, two
separate analyses were performed at each wavelength of 263, 265, 267, 269 and
271nm. This two-part analysis was required in order to measure all peaks of
interest because the C=O/C=C modes typically seen within one window at the
higher frequencies (at your lower excitation levels, ~197nm) do not appear within
one window. Since each analysis will yield a spectrum with only a window or
range of frequencies, a second analysis at each wavelength was needed in order
to see the adjoining spectral window range containing the C=O and C=C
vibrational modes not seen within the first.
For the independent analysis, a 0.50mM GCV sample along with a
buffered blank was analyzed at an excitation wavelength of 197nm. For the
Raman Excitation Profile for the 197 nm series, spectroscopic analyses were
performed on 3-4 ml aliquots of the pre-prepared 0.50mM GCV and 50mM
HClO4– solution, at excitation wavelengths of 197, 199, 201, 203 and 205nm.

14
Aliquots of the corresponding buffer solution were also analyzed at each
excitation wavelength.
ll.2d) NMR Spectroscopy analyses of 1.88mg of 5-FU(62.3mM) dissolved
in 1ml of D2O were carried out on a Bruker Avance model ARX-250 NMR
instrument (Bruker Corporation Fremont, CA 1998) at ambient probe
temperature. Shimming calibration was done on the D2O solvent and chemical
shifts were reported in units of parts-per-million (ppm). This process which was
not anticipated, was implemented in order to confirm that the 5-FU sample
analyzed in this study exist predominantly as the keto-tautomer.
ll.2e) Computationally, six 5-FU tautomers along with a GCV model were
constructed using ChemBio 3D Ultra (Version 12.0 1986-2009 CambridgeSoft)
and were optimized geometrically and energetically using the DFT/B3LYP/6-
311++G(d, p) method [14,15] through a GaussView 5.08 graphical interface
(Gaussian, Inc./2000-2008 Semichem, Inc.) with the Gaussian 09(Gaussian, Inc.
Wallington, CT 1995) program. These GaussView/Gaussian calculations were
performed directly on the Clark BioInformatics Consortium applications server
(The Curators of University of Missouri 2003-2012). In regards to infrared,
Raman and 13C NMR spectra predictions, calculations were performed using
density functional theory (DFT) at the B3LYP/6-311++G(d, p) level on the most
stable 5-FU tautomer structures and GCV structure optimized at this level. An
additional NMR prediction was carried out through ACD CNMR Predictor
(Advanced Chemistry development, Inc./Informer Technologies Inc. Toronto,

15
Ontario, Canada 2012) which involved uploading of the optimized 5-FU tautomer
as a “.gjf” file followed by the application of a Gaussian Interface.
ll.3 RESULTS
11.3a) UV Absorption Analysis of 5-FU involved theoretical optimizations
was carried out on six different 5-FU tautomers (Scheme 1). The optimized
structures (tautomers A through F) were then subjected to electronic transition
calculations (UV-Visible predictions). Of the 6 tautomers, only two were
comparable with the experimental result, tautomer A, the keto conformer, and
tautomer D, one of the enol conformers. The predicted excitation maximum for
both tautomers occurred at approximately 135 nm (not shown), which is in the
vacuum UV region and outside the functional range of the absorption
spectrometer. However, the second and third excitation maxima in the theoretical
spectra (Figure 1) are qualitatively similar to the experimental absorption bands
of 5-FU in the 190-300 nm region.
The experimental UV absorption spectrum (Figure 1) demonstrates that 5-
FU has two absorption maxima that occur at approximately 215 and 275 nm,
corresponding to two separate electronic transitions within the molecule.
Qualitatively, the theoretical intensities of the two bands for tautomer A match
more closely with the experimental spectrum, suggesting the predominant form is
the keto form. This results are consistent with previous studies, which have also
reported an absorption maxima for 5-FU around 270 nm [2] [1].

16
Assuming that the two experimental absorption maxima are chiefly due to
excitation of the two C=O functional groups of the 5-FU molecule (the C=C
functional group would give rise to excitation at lower frequencies not scanned),
the UV spectra should show absorption bands as a result of to * and n to *
transitions. The to * transition requires more energy than n to * and should
be dominant over the n to * absorption band if there are two C=O functional
groups within the molecule. Since the to * transition requires more energy, its
absorption band should have a lower wavelength (blue shift) than the n to *
absorption band and as seen is more intense than the other peak. Conversely, if
there were only one C=O (an enol form) then the n to * absorption

17
Figure 1. Theoretical (tautomerA/D) and observed UV-Vis spectra for 5-FU. The theoretical spectrum was calculated with DFT/B3LYP/6-311++G(d,p).

18
band (2nd band) should be more intense than the first. Figure 1 also shows that
the experimental band intensities are not consistent with an enol or tautomer D
form, though there are reasonable qualitative similarities.
Now in relation UV analysis of Ganciclovir (GCV), two reference UV
spectra for GCV were found as seen in figure 2. Looking at the reference
spectra in comparison with our experimental, qualitatively, a near perfect
correlation is seen and the excitation maximums among all three spectra are
roughly the same (253nm for this study, 254nm for mtnviewfarm.net[16]; 252nm
from Ijcas [17]). This study’s GCV experimental has a λ max of ~ 253 nm and
mtnviewfarm.net[16] has λ max of ~ 254 Additionally, both experimental spectra
are internal consistent with one another and qualitatively similar. Ganciclovir has
many areas of its structure which can interact with a particular solvent which
would yield an effect on the positioning of peaks deriving from n →π* and π → π
*. GCV is a polar hydrophilic compound and polar solvents will cause the π → π
* transition to shift to a greater extent in the red while the n → π * goes to a
greater extent to the blue compared to the effect the solvent would have on
smaller polar hydrophilic compounds. This situation may be due in part to the fact
that overlapping of the two different peaks within the experimental UV spectra
was observed (figure 2).

19
11.3b) The FTIR spectrum of 5-FU has two strong features that occurred
at 1248 and 1663(cm-1). A shoulder at 1722(cm-1) is apparent on 1663(cm-1)
feature. This feature is likely a combination of the C=O and C=C stretching
frequencies, which are predicted to occur at 1806, 1780 and 1711(cm-1),
respectively for tautomer A. However, it should be noted that bands arising from
the C=O stretching frequency (1784(cm-1)), N=C stretching frequency (1664(cm-
1)) and C=C stretching frequency (1624(cm-1)) for tautomer D are also predicted
to occur in this region. The other strong feature in the FTIR spectrum of 5-FU
occurs at 1248(cm-1) (Figure 3), which is assigned to the C-F stretching
frequency. The position of the C-F stretching frequency is predicted to occur at
1256 and 1264(cm-1) for the A and D tautomers, respectively. The C=C
stretching frequency is predicted to occur at lower frequency than the C=O
stretching frequency. The feature at 1506(cm-1) is may be the C=C stretching
frequency. Unfortunately, the peak(s) in the 2900-3400(cm-1) range are most
likely due to moisture adsorbed by the KBr, the weaker NH stretching
frequencies are arguably intertwined and overlapped within this area.

20
Fig. 2. This study’s UV-Vis spectrum on 0.067mM 5-FU versus prior studies [16;17].
Ref. 16
Ref. 17

21
Figure 3. Theoretical and experimentally measured IR spectra of 5-FU.
Experimentally measured spectrum of 5-FU in solid phase (top panel) and
theoretical spectra calculated at DFT/B3LYP/6-311++G(d,p) level on tautomer
A(middle panel) and tautomer D (bottom panel).
Wavenumbers (cm - 1)

22
A prior study [18] identified their three IR predictions(using different
methods) in support of their experimental as being appreciable and consistent
with respect to 5-FU’s most distinct stretching frequency peaks (C=O, C6-H and
C-F). There are three stretching frequency peaks that are consistent between the
experimental IR and theoretical band positions. In Figure 7, there are arguably
two NH stretching frequencies giving rise to multiple peaks in the 3500-3650(cm-
1) region and in the 1690-1750(cm-1) vicinity (Figure 3) there are the obvious
C=O stretching frequencies and the smaller partially overlapping peak to the left
of which at ~1600(cm-1) may be due to C4=C5 stretching frequency. This study’s
Raman results (Figure 4) have at least four modes of strong consistencies
between the experimental and theoretical spectra. These scattering bands 26, 27
(1700-1750(cm-1)) for both C=O stretching frequencies, 17 (~1350(cm-1)) for C4F7
stretching frequency and 12 (~750(cm-1)) for N9C1N2 bending/stretching
frequencies. Thus, this study’s significance has been demonstrated using unique
methods which were validated in a similar manner as Palafox and Rastogi [18]
showed.
This study’s other two compounds of interest can easily be distinguished
from each other and 5-FU because for one α-fluoro-β-alanine (FBAL) has only
one C=O stretching frequency at ~ 1767(cm-1) (figure 5) while GCV’s FTIR
spectrum’s most significant peak is at ~ 1248(cm-1) (Figure 6) which may be
mainly due to the compound’s CF component. The other key factors giving rise to
peaks were due to ring bending at 1072(cm-1) and those resulting from the OH
stretching. Even though, the region where the OH stretching frequency is

23
observed is significantly obscured by peaks from moisture from the air, the
contribution from GCV OH stretching frequencies are arguably observed with the
more intense peaks(3181, 3385; 3431 (cm-1)).
ll.3c) Resonance Raman spectroscopy has the advantage of lower
detection limits than normal Raman spectroscopy when resonance enhancement
occurs. Although all of the Raman modes are present in the resonance Raman
spectrum, the resonance enhanced modes will dominate the spectrum. The
position of the Raman bands will be the same in the normal Raman and
resonance Raman spectra, though the relative intensities will differ greatly. The
UV resonance Raman spectrum of 5-FU has a number of distinct features.
The lowest frequency band visible in the UVRR spectrum of 5-FU
occurred at 759(cm-1). This feature is relatively weak but assigned to C-F
stretching frequency, though N2-C1-N9 bending frequency is also predicted to
contribute in this region. Above the perchlorate band (932(cm-1)), another weak
feature occurred at 1008(cm-1). This feature may be assigned to CN and CH
combinatory stretching frequencies as supported by prior literature [18, 19] and
theory.
Three bands were apparent in the region from 1100-1400(cm-1), which
occurred at 1226, 1256 and 1349(cm-1) (Figure 4). Based on the IR spectrum of
5-FU (Figure 3), in which the C-F stretching frequency occurs at 1248(cm-1), the
band at 1256(cm-1) is assigned to the C-F stretching frequency of 5-FU. The
theoretical Raman spectra of tautomers A and D also have features in this region
that are derived from the C-F stretching frequency (Figure 3 and Table 1). The

24
lower frequency band at 1226(cm-1) is assigned to a combination of CH and CN
stretch/bending frequencies as well.

25
Figure 4. Theoretical (tautomer A/D) and experimentally measured Raman
spectra for 5-FU.The experimental spectrum was obtained at a concentration of
600uM using an excitation wavelength of 197nm (top panel) with inset (D2O
solvent analysis). Theoretical spectra for tautomers A and D were calculated at
DFT/B3LYP/6-311++G(d,p) level (bottom panel).
Raman shift (cm - 1)

26
Figure 5. Theoretical and experimentally measured IR spectra of FBAL. Experimentally measured spectrum of FBAL in solid phase (top panel) and theoretical spectra calculated at DFT/B3LYP/6-311++G(d,p) level (bottom panel).
Wavenumbers (cm - 1)

27
Figure 6. Theoretical and experimentally measured IR spectra of GCV. Experimentally measured spectrum of GCV in solid phase (top panel) and theoretical spectra calculated at DFT/B3LYP/6-311++G(d,p) level (bottom panel).
Wavenumbers (cm - 1)

28
Two features at 1463 and 1510(cm-1) can be assigned to a combination of
C-N stretching and N-H bending frequency. The C5-N9 stretching and N9-H12
bending frequency is predicted to occur at 1423(cm-1). The 1600-1800(cm-1)
region of the UVRR spectrum of 5-FU has two features that occur at 1673 and
1711(cm-1) (Figure 4). Based on the predicted Raman spectra, the C=O
stretching frequency (tautomers A and D) and possibly the C=C stretching
frequency (tautomer A) should occur in this region. Deuterium exchange was
employed to determine which peak(s) derived from the C=O stretching
frequencies as these peaks should downshift up H/D exchange. The inset in
Figure 4 shows that upon H/D exchange the higher frequency peak downshifts
underneath the main band at 1678(cm-1). The peak appears asymmetrical and is
slightly upshifted from 1673 to 1678(cm-1), likely because it is a combination of
two bands. The band at 1711(cm-1) is assigned to C=O stretching frequency
based on its downshift in D2O. The lack of a shift of the band at 1673(cm-1)
suggests this band arises from C=C stretching frequency.
The experimental results from the UV Resonance Raman (UVRR)
analysis are very much consistent for the most part with the theoretical results in
regard to mode placement as seen in Figure 7 Preliminary analysis was
performed for experimental Raman on GCV vs. the new theoretical
method(B3LYP/6-311++G(d, p))(Fig. 7). No published analysis or interpretations
of spectroscopic results for this compound are known. Hossenini et al. [20] have
published general observations of Raman analysis done with a confocal Raman
spectroscope. In that study, they revealed that ganciclovir exhilarated unique

29
spectral features at 631, 1263, 1302, 1448 and 1560(cm-1) compared to this
study’s distinct features at 1250, 1340, 1380, 1430, 1510, 1550 and 1590(cm-1).
Qualitatively, this study’s spectrum is, for most part, consistent with the spectral
profile of the Hosseini’s work [20]. It is hypothesized that differences in our
spectra may be attributed to effects of enhanced resonance.

30
Table 1
Summary of theoretical (tautomer A) and experimental IR and Raman spectroscopic results for 5-FU.
Mode Frequency (cm-1)
IR (Theory) (Intensity)
IR (Exp.) (Trans.)
Raman (Theory) (Intensity)
Raman (Exp./197 nm) (Intensity)
Atoms/bonds Involved
10 626.10 656.11
10.12 C3O9(b) C1O8(b)
12 743.87 8.12 20.01 N6C1N2(b) 13 749.43 C4C3(s)
C4F7(s) 14 758.70 61 C4F7(s)
N2C3C4(b) 15 811.20 1.012 C4F7(s) 16 913.96 0.512 C5H11(b) 17 968.00 1.011 C1N6(s) 18 1176.21 8.123 1.312 42 N6H12(b
C5H11(b) 19 1256.00 22.107 31 1.019 93 C4F7(s)
N6H12(b) C5H11(b)
20 1252.28 C4F7(s) N6C5(s)
21 1345.90 100.43 94 N2H10(s) C5H11(b)
N2C1N9(s) 23 1423.08 1.001 106 N6H12(b)
C5N6(s) 24 1498.90 2.012 194 C5N6(s)
N6H12(b) 25 1711.20 8.12 10 190.13 252 C5=C4(s) 26 1779.82 61.05 14 115.13 C3=O9(s) 27 28 29 30
1805.89
3593.23 3640.52
65.14
10.41 16.23
10
100.00
77
C1=O8(s) C5H11(s) N2H10(s) N6H12(s)

31
Figure 7. Theoretical and experimentally measured Raman spectra of GCV. Experimentally measured spectrum of 0.500mM GCV in aqueous solution (top panel) and theoretical spectra calculated at DFT/B3LYP/6-311++G(d,p) level (bottom panel).
Raman shift (cm - 1)
32
The Raman cross section were determined for 5-FU at several excitation
wavelengths (197, 199, 201, 203 and 205 nm) using the equation below.
ClO4 = std. C/S for ClO4, I= intensity, = freq. of an excitation wavelength,
C= concentration; A = UV absorbance
The strongest resonance enhancement was observed for the C4=C5
stretching frequency mode (1673(cm-1)) and the combination C5-N9 s/N9-H12
bending frequency mode (1510(cm-1)) (Table 2/Figure 8). However, the cross
section of combination C5-N9 s/N9-H12 bending frequency band appeared
relatively constant over range of excitation wavelengths. Similar trends were
observed for the majority of the bands in the UVRR spectra of 5-FU. The
exception are the features at 1673 and 1711(cm-1), for which the cross sections
increased with increasing excitation energy (decreasing wavelength).
Furthermore, this study’s Raman results in Figure 3 shows a C1=O peak at
1711(cm-1), both C4=C5 (predominantly) and C3=O at 1673(cm-1), N2H10 at
1510(cm-1), CH at 1349(cm-1), CF at 1256(cm-1) and ring/CF at 759.2(cm-1).
These findings are consistent for the most part with results from prior studies
such as that by Pavel et al. [19]. However, with respect to this study, important
differences exist between the C=C peak in this study overlapping the C3=O peak
at 1673(cm-1) and the CF peak possibly overlapping CH peaks at 1256(cm-1).
Discrepancies are also observed when comparing this study’s experimental and
theoretical findings which mainly serve as a means to help identify experimental
=

33
modes. This is the first study to use UVRR analysis on 5-FU which generates an
enhancement of certain modes not normally seen in regular Raman analysis and
is likely the cause of the observed differences in spectra.

34
Table 2. Calculated Raman cross sections versus the 932 cm-1 band of
perchlorate.
(nm) C1=O8 C4=C5(s) N6H12(b) C1N6(s) C4F7(s) C1N6(b) C4F7(s)
197 130 370 281 154 132 51 88
199 149 407 275 183 115 49 55
201 135 271 242 162 120 55 65
203 95 219 247 139 110 42 53
205 86 207 248 143 109 42 53
a = Wavelength of excitation energy.
b Millibarns/molecule steradian; 1 barn = 10-1.

35
Figure 8. Experimental Raman cross sectional calculations of modes from all
relevant peaks/modes from the 197 Series Raman Excitation Profile.
197 198 199 200 201 202 203 204 2050
50
100
150
200
250
300
350
400
450
Excitation wavelength (nm)
Ab
so
lute
Ram
an
Cro
ss-S
ecti
on
mb
arn
s/(
mo
lecu
les*s
tera
dia
n)
data1
data2
data3
data4
data5
data6
data7
C1=O8
C4=C5
N9H12(b)
C1N9(s)
CF(s)
C1N9(b)
CF(w)

36
This study’s Raman modes are closely consistent with Rastogi and
Palafox’s [18] assignments a C2=O peak at 1724(cm-1) (identified as C1=O in this
study) which has a lower intensity than the other C=O peak. This is due to the
fact that the C2=O functional group is blocked from influences created by the rest
of the molecule. Such shielding is achieved through the ring’s nitrogens on both
sides of the molecule. Likewise, the other C=O (C4=O) functional group is
influenced by the neighboring electronegative fluorine atom. Rastogi and Palafox
[18] made peak assignments at 1670(cm-1) to C4=O (which correlates to C3=O in
this study), C4=C5 at 1709(cm-1), N1H at 1503/1448(cm-1), N3H at 1348(cm-1),
C6H at 1256(cm-1), and CF/ring wagging at 1224(cm-1) and 767(cm-1). Pavel et al.
[8] had similar mode assignments with C2=O at 1786(cm-1), C4=O at 1770(cm-1),
C4=C5 at 1709(cm-1), N1H at 1487(cm-1), N3H at 1405(cm-1), C6H at 1334(cm-1),
CF at 1230(cm-1) and ring vibrational bending at 800(cm-1). Dobrosz-Teperek et
al. [21] claimed that both of their C=O modes were in the 1700(cm-1) vicinity,
C4=C5 at 1649(cm-1) and CF/ring at 1246(cm-1).
Raman Cross Sectional Analysis(similarly done as with 5-FU) was applied
towards the results from an excitation profile (197nm Series) of 500uM GCV in
50mM ClO4- at varying excitation energies (197, 199, 201, 203; 205 nm). As
there was an increase in excitation energy there appeared to be a tendency for
intensity increases with modes 1, 2, 3, 7 and 13 as seen in fig. 9. These trends
are also reflected in the cross sectional results shown in table 3. Greater cross
sectional value differences were observed between those at the 197nm

37
compared to those at 205 nm for the vibrational modes which comply with this
sort of trend.
ll.3d) NMR spectra was used in order to confirm that the predominant
tautomer of 5-FU, a 13C NMR analysis was performed. The 13C NMR indicates
four distinct carbons (Figure 10). The first Carbon (C3) is double bonded with O6.
This carbon neighbors F7 to generate a coupling pattern which gives rise to the
doublet at ~ 160 ppm. Another Carbon (C1,) bonded to O8 gives rise to a peak at
~ 151 ppm. The third, C4, is bonded to F7 which in turn is coupled to O6 giving rise
to the doublet at ~ 141 ppm. Finally, C5, is bonded to H11 giving rise to a doublet
at ~ 126 ppm. This 13C NMR framework is consistent with that of the keto
tautomer (A) as the ACD and DFT 13C NMR predictions support (Figure 10).

38
Raman shift (cm - 1)
Figure 9. Raman analysis of 500uM GCV and 50 mM ClO4- in aqueous solution at varying
excitation energies (197, 199, 201, 203; 205 nm).

39
TABLE 3. Raman cross-section for GCV with ~ 950/cm band of aqueous ClO4- (197series)

40
Figure 10. 13C-NMR spectra of 5-FU were obtained at a concentration
of 62.3 mM aqueous 5-FU (top panel). Lower panels show 5-FU
tautomer A using ACD nmr predictor/theory (middle) and tautomer A
using DFT/B3LYP/6- 311++ G(d,p).

41
ll.3e) The geometric optimization process involves systematically
rearranging the molecule. The atoms, angles and bonds within 5-FU were
assigned a total energy value. The arrangement corresponding to the minimum
energy value was taken as 5-FU’s optimized conformer. The optimization
process was accomplished using GaussView/Gaussian (GaussView 5.0.8,
Gaussian, Inc./2000-2008 Semichem, Inc) and was applied after each molecule
was put through a preliminary force field calculation process within ChemBio 3D
Ultra (Ultra-Version 12.0 1986-2009 CambridgeSoft). A summary of the
optimization results for all six tautomers are shown in Table 4. Similar prior
studies have demonstrated the usefulness of DFT level type calculations to
geometrically optimize a structure. One prior study [22] employed DFT/B3LYP/6-
31+G**, HF/6-31+G** and MP2/6-31+G** independently, to optimize the six
tautomeric forms of 5-FU (Table 4). It was found that each method showed
tautomer A (keto) was the most geometrically relaxed (i.e. lowest Total Energy)
of the six. In the current study, the six 5-FU tautomers were optimized using
DFT/B3LYP/6-311++G(d, p). This study’s results too show tautomer A (keto) to
be the most geometrically relaxed of all six optimized tautomers (Table 4). The
current study’s use of DFT/B3LYP/6-311++G(d, p) level was chosen because of
its success in the optimization of 2-aminoiconicotunic acid by Karabacak et al.
[23]. More so, Tanak and Agar [24] also demonstrated that the DFT/B3LYP/6-
311++G(d, p) method was reliable for obtaining good agreement with
experimental UV-Visible absorption spectra on certain di-substituted phenols.

42
Thus, this was the first time method DFT/B3LYP/6-311++G(d, p) was applied
towards 5-FU optimizations and predictions.

43
N
N
O
OH
F
H
H
A B C
D E F
N
N
O
O
F
H
H
H
Table 4. Optimization of the six 5-FU tautomers shown below using DFT
calculations with RB3LYP/6-311++G(d,p) level of theory.
5-FU tautomer (DFT/RB3LYP/6-
311++G(d,p))
TE (au)
A -514.20061567 a.u.( CS)
B -514.15589791 a.u.( C1)
C -514.17302521 a.u.( CS)
D -514.17192224 a.u.( CS)
E -514.17600961 a.u.( CS)
F -514.16699519 a.u.( CS)
N
N
O
OH
F
H
H
N
N
OH
O
F
H
H
N
N
OH
O
F
H
HN
N
OH
OH
F
H

44
ll.4 SUMMARY
Although this study’s UV, IR and NMR results were consistent with the findings of
similar literature on the subject, it has nonetheless broken new ground with
respect to spectroscopic data for 5-FU tautomers. This is the first study of its kind
to utilize the DFT/B3LYP/6-311++G(dlp) method and UVRR in the context of
5FU. A series of simple spectroscopic analyses and DFT calculations allowed the
tautomeric forms to be easily deduced., Experimental 5-FU was easily
distinguished from GCV ((UV, IR; UVRR(1st)) and FBAL(IR).

45
Chapter lll
FORCED DEGRADATION KINETICS
lll.1 INTRODUCTION
Simulating environmental relevant degradation conditions in order to
demonstrate the effects they have on these compounds is extremely vital
because it gives reason to further pursue to try and validate with the real thing,
whether it be directly or indirectly. Showing various environmental conditions that
may degrade these type of molecules helps in painting a picture that certain
degradation may in fact take place within the environment. Even further, showing
how synergism places a role with respect to multiple degradation conditions
makes the overall goal in getting these pharmaceuticals regulated, more
complicated, but in fact could simplify the expected requirements needed for
regulation too. Condition effects on degradation may be synergistic which in
reality is hard to ascertain concrete values on so more broader terms may be
drawn when the time comes to regulate.
The design for these forced degradation studies involve investigating the
effects that different environmental conditions may have on the degradation of 5-
FU. While doing so, there was also an interest in seeing if any synergism or
additive effects may be demonstrated via merely comparing results from similar
experiments where only differences involves independent condition effects
versus combined.

46
lll.2 EXPERIMENTAL
lll.2a) The thermal/alkaline study began with a sterilization process using
a predetermined amount of 18 MΩ water further sterilized in an autoclave
(Tuttnauer Sterilizer HP Model 40). Next, the sample supply prep involved the
dissolution of 0.025 mM 5-FU in aqueous solvent (from the autoclaved water).
The pH was then raised to ~12.0 using NaOH (50%/50%/Fisher Scientific).
Preliminary studies reflected that two weeks was sufficient time required to run
the experiment. After the sample supply was prepared, an aliquot (~3 mLs) was
put into a 1 cm UV quartz cuvette then run on the UV instrument (Cary 50 UV
Varian system/UV-Vis Spectrophotometer) for the experiment’s t0 measurement.
Other aliquots were taken from the sample supply and placed into 10mL glass
tubes and capped tightly. The aliquoted samples were placed into individual wells
of aluminum heat blocks. These samples were then heated to 90°C using a hot
plate (Corning). The temperature was constantly monitored using a standard
glass thermometer (Germany/serial#A-0905000847) placed in a sample well in
the heat block. Thereafter, at various times(daily for 7 days) throughout the
experiment, the aliquoted samples were pulled from the heat block, one per
designated time, allowed to cool, and then measured with the UV.
lll.2b) The thermal/acidic study began with a sterilization process using a
predetermined amount of 18 MΩ water further sterilized in an autoclave
(Tuttnauer Sterilizer HP Model 40). The sample supply prep involved the

47
dissolution of 0.025 mM 5-FU in aqueous solvent (from the autoclaved water)
The pH of the sample was lowered to ~ 3.5 using HCl(12.1 Normality/Fisher
Scientific). Preliminary studies reflected that the experiment’s duration be two
weeks. The sample supply was prepared to form an aliquot (~3 mLs) and was
placed into a 1 cm UV quartz cuvette. The sample was then run on the UV
instrument (Cary 50 UV Varian system/UV-Vis Spectrophotometer) for the
experiment’s t0 measurement. Other aliquots were taken from the sample supply
and placed in 10mL glass tubes which capped and tightly sealed. The aliquoted
samples were then placed in individual wells of aluminum heat blocks and heated
to 90°C using a hot plate (Corning). The temperature was constantly monitored
using a standard glass thermometer (Germany/serial#A-0905000847) placed in
one of the sample wells of the heat block. Thereafter, at various times throughout
the experiment, the aliquoted samples were pulled from the heat block, one per
designated time, allowed to cool then measured with the UV.
lll.2c) The thermal/saline study began with a sterilization process using a
predetermined amount of 18 MΩ water further sterilized in an autoclave
(Tuttnauer Sterilizer HP Model 40). The sample supply prep involved the
dissolution of 0.025 mM 5-FU in aqueous solvent (from the autoclaved
water)which was made saline through the addition of NaClO (Fisher Scientific)
sufficient to make a solution with concentration of 0.005 g/mL (5.0 mg/mL).
Preliminary studies reflected that the experiment’s duration be from seven to nine
hours. The sample supply was prepared forming an aliquot (~3 mLs) and was

48
placed into a 1 cm UV quartz cuvette. The sample was then run on the UV
instrument (Cary 50 UV Varian system/UV-Vis Spectrophotometer) in order to
determine the t0 measurement. Other aliquots were taken from the sample supply
and placed in individual 10mL glass tubes. The aliquoted samples were then
placed into individual wells of aluminum heat blocks and heated to 90°C using a
hot plate (Corning.) The temperature was constantly monitored using a standard
glass thermometer (Germany/serial#A-0905000847) which was placed in a
sample well of the heat block. Thereafter, at various times throughout the
experiment, aliquoted samples were pulled from the heat block, one per
designated time, allowed to cool then measured with the UV.
lll.2d) The photolytic/alkaline study basically began with a sterilization
process with a predetermined amount of 18 MΩ water further sterilized in an
autoclave (Tuttnauer Sterilizer HP Model 40). Afterwards, the sample supply prep
involved 0.025 mM 5-FU dissolved in aqueous solvent (from the autoclaved
water)where pH was raised to ~ 12.0 with use of NaOH(50%/50%/Fisher
Scientific). Preliminary studies reflected that the experiment’s duration be ~ 1 day
long so after the sample supply was prepared an aliquot (~3 mLs) was put into a
1 cm UV quartz cuvette then ran on the UV instrument (Cary 50 UV Varian
system/UV-Vis Spectrophotometer) for the experiment’s t0 measurement.
Afterwards, a certain amount (predetermined) was taken from the sample supply
and put into 50mL glass bottle with a screw-on cap. The bottle of sample was
then put on top of UV lamp (UVGL-15/Compact UV Lamp with 254/365nm UV

49
settings) exposing it only to the 254nm side. Thereafter, at various times
throughout the duration of the ~ 1 day + experiment, ~3 mL of the sample
exposed to UV light was drawn from the vessel using 3mL graduated disposable
transfer pipets(Samco Scientific, Mexico), filtered with plastic syringe( BD 20 mL
Syring Luer-Lok Tip), allowed to cool then measured via UV.
lll.2e) A relevant preliminary experiment tested the stability 5-FU may
have in various conditions where nitrogen was involved. This work called for
0.099mM 5-FU to be mixed in solution with 10mM NH4OH, Urea and (NH4)2SO4
independently. Standard UV analysis was set to be used to monitor any changes
5-FU may undergo immediately after being added with each. This effort was
proposed after learning that a prior study [25] suggested that most microbial
related degradation in nature involves a nitrogen source while another source[26]
asserted that 5-FU was subjected to more degradation when dissolved in
solution with a Tris buffer(has Nitrogen) than it is in alkaline solution.
lll.3 RESULTS
lll.3a) The thermal/alkaline experiment(s) demonstrated a trend typically
related to degradation (albeit not completely) over the course of time with the
application of heat (~90°C)(Figures15/16). Figure 11 shows that the initial UV
spectra (grey/top) at t0 before applying heat taking on a shape uncharacteristic of
5-FU in regular unaltered aqueous solvent. This seems to suggest that 5-FU is
deprotonated or undergone a minor tautomeric change. Figure 12 reflects
marginal deviations about each respective absorbance measurement mean. This

50
mean was taken at set times during each one week experiment. This serves as a
starting point and is analogous to other degradation experiments. Thereafter UV
analysis was carried out on samples subjected to no elevated temperatures (grey
spectrum), one day (blue spectrum) of elevated temperatures, two days (green
spectrum), three days (brown spectrum), four days (magenta spectrum), five
days (cyano spectrum), six days (red spectrum) and seven days (purple
spectrum). An inverse relationship was observed between the time a number of
like samples subjected to elevated temperatures, and an absorbance max of
approximately 266 nm consequently, this study was significantly more successful
than its counterpart experiment, the Thermal/Acidic degradation study.

51
Fig. 11 UV analysis of ~ 0.025 mM FU in alkaline solvent at ~ pH 12 (n=2) at room
temperature(0 day) and subsequent analyses of ~0.025 mM FU at pH 12 subjected to
90C temperatures for 1, 2, 3, 4, 5, 6; 7 days.
250 260 270 280 290 300 310 3200
0.02
0.04
0.06
0.08
0.1
0.12
Wavelength (nm)
Ab
so
rba
nc
e (
A.U
.)
data2
data3
data4
data5
data6
data7
data8
data9
0 day1.0 day2.0 days3.0 days4.0 days5.0 days6.0 days7.0 days

52
Fig. 12 UV deviation from mean spectra for thermal/alkali experiments (x3) for
~ 0.025 mM FU in alkaline solvent at ~ pH 12.

53
lll.3b) The thermal/acidic experiment(s) as seen in figures 13/14 reflect
minimal degradation as function of time similar to samples subjected to elevated
temperatures. Figure 18, however, reflects great deviation about the mean
between these three replicate experiments but they all balance out with the rest
of the error bars from different days absorbance values measured. Prior studies
have shown varying results for experiments of a similar nature. Therefore, it is
likely that the compound undergoing acidic degradation stress may account for
this observable difference. 5-FU is considered a weak acid and thus, less
affected by thermal/acidic stress compared to thermal/alkaline stress as one
might expect.
lll.3c) The thermal/salinity experiment(s) analogous with prior two
experimental studies with respect to the time measurements were taken. The
duration of the experiment was less than 1 day while requiring elevated
temperatures in order to get a gradual decrease in absorbance max with respect
to the t0 (see grey spectra/figs 15/16). Substantial degradation was interpreted
after the first measurement at hour one which is seen with the gray spectrum
(figure 15). The overall perceived degradation is much greater than that
demonstrated in the thermal/alkaline study. The trend and spectra shapes are all
different as well. Thus, it may be easy to assume that the degradation pathways
between the thermal/alkaline and thermal/saline may be at least slightly different
while the mechanisms may differ vastly. This thermal/saline experiment which
used NaClO showed complete degradation within only nine hours and is a first
with respect to studies of this kind on 5-FU.

54
220 240 260 280 300 3200
0.02
0.04
0.06
0.08
0.1
0.12
Wavelength (nm)
Ab
so
rba
nc
e (
A.U
.)
data1
data2
data3
data4
data5
data6
data7
0 day1.0 day2.0 days3.0 days4.0 days5.0 days6.0 days
Fig. 13 UV analysis of ~ 0.025 mM FU in acidic solvent (~ pH 3.5) at lab temperature( 0 day)
and subsequent analyses of ~0.025mM FU at pH 3.5 subjected to 90C temperatures for 1, 2,
3, 4, 5; 6 days.

55
0 5 10
0.34
0.36
0.38
0.4
0.42
0.44
Time(days)
Ab
so
rba
nc
e (
nm
)
Fig. 14 UV deviation from mean spectra for thermal/acidic experiments (x3)
for ~ 0.025 mM FU in acidic solvent (pH= ~3.5) at lab temperature( 0 day)
and subsequent analyses of ~0.025mM FU at pH 3.5 subjected to 90C
temperatures for 1, 2, 3, 4, 5; 6 days.
.

56
Fig. 15 UV spectra for ~0.025 mM 5-FU in saline sln. ([NaClO= 0.005g/mL]/n=3) and
subsequent analyses of ~0.025mM FU in saline sln. ([NaClO= 0.005g/mL]/n=3) subjected to
90C temperatures for 1, 2, 3, 4, 5; 9 hours.
220 240 260 280 300 320 340 360 380 4000
0.1
0.2
0.3
0.4
0.5
0.6
0.7
0.8
0.9
1
Wavelength (nm)
Ab
so
rba
nc
e (
A.U
.)
data2
data3
data4
data5
data6
data7
data8
0 saline solvent1 hours s.s; 90 deg. T2 hours s.s; 90 deg. T3 hours s.s; 90 deg. T4 hours s.s; 90 deg. T5 hours s.s; 90 deg. T9 hours s.s; 90 deg. T

57
Fig. 16 UV deviation from mean spectra for Thermal/Saline experiments (x3)
for ~ 0.025 mM FU in saline solvent( [NaClO] = 0.005g/mL) subjected to
90C temperatures for 0,1, 2, 3, 4, 5; 9 hours .
0 0.1 0.2 0.3 0.4
0
0.1
0.2
0.3
0.4
0.5
0.6
0.7
0.8
0.9
1
Time (days)
Ab
so
rba
nc
e (
A.U
.)
data2

58
lll.3d) Photolysis along with alkalinity with assistance of TiO2 needed only
a day or so to get 5-FU to fully degrade. Figures 17/18 indicate that taking
measurements at only a few minutes after applying photolytic light of 254nm
produced dramatic decrease of the absorbance max, almost spontaneously.
Regardless, these measurements, do reflect a trend until the absorbance max at
~ 266nm is completely gone. This is noted after just more than a day of
subjection to UV light. Aside from the kinetics being significantly faster than those
of Thermal/Alkaline but comparable though slightly slower than that of
Thermal/Saline, the degradation route may be most similar to Thermal/Alkaline
because of the obvious initial deprotonation at t0. Thereafter, the photolytic/alkali
(PAC) study is most similar to the Thermal Saline because of the obvious
mechanisms(radicals) involved which effectively facilitate complete degradation.
lll.3e) Some preliminary results may be seen as very useful for future
though not fully pursued here. Figure 19 shows that the 5-FU structure changes
in presence of NH4OH, urea and (NH4)2SO4. Though no further changes or
degradation were observed as function of time, it would be interesting to see
each combined with elevated temperatures(thermolysis). Upon carrying out such
experiments, it would be even more interesting to see how expected enhanced
degradation compares with thermal/alkaline results. Figures 20 and 21 are the
13C nmr spectra of the FU-tris mix that was made before 03-21-13. This
particular spectra was run on, 04-19-13. It was determined that the 5-FU portion
of the spectra appears as anticipated with no significant modifications. It appears
to be in its keto state. However, further analysis reflects that the C5 (carbon that

59
was attached to hydrogen in the 5-FU only spectra) peak is significantly lower in
intensity than the analogous C5 peak within the 5-FU-Tris spectra (compare fig.
12 5-FU inset with fig. 21). One can conclude that the Tris complex is bonded to
C5. The absence of hydrogen means the Nuclear Overhauser Effect (NOE) is not
as relevant. The C5 peak is therefore much weaker than might have been
anticipated were it bonded to a hydrogen atom.

60
220 240 260 280 300 320
0
0.02
0.04
0.06
0.08
0.1
0.12
0.14
0.16
Ab
so
rba
nc
e (
A.U
.)
Wavelength (nm)
data1
data2
data3
data4
data5
0 days
1 min(6.9*10^-3days)
1.5 hr(.0625 day)
8.0 hr(.333 day)
1.0 day
Fig. 17 UV analysis of ~ 0.025 mM FU in alkaline solvent (~ pH 12.4) at lab
temperature followed by subjection to photolytic stress (254nm) w/TiO2 (n=3) for
various times leading up to one day.
61
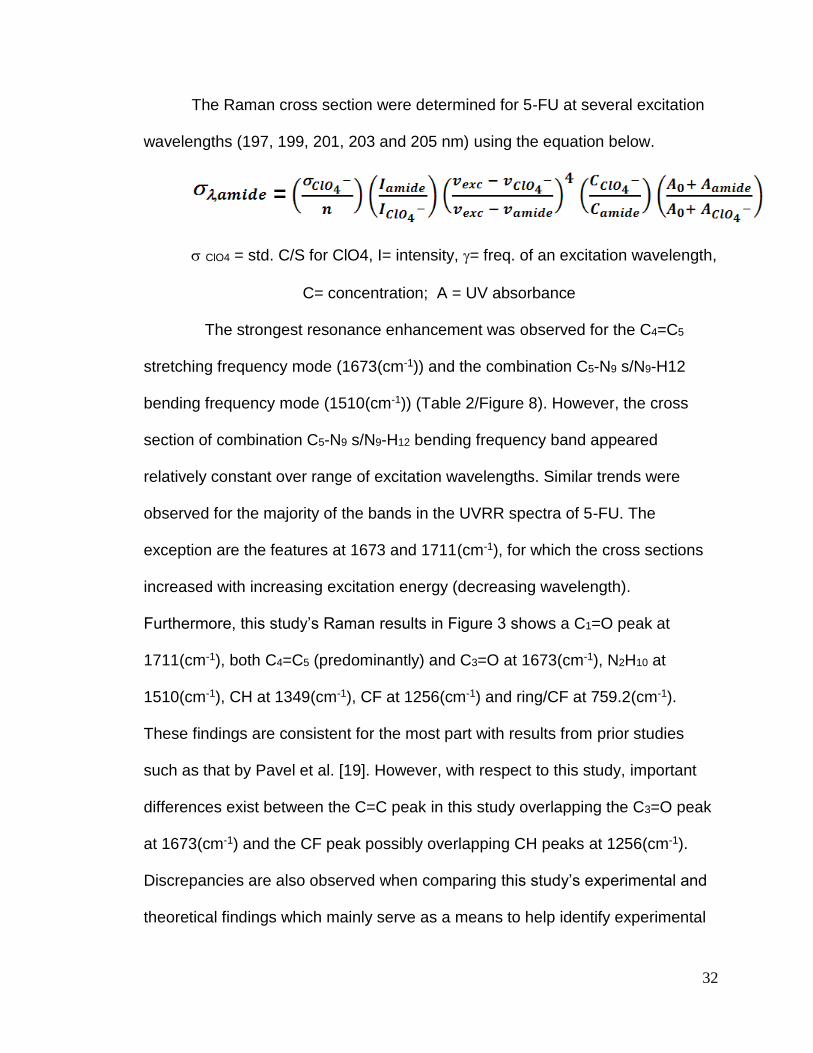
Fig. 18 UV deviation from mean spectra for photolytic/alkaline experiments (x3) for
~ 0.025 mM FU.
0 0.2 0.4 0.6 0.8 1
0
0.02
0.04
0.06
0.08
0.1
0.12
0.14
0.16
Time(Days)
Ab
so
rba
nc
e(A
.U.)

62
200 300 400 500 600 700
0
0.1
0.2
0.3
0.4
0.5
0.6
0.7
0.8
0.9
Fig. 2623
Wavelength (nm)
Ab
so
rban
ce (
A.U
.)
data1
data2
data3
data4
5-FU (urea)
5-FU (NH4OH)
5-FU (aq)
5-FU ((NH4)2SO4))
Fig. 19 UV analysis of 0.099 mM FU in 10.0 mM NH4OH, Urea; (NH4)2SO4.

63
020406080100120140160180200
-0.5
0
0.5
1
1.5
2
2.5
3
3.5
4
4.5
x 10
8
Parts Per Million (ppm)
Inte
ns
ity
Fig. 20 13C NMR of 0.381 M 5-FU-Tris.

64
Fig.21 13C NMR prediction calculation (ACD) on the 5FU-Tris complex with connection via NH.
170 160 150 140 130 120 110 100 90 80 70 60 500
5
10
15
20
25
30
35
40
45
50
55
60
65
70
75
80
85
90
95
100
105
110
115
120
61.28
63.11118.35137.81150.75159.05
N
N
O
O
FH
HN
O
O
O
H HH
HH
H
H
HH
H

65
Fig. 22 13C NMR prediction calculation (ACD) on the 5FU-Tris complex with connection directly to C(4°).
160 150 140 130 120 110 100 90 80 70 600
5
10
15
20
25
30
35
40
45
50
55
60
65
70
75
80
85
90
95
100
105
110
115
120
53.80
61.79
137.33140.63152.79158.78
N
N
O
O
F
H
H
O
O
O
H H
HH
H
H
HH
H

66
Upon analysis of the Tris complex ((H2NC(CH2OH)3 ))component of the
FU-Tris spectra(fig. 20), different peaks are observed which relate to the
presence of three other types of differently situated carbon atoms.. These are not
affiliated with carbons within the 5-FU complex. Turning our attention to the Tris
complex, one can see only two types of differently situated carbons and that is
the quaternary carbon (total of one). Additionally there are three secondary
carbons. The peak of the greatest intensity corresponds to the secondary
carbons. The smaller peak then corresponds to the quaternary carbon. An ACD
prediction of the Tris complex confirms this . 5-FU-Tris (fig. 20), both smaller
peaks are situated to the left of the larger one.. It is anticipated that Tris is bound
to the C5 is supposed to be through the Tris’ NH component. The quaternary
carbon which is attached to the NH should have a greater NMR shift than the
secondary carbons due to lesser electron density. Clearly, there exists a
departure from what is anticipated with respect to the FU-Tris complex. No NH is
likely present because the smaller peak exists to the right of the larger one. It
can therefore be deduced that the FU-Tris complex is bonded with C5 of FU
directly to the quaternary carbon of the Tris complex with no involvement from
the complex’s NH. This hypothesis was verified by performing ACD calculations
on FU-Tris with NH(fig. 21) and FU-Tris without NH(fig. 22).

67
lll.4 SUMMARY
The article by X Fei et al [27] suggest that the order of degradation on 5-FU(from
best to worst) is Oxidative(1-3%) Thermal only (2.5%) Thermal &
Humidity(2%) Alkalinity(0.5%) Acidic(0.1%) Photolysis (figure 1 [27]) while
F. K. Alanzi et al. [9] results suggest Oxidative(90.1%) Thermal(87.8%)
Acidic(86.7%) Alkalinity(83.17%) (figure 2/table 1[9]). Comparing those
rankings with those here the following order emerges: Thermal/Saline
Photolytic/Alkali Thermal/Alkali Thermal/Acidic. The common parameter
amongst all three rankings is with oxidative driven degradation. This yields the
most significant form of hydrolysis on 5-FU. One can categorize these
Thermal/Saline and Photolytic/Alkali studies are related due to the radical
aspects during the most significant stages of the experiments. The complete
hydrolysis of 5-FU was achieved by way of a unique oxidative hydrolysis method
involving synergism. This will be the first of its kind to be published. Neither
thermolysis, salinity, photolysis nor alkalinity by themselves would come close to
completely degrading 5-FU. The reported ranking of oxidative being better than
alkalinity which in term is better than acidic (omitting other conditions which are
not applicable here) is most consistent with the ranking achieved here. One may
say it may not be totally adequate to compare the rankings here with other
rankings which did not invoke the same level of synergism because all of F. K.
Alanzi et al. [9] experiments(except for Thermal) involved heating environment to
only 60C . Interesting enough, they got their acidic reactions to provide better
hydrolysis than their alkali counterparts which greatly differs from what was

68
achieved here. Thus, the dynamics of these studies correlate with a greater
emphasis of synergism than the prior studies.

69
CHAPTER lV
LC-MS/MS CHARACTERIZATIONS
lV.1 INTRODUCTION
Identifying degradation products that may arise from these forced degradation
studies is essential because it, by itself, draws a link between the compound
degrading and potential toxicity that may result thereafter. Synergism may play a
major role here as well because who is to say exactly what is needed out in the
environment in order for toxicity to exist with respect to human exposure, either
via drinking water, eating, breathing or skin exposure. The complex ways that
individual pharmaceuticals may come together and be harmful may be
impossible to replicate or simulate in a lab. However, if it may be shown in very
discrete ways that a small considered to be harmless amount of drug “a”
exposed to condition “b” being mixed with a harmless amount of drug “c” may
altogether produce a product that may have 100 or 1000x the toxicity potential
than the individual constituents that produced it then there may be no need in
pursuing the rest of the formalities in order curb toxicity exposures and prevent
potential catastrophes.
The design of this experiment involved developing unique fragmental
characteristics for each analyte to be screened. As a result, the monitoring of
each analyte’s product ion characteristics facilitated identifying of degradation
products within samples subjected to various degradation conditions.

70
lV.2 EXPERIMENTAL
lV.2 a) A method was developed in order to detect and quantitate 5-FU,
FBAL, FUC and FUPA using a Waters LC system(Waters Acquity triple
quadrupole mass spec/Phenomenex Kinetex C18/100mm x 4.6mm/2.6µm
particle size reverse phase column) and MS/MS detector((Electrospray
Ionization(EI) in the negative ion mode with multi reaction monitoring(MRM)). The
mobile phase consisted of 10 mM ammonium acetate and 0.1% formic acid in
water (A) and 100% acetonitrile (B). The gradient conditions were 0–0.5 min, 2%
B; 0.5–7 min, 2–80% B; 7.0–9.0 min, 80–98% B; 9.0–10.0 min, 2% B; 10.0–15.0
min, 2% B at a flow rate of 0.5 ml/min. The MS/MS system was operated using
electrospray ionization (ESI) in the negative ion mode with capillary voltage of 1.5
kV. The ionization source was programmed at 150 oC and the desolvation
temperature was programmed at 450 oC. The MS/MS system was operated in
the multi-reaction monitoring (MRM) mode and the collision energy was 30V. The
molecular parent ions were screened and the product ions used for the
quantifications were determined from the spectra obtained from injecting 30 μL of
a standard solution containing 10mg/L of the pharmaceutical standards. The
protonated molecule ion [M - H]- and its corresponding product ion spectrum are
shown in Figure 23. Table 5 shows the masses of the [M-H]- parent ion and the
masses of the product ions used in this study. The predominant fragment ion was
selected as the product ion for quantification. Analytical data were processed
using Waters software (Waters, CA, USA). The respective spectra and
chromatogram for each standard were used to establish a screening mechanism

71
which would enable the detector to recognize if any of the corresponding
analytes were recognized. These screening processes were set in a manner
where for all four standards could be applied simultaneously (MRM) during each
run (see table5).

72
Table 5 MRM analysis
Analyte Precursor Ion ((m/z) Product Ion (m/z)
5-FU 129 42
FUPA 149 149
FBAL 106 106
FAC 77 77

73
Fig. 23b FU Mol Ion standard method development in prep for calibrations
Fig. 23c FU Product Ion S standard method development in prep for calibrations
74
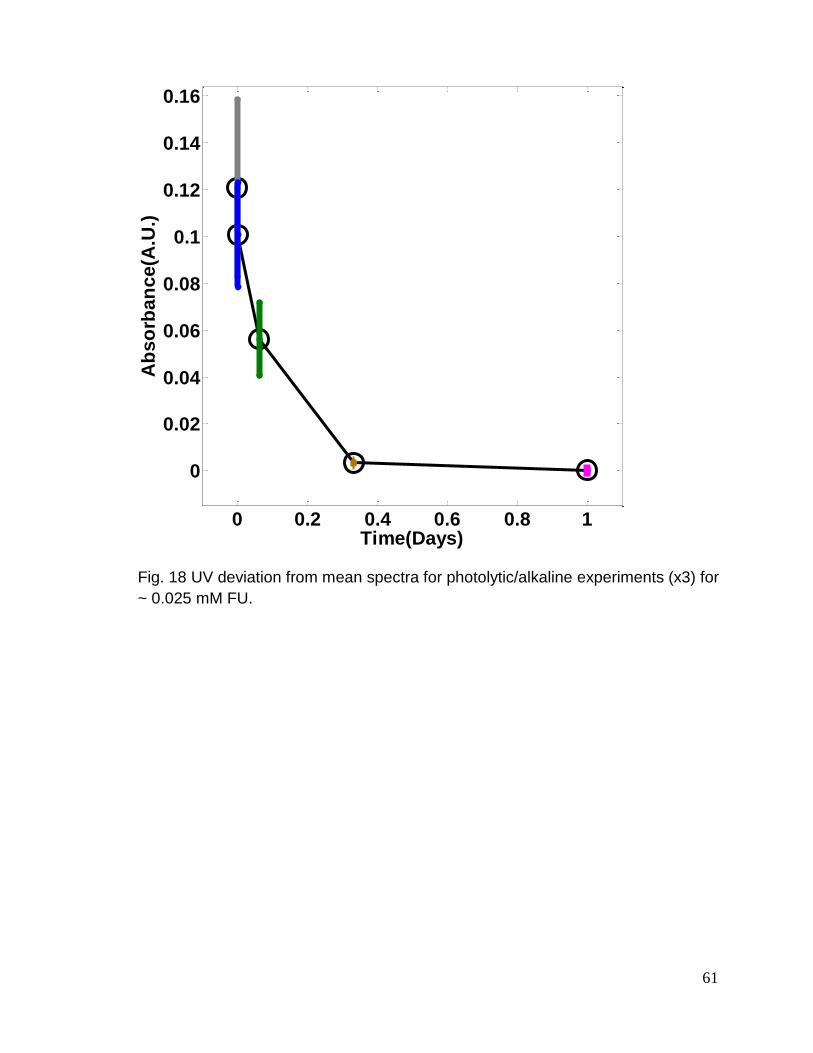
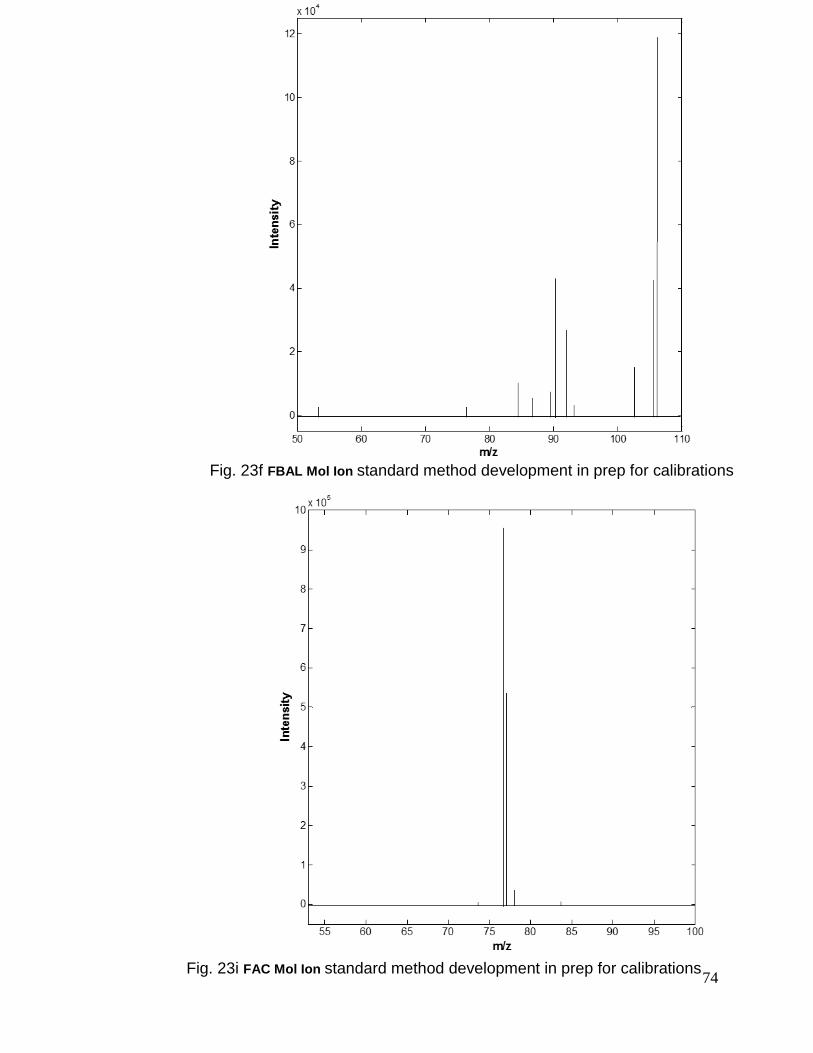
Fig. 23f FBAL Mol Ion standard method development in prep for calibrations
Fig. 23i FAC Mol Ion standard method development in prep for calibrations

75
Fig. 23l FUPA Mol Ion standard method development in prep for calibrations

76
After the filtering processes (fingerprints) were set up for each of the
standards, the instrumental setup was calibrated for those standards at
concentrations of 5, 1, 0.5, 0.25, 0.10, 0.05 ppm. Mixtures for each calibration
concentration were made with all the standards in the mixture for each
designated concentration. This facilitated the calibration process. The
construction of the calibration curves (see fig 24) served as means to be in
position to quantitate those analytes detected in the samples subjected to the
various degradation processes already outlined in Chapter lll.
lV.3 RESULTS
lV.3a) The thermal/alkaline study’s samples were analyzed via LC-MS/MS
in order to determine if 5-FU may have broken down to FUPA, FBAL or/and FAC.
The same samples analyzed using UV were analyzed with LC-MS/MS. Figure
26a indicates that, 5-FU clearly degraded over time. Tandem MS analysis was
capable of determining if any of the minimal degradation products screened for
were produced whereas LC-UV could not. Retention times for each of the three
degradation products were similar coming off the column. However, the
screening for not only retention times of diagnostic ions, but the intensities of
those diagnostic ions together with the molecular ions (~m/z) gives rise to a
much more selective process. This enables the three compounds to be
distinguished and quantitated if detected. Figures 26b, 26c; 26d reflect intensities
of the respective product chromatograms which should correlate to the amount of
analyte quantitated at each time of measurement. These analyses were
replicated and reproducibility was confirmed. The degradation of 5-FU which

77
increased as a function of time was consistent with its analogous UV (figure 11)
even though there was no appreciable quantitation of degradation products
screened for(5-FU obviously reproducibly converts to a product this study didn’t
screen for). Although it could not be seen what 5-FU is breaking down to, this
study demonstrated and confirmed that the Thermal/Alkaline method here may
degrade the 5-FU compound significantly.

78
0 0.01 0.02 0.03 0.04
0
200
400
600
800
1000
1200
1400
1600
1800
2000
Concentration (mM)
Are
a C
ou
nt
y = 5e+04*x - 39
data1
linear
data2
data3
data4
data5
data6
data7
data8
data9
0.0003675mM0.000735mM0.0018375mM0.003675mM0.00735mM0.03674mM
FBAL
Y = 5e+04*x – 39
R2 = 0.9876
O
O
F
H
N
H
H
H
H
H
0 0.01 0.02 0.03 0.04 0.05
0
0.5
1
1.5
2
2.5
x 105
Concentration (mM)
Are
a C
ou
nt
y = 5.1e+06*x + 8.5e+03
data1
linear
data2
data3
data4
data5
data6
data7
0.000505mM0.00101mM0.002525mM0.00505mM0.0101mM0.0505mM
FACy = 5.1e+06*x + 8.5e+03 R2 = 0.9886
O
O
F
H
HH
Fig. 24a FAC calibration plot
Fig. 24b FBAL calibration plot.

79
0 0.005 0.01 0.015 0.02 0.025
0
20
40
60
80
100
120
140
160
180
200
Concentration (mM)
Are
a C
ou
nt
data1
linear
data2
data3
data4
data5
data6
data7
data8
0.000262mM0.000524mM0.00131mM0.00262mM0.00524mM0.0262mM
FUPAy = 7.1e+03*x + 2.8 R2 = 0.9901
OO
N
O
FH
H
H H
H
H
0 0.01 0.02 0.03
0
100
200
300
400
500
600
Concentration (mM)
Are
a C
ou
nt
data1
linear
data2
data3
data4
data5
data6
data7
0.000303mM0.000606mM0.001515mM0.00303mM0.00606mM0.0303mM
y = 2e+04*x + 15 R2 = 0.9923
N
N
O
O
F
H
H
H
Fig. 24c FUPA calibration plot.
Fig. 24d 5-FU calibration plot

80
0 2 4 6 8
0
0.002
0.004
0.006
0.008
0.01
0.012
0.014
0.016
0.018
0.02
Time (days)
Co
nc
en
tra
tio
n (
mM
)
data1
data2
data3
5-FU detected
FUPA detected
FBAL detected
Fig. 26a Thermal/alkaline product chromatograph results in
screening for 5-FU, FUPA; FBAL for the average of 3
measurements at each incremental measurement during the
duration of the experiments.

81
Fig. 26b Thermal/alkaline product chromatograph results in
screening for 5-FU for the average and deviation of 3
measurements at each incremental measurement during
the duration of the experiments.
0 2 4 6 8
0.015
0.016
0.017
0.018
0.019
0.02
0.021
Time (days)
Co
nc
en
tra
tio
n (
mM
)
5-FU

82
Fig. 26c Thermal/alkaline product chromatograph results
in screening for FUPA for the average and deviation of 3
measurements at each incremental measurement during
the duration of the experiments.
0 2 4 6 8-5
-4
-3
-2
-1
0
1
2
3
4
5x 10
-6
Time (days)
Co
nc
en
tra
tio
n (
mM
)
FUPA

83
Fig. 26d Thermal/alkaline product chromatograph results
in screening for FBAL for the average and deviation of 3
measurements at each incremental measurement during
the duration of the experiments.
0 2 4 6 8-5
0
5
10
15x 10
-5
Time (days)
Co
nc
en
tra
tio
n (
mM
)
FBAL

84
lV.3b) Figures 27(a-d) is consistent with the analogous figure 14 in regard
to the thermal/acidic study. Nothing was ascertained from the UV spectra in
regard to possible 5-FU degradation. However, traces of FBAL were detected
which is fairly consistent with most history on these sort of degradation studies
involving acidity. Thus, though not validated independently, it does affirm that the
alkalinity rather than acidity induces a “synergistic” degradation effect on 5-FU
when in combination with elevated temperatures.
lV.3c) Figures 28(a-d) show that the thermal/saline study’s degradation
pathway may be very similar to the photolytic/alkalinity study though mechanisms
are vastly different. FUPA was quantitated here too. Mechanistic-wise, the
thermal/saline study should be most similar to the thermal/alkalinity study but the
differences in magnitudes of degradation between the two overshadow that
comparison. Other products or another major product is involved to which 5-FU
converts to though it were not screened for here. Nevertheless, novelty was
demonstrated with this thermal/saline study with it being the first to get 5-FU
completely degraded.
lV.3d) The photolytic/alkaline study with assistance of TiO2 (figures 29(a-
d)) appears to be fairly consistent with what was seen within its analogous UV
spectra (figure 21). One can see a consistent decline with respect to the amount
of 5FU. Figure 22 definite reflects this more specifically. Here one will notice a
substantial 5-FU analyte signal/peak (bottom/ gray) before applying photolytic
light compared to no signal what so ever after 8 hours. The reanalysis of samples
subjected to this study seems to indicate that 5-FU transformed into another

85
degradation product besides FUPA(obviously one of the several not accessible
for this study). Consecutively, as 5-FU diminishes to nothing, another
degradation product probably emerges as the sole analyte[25]. This supports the
thinking that the degradation pathway is different from one involved with the
thermal/saline and thermal/alkaline studies. The new photolytic/thermal study
definitely and completely degraded the 5-FU molecule as figures 21 and 29
reflect. The degradation products screened for were not any of the major
product(s) that 5-FU transforms to under these conditions. There may be only
minor conversions to FBAL and FUPA during the experiment which can’t be
confirmed due to their such low detections. A similar study [25] got 5-FU to
degrade into what they identified as a reduced(between C-F and C-NH2) analog
of FBAL which would have a [M-H]- of 104 whereas FBAL’s [M-H]- is 106. It is
easy to assume that the mechanism behind their photodegradation process is
similar to this study’s with the generation of radicals such as OH except that
they used Bicarbonates and Nitrates to generate but here TiO2 was used. Thus,
novelty was still shown here with the complete degradation of 5-FU using a
different environmental relevant means to generate radicals that may enhance or
catalyze the photodegradation process. Arguably, the same major degradation
product may have been produced here but that needs to be confirmed.
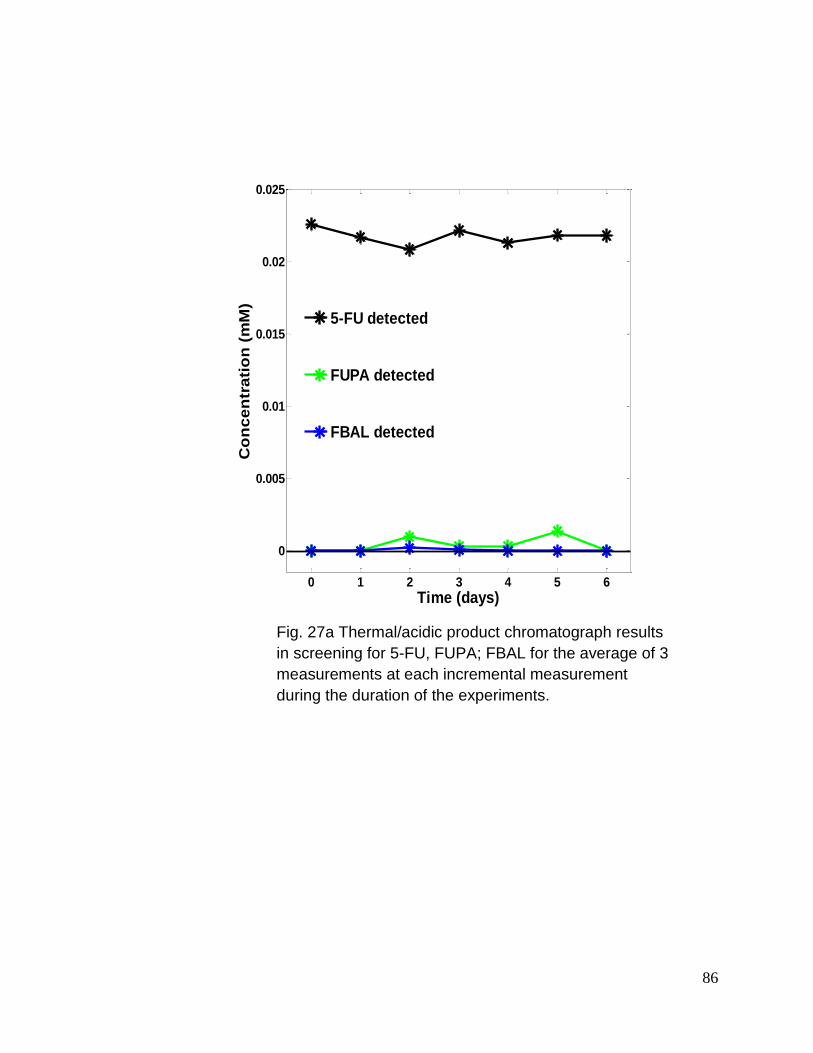
86
Fig. 27a Thermal/acidic product chromatograph results
in screening for 5-FU, FUPA; FBAL for the average of 3
measurements at each incremental measurement
during the duration of the experiments.
0 1 2 3 4 5 6
0
0.005
0.01
0.015
0.02
0.025
Time (days)
Co
nc
en
tra
tio
n (
mM
)
data1
data2
data3
5-FU detected
FUPA detected
FBAL detected

87
Fig. 27b Thermal/acidic product chromatograph results
in screening for 5-FU for the average and deviation of 3
measurements at each incremental measurement
during the duration of the experiments.
0 1 2 3 4 5 60.019
0.0195
0.02
0.0205
0.021
0.0215
0.022
0.0225
0.023
0.0235
0.024
Time (days)
Co
nc
en
tra
tio
n (
mM
)
5-FU

88
Fig. 27c Thermal/acidic product chromatograph results
in screening for FUPA for the average and deviation of
3 measurements at each incremental measurement
during the duration of the experiments.
0 1 2 3 4 5 6-1.5
-1
-0.5
0
0.5
1
1.5
2
2.5
3
3.5x 10
-3
Time (days)
Co
nc
en
tra
tio
n (
mM
)
FUPA

89
0 1 2 3 4 5 6-2
-1
0
1
2
3
4
5x 10
-4
Time (days)
Co
nc
en
tra
tio
n (
mM
)
FBAL
Fig. 27d Thermal/acidic product chromatograph results
in screening for FBAL for the average and deviation of
3 measurements at each incremental measurement
during the duration of the experiments.

90
Fig. 28a Thermal/saline product chromatograph results
in screening for 5-FU, FUPA; FBAL for the average of 3
measurements at each incremental measurement
during the duration of the experiments.
0 0.05 0.1 0.15 0.2 0.25 0.3 0.35 0.4
0
0.005
0.01
0.015
0.02
Time (days)
Co
nc
en
tra
tio
n (
mM
)
data1
data2
data3
5-FU detected
FUPA detected
FBAL detected

91
Fig. 28b Thermal/saline product chromatograph results
in screening for 5-FU for the average and deviation of 3
measurements at each incremental measurement during
the duration of the experiments.
0 0.05 0.1 0.15 0.2 0.25 0.3 0.35 0.4
0
0.005
0.01
0.015
0.02
Time (days)
Co
nc
en
tra
tio
n (
mM
)
5-FU

92
Fig. 28c Thermal/saline product chromatograph results
in screening for 5-FUPA for the average and deviation
of 3 measurements at each incremental measurement
during the duration of the experiments.
0 0.05 0.1 0.15 0.2 0.25 0.3 0.35 0.4
-0.5
0
0.5
1
1.5
2
2.5
3
3.5x 10
-3
Time (days)
Co
nc
en
tra
tio
n (
mM
)
FUPA

93
Fig. 28d Thermal/saline product chromatograph results
in screening for 5-FBAL for the average and deviation
of 3 measurements at each incremental measurement
during the duration of the experiments.
0 0.05 0.1 0.15 0.2 0.25 0.3 0.35 0.4
-1
-0.5
0
0.5
1
1.5
2
2.5
3
3.5
4
x 10-4
Time (days)
Co
nc
en
tra
tio
n (
mM
)
FBAL

94
Fig. 29a Photolytic/alkaline average quantitative results over time
after screening for 5-FU, FUPA; FBAL for the average of 3
measurements at each incremental measurement during the
duration of the experiments.
0 0.2 0.4 0.6 0.8 1
0
0.005
0.01
0.015
0.02
0.025
Time (days)
Co
nc
en
tra
tio
n (
mM
)
data1
data2
data3
5-FU detected
FUPA detected
FBAL detected

95
0 0.2 0.4 0.6 0.8 1
0
0.005
0.01
0.015
0.02
0.025
Time (days)
Co
nc
en
tra
tio
n (
mM
)
5-FU
Fig. 29b Photolytic/alkaline quantitative results over time
after screening for 5-FU for the average and deviation of
3 measurements at each incremental measurement
during the duration of the experiments.
.

96
Fig. 29c Photolytic/alkaline quantitative results over
time after screening for FUPA for the average and
deviation of 3 measurements at each incremental
measurement during the duration of the
experiments.
0 0.2 0.4 0.6 0.8 10
1
2
3
4
5
6x 10
-4
Time (days)
Co
nc
en
tra
tio
n (
mM
)
FUPA

97
0 0.2 0.4 0.6 0.8 1-1
0
1
2
3
4
5
6
7x 10
-4
Time (days)
Co
nc
en
tra
tio
n (
mM
)
FBAL
Fig. 29d Photolytic/alkaline quantitative results over time
after screening for FBAL for the average and deviation of 3
measurements at each incremental measurement during the
duration of the experiments.

98
lV.4 SUMMARY
Hydrolysis is a chemical reaction during which molecules of water (H2O)
are split into hydrogen cations (H+) and hydroxide (OH-) in the process of a
chemical mechanism. This process is important, environmentally, because
hydrolysable chemicals make their way into ground waters and streams, leaching
and runoff. Though the rates are independent of microbial population and oxygen
supply, they are dependent upon pH, temperature and concentrations.
Understanding more about hydrolysis is useful in predicting the fate of fresh
water systems. These can be determined by the derivation of kinetic data. The
effects saline solution (0.005g/mL NaClO) had in this process. This particular
study dealt with combining Temperature (90C) and NaClO for degradation which
demonstrated that this sort saline significantly influenced thermolysis which by
itself was minimum(high temperatures alone used to force degrade). In general,
saline is known to influence hydrolysis as a function of the substrate. If the
substrate is an acid, one can expect an increase in hydrolysis; shown with the
following equation:
More so, since this study used NaClO this time around, the production of gas
enhanced degradation even more than what would be anticipated via use of
regular salt water. That difference may be reasoned here:
[28]

99
HClO + H+ + H+ + Cl- Cl2 + H2O (acidic conditions)
H2O H+ + OH-
Kw = [H+][OH-]
pKw = 10^-Kw
Kw is Temperature Dependent
Thus,
↑Temp ∞ ↑Cl2 (g)
↑Cl2 (g) ∞ ↑Cavitation ∞ ↑ Degradation
Photolysis may be similar to thermolysis with respect to the fact that both drive
the facilitation of hydrolysis via the “Reduction” route. The UV light absorbed by
the sample’s solute molecules acts similar to the absorption of heat (temperature
rise). This drives the initial reduction step. Thereafter, a certain amount of
remaining aqueous solvent undergoes equilibrium enough to facilitate the
subsequent conversion to FUPA. Importantly however, remaining solvent is not
sufficiently equilibrated to cause further reduction. This is due to the fact that OH-
is more abundant than H+ in the presence of TiO2 and UV light which generate
various radicals along with OH. This occurs via a series of mini reactions. These
reactions create an imbalance within the system such that FUPA can’t be further
reduced to yield FBAL. Such a product may be obtained with a forced
thermolysis which calls for a need for further investigations.
Thermal/acidic series (figure 27a) and as seen basically nothing is
happening which confirms what was inferred from the UV analysis (fig. 13).

100
Researchers F. XU et al. [27] got only 0.1% degradation of their original
compound (5-FU) to contribute to formation of a degradation product which they
did not identify or characterize, specifically. In the present study, Le Chatelier’s
Principle [29] was used in order to justify any regrouping to some sort of stability
when an aqueous matrix’s natural equilibrium (Reaction Scheme 1: H2O H+ +
OH-) may be offset by some external influence (another substance, modifying
pH, etc.). The situation here involves that natural balance being offset by heat or
raise in Temperature (Rxn Scheme 2: 2H2O + 2H2(g) + O2(g) ) as was
previously mentioned. The external influence most greatly affecting the
equilibrium can be attributed to the acidic conditions (H+ions). However, acidic
conditions have no influence on an inclination towards gaseous conditions((Rxn
Scheme 3: H++ H2(g) + O2(g))→ no reaction)) [23] whereas a previous discussion
of thermal/alkali conditions does facilitate some equilibrium adjustments((Rxn
Scheme 4: OH- + H2(g) + O2(g))→ [OH- H2])) [30] This in turn leads to an
influence on the hydrolysis of 5-FU. Thus with no equilibrium of hydronium and
hydroxide ions, there is no hydrolysis of 5-FU in this thermal/acidic study.
Again, looking at Table 6/Degradation Summary Table, we see kFU/t1/2 for
thermal/saline study is -0.0597mMol/day/~0.0624 day versus kFU/t1/2 for
thermal/acidic’s -0.00013mM/day/~ 86.9 days. Thermal degradation alone on 5-
FU looked very similar to thermal/acidic using UV Absorption monitoring. So it is
easy to assume that the little degradation that occurred for the thermal alone may
be equal of magnitude to what Thermal/Acidic showed. Therefore, saline put in
the midst of an ordinary thermal study enhances the degradation for the

101
compound of interest. Y. Yang et al [31] looked at the effects that saline could
have in various processes focused on the removal(degradation) of organic
contaminants from industrial and municipal wastewaters per Y. Yang et al [31].

102
Table 6. Degradation Study.

103
These type of scenarios are good in trying to fully understand mechanisms
behind hydrolysis processes which can be related here with: Thermal/Saline
Photolytic/Alkali Thermal/Alkali Thermal/Acidic.
Thus, the novelty of this study can be appreciated which is a first for 5-FU and
should stir up enough interests for follow up study to be pursued.

104
REFERENCES
[1] F.M. Christensen, Pharmaceuticals in the Environment-A Human Risk?, Regul. Toxicol. Pharmacol., 28 (1998) 212-221. [2] D. Borikar, S. Jasim, M. Mohseni, L. Bragg, M. Servos, S. Ndiongue, L. Moore, Removal of pharmaceuticals, personal care products and endocrine disrupting compounds and reduction of disinfection by-products using ozone/H2O2 and UV/H2O2 processes, in, International Ozone Association, 2011, pp. 406-423. [3] P. Goswami, J.C. Kalita, Endocrine disrupting effects of butylparaben: a review, Int. Res. J. Pharm., 4 (2013) 13-14. [4] A. Pop, C. Berce, P. Bolfa, A. Nagy, C. Catoi, I.-B. Dumitrescu, L. Silaghi-Dumitrescu, F. Loghin, Evaluation of the possible endocrine disruptive effect of butylated hydroxyanisole, butylated hydroxytoluene and propyl gallate in immaturre female rats, Farmacia (Bucharest, Rom.), 61 (2013) 202-211. [5] C. Miege, J.M. Choubert, L. Ribeiro, M. Eusebe, M. Coquery, Fate of pharmaceuticals and personal care products in wastewater treatment plants - Conception of a database and first results, Environ. Pollut. (Oxford, U. K.), 157 (2009) 1721-1726. [6] S. Li, A. Wang, W. Jiang, Z. Guan, Pharmacokinetic characteristics and anticancer effects of 5-Fluorouracil loaded nanoparticles, BMC Cancer, 8 (2008) No pp. given. [7] Y. Hirahara, H. Ueno, K. Nakamuro, Aqueous photodegradation of fenthion by ultraviolet B irradiation: contribution of singlet oxygen in photodegradation and photochemical hydrolysis, Water Res., 37 (2003) 468-476. [8] J. Bernadou, J.P. Armand, A. Lopez, M.C. Malet-Martino, R. Martino, Complete urinary excretion profile of 5-fluorouracil during a six-day chemotherapeutic schedule, as resolved by 19F nuclear magnetic resonance, Clin Chem, 31 (1985) 846-848. [9] Fars K. Alanzi, Alaa Eldeen Yassin, Mahmound El-Badry, Hammam A. Mowafy; Ibrahim A. Alsarra: Validated High-Performance Liquid Chromatographic Technique for Determinattion of 5-Fluorouracil: Applicatins to stability Studies and Simulated Colonic Media. Jounal of Chromatographic Science. Vol. 47, August 2009 pages 558-563.
[10] Manish Aghi, Ting-Chao Cho and E Antonio Chiocca. Synergistic Anticancer Effects of Ganciclovir/ Thymidine Kinase and 5-Fluorocytosine/ Cytosine

105
Deaminase Gene Therapies. Journal of National Cancer Institute. Volume 90 Issue 5, 370-380. [11] A. Zaanan, L-M Dumant, M-A Loriot, J taieb and C. Narjoz. A case of 5-FU-Related Severe Toxicity Associated with the p.Y186CDPYD variant. Clinical Pharmacology and Therapeutics. 13 September 2013, page 183. [12] C. Huang, G. Balakrishnan, T. Spiro, Protein secondary structure from deep-UV resonance raman spectroscopy, Journal of Raman spectroscopy : JRS, 37 (2006) 277-282. [13] I.K. Lednev, V.V. Ermolenkov, W. He, M. Xu, Deep-UV Raman spectrometer tunable between 193 and 205 nm for structural characterization of proteins, Anal. Bioanal. Chem., 381 (2005) 431-437. [14] H. Tanak, A.A. Aar, O. Büyükgüngör, Quantum-chemical, spectroscopic and X-ray diffraction studies of (E)-2-[(2-Bromophenyl)iminomethyl]-4-trifluoromethoxyphenol, Spectrochimica Acta - Part A: Molecular and Biomolecular Spectroscopy, 87 (2012) 15-24. [15] H. Yekeler, D. Ozbakir, Concerning the solvent effect in the tautomerism of uracil, 5-fluorouracil, and thymine by density-functional theory and ab initio calculations, J. Mol. Model., 7 (2001) 103-111. [16] Analysis of Drugs and Poisons, http://mtnviewfarm.net/drugs-poisons-0783.html
[17] HK. Khairnar, RJ. Oswal, SS. Kshirsayer, PS. Chaudhari and JP. Bayas. New Simple UV Spectrophotometric Method for Determination of Ganciclovir in Bulk and Capsule Formation. International Journal of research in Pharmaceutical and Biomedical Sciences Vol. 3(2) Apr-Jun2012.
[18] V.K. Rastogi, M.A. Palafox, Vibrational spectra, tautomerism and thermodynamics of anticarcinogenic drug: 5-Fluorouracil, Spectrochimica Acta Part A: Molecular and Biomolecular Spectroscopy, 79 (2011) 970-977. [19] I. Pavel, S. Cota, S. Cîntǎ-Pînzaru, W. Kiefer, Raman, surface enhanced raman spectroscopy, and DFT calculations: A powerful approach for the identification and characterization of 5-fluorouracil anticarcinogenic drug species, Journal of Physical Chemistry A, 109 (2005) 9945-9952. [20] K. Hosseini, W. March, F.H.M. Jongsma, F. Hendrikse; M. Motamedi: Noninvasive Detection of Ganciclovir in Ocular Tissue by Raman Spectroscopy: Implication for Monitoring of Drug Release, Journal of Ocular Pharmacology and Therapeutics, 18 (3) (2002) 277-285.

106
[21] K. Dobrosz-Teperek, Z. Zwierzchowska, W. Lewandowski, K. Bajdor, J.C. Dobrowolski, A.P. Mazurek, Vibrational spectra of 5-halogenouracils part II - Solids, Journal of Molecular Structure, 471 (1998) 115-125. [22] H. Yekeler, D. Ozbakir, Concerning the solvent effect in the tautomerism of uracil, 5-fluorouracil, and thymine by density-functional theory and ab initio calculations, J. Mol. Model., 7 (2001) 103-111. [23] M. Karabacak, E. Kose, A. Atac, Molecular structure (monomeric and dimeric structure) and HOMO–LUMO analysis of 2-aminonicotinic acid: A comparison of calculated spectroscopic properties with FT-IR and UV–vis, Spectrochimica Acta Part A: Molecular and Biomolecular Spectroscopy, 91 (2012) 83-96. [24] H. Tanak, A.A. Aar, O. Büyükgüngör, Quantum-chemical, spectroscopic and X-ray diffraction studies of (E)-2-[(2-Bromophenyl)iminomethyl]-4-trifluoromethoxyphenol, Spectrochimica Acta - Part A: Molecular and Biomolecular Spectroscopy, 87 (2012) 15-24. [25] G. D. Vogels and C. Van Der Drift. Degradation of Purines and Pyrimidines by Microorganisms. Bacteriological Reviews, June 1976, p. 403-468. [26] Alexandra Fournet, Veronique Gilard, Myriam Malet-Martino, Robert Martino, Pierre Canal and Marcel De Formi. Stability of commercial solutions of 5-fluorouracil for continuous infusion in an ambulatory pump. Cancer Chemother Pharmacol (2000) 46: 501-506. [27] Xu Fei, Yan Yu-mei; Yu Wei; Study on the determination of related substances of fluorouracil by HPLC. Qilu Pharmaceutical Affairs 2012 Vol.31, No. 3 pages 143-144.
[28] http://www.nist.gov/data/PDFfiles/jpcrd114.pdf
[29] www.chemguide.co.uk/physical/equilibria/lechatelier.html
[30] www.webbook.nist.gov/chemist
[31] Y. Yang, J. J. Pignatello, J. Ma and W. A. Mitch. Comparison of Halide Impacts on the Efficiency of Contaminant Degradation by Sulfate and Hydroxyl Radical-based Advanced Oxidation Processes (AOPs), Environ. Sci. Technol. 2014, 48, 2344-2351.

107
APPENDIX
0051
77
SampleName: 0_05R1
Inte
nsity
300.00
400.00
500.00
600.00
700.00
800.00
900.00
1000.00
1100.00
1200.00
1300.00
Minutes
1.00 2.00 3.00 4.00 5.00 6.00 7.00 8.00 9.00 10.00 11.00 12.00 13.00 14.00
Fig. 25a product chromatographs for 0.05 ppm FAC 1st replicate.

108
105
SampleName: 0_05R1
Inte
nsity
260.00
280.00
300.00
320.00
340.00
360.00
380.00
400.00
420.00
440.00
460.00
480.00
Minutes
1.00 2.00 3.00 4.00 5.00 6.00 7.00 8.00 9.00 10.00 11.00 12.00 13.00 14.00
Fig. 25b product chromatographs for 0.05 ppm FMASld 1st replicate.

109
106
SampleName: 0_05R1
Inte
nsity
0.00
200.00
400.00
600.00
800.00
1000.00
1200.00
1400.00
1600.00
1800.00
2000.00
2200.00
2400.00
Minutes
1.00 2.00 3.00 4.00 5.00 6.00 7.00 8.00 9.00 10.00 11.00 12.00 13.00 14.00
Fig. 25c product chromatographs for 0.05 ppm FBAL 1st replicate.

110
149
SampleName: 0_05R1
Inte
nsity
250.00
300.00
350.00
400.00
450.00
500.00
550.00
600.00
650.00
700.00
Minutes
1.00 2.00 3.00 4.00 5.00 6.00 7.00 8.00 9.00 10.00 11.00 12.00 13.00 14.00
Fig. 25d product chromatographs for 0.05 ppm FUPA 1st replicate.

111
129
SampleName: 0_05R1
Inte
nsity
255.00
260.00
265.00
270.00
275.00
280.00
285.00
290.00
295.00
300.00
305.00
310.00
315.00
320.00
Minutes
1.00 2.00 3.00 4.00 5.00 6.00 7.00 8.00 9.00 10.00 11.00 12.00 13.00 14.00
Fig. 25e product chromatographs for 0.05 ppm 5-FU 1st replicate.

112
0052
77
SampleName: 0_05R2
Inte
nsity
200.00
400.00
600.00
800.00
1000.00
1200.00
1400.00
1600.00
1800.00
2000.00
2200.00
Minutes
1.00 2.00 3.00 4.00 5.00 6.00 7.00 8.00 9.00 10.00 11.00 12.00 13.00 14.00
Fig. 25f product chromatographs for 0.05 ppm FAC 2nd replicate.

113
105
SampleName: 0_05R2
Inte
nsity
260.00
280.00
300.00
320.00
340.00
360.00
380.00
400.00
420.00
440.00
460.00
480.00
Minutes
1.00 2.00 3.00 4.00 5.00 6.00 7.00 8.00 9.00 10.00 11.00 12.00 13.00 14.00
Fig. 25g product chromatographs for 0.05 ppm FMASld 2nd replicate.

114
106
SampleName: 0_05R2
Inte
nsity
0.00
100.00
200.00
300.00
400.00
500.00
600.00
700.00
800.00
900.00
1000.00
1100.00
1200.00
1300.00
1400.00
1500.00
1600.00
Minutes
1.00 2.00 3.00 4.00 5.00 6.00 7.00 8.00 9.00 10.00 11.00 12.00 13.00 14.00
Fig. 25h product chromatographs for 0.05 ppm FBAL 2nd replicate.

115
149
SampleName: 0_05R2
Inte
nsity
260.00
280.00
300.00
320.00
340.00
360.00
380.00
400.00
420.00
440.00
460.00
480.00
500.00
520.00
540.00
560.00
580.00
600.00
620.00
640.00
660.00
Minutes
1.00 2.00 3.00 4.00 5.00 6.00 7.00 8.00 9.00 10.00 11.00 12.00 13.00 14.00
Fig. 25i product chromatographs for 0.05 ppm FUPA 2nd replicate.

116
129
SampleName: 0_05R2
Inte
nsity
260.00
265.00
270.00
275.00
280.00
285.00
290.00
295.00
300.00
305.00
310.00
315.00
320.00
325.00
330.00
Minutes
1.00 2.00 3.00 4.00 5.00 6.00 7.00 8.00 9.00 10.00 11.00 12.00 13.00 14.00
Fig. 25j product chromatographs for 0.05 ppm 5-FU 2nd replicate.

117
0251
77
SampleName: 0_25R1
Inte
nsity
0.00
500.00
1000.00
1500.00
2000.00
2500.00
3000.00
3500.00
4000.00
4500.00
5000.00
Minutes
1.00 2.00 3.00 4.00 5.00 6.00 7.00 8.00 9.00 10.00 11.00 12.00 13.00 14.00
Fig. 25k product chromatographs for 0.025 ppm FAC 1st replicate.

118
105
SampleName: 0_25R1
Inte
nsity
260.00
280.00
300.00
320.00
340.00
360.00
380.00
400.00
420.00
440.00
460.00
480.00
500.00
520.00
Minutes
1.00 2.00 3.00 4.00 5.00 6.00 7.00 8.00 9.00 10.00 11.00 12.00 13.00 14.00
Fig. 25l product chromatographs for 0.025 ppm FMASld 1st replicate.

119
106
SampleName: 0_25R1
Inte
nsity
100.00
200.00
300.00
400.00
500.00
600.00
700.00
800.00
900.00
1000.00
Minutes
1.00 2.00 3.00 4.00 5.00 6.00 7.00 8.00 9.00 10.00 11.00 12.00 13.00 14.00
Fig. 25m product chromatographs for 0.025 ppm FBAL 1st replicate.

120
149
SampleName: 0_25R1
Inte
nsity
240.00
260.00
280.00
300.00
320.00
340.00
360.00
380.00
400.00
420.00
440.00
460.00
480.00
500.00
520.00
540.00
560.00
580.00
Minutes
1.00 2.00 3.00 4.00 5.00 6.00 7.00 8.00 9.00 10.00 11.00 12.00 13.00 14.00
Fig. 25n product chromatographs for 0.025 ppm FUPA 1st replicate.

121
129
SampleName: 0_25R1
Inte
nsity
250.00
260.00
270.00
280.00
290.00
300.00
310.00
320.00
330.00
340.00
350.00
360.00
370.00
Minutes
1.00 2.00 3.00 4.00 5.00 6.00 7.00 8.00 9.00 10.00 11.00 12.00 13.00 14.00
Fig. 25o product chromatographs for 0.025 ppm 5-FU 1st replicate.

122
0252
77
SampleName: 0_25R2
Inte
nsity
0.00
500.00
1000.00
1500.00
2000.00
2500.00
3000.00
3500.00
4000.00
4500.00
5000.00
5500.00
6000.00
6500.00
7000.00
Minutes
1.00 2.00 3.00 4.00 5.00 6.00 7.00 8.00 9.00 10.00 11.00 12.00 13.00 14.00
Fig. 25p product chromatographs for 0.025 ppm FAC 2nd replicate.

123
105
SampleName: 0_25R2
Inte
nsity
240.00
260.00
280.00
300.00
320.00
340.00
360.00
380.00
400.00
420.00
440.00
460.00
480.00
500.00
520.00
540.00
560.00
Minutes
1.00 2.00 3.00 4.00 5.00 6.00 7.00 8.00 9.00 10.00 11.00 12.00 13.00 14.00
Fig. 25q product chromatographs for 0.025 ppm FMASld 2nd replicate.

124
106
SampleName: 0_25R2
Inte
nsity
100.00
200.00
300.00
400.00
500.00
600.00
700.00
800.00
900.00
1000.00
1100.00
1200.00
1300.00
Minutes
1.00 2.00 3.00 4.00 5.00 6.00 7.00 8.00 9.00 10.00 11.00 12.00 13.00 14.00
Fig. 25r product chromatographs for 0.025 ppm FBAL 2nd replicate.

125
149
SampleName: 0_25R2
Inte
nsity
240.00
260.00
280.00
300.00
320.00
340.00
360.00
380.00
400.00
420.00
440.00
460.00
480.00
500.00
520.00
540.00
560.00
580.00
600.00
620.00
Minutes
1.00 2.00 3.00 4.00 5.00 6.00 7.00 8.00 9.00 10.00 11.00 12.00 13.00 14.00
Fig. 25s product chromatographs for 0.025 ppm FUPA 2nd replicate.

126
129
SampleName: 0_25R2
Inte
nsity
240.00
250.00
260.00
270.00
280.00
290.00
300.00
310.00
320.00
330.00
340.00
350.00
360.00
370.00
Minutes
1.00 2.00 3.00 4.00 5.00 6.00 7.00 8.00 9.00 10.00 11.00 12.00 13.00 14.00
Fig. 25t product chromatographs for 0.025 ppm 5-FU 2nd replicate.

127
011
77
SampleName: 0_1R1
Inte
nsity
0.00
500.00
1000.00
1500.00
2000.00
2500.00
3000.00
3500.00
4000.00
4500.00
5000.00
5500.00
Minutes
1.00 2.00 3.00 4.00 5.00 6.00 7.00 8.00 9.00 10.00 11.00 12.00 13.00 14.00
Fig. 25u product chromatographs for 0.01 ppm FAC 1st replicate.

128
105
SampleName: 0_1R1
Inte
nsity
250.00
300.00
350.00
400.00
450.00
500.00
550.00
600.00
650.00
700.00
750.00
Minutes
1.00 2.00 3.00 4.00 5.00 6.00 7.00 8.00 9.00 10.00 11.00 12.00 13.00 14.00
Fig. 25v product chromatographs for 0.01 ppm FMASld 1st replicate.
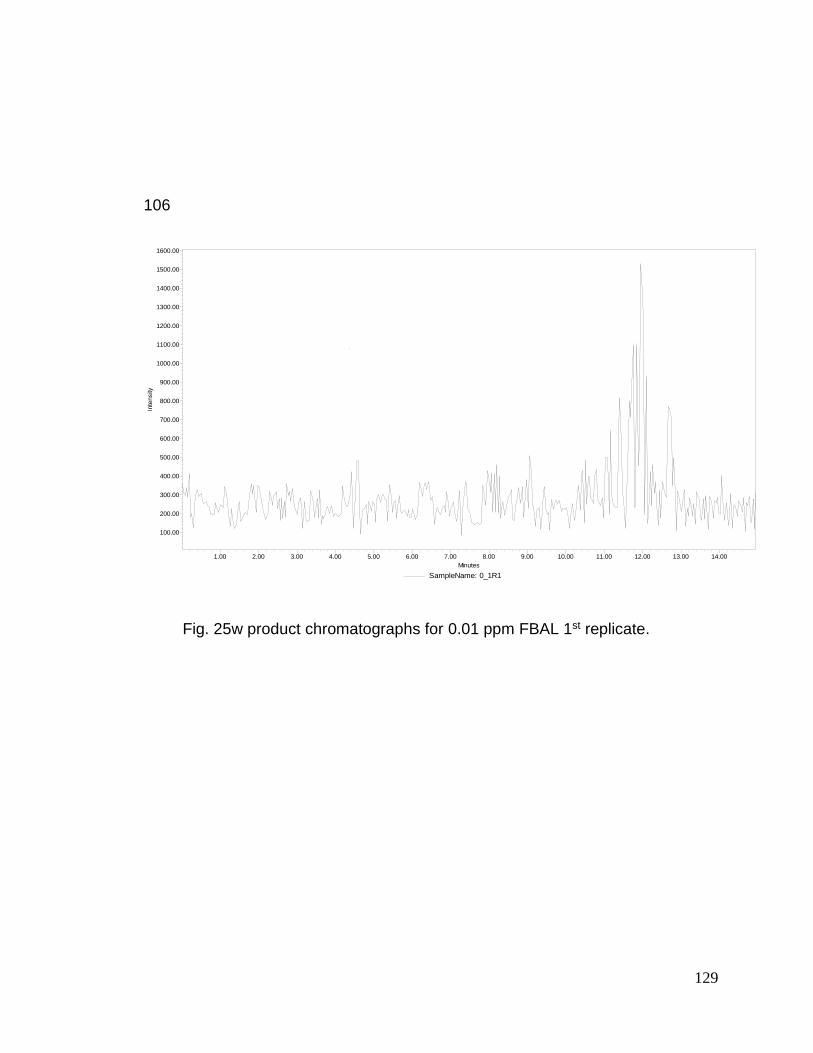
129
106
SampleName: 0_1R1
Inte
nsity
100.00
200.00
300.00
400.00
500.00
600.00
700.00
800.00
900.00
1000.00
1100.00
1200.00
1300.00
1400.00
1500.00
1600.00
Minutes
1.00 2.00 3.00 4.00 5.00 6.00 7.00 8.00 9.00 10.00 11.00 12.00 13.00 14.00
Fig. 25w product chromatographs for 0.01 ppm FBAL 1st replicate.

130
149
SampleName: 0_1R1
Inte
nsity
220.00
240.00
260.00
280.00
300.00
320.00
340.00
360.00
380.00
400.00
420.00
440.00
460.00
480.00
500.00
520.00
540.00
560.00
580.00
600.00
Minutes
1.00 2.00 3.00 4.00 5.00 6.00 7.00 8.00 9.00 10.00 11.00 12.00 13.00 14.00
Fig. 25x product chromatographs for 0.01 ppm FUPA 1st replicate.

131
129
SampleName: 0_1R1
Inte
nsity
230.00
240.00
250.00
260.00
270.00
280.00
290.00
300.00
310.00
320.00
Minutes
1.00 2.00 3.00 4.00 5.00 6.00 7.00 8.00 9.00 10.00 11.00 12.00 13.00 14.00
Fig. 25y product chromatographs for 0.01 ppm 5-FU 1st replicate.

132
012
77
SampleName: 0_1R2
Inte
nsity
0.00
500.00
1000.00
1500.00
2000.00
2500.00
3000.00
3500.00
4000.00
4500.00
5000.00
5500.00
Minutes
1.00 2.00 3.00 4.00 5.00 6.00 7.00 8.00 9.00 10.00 11.00 12.00 13.00 14.00
Fig. 25z product chromatographs for 0.01 ppm FAC 2nd replicate.

133
105
SampleName: 0_1R2
Inte
nsity
200.00
250.00
300.00
350.00
400.00
450.00
500.00
550.00
600.00
650.00
700.00
750.00
800.00
850.00
900.00
Minutes
1.00 2.00 3.00 4.00 5.00 6.00 7.00 8.00 9.00 10.00 11.00 12.00 13.00 14.00
Fig. 25aa product chromatographs for 0.01 ppm FMASld 2nd replicate.
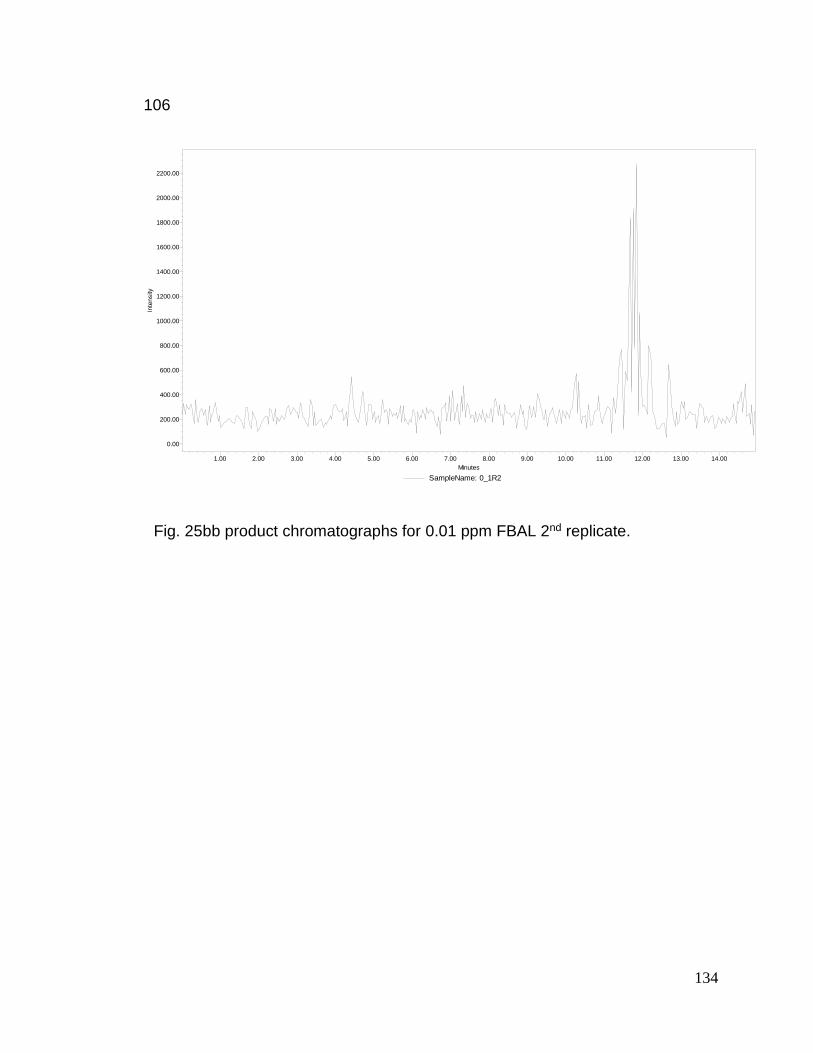
134
106
SampleName: 0_1R2
Inte
nsity
0.00
200.00
400.00
600.00
800.00
1000.00
1200.00
1400.00
1600.00
1800.00
2000.00
2200.00
Minutes
1.00 2.00 3.00 4.00 5.00 6.00 7.00 8.00 9.00 10.00 11.00 12.00 13.00 14.00
Fig. 25bb product chromatographs for 0.01 ppm FBAL 2nd replicate.

135
149
SampleName: 0_1R2
Inte
nsity
220.00
240.00
260.00
280.00
300.00
320.00
340.00
360.00
380.00
400.00
420.00
440.00
460.00
480.00
500.00
520.00
Minutes
1.00 2.00 3.00 4.00 5.00 6.00 7.00 8.00 9.00 10.00 11.00 12.00 13.00 14.00
Fig. 25cc product chromatographs for 0.01 ppm FUPA 2nd replicate.

136
129
SampleName: 0_1R2
Inte
nsity
200.00
210.00
220.00
230.00
240.00
250.00
260.00
270.00
280.00
290.00
300.00
310.00
320.00
Minutes
1.00 2.00 3.00 4.00 5.00 6.00 7.00 8.00 9.00 10.00 11.00 12.00 13.00 14.00
Fig. 25dd product chromatographs for 0.01 ppm 5-FU 2nd replicate.

137
051
77
SampleName: 0_5R1
Inte
nsity
0.0
5000.0
10000.0
15000.0
20000.0
25000.0
30000.0
35000.0
40000.0
45000.0
Minutes
1.00 2.00 3.00 4.00 5.00 6.00 7.00 8.00 9.00 10.00 11.00 12.00 13.00 14.00
Fig. 25ee product chromatographs for 0.5 ppm FAC 1st replicate.

138
105
SampleName: 0_5R1
Inte
nsity
200.00
300.00
400.00
500.00
600.00
700.00
800.00
900.00
1000.00
1100.00
1200.00
1300.00
Minutes
1.00 2.00 3.00 4.00 5.00 6.00 7.00 8.00 9.00 10.00 11.00 12.00 13.00 14.00
Fig. 25ff product chromatographs for 0.5 ppm FMASld 1st replicate.

139
106
SampleName: 0_5R1
Inte
nsity
0.00
100.00
200.00
300.00
400.00
500.00
600.00
700.00
800.00
900.00
1000.00
1100.00
1200.00
1300.00
1400.00
1500.00
1600.00
Minutes
1.00 2.00 3.00 4.00 5.00 6.00 7.00 8.00 9.00 10.00 11.00 12.00 13.00 14.00
Fig. 25gg product chromatographs for 0.5 ppm FBAL 1st replicate.

140
149
SampleName: 0_5R1
Inte
nsity
220.00
240.00
260.00
280.00
300.00
320.00
340.00
360.00
380.00
400.00
420.00
440.00
460.00
480.00
500.00
520.00
540.00
Minutes
1.00 2.00 3.00 4.00 5.00 6.00 7.00 8.00 9.00 10.00 11.00 12.00 13.00 14.00
Fig. 25hh product chromatographs for 0.5 ppm FUPA 1st replicate.

141
129
052
SampleName: 0_5R1
Inte
nsity
200.00
220.00
240.00
260.00
280.00
300.00
320.00
340.00
360.00
380.00
400.00
420.00
440.00
460.00
480.00
500.00
520.00
540.00
560.00
580.00
600.00
Minutes
1.00 2.00 3.00 4.00 5.00 6.00 7.00 8.00 9.00 10.00 11.00 12.00 13.00 14.00
Fig. 25ii product chromatographs for 0.5 ppm 5-FU 1st replicate.

142
77
105
SampleName: 0_5R2
Inte
nsity
0.0
5000.0
10000.0
15000.0
20000.0
25000.0
30000.0
35000.0
40000.0
45000.0
50000.0
55000.0
60000.0
Minutes
1.00 2.00 3.00 4.00 5.00 6.00 7.00 8.00 9.00 10.00 11.00 12.00 13.00 14.00
Fig. 25jj product chromatographs for 0.5 ppm FAC 2nd replicate.

143
106
SampleName: 0_5R2
Inte
nsity
200.00
300.00
400.00
500.00
600.00
700.00
800.00
900.00
1000.00
1100.00
1200.00
1300.00
1400.00
1500.00
Minutes
1.00 2.00 3.00 4.00 5.00 6.00 7.00 8.00 9.00 10.00 11.00 12.00 13.00 14.00
Fig. 25kk product chromatographs for 0.5 ppm FMASld 2nd replicate.

144
SampleName: 0_5R2
Inte
nsity
0.00
100.00
200.00
300.00
400.00
500.00
600.00
700.00
800.00
900.00
1000.00
Minutes
1.00 2.00 3.00 4.00 5.00 6.00 7.00 8.00 9.00 10.00 11.00 12.00 13.00 14.00
Fig. 25ll product chromatographs for 0.5 ppm FBAL 2nd replicate.

145
149
SampleName: 0_5R2
Inte
nsity
220.00
240.00
260.00
280.00
300.00
320.00
340.00
360.00
380.00
400.00
420.00
440.00
460.00
480.00
500.00
520.00
540.00
560.00
580.00
Minutes
1.00 2.00 3.00 4.00 5.00 6.00 7.00 8.00 9.00 10.00 11.00 12.00 13.00 14.00
Fig. 25mm product chromatographs for 0.5 ppm FUPA 2nd replicate.

146
129
SampleName: 0_5R2
Inte
nsity
200.00
250.00
300.00
350.00
400.00
450.00
500.00
550.00
600.00
650.00
700.00
750.00
Minutes
1.00 2.00 3.00 4.00 5.00 6.00 7.00 8.00 9.00 10.00 11.00 12.00 13.00 14.00
Fig. 25nn product chromatographs for 0.5 ppm 5-FU 2nd replicate.

147
11
77
SampleName: 1R1
Inte
nsity
0.0
20000.0
40000.0
60000.0
80000.0
100000.0
120000.0
140000.0
160000.0
180000.0
200000.0
220000.0
240000.0
260000.0
280000.0
300000.0
320000.0
340000.0
Minutes
1.00 2.00 3.00 4.00 5.00 6.00 7.00 8.00 9.00 10.00 11.00 12.00 13.00 14.00
Fig. 25oo product chromatographs for 1.0 ppm FAC 1st replicate.

148
105
SampleName: 1R1
Inte
nsity
200.00
300.00
400.00
500.00
600.00
700.00
800.00
900.00
1000.00
1100.00
1200.00
1300.00
1400.00
1500.00
Minutes
1.00 2.00 3.00 4.00 5.00 6.00 7.00 8.00 9.00 10.00 11.00 12.00 13.00 14.00
Fig. 25pp product chromatographs for 1.0 ppm FMASld 1st replicate.

149
106
SampleName: 1R1
Inte
nsity
0.00
200.00
400.00
600.00
800.00
1000.00
1200.00
1400.00
1600.00
1800.00
Minutes
1.00 2.00 3.00 4.00 5.00 6.00 7.00 8.00 9.00 10.00 11.00 12.00 13.00 14.00
Fig. 25qq product chromatographs for 1.0 ppm FBAL 1st replicate.

150
149
SampleName: 1R1
Inte
nsity
200.00
250.00
300.00
350.00
400.00
450.00
500.00
550.00
600.00
650.00
700.00
750.00
800.00
Minutes
1.00 2.00 3.00 4.00 5.00 6.00 7.00 8.00 9.00 10.00 11.00 12.00 13.00 14.00
Fig. 25rr product chromatograph for 1.0 ppm FUPA 1st replicate.

151
129
SampleName: 1R1
Inte
nsity
200.00
400.00
600.00
800.00
1000.00
1200.00
1400.00
1600.00
1800.00
2000.00
2200.00
2400.00
2600.00
Minutes
1.00 2.00 3.00 4.00 5.00 6.00 7.00 8.00 9.00 10.00 11.00 12.00 13.00 14.00
Fig. 25ss product chromatograph for 1.0 ppm 5-FU 1st replicate.

152
12
77
SampleName: 1R2
Inte
nsity
0
50000
100000
150000
200000
250000
300000
350000
400000
450000
Minutes
1.00 2.00 3.00 4.00 5.00 6.00 7.00 8.00 9.00 10.00 11.00 12.00 13.00 14.00
Fig. 25tt product chromatograph for 1.0 ppm FAC 2nd replicate.

153
105
SampleName: 1R2
Inte
nsity
200.00
300.00
400.00
500.00
600.00
700.00
800.00
900.00
1000.00
1100.00
1200.00
1300.00
1400.00
1500.00
1600.00
1700.00
Minutes
1.00 2.00 3.00 4.00 5.00 6.00 7.00 8.00 9.00 10.00 11.00 12.00 13.00 14.00
Fig. 25uu product chromatograph for 1.0 ppm FMASld 2nd replicate.

154
106
SampleName: 1R2
Inte
nsity
0.00
200.00
400.00
600.00
800.00
1000.00
1200.00
1400.00
1600.00
1800.00
2000.00
2200.00
2400.00
Minutes
1.00 2.00 3.00 4.00 5.00 6.00 7.00 8.00 9.00 10.00 11.00 12.00 13.00 14.00
Fig. 25vv product chromatograph for 1.0 ppm FBAL 2nd replicate.

155
149
SampleName: 1R2
Inte
nsity
200.00
300.00
400.00
500.00
600.00
700.00
800.00
900.00
1000.00
1100.00
Minutes
1.00 2.00 3.00 4.00 5.00 6.00 7.00 8.00 9.00 10.00 11.00 12.00 13.00 14.00
Fig. 25xx product chromatograph for 1.0 ppm FUPA 2nd replicate.

156
129
51
SampleName: 1R2
Inte
nsity
200.00
400.00
600.00
800.00
1000.00
1200.00
1400.00
1600.00
1800.00
2000.00
2200.00
2400.00
Minutes
1.00 2.00 3.00 4.00 5.00 6.00 7.00 8.00 9.00 10.00 11.00 12.00 13.00 14.00
Fig. 25yy product chromatograph for 1.0 ppm 5-FU 2nd replicate.

157
77
SampleName: 5R1
Inte
nsity
0.0
1.0x10⁵
2.0x10⁵
3.0x10⁵
4.0x10⁵
5.0x10⁵
6.0x10⁵
7.0x10⁵
8.0x10⁵
9.0x10⁵
1.0x10⁶
1.1x10⁶
1.2x10⁶
1.3x10⁶
1.4x10⁶
1.5x10⁶
Minutes
1.00 2.00 3.00 4.00 5.00 6.00 7.00 8.00 9.00 10.00 11.00 12.00 13.00 14.00
Fig. 25zz product chromatograph for 5.0 ppm FAC 1st replicate.

158
105
SampleName: 5R1
Inte
nsity
200.00
300.00
400.00
500.00
600.00
700.00
800.00
900.00
1000.00
1100.00
1200.00
1300.00
1400.00
1500.00
Minutes
1.00 2.00 3.00 4.00 5.00 6.00 7.00 8.00 9.00 10.00 11.00 12.00 13.00 14.00
Fig. 25aaa product chromatograph for 5.0 ppm FMASld 1st replicate.

159
106
SampleName: 5R1
Inte
nsity
0.0
2000.0
4000.0
6000.0
8000.0
10000.0
12000.0
14000.0
16000.0
18000.0
20000.0
22000.0
Minutes
1.00 2.00 3.00 4.00 5.00 6.00 7.00 8.00 9.00 10.00 11.00 12.00 13.00 14.00
Fig. 25bbb product chromatograph for 5.0 ppm FBAL 1st replicate.

160
149
SampleName: 5R1
Inte
nsity
200.00
400.00
600.00
800.00
1000.00
1200.00
1400.00
1600.00
1800.00
2000.00
2200.00
2400.00
2600.00
2800.00
3000.00
3200.00
3400.00
3600.00
3800.00
4000.00
Minutes
1.00 2.00 3.00 4.00 5.00 6.00 7.00 8.00 9.00 10.00 11.00 12.00 13.00 14.00
Fig. 25ccc product chromatograph for 5.0 ppm FUPA 1st replicate.

161
129
52
SampleName: 5R1
Inte
nsity
0.0
1000.0
2000.0
3000.0
4000.0
5000.0
6000.0
7000.0
8000.0
9000.0
10000.0
Minutes
1.00 2.00 3.00 4.00 5.00 6.00 7.00 8.00 9.00 10.00 11.00 12.00 13.00 14.00
Fig. 25ddd product chromatograph for 5.0 ppm 5-FU 1st replicate.

162
77
SampleName: 5R2
Inte
nsity
0.0
2.0x10⁵
4.0x10⁵
6.0x10⁵
8.0x10⁵
1.0x10⁶
1.2x10⁶
1.4x10⁶
1.6x10⁶
Minutes
1.00 2.00 3.00 4.00 5.00 6.00 7.00 8.00 9.00 10.00 11.00 12.00 13.00 14.00
Fig. 25eee product chromatograph for 5.0 ppm FAC 2nd replicate.

163
105
106
SampleName: 5R2
Inte
nsity
200.00
300.00
400.00
500.00
600.00
700.00
800.00
900.00
1000.00
1100.00
1200.00
1300.00
1400.00
1500.00
1600.00
Minutes
1.00 2.00 3.00 4.00 5.00 6.00 7.00 8.00 9.00 10.00 11.00 12.00 13.00 14.00
Fig. 25fff product chromatograph for 5.0 ppm FMASld 2nd replicate.

164
149
SampleName: 5R2
Inte
nsity
0.0
2000.0
4000.0
6000.0
8000.0
10000.0
12000.0
14000.0
16000.0
18000.0
20000.0
Minutes
1.00 2.00 3.00 4.00 5.00 6.00 7.00 8.00 9.00 10.00 11.00 12.00 13.00 14.00
Fig. 25ggg product chromatograph for 5.0 ppm FBAL 2nd replicate.

165
SampleName: 5R2
Inte
nsity
200.00
400.00
600.00
800.00
1000.00
1200.00
1400.00
1600.00
1800.00
2000.00
2200.00
2400.00
2600.00
2800.00
3000.00
3200.00
3400.00
3600.00
3800.00
4000.00
Minutes
1.00 2.00 3.00 4.00 5.00 6.00 7.00 8.00 9.00 10.00 11.00 12.00 13.00 14.00
Fig. 25hhh product chromatograph for 5.0 ppm FUPA 2nd replicate.

166
129
SampleName: 5R2
Inte
nsity
0.0
1000.0
2000.0
3000.0
4000.0
5000.0
6000.0
7000.0
8000.0
9000.0
10000.0
Minutes
1.00 2.00 3.00 4.00 5.00 6.00 7.00 8.00 9.00 10.00 11.00 12.00 13.00 14.00
Fig. 25iii product chromatograph for 5.0 ppm 5-FU 2nd replicate.

167
A1r
77
SampleName: A1R
Inte
nsity
0.0
5000.0
10000.0
15000.0
20000.0
25000.0
30000.0
35000.0
40000.0
45000.0
50000.0
55000.0
60000.0
Minutes
1.00 2.00 3.00 4.00 5.00 6.00 7.00 8.00 9.00 10.00 11.00 12.00 13.00 14.00
Fig. 25iii(1) product chromatograph for .05 ppm FAC 1st replicate.

168
105
SampleName: A1R
Inte
nsity
200.00
400.00
600.00
800.00
1000.00
1200.00
1400.00
1600.00
1800.00
2000.00
Minutes
1.00 2.00 3.00 4.00 5.00 6.00 7.00 8.00 9.00 10.00 11.00 12.00 13.00 14.00
Fig. 25iii(2) product chromatograph for .05 ppm FMASld 1st replicate.

169
106
SampleName: A1R
Inte
nsity
0.00
500.00
1000.00
1500.00
2000.00
2500.00
3000.00
3500.00
4000.00
4500.00
Minutes
1.00 2.00 3.00 4.00 5.00 6.00 7.00 8.00 9.00 10.00 11.00 12.00 13.00 14.00
Fig. 25iii(3) product chromatograph for .05 ppm FBAL 1st
replicate.

170
149
SampleName: A1R
Inte
nsity
200.00
400.00
600.00
800.00
1000.00
1200.00
1400.00
1600.00
1800.00
2000.00
2200.00
2400.00
2600.00
Minutes
1.00 2.00 3.00 4.00 5.00 6.00 7.00 8.00 9.00 10.00 11.00 12.00 13.00 14.00
Fig. 25iii(4) product chromatograph for .05 ppm FUPA 1st
replicate.
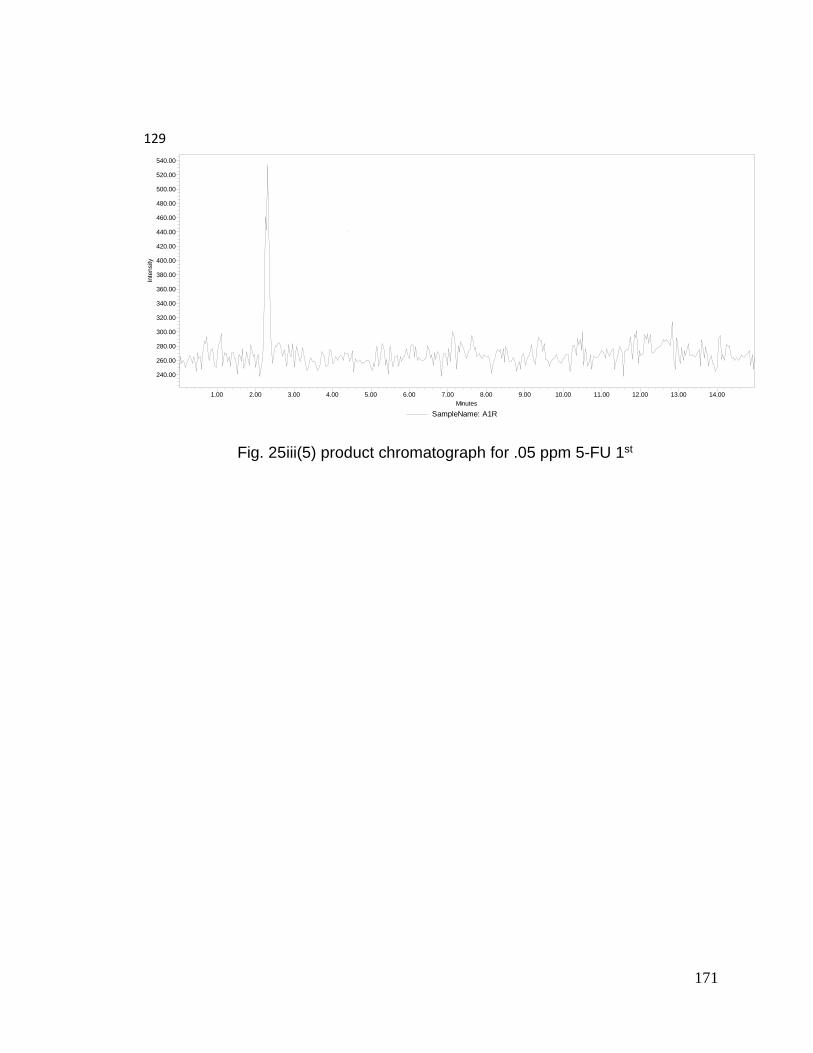
171
129
SampleName: A1R
Inte
nsity
240.00
260.00
280.00
300.00
320.00
340.00
360.00
380.00
400.00
420.00
440.00
460.00
480.00
500.00
520.00
540.00
Minutes
1.00 2.00 3.00 4.00 5.00 6.00 7.00 8.00 9.00 10.00 11.00 12.00 13.00 14.00
Fig. 25iii(5) product chromatograph for .05 ppm 5-FU 1st
replicate.

172
A2
77
SampleName: A2
Inte
nsity
0.0
5000.0
10000.0
15000.0
20000.0
25000.0
30000.0
35000.0
40000.0
45000.0
50000.0
55000.0
Minutes
1.00 2.00 3.00 4.00 5.00 6.00 7.00 8.00 9.00 10.00 11.00 12.00 13.00 14.00
Fig. 25iii(6) product chromatograph for .05 ppm FAC 2nd
replicate.
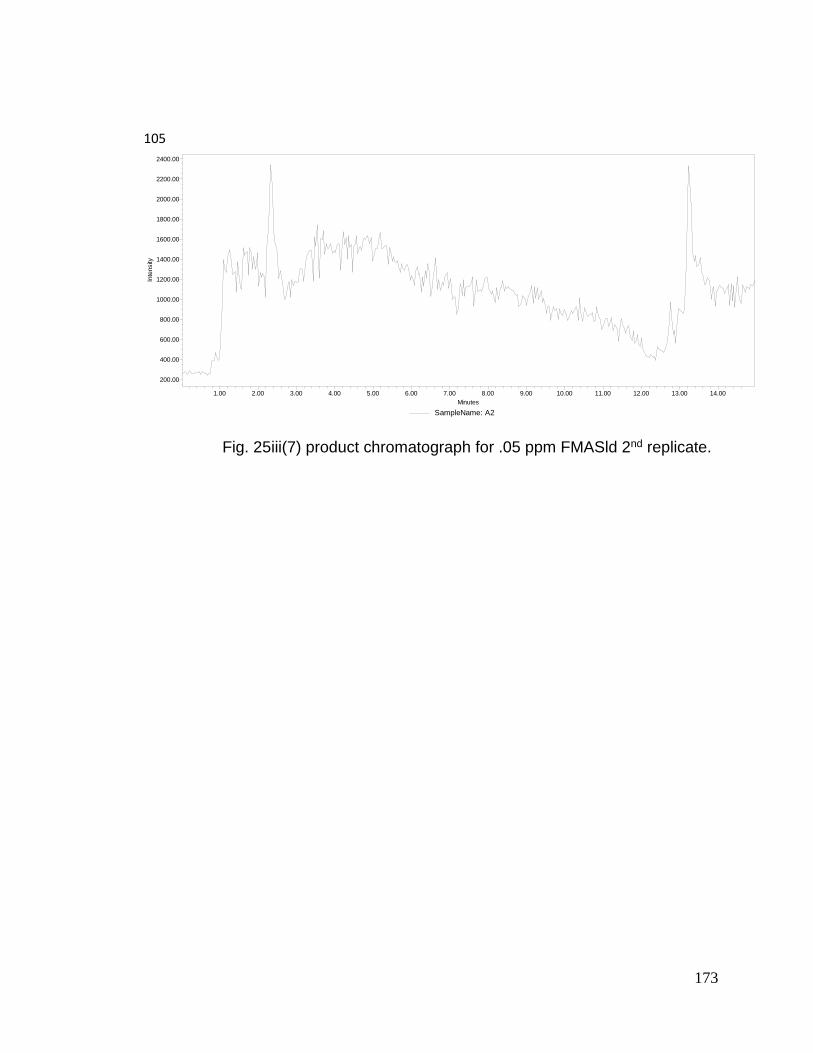
173
105
SampleName: A2
Inte
nsity
200.00
400.00
600.00
800.00
1000.00
1200.00
1400.00
1600.00
1800.00
2000.00
2200.00
2400.00
Minutes
1.00 2.00 3.00 4.00 5.00 6.00 7.00 8.00 9.00 10.00 11.00 12.00 13.00 14.00
Fig. 25iii(7) product chromatograph for .05 ppm FMASld 2nd replicate.

174
106
SampleName: A2
Inte
nsity
0.00
500.00
1000.00
1500.00
2000.00
2500.00
3000.00
3500.00
4000.00
Minutes
1.00 2.00 3.00 4.00 5.00 6.00 7.00 8.00 9.00 10.00 11.00 12.00 13.00 14.00
Fig. 25iii(8) product chromatograph for .05 ppm FBAL 2nd
replicate.

175
149
SampleName: A2
Inte
nsity
200.00
400.00
600.00
800.00
1000.00
1200.00
1400.00
1600.00
1800.00
2000.00
2200.00
2400.00
2600.00
2800.00
3000.00
3200.00
Minutes
1.00 2.00 3.00 4.00 5.00 6.00 7.00 8.00 9.00 10.00 11.00 12.00 13.00 14.00
Fig. 25iii(9) product chromatograph for .05 ppm FUPA 2nd replicate.

176
129
SampleName: A2
Inte
nsity
250.00
300.00
350.00
400.00
450.00
500.00
550.00
600.00
Minutes
1.00 2.00 3.00 4.00 5.00 6.00 7.00 8.00 9.00 10.00 11.00 12.00 13.00 14.00
Fig. 25iii(10) product chromatograph for .05 ppm 5-FU 2nd replicate.

177
A3
77
SampleName: A3
Inte
nsity
0.0
5000.0
10000.0
15000.0
20000.0
25000.0
30000.0
35000.0
40000.0
45000.0
50000.0
55000.0
Minutes
1.00 2.00 3.00 4.00 5.00 6.00 7.00 8.00 9.00 10.00 11.00 12.00 13.00 14.00
Fig. 25iii(11) product chromatograph for .05 ppm FAC 3rd replicate.

178
105
SampleName: A3
Inte
nsity
200.00
400.00
600.00
800.00
1000.00
1200.00
1400.00
1600.00
1800.00
2000.00
2200.00
Minutes
1.00 2.00 3.00 4.00 5.00 6.00 7.00 8.00 9.00 10.00 11.00 12.00 13.00 14.00
Fig. 25iii(12) product chromatograph for .05 ppm FMASld 3rd replicate.

179
106
SampleName: A3
Inte
nsity
0.00
500.00
1000.00
1500.00
2000.00
2500.00
3000.00
3500.00
Minutes
1.00 2.00 3.00 4.00 5.00 6.00 7.00 8.00 9.00 10.00 11.00 12.00 13.00 14.00
Fig. 25iii(13) product chromatograph for .05 ppm FBAL 3rd replicate.
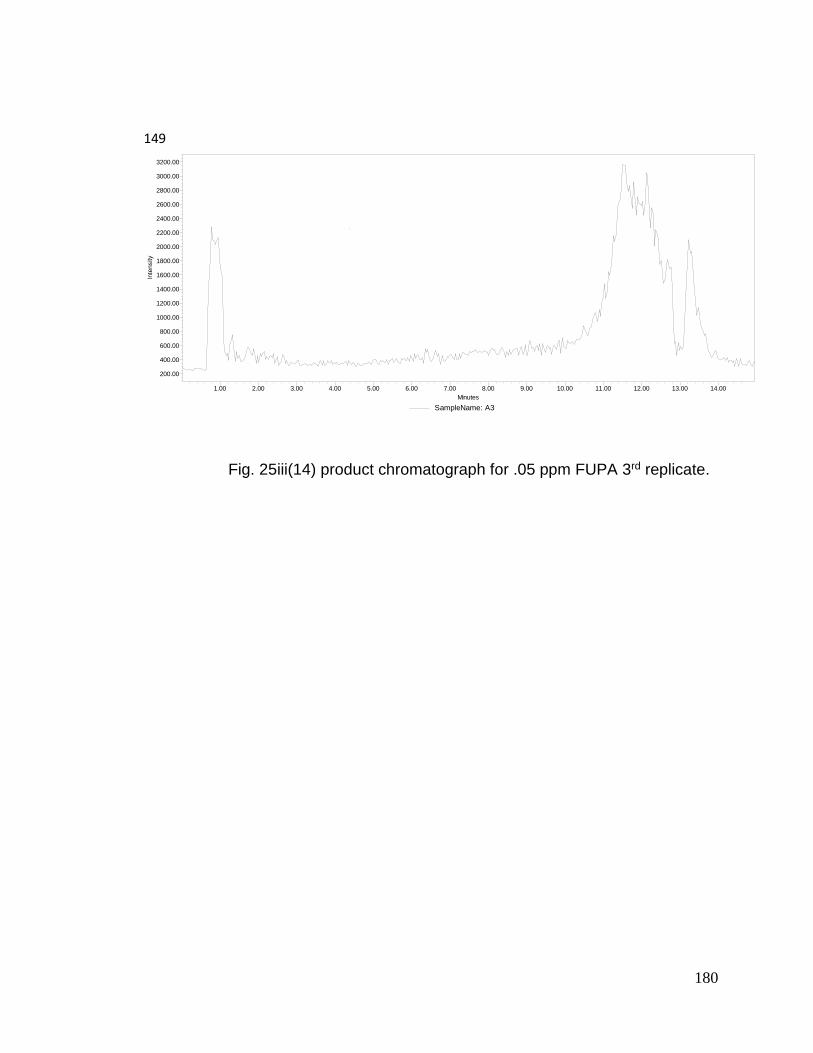
180
149
SampleName: A3
Inte
nsity
200.00
400.00
600.00
800.00
1000.00
1200.00
1400.00
1600.00
1800.00
2000.00
2200.00
2400.00
2600.00
2800.00
3000.00
3200.00
Minutes
1.00 2.00 3.00 4.00 5.00 6.00 7.00 8.00 9.00 10.00 11.00 12.00 13.00 14.00
Fig. 25iii(14) product chromatograph for .05 ppm FUPA 3rd replicate.

181
129
SampleName: A3
Inte
nsity
220.00
240.00
260.00
280.00
300.00
320.00
340.00
360.00
380.00
400.00
Minutes
1.00 2.00 3.00 4.00 5.00 6.00 7.00 8.00 9.00 10.00 11.00 12.00 13.00 14.00
Fig. 25iii(15) product chromatograph for .05 ppm 5-FU 3rd replicate.

182
B1
77
SampleName: B1
Inte
nsity
0.0
10000.0
20000.0
30000.0
40000.0
50000.0
60000.0
70000.0
80000.0
90000.0
100000.0
Minutes
1.00 2.00 3.00 4.00 5.00 6.00 7.00 8.00 9.00 10.00 11.00 12.00 13.00 14.00
Fig. 25iii(16) product chromatograph for .100 ppm FAC 1st replicate.

183
105
SampleName: B1
Inte
nsity
200.00
400.00
600.00
800.00
1000.00
1200.00
1400.00
1600.00
1800.00
2000.00
Minutes
1.00 2.00 3.00 4.00 5.00 6.00 7.00 8.00 9.00 10.00 11.00 12.00 13.00 14.00
Fig. 25iii(17) product chromatograph for .100 ppm FMASld 1st replicate.

184
106
SampleName: B1
Inte
nsity
0.00
500.00
1000.00
1500.00
2000.00
2500.00
3000.00
3500.00
4000.00
4500.00
Minutes
1.00 2.00 3.00 4.00 5.00 6.00 7.00 8.00 9.00 10.00 11.00 12.00 13.00 14.00
Fig. 25iii(18) product chromatograph for .100 ppm FBAL 1st replicate.

185
149
SampleName: B1
Inte
nsity
500.00
1000.00
1500.00
2000.00
2500.00
3000.00
3500.00
Minutes
1.00 2.00 3.00 4.00 5.00 6.00 7.00 8.00 9.00 10.00 11.00 12.00 13.00 14.00
Fig. 25iii(19) product chromatograph for .100 ppm FUPA 1st replicate.

186
129
SampleName: B1
Inte
nsity
200.00
250.00
300.00
350.00
400.00
450.00
500.00
550.00
600.00
650.00
700.00
750.00
800.00
Minutes
1.00 2.00 3.00 4.00 5.00 6.00 7.00 8.00 9.00 10.00 11.00 12.00 13.00 14.00
Fig. 25iii(20) product chromatograph for .100 ppm 5-FU 1st replicate.

187
B2
77
SampleName: B2
Inte
nsity
0.0
10000.0
20000.0
30000.0
40000.0
50000.0
60000.0
70000.0
80000.0
90000.0
100000.0
Minutes
1.00 2.00 3.00 4.00 5.00 6.00 7.00 8.00 9.00 10.00 11.00 12.00 13.00 14.00
Fig. 25iii(21) product chromatograph for .100 ppm FAC 2nd replicate.

188
105
SampleName: B2
Inte
nsity
200.00
400.00
600.00
800.00
1000.00
1200.00
1400.00
1600.00
1800.00
Minutes
1.00 2.00 3.00 4.00 5.00 6.00 7.00 8.00 9.00 10.00 11.00 12.00 13.00 14.00
Fig. 25iii(22) product chromatograph for .100 ppm FMASld 2nd replicate.
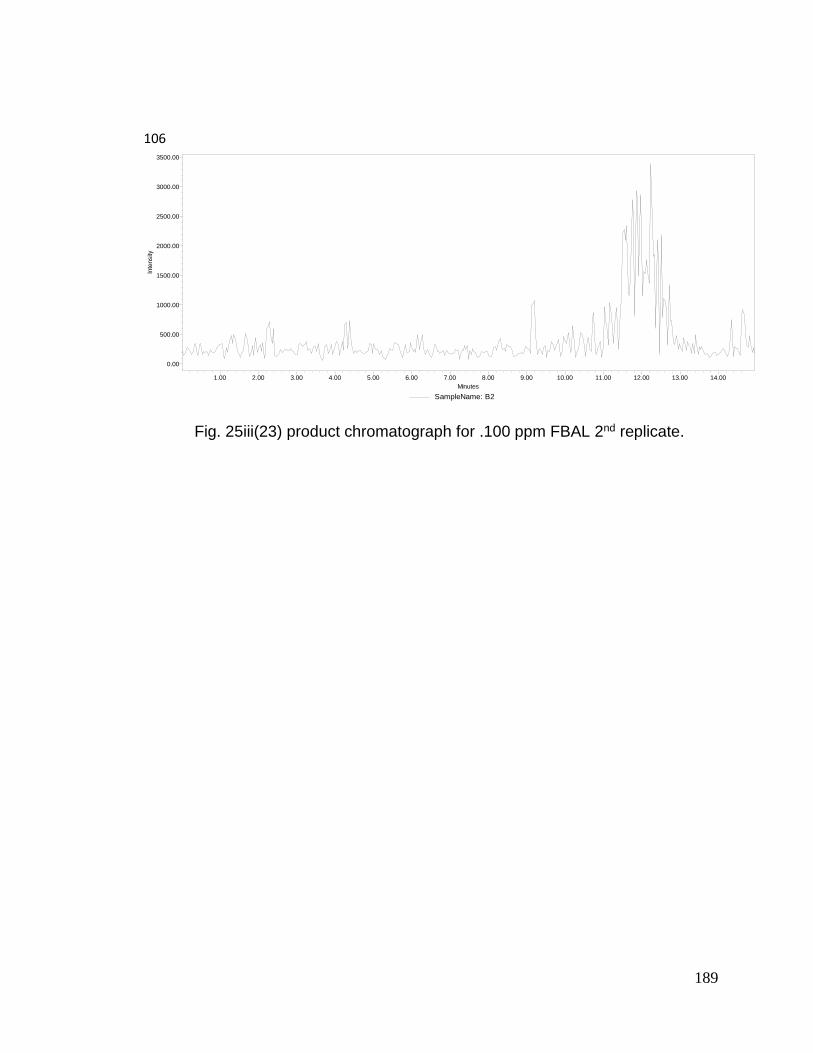
189
106
SampleName: B2
Inte
nsity
0.00
500.00
1000.00
1500.00
2000.00
2500.00
3000.00
3500.00
Minutes
1.00 2.00 3.00 4.00 5.00 6.00 7.00 8.00 9.00 10.00 11.00 12.00 13.00 14.00
Fig. 25iii(23) product chromatograph for .100 ppm FBAL 2nd replicate.

190
149
SampleName: B2
Inte
nsity
200.00
400.00
600.00
800.00
1000.00
1200.00
1400.00
1600.00
1800.00
2000.00
2200.00
2400.00
2600.00
2800.00
3000.00
3200.00
Minutes
1.00 2.00 3.00 4.00 5.00 6.00 7.00 8.00 9.00 10.00 11.00 12.00 13.00 14.00
Fig. 25iii(24) product chromatograph for .100 ppm FUPA 2nd replicate.

191
129
SampleName: B2
Inte
nsity
200.00
300.00
400.00
500.00
600.00
700.00
800.00
900.00
Minutes
1.00 2.00 3.00 4.00 5.00 6.00 7.00 8.00 9.00 10.00 11.00 12.00 13.00 14.00
Fig. 25iii(25) product chromatograph for .100 ppm 5-FU 2nd replicate.

192
B3
77
SampleName: B3
Inte
nsity
0.0
10000.0
20000.0
30000.0
40000.0
50000.0
60000.0
70000.0
80000.0
90000.0
100000.0
Minutes
1.00 2.00 3.00 4.00 5.00 6.00 7.00 8.00 9.00 10.00 11.00 12.00 13.00 14.00
Fig. 25iii(26) product chromatograph for .100 ppm FAC 3rd replicate.

193
105
SampleName: B3
Inte
nsity
200.00
400.00
600.00
800.00
1000.00
1200.00
1400.00
1600.00
1800.00
2000.00
2200.00
Minutes
1.00 2.00 3.00 4.00 5.00 6.00 7.00 8.00 9.00 10.00 11.00 12.00 13.00 14.00
Fig. 25iii(27) product chromatograph for .100 ppm FMASld 3rd replicate.

194
106
SampleName: B3
Inte
nsity
0.00
500.00
1000.00
1500.00
2000.00
2500.00
3000.00
3500.00
4000.00
4500.00
Minutes
1.00 2.00 3.00 4.00 5.00 6.00 7.00 8.00 9.00 10.00 11.00 12.00 13.00 14.00
Fig. 25iii(28) product chromatograph for .100 ppm FBAL 3rd replicate.

195
149
SampleName: B3
Inte
nsity
500.00
1000.00
1500.00
2000.00
2500.00
3000.00
3500.00
Minutes
1.00 2.00 3.00 4.00 5.00 6.00 7.00 8.00 9.00 10.00 11.00 12.00 13.00 14.00
Fig. 25iii(29) product chromatograph for .100 ppm FUPA 3rd replicate.

196
129
SampleName: B3
Inte
nsity
200.00
250.00
300.00
350.00
400.00
450.00
500.00
550.00
Minutes
1.00 2.00 3.00 4.00 5.00 6.00 7.00 8.00 9.00 10.00 11.00 12.00 13.00 14.00
Fig. 25iii(30) product chromatograph for .100 ppm 5-FU 3rd replicate.

197
C1
77
SampleName: C1
Inte
nsity
0.0
20000.0
40000.0
60000.0
80000.0
100000.0
120000.0
140000.0
160000.0
180000.0
200000.0
220000.0
Minutes
1.00 2.00 3.00 4.00 5.00 6.00 7.00 8.00 9.00 10.00 11.00 12.00 13.00 14.00
Fig. 25iii(31) product chromatograph for .250 ppm FAC 1st replicate.

198
105
SampleName: C1
Inte
nsity
200.00
400.00
600.00
800.00
1000.00
1200.00
1400.00
1600.00
1800.00
Minutes
1.00 2.00 3.00 4.00 5.00 6.00 7.00 8.00 9.00 10.00 11.00 12.00 13.00 14.00
Fig. 25iii(32) product chromatograph for .250 ppm FMASld 1st replicate.
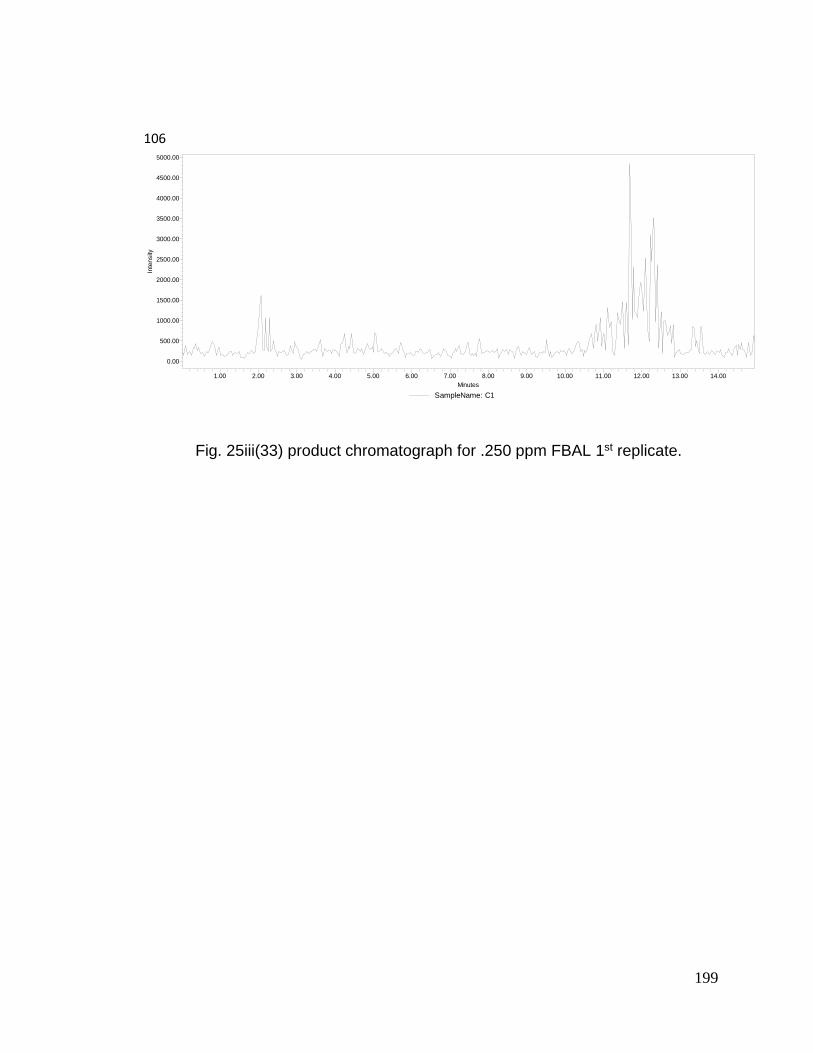
199
106
SampleName: C1
Inte
nsity
0.00
500.00
1000.00
1500.00
2000.00
2500.00
3000.00
3500.00
4000.00
4500.00
5000.00
Minutes
1.00 2.00 3.00 4.00 5.00 6.00 7.00 8.00 9.00 10.00 11.00 12.00 13.00 14.00
Fig. 25iii(33) product chromatograph for .250 ppm FBAL 1st replicate.

200
149
SampleName: C1
Inte
nsity
500.00
1000.00
1500.00
2000.00
2500.00
3000.00
3500.00
Minutes
1.00 2.00 3.00 4.00 5.00 6.00 7.00 8.00 9.00 10.00 11.00 12.00 13.00 14.00
Fig. 25iii(34) product chromatograph for .250 ppm FUPA 1st replicate.

201
129
SampleName: C1
Inte
nsity
200.00
300.00
400.00
500.00
600.00
700.00
800.00
900.00
1000.00
1100.00
1200.00
Minutes
1.00 2.00 3.00 4.00 5.00 6.00 7.00 8.00 9.00 10.00 11.00 12.00 13.00 14.00
Fig. 25iii(35) product chromatograph for .250 ppm 5-FU 1st replicate.

202
C2
77
SampleName: C2
Inte
nsity
0.0
20000.0
40000.0
60000.0
80000.0
100000.0
120000.0
140000.0
160000.0
180000.0
200000.0
220000.0
Minutes
1.00 2.00 3.00 4.00 5.00 6.00 7.00 8.00 9.00 10.00 11.00 12.00 13.00 14.00
Fig. 25iii(36) product chromatograph for .250 ppm FAC 2nd replicate.

203
105
SampleName: C2
Inte
nsity
200.00
400.00
600.00
800.00
1000.00
1200.00
1400.00
1600.00
1800.00
2000.00
2200.00
2400.00
Minutes
1.00 2.00 3.00 4.00 5.00 6.00 7.00 8.00 9.00 10.00 11.00 12.00 13.00 14.00
Fig. 25iii(37) product chromatograph for .250 ppm FMASld 2nd replicate.

204
106
SampleName: C2
Inte
nsity
0.00
500.00
1000.00
1500.00
2000.00
2500.00
3000.00
3500.00
4000.00
Minutes
1.00 2.00 3.00 4.00 5.00 6.00 7.00 8.00 9.00 10.00 11.00 12.00 13.00 14.00
Fig. 25iii(38) product chromatograph for .250 ppm FBAL 2nd replicate.

205
149
SampleName: C2
Inte
nsity
500.00
1000.00
1500.00
2000.00
2500.00
3000.00
3500.00
Minutes
1.00 2.00 3.00 4.00 5.00 6.00 7.00 8.00 9.00 10.00 11.00 12.00 13.00 14.00
Fig. 25iii(39) product chromatograph for .250 ppm FUPA 2nd replicate.

206
129
SampleName: C2
Inte
nsity
200.00
300.00
400.00
500.00
600.00
700.00
800.00
900.00
1000.00
1100.00
1200.00
Minutes
1.00 2.00 3.00 4.00 5.00 6.00 7.00 8.00 9.00 10.00 11.00 12.00 13.00 14.00
Fig. 25iii(40) product chromatograph for .250 ppm 5-FU 2nd replicate.

207
C3
77
SampleName: C3
Inte
nsity
0.0
20000.0
40000.0
60000.0
80000.0
100000.0
120000.0
140000.0
160000.0
180000.0
200000.0
220000.0
Minutes
1.00 2.00 3.00 4.00 5.00 6.00 7.00 8.00 9.00 10.00 11.00 12.00 13.00 14.00
Fig. 25iii(41) product chromatograph for .250 ppm FAC 3rd replicate.

208
105
SampleName: C3
Inte
nsity
200.00
400.00
600.00
800.00
1000.00
1200.00
1400.00
1600.00
1800.00
2000.00
Minutes
1.00 2.00 3.00 4.00 5.00 6.00 7.00 8.00 9.00 10.00 11.00 12.00 13.00 14.00
Fig. 25iii(42) product chromatograph for .250 ppm FMASld 3rd replicate.

209
106
SampleName: C3
Inte
nsity
0.00
500.00
1000.00
1500.00
2000.00
2500.00
3000.00
3500.00
Minutes
1.00 2.00 3.00 4.00 5.00 6.00 7.00 8.00 9.00 10.00 11.00 12.00 13.00 14.00
Fig. 25iii(43) product chromatograph for .250 ppm FBAL 3rd replicate.

210
149
SampleName: C3
Inte
nsity
200.00
400.00
600.00
800.00
1000.00
1200.00
1400.00
1600.00
1800.00
2000.00
2200.00
2400.00
2600.00
2800.00
3000.00
3200.00
Minutes
1.00 2.00 3.00 4.00 5.00 6.00 7.00 8.00 9.00 10.00 11.00 12.00 13.00 14.00
Fig. 25iii(44) product chromatograph for .250 ppm FUPA 3rd replicate.

211
129
SampleName: C3
Inte
nsity
200.00
300.00
400.00
500.00
600.00
700.00
800.00
900.00
1000.00
1100.00
1200.00
1300.00
Minutes
1.00 2.00 3.00 4.00 5.00 6.00 7.00 8.00 9.00 10.00 11.00 12.00 13.00 14.00
Fig. 25iii(45) product chromatograph for .250 ppm 5-FU 3rd replicate.

212
D1
77
SampleName: D1
Inte
nsity
0
50000
100000
150000
200000
250000
300000
Minutes
1.00 2.00 3.00 4.00 5.00 6.00 7.00 8.00 9.00 10.00 11.00 12.00 13.00 14.00
Fig. 25iii(46) product chromatograph for .50 ppm FAC 1st replicate.

213
105
SampleName: D1
Inte
nsity
200.00
400.00
600.00
800.00
1000.00
1200.00
1400.00
1600.00
1800.00
2000.00
2200.00
2400.00
2600.00
Minutes
1.00 2.00 3.00 4.00 5.00 6.00 7.00 8.00 9.00 10.00 11.00 12.00 13.00 14.00
Fig. 25iii(47) product chromatograph for .50 ppm FMASld 1st replicate.

214
106
SampleName: D1
Inte
nsity
0.00
500.00
1000.00
1500.00
2000.00
2500.00
3000.00
3500.00
Minutes
1.00 2.00 3.00 4.00 5.00 6.00 7.00 8.00 9.00 10.00 11.00 12.00 13.00 14.00
Fig. 25iii(48) product chromatograph for .50 ppm FBAL 1st replicate.

215
149
SampleName: D1
Inte
nsity
200.00
400.00
600.00
800.00
1000.00
1200.00
1400.00
1600.00
1800.00
2000.00
2200.00
2400.00
2600.00
2800.00
3000.00
Minutes
1.00 2.00 3.00 4.00 5.00 6.00 7.00 8.00 9.00 10.00 11.00 12.00 13.00 14.00
Fig. 25iii(49) product chromatograph for .50 ppm FUPA 1st replicate.

216
129
SampleName: D1
Inte
nsity
200.00
400.00
600.00
800.00
1000.00
1200.00
1400.00
1600.00
1800.00
2000.00
Minutes
1.00 2.00 3.00 4.00 5.00 6.00 7.00 8.00 9.00 10.00 11.00 12.00 13.00 14.00
Fig. 25iii(50) product chromatograph for .50 ppm 5-FU 1st replicate.

217
D2
77
SampleName: D2
Inte
nsity
0
50000
100000
150000
200000
250000
300000
Minutes
1.00 2.00 3.00 4.00 5.00 6.00 7.00 8.00 9.00 10.00 11.00 12.00 13.00 14.00
Fig. 25iii(51) product chromatograph for .50 ppm FAC 2nd replicate.
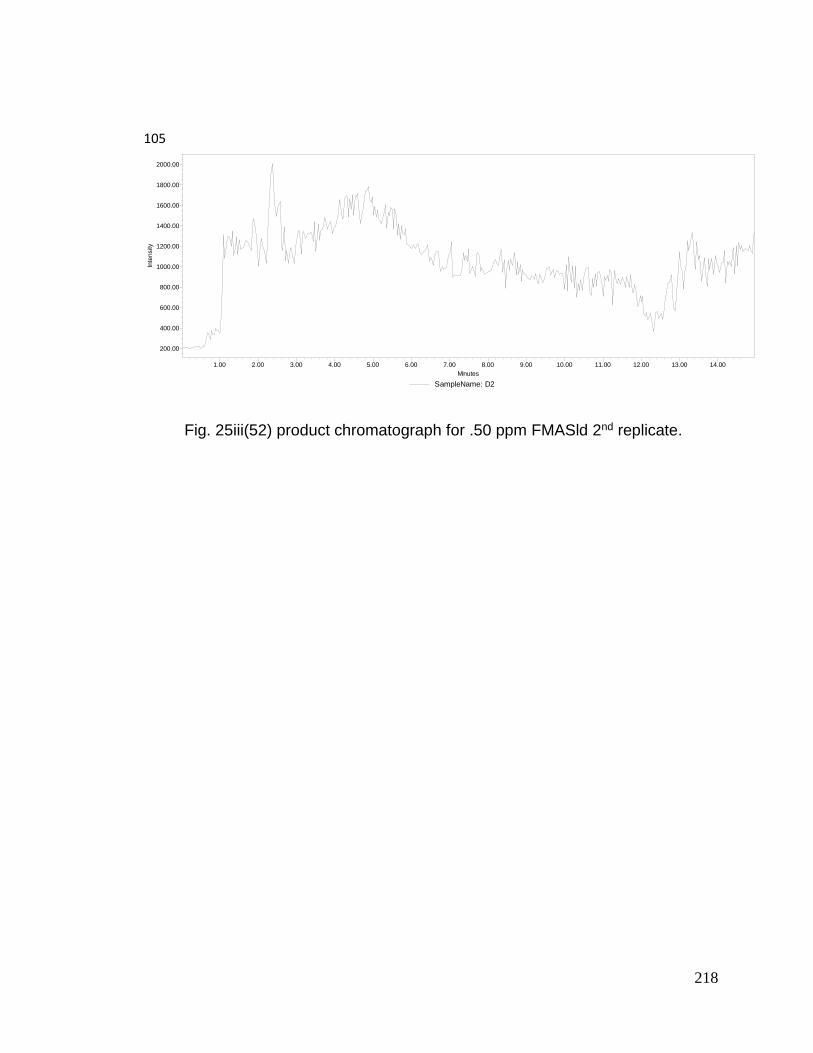
218
105
SampleName: D2
Inte
nsity
200.00
400.00
600.00
800.00
1000.00
1200.00
1400.00
1600.00
1800.00
2000.00
Minutes
1.00 2.00 3.00 4.00 5.00 6.00 7.00 8.00 9.00 10.00 11.00 12.00 13.00 14.00
Fig. 25iii(52) product chromatograph for .50 ppm FMASld 2nd replicate.

219
106
SampleName: D2
Inte
nsity
0.00
500.00
1000.00
1500.00
2000.00
2500.00
3000.00
3500.00
4000.00
Minutes
1.00 2.00 3.00 4.00 5.00 6.00 7.00 8.00 9.00 10.00 11.00 12.00 13.00 14.00
Fig. 25iii(53) product chromatograph for .50 ppm FBAL 2nd replicate.

220
149
SampleName: D2
Inte
nsity
200.00
400.00
600.00
800.00
1000.00
1200.00
1400.00
1600.00
1800.00
2000.00
2200.00
2400.00
2600.00
2800.00
Minutes
1.00 2.00 3.00 4.00 5.00 6.00 7.00 8.00 9.00 10.00 11.00 12.00 13.00 14.00
Fig. 25iii(54) product chromatograph for .50 ppm FUPA 2nd replicate.

221
129
SampleName: D2
Inte
nsity
200.00
400.00
600.00
800.00
1000.00
1200.00
1400.00
1600.00
1800.00
2000.00
Minutes
1.00 2.00 3.00 4.00 5.00 6.00 7.00 8.00 9.00 10.00 11.00 12.00 13.00 14.00
Fig. 25iii(55) product chromatograph for .50 ppm 5-FU 2nd replicate.

222
D3
77
SampleName: D3
Inte
nsity
0
50000
100000
150000
200000
250000
300000
350000
Minutes
1.00 2.00 3.00 4.00 5.00 6.00 7.00 8.00 9.00 10.00 11.00 12.00 13.00 14.00
Fig. 25iii(56) product chromatograph for .50 ppm FAC 3rd replicate.

223
105
SampleName: D3
Inte
nsity
200.00
400.00
600.00
800.00
1000.00
1200.00
1400.00
1600.00
1800.00
2000.00
2200.00
2400.00
Minutes
1.00 2.00 3.00 4.00 5.00 6.00 7.00 8.00 9.00 10.00 11.00 12.00 13.00 14.00
Fig. 25iii(57) product chromatograph for .50 ppm FMASld 3rd replicate.

224
106
SampleName: D3
Inte
nsity
0.00
500.00
1000.00
1500.00
2000.00
2500.00
3000.00
3500.00
4000.00
Minutes
1.00 2.00 3.00 4.00 5.00 6.00 7.00 8.00 9.00 10.00 11.00 12.00 13.00 14.00
Fig. 25iii(58) product chromatograph for .50 ppm FBAL 3rd replicate.

225
149
SampleName: D3
Inte
nsity
200.00
400.00
600.00
800.00
1000.00
1200.00
1400.00
1600.00
1800.00
2000.00
2200.00
2400.00
2600.00
2800.00
Minutes
1.00 2.00 3.00 4.00 5.00 6.00 7.00 8.00 9.00 10.00 11.00 12.00 13.00 14.00
Fig. 25iii(59) product chromatograph for .50 ppm FUPA 3rd replicate.

226
129
SampleName: D3
Inte
nsity
200.00
400.00
600.00
800.00
1000.00
1200.00
1400.00
1600.00
1800.00
Minutes
1.00 2.00 3.00 4.00 5.00 6.00 7.00 8.00 9.00 10.00 11.00 12.00 13.00 14.00
Fig. 25iii(60) product chromatograph for .50 ppm 5-FU 3rd replicate.

227
E1
77
SampleName: E1
Inte
nsity
0
50000
100000
150000
200000
250000
300000
350000
400000
450000
500000
550000
Minutes
1.00 2.00 3.00 4.00 5.00 6.00 7.00 8.00 9.00 10.00 11.00 12.00 13.00 14.00
Fig. 25iii(61) product chromatograph for 1.0 ppm FAC 1st replicate.

228
105
SampleName: E1
Inte
nsity
200.00
400.00
600.00
800.00
1000.00
1200.00
1400.00
1600.00
1800.00
2000.00
2200.00
2400.00
Minutes
1.00 2.00 3.00 4.00 5.00 6.00 7.00 8.00 9.00 10.00 11.00 12.00 13.00 14.00
Fig. 25iii(62) product chromatograph for 1.0 ppm FMASld 1st replicate.

229
106
SampleName: E1
Inte
nsity
0.00
500.00
1000.00
1500.00
2000.00
2500.00
3000.00
Minutes
1.00 2.00 3.00 4.00 5.00 6.00 7.00 8.00 9.00 10.00 11.00 12.00 13.00 14.00
Fig. 25iii(63) product chromatograph for 1.0 ppm FBAL 1st replicate.
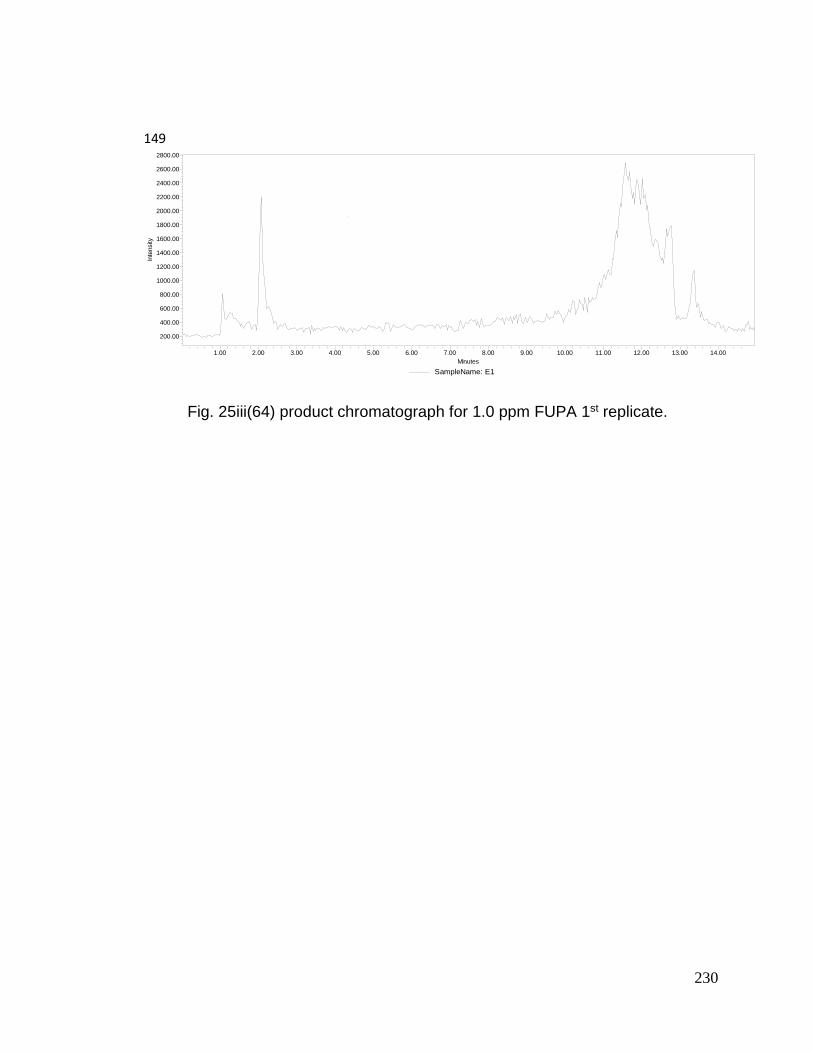
230
149
SampleName: E1
Inte
nsity
200.00
400.00
600.00
800.00
1000.00
1200.00
1400.00
1600.00
1800.00
2000.00
2200.00
2400.00
2600.00
2800.00
Minutes
1.00 2.00 3.00 4.00 5.00 6.00 7.00 8.00 9.00 10.00 11.00 12.00 13.00 14.00
Fig. 25iii(64) product chromatograph for 1.0 ppm FUPA 1st replicate.
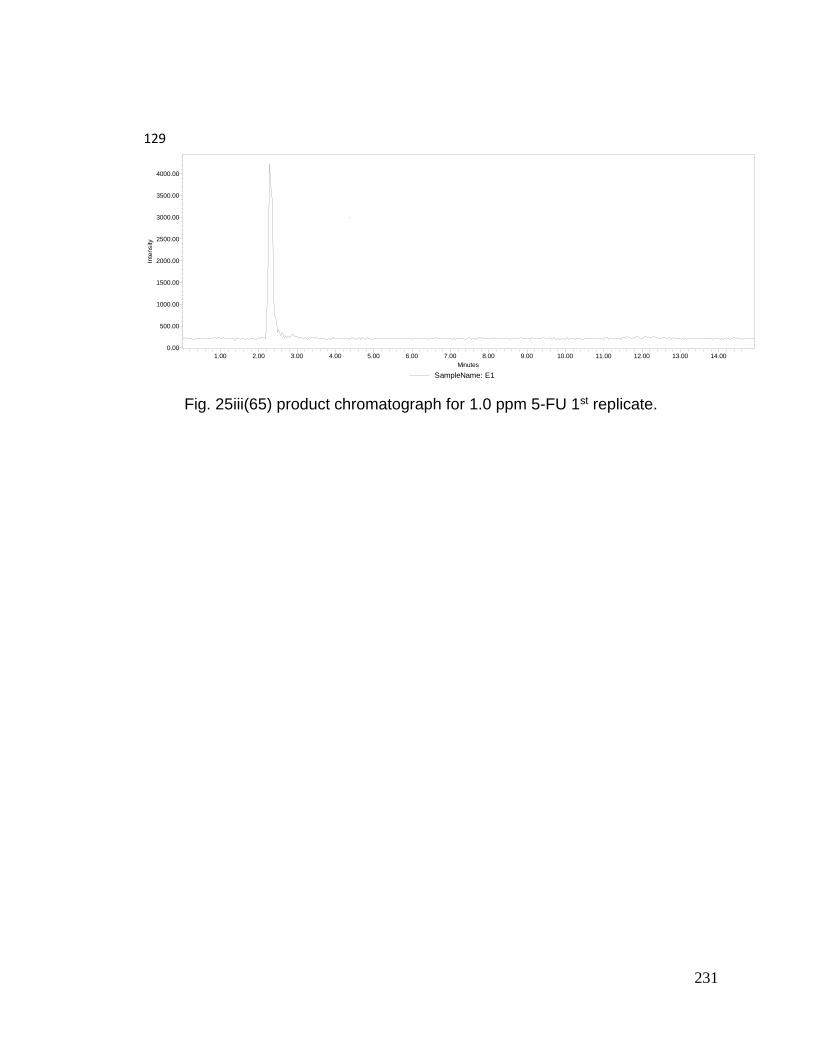
231
129
SampleName: E1
Inte
nsity
0.00
500.00
1000.00
1500.00
2000.00
2500.00
3000.00
3500.00
4000.00
Minutes
1.00 2.00 3.00 4.00 5.00 6.00 7.00 8.00 9.00 10.00 11.00 12.00 13.00 14.00
Fig. 25iii(65) product chromatograph for 1.0 ppm 5-FU 1st replicate.

232
E2
77
SampleName: E2
Inte
nsity
0
50000
100000
150000
200000
250000
300000
350000
400000
450000
500000
Minutes
1.00 2.00 3.00 4.00 5.00 6.00 7.00 8.00 9.00 10.00 11.00 12.00 13.00 14.00
Fig. 25iii(66) product chromatograph for 1.0 ppm FAC 2nd replicate.

233
105
SampleName: E2
Inte
nsity
200.00
400.00
600.00
800.00
1000.00
1200.00
1400.00
1600.00
1800.00
2000.00
Minutes
1.00 2.00 3.00 4.00 5.00 6.00 7.00 8.00 9.00 10.00 11.00 12.00 13.00 14.00
Fig. 25iii(67) product chromatograph for 1.0 ppm FMASld 2nd replicate.

234
106
SampleName: E2
Inte
nsity
0.00
500.00
1000.00
1500.00
2000.00
2500.00
3000.00
Minutes
1.00 2.00 3.00 4.00 5.00 6.00 7.00 8.00 9.00 10.00 11.00 12.00 13.00 14.00
Fig. 25iii(68) product chromatograph for 1.0 ppm FBAL 2nd replicate.

235
149
SampleName: E2
Inte
nsity
200.00
400.00
600.00
800.00
1000.00
1200.00
1400.00
1600.00
1800.00
2000.00
2200.00
2400.00
Minutes
1.00 2.00 3.00 4.00 5.00 6.00 7.00 8.00 9.00 10.00 11.00 12.00 13.00 14.00
Fig. 25iii(69) product chromatograph for 1.0 ppm FUPA 2nd replicate.

236
129
SampleName: E2
Inte
nsity
0.00
500.00
1000.00
1500.00
2000.00
2500.00
3000.00
3500.00
4000.00
Minutes
1.00 2.00 3.00 4.00 5.00 6.00 7.00 8.00 9.00 10.00 11.00 12.00 13.00 14.00
Fig. 25iii(70) product chromatograph for 1.0 ppm 5-FU 2nd replicate.

237
E3
77
SampleName: E3
Inte
nsity
0
50000
100000
150000
200000
250000
300000
350000
400000
450000
500000
Minutes
1.00 2.00 3.00 4.00 5.00 6.00 7.00 8.00 9.00 10.00 11.00 12.00 13.00 14.00
Fig. 25iii(71) product chromatograph for 1.0 ppm FAC 3rd replicate.

238
105
SampleName: E3
Inte
nsity
200.00
400.00
600.00
800.00
1000.00
1200.00
1400.00
1600.00
1800.00
2000.00
2200.00
Minutes
1.00 2.00 3.00 4.00 5.00 6.00 7.00 8.00 9.00 10.00 11.00 12.00 13.00 14.00
Fig. 25iii(72) product chromatograph for 1.0 ppm FMASld 3rd replicate.

239
106
SampleName: E3
Inte
nsity
0.00
500.00
1000.00
1500.00
2000.00
2500.00
3000.00
3500.00
Minutes
1.00 2.00 3.00 4.00 5.00 6.00 7.00 8.00 9.00 10.00 11.00 12.00 13.00 14.00
Fig. 25iii(73) product chromatograph for 1.0 ppm FBAL 3rd replicate.

240
149
SampleName: E3
Inte
nsity
200.00
400.00
600.00
800.00
1000.00
1200.00
1400.00
1600.00
1800.00
2000.00
2200.00
2400.00
Minutes
1.00 2.00 3.00 4.00 5.00 6.00 7.00 8.00 9.00 10.00 11.00 12.00 13.00 14.00
Fig. 25iii(74) product chromatograph for 1.0 ppm FUPA 3rd replicate.

241
129
SampleName: E3
Inte
nsity
0.00
500.00
1000.00
1500.00
2000.00
2500.00
3000.00
3500.00
4000.00
Minutes
1.00 2.00 3.00 4.00 5.00 6.00 7.00 8.00 9.00 10.00 11.00 12.00 13.00 14.00
Fig. 25iii(75) product chromatograph for 1.0 ppm 5-FU 3rd replicate.

242
F1
77
SampleName: F1
Inte
nsity
0.0
2.0x10⁵
4.0x10⁵
6.0x10⁵
8.0x10⁵
1.0x10⁶
1.2x10⁶
1.4x10⁶
1.6x10⁶
1.8x10⁶
2.0x10⁶
2.2x10⁶
Minutes
1.00 2.00 3.00 4.00 5.00 6.00 7.00 8.00 9.00 10.00 11.00 12.00 13.00 14.00
Fig. 25iii(76) product chromatograph for 5.0 ppm FAC 1st replicate.

243
105
SampleName: F1
Inte
nsity
200.00
400.00
600.00
800.00
1000.00
1200.00
1400.00
1600.00
1800.00
2000.00
2200.00
Minutes
1.00 2.00 3.00 4.00 5.00 6.00 7.00 8.00 9.00 10.00 11.00 12.00 13.00 14.00
Fig. 25iii(77) product chromatograph for 5.0 ppm FMASld 1st replicate.

244
106
SampleName: F1
Inte
nsity
0.0
2000.0
4000.0
6000.0
8000.0
10000.0
12000.0
14000.0
16000.0
18000.0
20000.0
22000.0
24000.0
Minutes
1.00 2.00 3.00 4.00 5.00 6.00 7.00 8.00 9.00 10.00 11.00 12.00 13.00 14.00
Fig. 25iii(78) product chromatograph for 5.0 ppm FBAL 1st replicate.

245
149
SampleName: F1
Inte
nsity
0.0
1000.0
2000.0
3000.0
4000.0
5000.0
6000.0
7000.0
8000.0
9000.0
Minutes
1.00 2.00 3.00 4.00 5.00 6.00 7.00 8.00 9.00 10.00 11.00 12.00 13.00 14.00
Fig. 25iii(79) product chromatograph for 5.0 ppm FUPA 1st replicate.

246
129
SampleName: F1
Inte
nsity
0.0
2000.0
4000.0
6000.0
8000.0
10000.0
12000.0
14000.0
16000.0
Minutes
1.00 2.00 3.00 4.00 5.00 6.00 7.00 8.00 9.00 10.00 11.00 12.00 13.00 14.00
Fig. 25iii(80) product chromatograph for 5.0 ppm 5-FU 1st replicate.

247
F2
77
SampleName: F2
Inte
nsity
0.0
2.0x10⁵
4.0x10⁵
6.0x10⁵
8.0x10⁵
1.0x10⁶
1.2x10⁶
1.4x10⁶
1.6x10⁶
1.8x10⁶
2.0x10⁶
2.2x10⁶
Minutes
1.00 2.00 3.00 4.00 5.00 6.00 7.00 8.00 9.00 10.00 11.00 12.00 13.00 14.00
Fig. 25iii(81) product chromatograph for 5.0 ppm FAC 2nd replicate.

248
105
SampleName: F2
Inte
nsity
200.00
400.00
600.00
800.00
1000.00
1200.00
1400.00
1600.00
1800.00
2000.00
2200.00
Minutes
1.00 2.00 3.00 4.00 5.00 6.00 7.00 8.00 9.00 10.00 11.00 12.00 13.00 14.00
Fig. 25iii(82) product chromatograph for 5.0 ppm FMASld 2nd replicate.

249
106
SampleName: F2
Inte
nsity
0.0
5000.0
10000.0
15000.0
20000.0
25000.0
30000.0
Minutes
1.00 2.00 3.00 4.00 5.00 6.00 7.00 8.00 9.00 10.00 11.00 12.00 13.00 14.00
Fig. 25iii(83) product chromatograph for 5.0 ppm FBAL 2nd replicate.

250
149
SampleName: F2
Inte
nsity
0.0
1000.0
2000.0
3000.0
4000.0
5000.0
6000.0
7000.0
8000.0
9000.0
Minutes
1.00 2.00 3.00 4.00 5.00 6.00 7.00 8.00 9.00 10.00 11.00 12.00 13.00 14.00
Fig. 25iii(84) product chromatograph for 5.0 ppm FUPA 2nd replicate.

251
129
SampleName: F2
Inte
nsity
0.0
2000.0
4000.0
6000.0
8000.0
10000.0
12000.0
14000.0
Minutes
1.00 2.00 3.00 4.00 5.00 6.00 7.00 8.00 9.00 10.00 11.00 12.00 13.00 14.00
Fig. 25iii(85) product chromatograph for 5.0 ppm 5-FU 2nd replicate.

252
F3
77
SampleName: F3
Inte
nsity
0.0
2.0x10⁵
4.0x10⁵
6.0x10⁵
8.0x10⁵
1.0x10⁶
1.2x10⁶
1.4x10⁶
1.6x10⁶
1.8x10⁶
2.0x10⁶
2.2x10⁶
Minutes
1.00 2.00 3.00 4.00 5.00 6.00 7.00 8.00 9.00 10.00 11.00 12.00 13.00 14.00
Fig. 25iii(86) product chromatograph for 5.0 ppm FAC 3rd replicate.

253
105
SampleName: F3
Inte
nsity
200.00
400.00
600.00
800.00
1000.00
1200.00
1400.00
1600.00
1800.00
2000.00
Minutes
1.00 2.00 3.00 4.00 5.00 6.00 7.00 8.00 9.00 10.00 11.00 12.00 13.00 14.00
Fig. 25iii(87) product chromatograph for 5.0 ppm FMASld 3rd replicate.

254
106
SampleName: F3
Inte
nsity
0.0
5000.0
10000.0
15000.0
20000.0
25000.0
Minutes
1.00 2.00 3.00 4.00 5.00 6.00 7.00 8.00 9.00 10.00 11.00 12.00 13.00 14.00
Fig. 25iii(88) product chromatograph for 5.0 ppm FBAL 3rd replicate.

255
149
SampleName: F3
Inte
nsity
0.0
1000.0
2000.0
3000.0
4000.0
5000.0
6000.0
7000.0
8000.0
9000.0
Minutes
1.00 2.00 3.00 4.00 5.00 6.00 7.00 8.00 9.00 10.00 11.00 12.00 13.00 14.00
Fig. 25iii(89) product chromatograph for 5.0 ppm FUPA 3rd replicate.

256
129
SampleName: F3
Inte
nsity
0.0
2000.0
4000.0
6000.0
8000.0
10000.0
12000.0
14000.0
Minutes
1.00 2.00 3.00 4.00 5.00 6.00 7.00 8.00 9.00 10.00 11.00 12.00 13.00 14.00
Fig. 25iii(90) product chromatograph for 5.0 ppm 5-FU 3rd replicate.

257
20
77
SampleName: 20
Inte
nsity
0.0
2000.0
4000.0
6000.0
8000.0
10000.0
12000.0
Minutes
1.00 2.00 3.00 4.00 5.00 6.00 7.00 8.00 9.00 10.00 11.00 12.00 13.00 14.00
Fig. 26(1) product chromatograph for 5-FUr 1st replicate/screened for FAC.
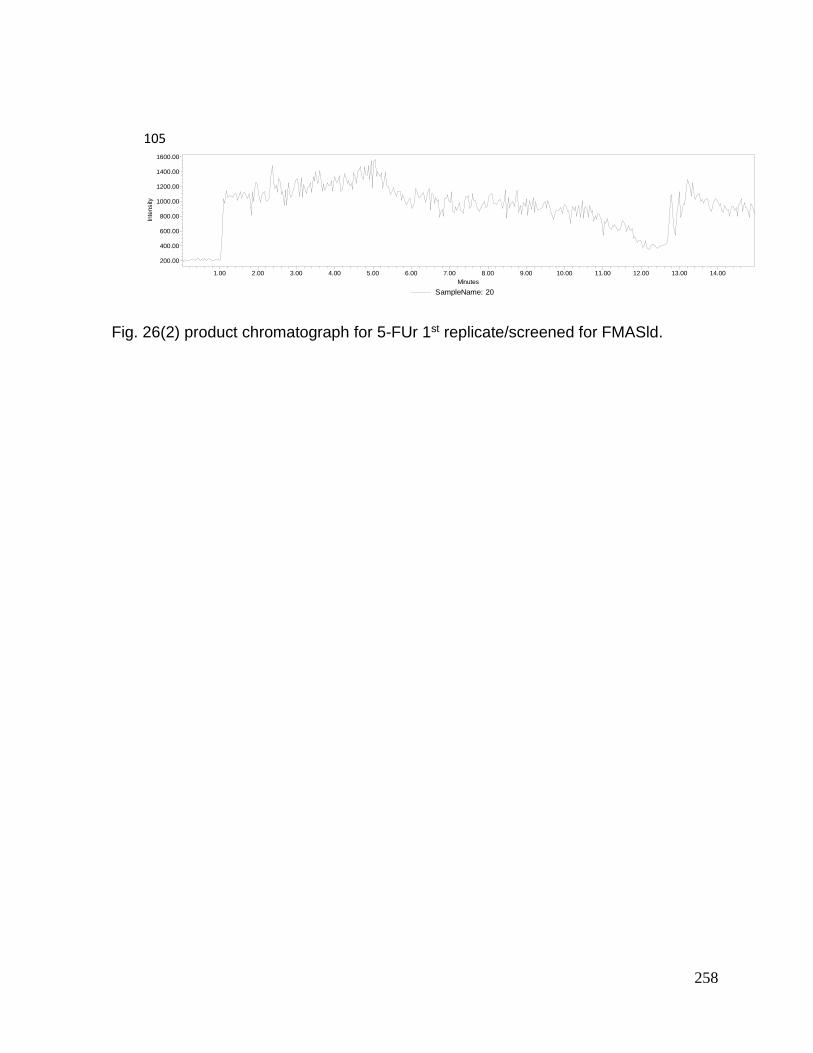
258
105
SampleName: 20
Inte
nsity
200.00
400.00
600.00
800.00
1000.00
1200.00
1400.00
1600.00
Minutes
1.00 2.00 3.00 4.00 5.00 6.00 7.00 8.00 9.00 10.00 11.00 12.00 13.00 14.00
Fig. 26(2) product chromatograph for 5-FUr 1st replicate/screened for FMASld.

259
106
SampleName: 20
Inte
nsity
0.0
1000.0
2000.0
3000.0
4000.0
Minutes
1.00 2.00 3.00 4.00 5.00 6.00 7.00 8.00 9.00 10.00 11.00 12.00 13.00 14.00
Fig. 26(3) product chromatograph for 5-FUr 1st replicate/screened for FBAL.

260
149
SampleName: 20
Inte
nsity
200.00
400.00
600.00
800.00
1000.00
1200.00
1400.00
1600.00
Minutes
1.00 2.00 3.00 4.00 5.00 6.00 7.00 8.00 9.00 10.00 11.00 12.00 13.00 14.00
Fig. 26(4) product chromatograph for 5-FUr 1st replicate/screened for FUPA.

261
129
SampleName: 20
Inte
nsity
0.0
2000.0
4000.0
6000.0
8000.0
10000.0
12000.0
Minutes
1.00 2.00 3.00 4.00 5.00 6.00 7.00 8.00 9.00 10.00 11.00 12.00 13.00 14.00
Fig. 26(5) product chromatograph for 5-FUr 1st replicate/screened for 5-FU.

262
20A
77
SampleName: 20A
Inte
nsity
0.0
2000.0
4000.0
6000.0
8000.0
10000.0
12000.0
Minutes
1.00 2.00 3.00 4.00 5.00 6.00 7.00 8.00 9.00 10.00 11.00 12.00 13.00 14.00
Fig. 26(6) product chromatograph for T/Alk0 1st replicate/screened for FAC.

263
105
SampleName: 20A
Inte
nsity
200.00
400.00
600.00
800.00
1000.00
1200.00
1400.00
1600.00
Minutes
1.00 2.00 3.00 4.00 5.00 6.00 7.00 8.00 9.00 10.00 11.00 12.00 13.00 14.00
Fig. 26(7) product chromatograph for T/Alk0 1st replicate/screened for FMASld.

264
106
SampleName: 20A
Inte
nsity
0.0
1000.0
2000.0
3000.0
4000.0
Minutes
1.00 2.00 3.00 4.00 5.00 6.00 7.00 8.00 9.00 10.00 11.00 12.00 13.00 14.00
Fig. 26(8) product chromatograph for T/Alk0 1st replicate/screened for FBAL.

265
149
SampleName: 20A
Inte
nsity
500.00
1000.00
1500.00
Minutes
1.00 2.00 3.00 4.00 5.00 6.00 7.00 8.00 9.00 10.00 11.00 12.00 13.00 14.00
Fig. 26(9) product chromatograph for T/Alk0 1st replicate/screened for FUPA.

266
129
SampleName: 20A
Inte
nsity
0.0
2000.0
4000.0
6000.0
8000.0
10000.0
Minutes
1.00 2.00 3.00 4.00 5.00 6.00 7.00 8.00 9.00 10.00 11.00 12.00 13.00 14.00
Fig. 26(10) product chromatograph for T/Alk0 1st replicate/screened for 5-FU.

267
21
77
SampleName: 21
Inte
nsity
0.0
2000.0
4000.0
6000.0
8000.0
10000.0
Minutes
1.00 2.00 3.00 4.00 5.00 6.00 7.00 8.00 9.00 10.00 11.00 12.00 13.00 14.00
Fig. 26(11) Thermal/Alkali product chromatograph screening for FAC @ 1 day 1st replicate.

268
105
SampleName: 21
Inte
nsity
200.00
400.00
600.00
800.00
1000.00
1200.00
1400.00
Minutes
1.00 2.00 3.00 4.00 5.00 6.00 7.00 8.00 9.00 10.00 11.00 12.00 13.00 14.00
Fig. 26(12) Thermal/Alkali product chromatograph screening for FMASld @ 1 day 1st
replicate.

269
106
SampleName: 21
Inte
nsity
0.0
1000.0
2000.0
3000.0
4000.0
Minutes
1.00 2.00 3.00 4.00 5.00 6.00 7.00 8.00 9.00 10.00 11.00 12.00 13.00 14.00
Fig. 26(13) Thermal/Alkali product chromatograph screening for FBAL @ 1 day 1st replicate.

270
149
SampleName: 21
Inte
nsity
200.00
400.00
600.00
800.00
1000.00
1200.00
1400.00
1600.00
Minutes
1.00 2.00 3.00 4.00 5.00 6.00 7.00 8.00 9.00 10.00 11.00 12.00 13.00 14.00
Fig. 26(14) Thermal/Alkali product chromatograph screening for FUPA @ 1 day 1st replicate.

271
129
SampleName: 21
Inte
nsity
0.0
2000.0
4000.0
6000.0
8000.0
10000.0
Minutes
1.00 2.00 3.00 4.00 5.00 6.00 7.00 8.00 9.00 10.00 11.00 12.00 13.00 14.00
Fig. 26(15) Thermal/Alkali product chromatograph screening for 5-FU @ 1 day 1st replicate.

272
22
77
SampleName: 22
Inte
nsity
0.0
2000.0
4000.0
6000.0
8000.0
10000.0
Minutes
1.00 2.00 3.00 4.00 5.00 6.00 7.00 8.00 9.00 10.00 11.00 12.00 13.00 14.00
Fig. 26(16)Thermal/Alkali product chromatograph screening for FAC @ 1 day 2nd replicate.

273
105
SampleName: 22
Inte
nsity
200.00
400.00
600.00
800.00
1000.00
1200.00
1400.00
1600.00
Minutes
1.00 2.00 3.00 4.00 5.00 6.00 7.00 8.00 9.00 10.00 11.00 12.00 13.00 14.00
Fig. 26(17)Thermal/Alkali product chromatograph screening for FMASld @ 1 day 2nd replicate.
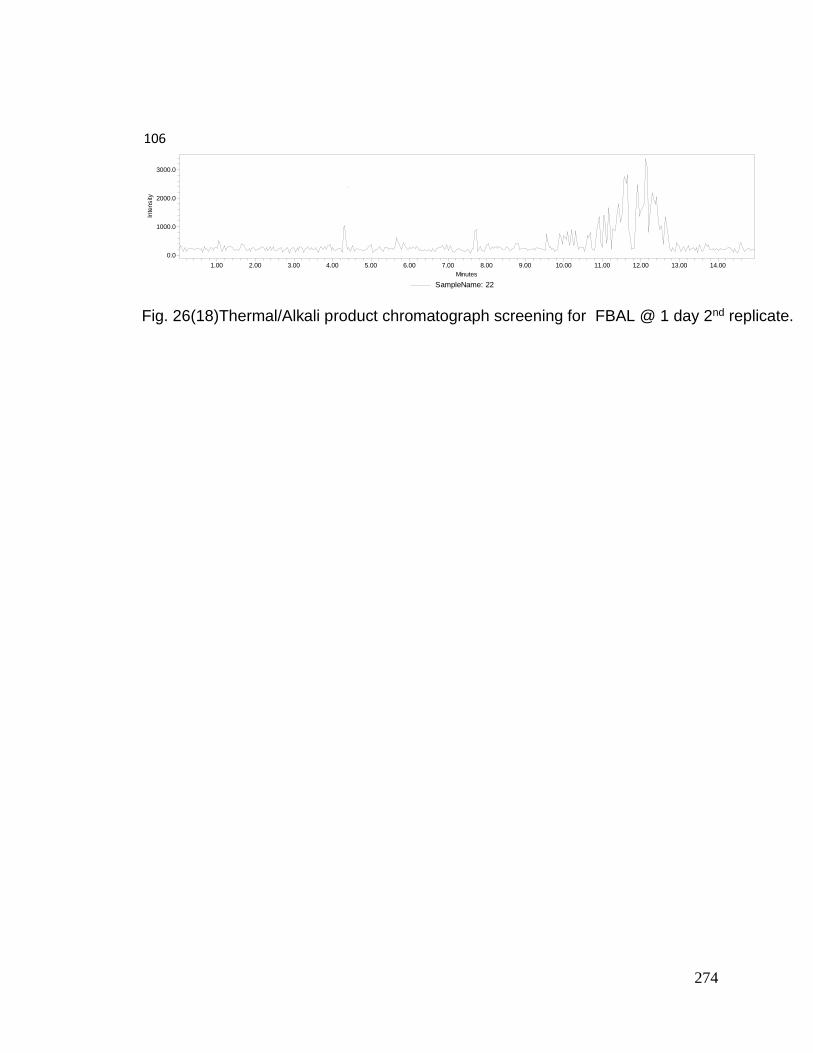
274
106
SampleName: 22
Inte
nsity
0.0
1000.0
2000.0
3000.0
Minutes
1.00 2.00 3.00 4.00 5.00 6.00 7.00 8.00 9.00 10.00 11.00 12.00 13.00 14.00
Fig. 26(18)Thermal/Alkali product chromatograph screening for FBAL @ 1 day 2nd replicate.

275
149
SampleName: 22
Inte
nsity
500.00
1000.00
1500.00
Minutes
1.00 2.00 3.00 4.00 5.00 6.00 7.00 8.00 9.00 10.00 11.00 12.00 13.00 14.00
Fig. 26(19)Thermal/Alkali product chromatograph screening for FUPA @ 1 day 2nd replicate.

276
129
SampleName: 22
Inte
nsity
0.0
2000.0
4000.0
6000.0
8000.0
10000.0
Minutes
1.00 2.00 3.00 4.00 5.00 6.00 7.00 8.00 9.00 10.00 11.00 12.00 13.00 14.00
Fig. 26(20)Thermal/Alkali product chromatograph screening for 5-FU @ 1 day 2nd replicate.

277
23
77
SampleName: 23
Inte
nsity
0.0
2000.0
4000.0
6000.0
8000.0
10000.0
Minutes
1.00 2.00 3.00 4.00 5.00 6.00 7.00 8.00 9.00 10.00 11.00 12.00 13.00 14.00
Fig. 26(21)Thermal/Alkali product chromatograph screening for FAC @ 1 day 3rd replicate.

278
105
SampleName: 23
Inte
nsity
200.00
400.00
600.00
800.00
1000.00
1200.00
Minutes
1.00 2.00 3.00 4.00 5.00 6.00 7.00 8.00 9.00 10.00 11.00 12.00 13.00 14.00
Fig. 26(22)Thermal/Alkali product chromatograph screening for FMASld @ 1 day 3rd replicate.

279
106
SampleName: 23
Inte
nsity
0.0
1000.0
2000.0
3000.0
Minutes
1.00 2.00 3.00 4.00 5.00 6.00 7.00 8.00 9.00 10.00 11.00 12.00 13.00 14.00
Fig. 26(23)Thermal/Alkali product chromatograph screening for FBAL @ 1 day 3rd replicate.

280
149
SampleName: 23
Inte
nsity
500.00
1000.00
1500.00
Minutes
1.00 2.00 3.00 4.00 5.00 6.00 7.00 8.00 9.00 10.00 11.00 12.00 13.00 14.00
Fig. 26(24)Thermal/Alkali product chromatograph screening for FUPA @ 1 day 3rd replicate.

281
129
SampleName: 23
Inte
nsity
0.0
2000.0
4000.0
6000.0
8000.0
10000.0
Minutes
1.00 2.00 3.00 4.00 5.00 6.00 7.00 8.00 9.00 10.00 11.00 12.00 13.00 14.00
Fig. 26(25)Thermal/Alkali product chromatograph screening for 5-FU @ 1 day 3rd replicate.

282
24
77
SampleName: 24
Inte
nsity
0.0
2000.0
4000.0
6000.0
8000.0
10000.0
Minutes
1.00 2.00 3.00 4.00 5.00 6.00 7.00 8.00 9.00 10.00 11.00 12.00 13.00 14.00
Fig. 26(26)Thermal/Alkali product chromatograph screening for FAC @ 2 day 1st replicate.

283
105
SampleName: 24
Inte
nsity
200.00
400.00
600.00
800.00
1000.00
1200.00
1400.00
Minutes
1.00 2.00 3.00 4.00 5.00 6.00 7.00 8.00 9.00 10.00 11.00 12.00 13.00 14.00
Fig. 26(27)Thermal/Alkali product chromatograph screening for FMASld @ 2 day 1st replicate.

284
106
SampleName: 24
Inte
nsity
0.0
1000.0
2000.0
3000.0
Minutes
1.00 2.00 3.00 4.00 5.00 6.00 7.00 8.00 9.00 10.00 11.00 12.00 13.00 14.00
Fig. 26(28)Thermal/Alkali product chromatograph screening for FBAL @ 2 day 1st replicate.

285
149
SampleName: 24
Inte
nsity
500.00
1000.00
1500.00
Minutes
1.00 2.00 3.00 4.00 5.00 6.00 7.00 8.00 9.00 10.00 11.00 12.00 13.00 14.00
Fig. 26(29)Thermal/Alkali product chromatograph screening for FUPA @ 2 day 1st replicate.

286
129
SampleName: 24
Inte
nsity
0.0
2000.0
4000.0
6000.0
8000.0
10000.0
Minutes
1.00 2.00 3.00 4.00 5.00 6.00 7.00 8.00 9.00 10.00 11.00 12.00 13.00 14.00
Fig. 26(30)Thermal/Alkali product chromatograph screening for 5-FU @ 2 day 1st replicate.

287
25
77
SampleName: 25
Inte
nsity
0.0
2000.0
4000.0
6000.0
8000.0
10000.0
Minutes
1.00 2.00 3.00 4.00 5.00 6.00 7.00 8.00 9.00 10.00 11.00 12.00 13.00 14.00
Fig. 26(31)Thermal/Alkali product chromatograph screening for FAC @ 2 day 2nd replicate.

288
105
SampleName: 25
Inte
nsity
200.00
400.00
600.00
800.00
1000.00
1200.00
Minutes
1.00 2.00 3.00 4.00 5.00 6.00 7.00 8.00 9.00 10.00 11.00 12.00 13.00 14.00
Fig. 26(32)Thermal/Alkali product chromatograph screening for FMASld @ 2 day 2nd replicate.

289
106
SampleName: 25
Inte
nsity
0.0
1000.0
2000.0
3000.0
4000.0
Minutes
1.00 2.00 3.00 4.00 5.00 6.00 7.00 8.00 9.00 10.00 11.00 12.00 13.00 14.00
Fig. 26(33)Thermal/Alkali product chromatograph screening for FBAL @ 2 day 2nd replicate.

290
149
SampleName: 25
Inte
nsity
500.00
1000.00
1500.00
Minutes
1.00 2.00 3.00 4.00 5.00 6.00 7.00 8.00 9.00 10.00 11.00 12.00 13.00 14.00
Fig. 26(34)Thermal/Alkali product chromatograph screening for FUPA @ 2 day 2nd replicate.

291
129
SampleName: 25
Inte
nsity
0.0
2000.0
4000.0
6000.0
8000.0
10000.0
Minutes
1.00 2.00 3.00 4.00 5.00 6.00 7.00 8.00 9.00 10.00 11.00 12.00 13.00 14.00
Fig. 26(35)Thermal/Alkali product chromatograph screening for 5-FU @ 2 day 2nd replicate.
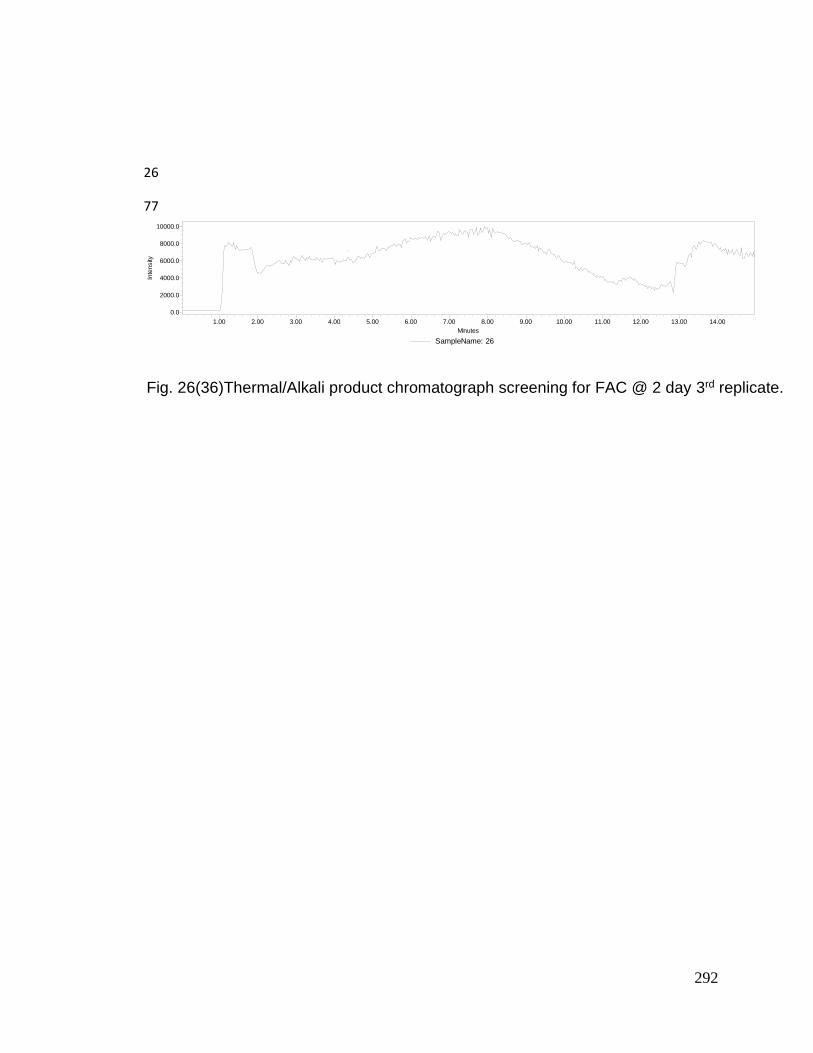
292
26
77
SampleName: 26
Inte
nsity
0.0
2000.0
4000.0
6000.0
8000.0
10000.0
Minutes
1.00 2.00 3.00 4.00 5.00 6.00 7.00 8.00 9.00 10.00 11.00 12.00 13.00 14.00
Fig. 26(36)Thermal/Alkali product chromatograph screening for FAC @ 2 day 3rd replicate.

293
105
SampleName: 26
Inte
nsity
200.00
400.00
600.00
800.00
1000.00
1200.00
Minutes
1.00 2.00 3.00 4.00 5.00 6.00 7.00 8.00 9.00 10.00 11.00 12.00 13.00 14.00
Fig. 26(37)Thermal/Alkali product chromatograph screening for FMASld @ 2 day 3rd replicate.

294
106
SampleName: 26
Inte
nsity
0.0
1000.0
2000.0
3000.0
Minutes
1.00 2.00 3.00 4.00 5.00 6.00 7.00 8.00 9.00 10.00 11.00 12.00 13.00 14.00
Fig. 26(38)Thermal/Alkali product chromatograph screening for FBAL @ 2 day 3rd replicate.

295
149
SampleName: 26
Inte
nsity
500.00
1000.00
1500.00
Minutes
1.00 2.00 3.00 4.00 5.00 6.00 7.00 8.00 9.00 10.00 11.00 12.00 13.00 14.00
Fig. 26(39)Thermal/Alkali product chromatograph screening for FUPA @ 2 day 3rd replicate.

296
129
SampleName: 26
Inte
nsity
0.0
2000.0
4000.0
6000.0
8000.0
10000.0
Minutes
1.00 2.00 3.00 4.00 5.00 6.00 7.00 8.00 9.00 10.00 11.00 12.00 13.00 14.00
Fig. 26(40)Thermal/Alkali product chromatograph screening for 5-FU @ 2 day 3rd replicate.

297
27
77
SampleName: 27
Inte
nsity
0.0
2000.0
4000.0
6000.0
8000.0
10000.0
Minutes
1.00 2.00 3.00 4.00 5.00 6.00 7.00 8.00 9.00 10.00 11.00 12.00 13.00 14.00
Fig. 26(41)Thermal/Alkali product chromatograph screening for FAC @ 3 day 1st replicate.

298
105
SampleName: 27
Inte
nsity
200.00
400.00
600.00
800.00
1000.00
1200.00
1400.00
Minutes
1.00 2.00 3.00 4.00 5.00 6.00 7.00 8.00 9.00 10.00 11.00 12.00 13.00 14.00
Fig. 26(42)Thermal/Alkali product chromatograph screening for FMASld @ 3 day 1st replicate.

299
106
SampleName: 27
Inte
nsity
0.0
1000.0
2000.0
3000.0
4000.0
5000.0
Minutes
1.00 2.00 3.00 4.00 5.00 6.00 7.00 8.00 9.00 10.00 11.00 12.00 13.00 14.00
Fig. 26(43)Thermal/Alkali product chromatograph screening for FBAL @ 3 day 1st replicate.

300
149
SampleName: 27
Inte
nsity
500.00
1000.00
1500.00
Minutes
1.00 2.00 3.00 4.00 5.00 6.00 7.00 8.00 9.00 10.00 11.00 12.00 13.00 14.00
Fig. 26(44)Thermal/Alkali product chromatograph screening for FUPA @ 3 day 1st replicate.

301
129
SampleName: 27
Inte
nsity
0.0
2000.0
4000.0
6000.0
8000.0
Minutes
1.00 2.00 3.00 4.00 5.00 6.00 7.00 8.00 9.00 10.00 11.00 12.00 13.00 14.00
Fig. 26(45)Thermal/Alkali product chromatograph screening for 5-FU @ 3 day 1st replicate.

302
28
77
SampleName: 28
Inte
nsity
0.0
2000.0
4000.0
6000.0
8000.0
10000.0
Minutes
1.00 2.00 3.00 4.00 5.00 6.00 7.00 8.00 9.00 10.00 11.00 12.00 13.00 14.00
Fig. 26(46)Thermal/Alkali product chromatograph screening for FAC @ 3 day 2nd replicate.

303
105
SampleName: 28
Inte
nsity
200.00
400.00
600.00
800.00
1000.00
1200.00
1400.00
Minutes
1.00 2.00 3.00 4.00 5.00 6.00 7.00 8.00 9.00 10.00 11.00 12.00 13.00 14.00
Fig. 26(47)Thermal/Alkali product chromatograph screening for FMASld @ 3 day 2nd replicate.

304
106
SampleName: 28
Inte
nsity
0.0
1000.0
2000.0
3000.0
Minutes
1.00 2.00 3.00 4.00 5.00 6.00 7.00 8.00 9.00 10.00 11.00 12.00 13.00 14.00
Fig. 26(48)Thermal/Alkali product chromatograph screening for FBAL @ 3 day 2nd replicate.

305
149
SampleName: 28
Inte
nsity
500.00
1000.00
1500.00
Minutes
1.00 2.00 3.00 4.00 5.00 6.00 7.00 8.00 9.00 10.00 11.00 12.00 13.00 14.00
Fig. 26(49)Thermal/Alkali product chromatograph screening for FUPA @ 3 day 2nd replicate.

306
129
SampleName: 28
Inte
nsity
0.0
2000.0
4000.0
6000.0
8000.0
Minutes
1.00 2.00 3.00 4.00 5.00 6.00 7.00 8.00 9.00 10.00 11.00 12.00 13.00 14.00
Fig. 26(50)Thermal/Alkali product chromatograph screening for 5-FU @ 3 day 2nd replicate.

307
29
77
SampleName: 29
Inte
nsity
0.0
2000.0
4000.0
6000.0
8000.0
10000.0
Minutes
1.00 2.00 3.00 4.00 5.00 6.00 7.00 8.00 9.00 10.00 11.00 12.00 13.00 14.00
Fig. 26(51)Thermal/Alkali product chromatograph screening for FAC @ 3 day 3rd replicate.

308
105
SampleName: 29
Inte
nsity
200.00
400.00
600.00
800.00
1000.00
1200.00
1400.00
Minutes
1.00 2.00 3.00 4.00 5.00 6.00 7.00 8.00 9.00 10.00 11.00 12.00 13.00 14.00
Fig. 26(52)Thermal/Alkali product chromatograph screening for FMASld @ 3 day 3rd replicate.

309
106
SampleName: 29
Inte
nsity
0.0
1000.0
2000.0
3000.0
Minutes
1.00 2.00 3.00 4.00 5.00 6.00 7.00 8.00 9.00 10.00 11.00 12.00 13.00 14.00
Fig. 26(53)Thermal/Alkali product chromatograph screening for FBAL @ 3 day 3rd replicate.

310
149
SampleName: 29
Inte
nsity
500.00
1000.00
1500.00
Minutes
1.00 2.00 3.00 4.00 5.00 6.00 7.00 8.00 9.00 10.00 11.00 12.00 13.00 14.00
Fig. 26(54)Thermal/Alkali product chromatograph screening for FUPA @ 3 day 3rd replicate.

311
129
SampleName: 29
Inte
nsity
0.0
2000.0
4000.0
6000.0
8000.0
10000.0
Minutes
1.00 2.00 3.00 4.00 5.00 6.00 7.00 8.00 9.00 10.00 11.00 12.00 13.00 14.00
Fig. 26(55)Thermal/Alkali product chromatograph screening for 5-FU @ 3 day 3rd replicate.

312
30
77
SampleName: 30
Inte
nsity
0.0
2000.0
4000.0
6000.0
8000.0
Minutes
1.00 2.00 3.00 4.00 5.00 6.00 7.00 8.00 9.00 10.00 11.00 12.00 13.00 14.00
Fig. 26(56)Thermal/Alkali product chromatograph screening for FAC @ 4 day 1st replicate.

313
105
SampleName: 30
Inte
nsity
500.00
1000.00
Minutes
1.00 2.00 3.00 4.00 5.00 6.00 7.00 8.00 9.00 10.00 11.00 12.00 13.00 14.00
Fig. 26(57)Thermal/Alkali product chromatograph screening for FMASld @ 4 day 1st replicate.

314
106
SampleName: 30
Inte
nsity
0.0
1000.0
2000.0
3000.0
4000.0
Minutes
1.00 2.00 3.00 4.00 5.00 6.00 7.00 8.00 9.00 10.00 11.00 12.00 13.00 14.00
Fig. 26(58)Thermal/Alkali product chromatograph screening for FBAL @ 4 day 1st replicate.

315
149
SampleName: 30
Inte
nsity
500.00
1000.00
1500.00
Minutes
1.00 2.00 3.00 4.00 5.00 6.00 7.00 8.00 9.00 10.00 11.00 12.00 13.00 14.00
Fig. 26(59)Thermal/Alkali product chromatograph screening for FUPA @ 4 day 1st replicate.

316
129
SampleName: 30
Inte
nsity
0.0
2000.0
4000.0
6000.0
8000.0
10000.0
Minutes
1.00 2.00 3.00 4.00 5.00 6.00 7.00 8.00 9.00 10.00 11.00 12.00 13.00 14.00
Fig. 26(60)Thermal/Alkali product chromatograph screening for 5-FU @ 4 day 1st replicate.

317
31
77
SampleName: 31
Inte
nsity
0.0
2000.0
4000.0
6000.0
8000.0
Minutes
1.00 2.00 3.00 4.00 5.00 6.00 7.00 8.00 9.00 10.00 11.00 12.00 13.00 14.00
Fig. 26(61)Thermal/Alkali product chromatograph screening for FAC @ 4 day 2nd replicate.
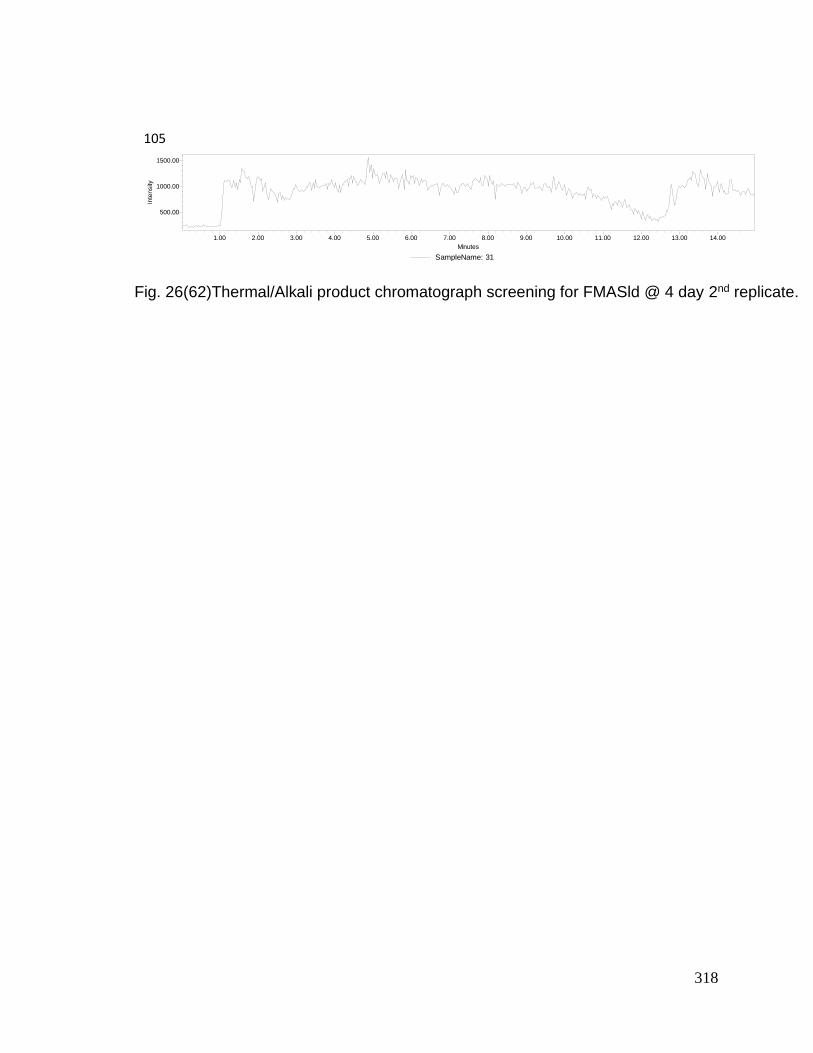
318
105
SampleName: 31
Inte
nsity
500.00
1000.00
1500.00
Minutes
1.00 2.00 3.00 4.00 5.00 6.00 7.00 8.00 9.00 10.00 11.00 12.00 13.00 14.00
Fig. 26(62)Thermal/Alkali product chromatograph screening for FMASld @ 4 day 2nd replicate.

319
106
SampleName: 31
Inte
nsity
0.0
1000.0
2000.0
3000.0
Minutes
1.00 2.00 3.00 4.00 5.00 6.00 7.00 8.00 9.00 10.00 11.00 12.00 13.00 14.00
Fig. 26(63)Thermal/Alkali product chromatograph screening for FBAL @ 4 day 2nd replicate.

320
149
SampleName: 31
Inte
nsity
500.00
1000.00
1500.00
Minutes
1.00 2.00 3.00 4.00 5.00 6.00 7.00 8.00 9.00 10.00 11.00 12.00 13.00 14.00
Fig. 26(64)Thermal/Alkali product chromatograph screening for FUPA @ 4 day 2nd replicate.

321
129
SampleName: 31
Inte
nsity
0.0
2000.0
4000.0
6000.0
8000.0
10000.0
Minutes
1.00 2.00 3.00 4.00 5.00 6.00 7.00 8.00 9.00 10.00 11.00 12.00 13.00 14.00
Fig. 26(65)Thermal/Alkali product chromatograph screening for 5-FU @ 4 day 2nd replicate.

322
32
77
SampleName: 32
Inte
nsity
0.0
2000.0
4000.0
6000.0
8000.0
Minutes
1.00 2.00 3.00 4.00 5.00 6.00 7.00 8.00 9.00 10.00 11.00 12.00 13.00 14.00
Fig. 26(66)Thermal/Alkali product chromatograph screening for FAC @ 4 day 3rd replicate.

323
105
SampleName: 32
Inte
nsity
500.00
1000.00
Minutes
1.00 2.00 3.00 4.00 5.00 6.00 7.00 8.00 9.00 10.00 11.00 12.00 13.00 14.00
Fig. 26(67)Thermal/Alkali product chromatograph screening for FMASld @ 4 day 3rd replicate.

324
106
SampleName: 32
Inte
nsity
0.0
2000.0
4000.0
Minutes
1.00 2.00 3.00 4.00 5.00 6.00 7.00 8.00 9.00 10.00 11.00 12.00 13.00 14.00
Fig. 26(68)Thermal/Alkali product chromatograph screening for FBAL @ 4 day 3rd replicate.

325
149
SampleName: 32
Inte
nsity
500.00
1000.00
1500.00
Minutes
1.00 2.00 3.00 4.00 5.00 6.00 7.00 8.00 9.00 10.00 11.00 12.00 13.00 14.00
Fig. 26(69)Thermal/Alkali product chromatograph screening for FUPA @ 4 day 3rd replicate.

326
129
SampleName: 32
Inte
nsity
0.0
2000.0
4000.0
6000.0
8000.0
Minutes
1.00 2.00 3.00 4.00 5.00 6.00 7.00 8.00 9.00 10.00 11.00 12.00 13.00 14.00
Fig. 26(70)Thermal/Alkali product chromatograph screening for 5-FU @ 4 day 3rd replicate.

327
33
77
SampleName: 33
Inte
nsity
0.0
2000.0
4000.0
6000.0
8000.0
Minutes
1.00 2.00 3.00 4.00 5.00 6.00 7.00 8.00 9.00 10.00 11.00 12.00 13.00 14.00
Fig. 26(71)Thermal/Alkali product chromatograph screening for FAC @ 5 day 1st replicate.

328
105
SampleName: 33
Inte
nsity
200.00
400.00
600.00
800.00
1000.00
1200.00
1400.00
Minutes
1.00 2.00 3.00 4.00 5.00 6.00 7.00 8.00 9.00 10.00 11.00 12.00 13.00 14.00
Fig. 26(72)Thermal/Alkali product chromatograph screening for FMASld @ 5 day 1st replicate.

329
106
SampleName: 33
Inte
nsity
0.00
500.00
1000.00
1500.00
2000.00
2500.00
3000.00
Minutes
1.00 2.00 3.00 4.00 5.00 6.00 7.00 8.00 9.00 10.00 11.00 12.00 13.00 14.00
Fig. 26(73)Thermal/Alkali product chromatograph screening for FBAL @ 5 day 1st replicate.

330
149
SampleName: 33
Inte
nsity
200.00
400.00
600.00
800.00
1000.00
1200.00
1400.00
1600.00
Minutes
1.00 2.00 3.00 4.00 5.00 6.00 7.00 8.00 9.00 10.00 11.00 12.00 13.00 14.00
Fig. 26(74)Thermal/Alkali product chromatograph screening for FUPA @ 5 day 1st replicate.

331
129
SampleName: 33
Inte
nsity
0.0
2000.0
4000.0
6000.0
8000.0
Minutes
1.00 2.00 3.00 4.00 5.00 6.00 7.00 8.00 9.00 10.00 11.00 12.00 13.00 14.00
Fig. 26(75)Thermal/Alkali product chromatograph screening for 5-FU @ 5 day 1st replicate.

332
34
77
SampleName: 34
Inte
nsity
0.0
2000.0
4000.0
6000.0
8000.0
Minutes
1.00 2.00 3.00 4.00 5.00 6.00 7.00 8.00 9.00 10.00 11.00 12.00 13.00 14.00
Fig. 26(76)Thermal/Alkali product chromatograph screening for FAC @ 5 day 2nd replicate.

333
105
SampleName: 34
Inte
nsity
200.00
400.00
600.00
800.00
1000.00
1200.00
1400.00
Minutes
1.00 2.00 3.00 4.00 5.00 6.00 7.00 8.00 9.00 10.00 11.00 12.00 13.00 14.00
Fig. 26(77)Thermal/Alkali product chromatograph screening for FMASld @ 5 day 2nd replicate.

334
106
SampleName: 34
Inte
nsity
0.0
1000.0
2000.0
3000.0
Minutes
1.00 2.00 3.00 4.00 5.00 6.00 7.00 8.00 9.00 10.00 11.00 12.00 13.00 14.00
Fig. 26(78)Thermal/Alkali product chromatograph screening for FBAL @ 5 day 2nd replicate.

335
149
SampleName: 34
Inte
nsity
200.00
400.00
600.00
800.00
1000.00
1200.00
1400.00
1600.00
1800.00
Minutes
1.00 2.00 3.00 4.00 5.00 6.00 7.00 8.00 9.00 10.00 11.00 12.00 13.00 14.00
Fig. 26(79)Thermal/Alkali product chromatograph screening for FUPA @ 5 day 2nd replicate.

336
129
SampleName: 34
Inte
nsity
0.0
2000.0
4000.0
6000.0
8000.0
Minutes
1.00 2.00 3.00 4.00 5.00 6.00 7.00 8.00 9.00 10.00 11.00 12.00 13.00 14.00
Fig. 26(80)Thermal/Alkali product chromatograph screening for 5-FU @ 5 day 2nd replicate.

337
35
77
SampleName: 35
Inte
nsity
0.0
2000.0
4000.0
6000.0
8000.0
Minutes
1.00 2.00 3.00 4.00 5.00 6.00 7.00 8.00 9.00 10.00 11.00 12.00 13.00 14.00
Fig. 26(81)Thermal/Alkali product chromatograph screening for FAC @ 5 day 3rd replicate.

338
105
SampleName: 35
Inte
nsity
200.00
400.00
600.00
800.00
1000.00
1200.00
1400.00
1600.00
Minutes
1.00 2.00 3.00 4.00 5.00 6.00 7.00 8.00 9.00 10.00 11.00 12.00 13.00 14.00
Fig. 26(82)Thermal/Alkali product chromatograph screening for FMASld @ 5 day 3rd replicate.

339
106
SampleName: 35
Inte
nsity
0.0
1000.0
2000.0
3000.0
4000.0
Minutes
1.00 2.00 3.00 4.00 5.00 6.00 7.00 8.00 9.00 10.00 11.00 12.00 13.00 14.00
Fig. 26(83)Thermal/Alkali product chromatograph screening for FBAL @ 5 day 3rd replicate.

340
149
SampleName: 35
Inte
nsity
200.00
400.00
600.00
800.00
1000.00
1200.00
1400.00
1600.00
Minutes
1.00 2.00 3.00 4.00 5.00 6.00 7.00 8.00 9.00 10.00 11.00 12.00 13.00 14.00
Fig. 26(84)Thermal/Alkali product chromatograph screening for FUPA @ 5 day 3rd replicate.
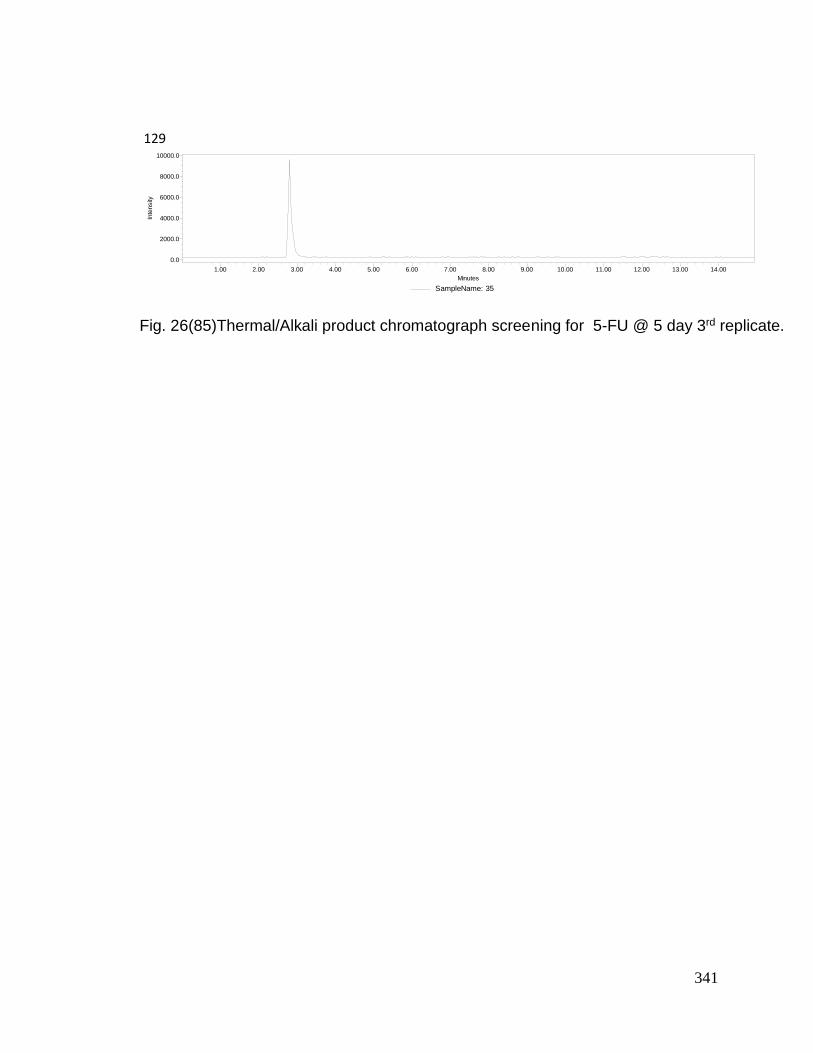
341
129
SampleName: 35
Inte
nsity
0.0
2000.0
4000.0
6000.0
8000.0
10000.0
Minutes
1.00 2.00 3.00 4.00 5.00 6.00 7.00 8.00 9.00 10.00 11.00 12.00 13.00 14.00
Fig. 26(85)Thermal/Alkali product chromatograph screening for 5-FU @ 5 day 3rd replicate.

342
36
77
SampleName: 36
Inte
nsity
0.0
2000.0
4000.0
6000.0
8000.0
Minutes
1.00 2.00 3.00 4.00 5.00 6.00 7.00 8.00 9.00 10.00 11.00 12.00 13.00 14.00
Fig. 26(86)Thermal/Alkali product chromatograph screening for FAC @ 6 day 1st replicate.

343
105
SampleName: 36
Inte
nsity
200.00
400.00
600.00
800.00
1000.00
1200.00
1400.00
1600.00
1800.00
Minutes
1.00 2.00 3.00 4.00 5.00 6.00 7.00 8.00 9.00 10.00 11.00 12.00 13.00 14.00
Fig. 26(87)Thermal/Alkali product chromatograph screening for FMASld @ 6 day 1st replicate.

344
106
SampleName: 36
Inte
nsity
0.0
1000.0
2000.0
3000.0
Minutes
1.00 2.00 3.00 4.00 5.00 6.00 7.00 8.00 9.00 10.00 11.00 12.00 13.00 14.00
Fig. 26(88)Thermal/Alkali product chromatograph screening for FBAL @ 6 day 1st replicate.

345
149
SampleName: 36
Inte
nsity
200.00
400.00
600.00
800.00
1000.00
1200.00
1400.00
1600.00
Minutes
1.00 2.00 3.00 4.00 5.00 6.00 7.00 8.00 9.00 10.00 11.00 12.00 13.00 14.00
Fig. 26(89)Thermal/Alkali product chromatograph screening for FUPA @ 6 day 1st replicate.

346
129
SampleName: 36
Inte
nsity
0.0
2000.0
4000.0
6000.0
8000.0
Minutes
1.00 2.00 3.00 4.00 5.00 6.00 7.00 8.00 9.00 10.00 11.00 12.00 13.00 14.00
Fig. 26(90)Thermal/Alkali product chromatograph screening for 5-FU @ 6 day 1st replicate.

347
37
77
SampleName: 37
Inte
nsity
0.0
2000.0
4000.0
6000.0
8000.0
Minutes
1.00 2.00 3.00 4.00 5.00 6.00 7.00 8.00 9.00 10.00 11.00 12.00 13.00 14.00
Fig. 26(91)Thermal/Alkali product chromatograph screening for FAC @ 6 day 2nd replicate.

348
105
SampleName: 37
Inte
nsity
200.00
400.00
600.00
800.00
1000.00
1200.00
1400.00
Minutes
1.00 2.00 3.00 4.00 5.00 6.00 7.00 8.00 9.00 10.00 11.00 12.00 13.00 14.00
Fig. 26(92)Thermal/Alkali product chromatograph screening for FMASld @ 6 day 2nd replicate.

349
106
SampleName: 37
Inte
nsity
0.0
1000.0
2000.0
3000.0
Minutes
1.00 2.00 3.00 4.00 5.00 6.00 7.00 8.00 9.00 10.00 11.00 12.00 13.00 14.00
Fig. 26(93)Thermal/Alkali product chromatograph screening for FBAL @ 6 day 2nd replicate.

350
149
SampleName: 37
Inte
nsity
200.00
400.00
600.00
800.00
1000.00
1200.00
1400.00
Minutes
1.00 2.00 3.00 4.00 5.00 6.00 7.00 8.00 9.00 10.00 11.00 12.00 13.00 14.00
Fig. 26(94)Thermal/Alkali product chromatograph screening for FUPA @ 6 day 2nd replicate.

351
129
SampleName: 37
Inte
nsity
0.0
2000.0
4000.0
6000.0
8000.0
Minutes
1.00 2.00 3.00 4.00 5.00 6.00 7.00 8.00 9.00 10.00 11.00 12.00 13.00 14.00
Fig. 26(95)Thermal/Alkali product chromatograph screening for 5-FU @ 6 day 2nd replicate.

352
38
77
SampleName: 38
Inte
nsity
0.0
2000.0
4000.0
6000.0
8000.0
Minutes
1.00 2.00 3.00 4.00 5.00 6.00 7.00 8.00 9.00 10.00 11.00 12.00 13.00 14.00
Fig. 26(96)Thermal/Alkali product chromatograph screening for FAC @ 6 day 3rd replicate.

353
105
SampleName: 38
Inte
nsity
200.00
400.00
600.00
800.00
1000.00
1200.00
1400.00
Minutes
1.00 2.00 3.00 4.00 5.00 6.00 7.00 8.00 9.00 10.00 11.00 12.00 13.00 14.00
Fig. 26(97)Thermal/Alkali product chromatograph screening for FMASld @ 6 day 3rd replicate.

354
106
SampleName: 38
Inte
nsity
0.0
1000.0
2000.0
3000.0
Minutes
1.00 2.00 3.00 4.00 5.00 6.00 7.00 8.00 9.00 10.00 11.00 12.00 13.00 14.00
Fig. 26(98)Thermal/Alkali product chromatograph screening for FBAL @ 6 day 3rd replicate.

355
149
SampleName: 38
Inte
nsity
500.00
1000.00
1500.00
Minutes
1.00 2.00 3.00 4.00 5.00 6.00 7.00 8.00 9.00 10.00 11.00 12.00 13.00 14.00
Fig. 26(99)Thermal/Alkali product chromatograph screening for FUPA @ 6 day 3rd replicate.

356
129
SampleName: 38
Inte
nsity
0.0
2000.0
4000.0
6000.0
8000.0
10000.0
Minutes
1.00 2.00 3.00 4.00 5.00 6.00 7.00 8.00 9.00 10.00 11.00 12.00 13.00 14.00
Fig. 26(100)Thermal/Alkali product chromatograph screening for 5-FU @ 6 day 3rd replicate.

357
39
77
SampleName: 39
Inte
nsity
0.0
2000.0
4000.0
6000.0
8000.0
Minutes
1.00 2.00 3.00 4.00 5.00 6.00 7.00 8.00 9.00 10.00 11.00 12.00 13.00 14.00
Fig. 26(101)Thermal/Alkali product chromatograph screening for FAC @ 7 day 1st replicate.

358
105
SampleName: 39
Inte
nsity
200.00
400.00
600.00
800.00
1000.00
1200.00
1400.00
Minutes
1.00 2.00 3.00 4.00 5.00 6.00 7.00 8.00 9.00 10.00 11.00 12.00 13.00 14.00
Fig. 26(102)Thermal/Alkali product chromatograph screening for FMASld @ 7 day 1st replicate.

359
106
SampleName: 39
Inte
nsity
0.0
1000.0
2000.0
3000.0
4000.0
Minutes
1.00 2.00 3.00 4.00 5.00 6.00 7.00 8.00 9.00 10.00 11.00 12.00 13.00 14.00
Fig. 26(103)Thermal/Alkali product chromatograph screening for FBAL @ 7 day 1st replicate.

360
149
SampleName: 39
Inte
nsity
200.00
400.00
600.00
800.00
1000.00
1200.00
1400.00
Minutes
1.00 2.00 3.00 4.00 5.00 6.00 7.00 8.00 9.00 10.00 11.00 12.00 13.00 14.00
Fig. 26(104)Thermal/Alkali product chromatograph screening for FUPA @ 7 day 1st replicate.

361
129
SampleName: 39
Inte
nsity
0.0
2000.0
4000.0
6000.0
8000.0
Minutes
1.00 2.00 3.00 4.00 5.00 6.00 7.00 8.00 9.00 10.00 11.00 12.00 13.00 14.00
Fig. 26(105)Thermal/Alkali product chromatograph screening for 5-FU @ 7 day 1st replicate.

362
40
77
SampleName: 40
Inte
nsity
0.0
2000.0
4000.0
6000.0
8000.0
Minutes
1.00 2.00 3.00 4.00 5.00 6.00 7.00 8.00 9.00 10.00 11.00 12.00 13.00 14.00
Fig. 26(106)Thermal/Alkali product chromatograph screening for FAC @ 7 day 2nd replicate.

363
105
SampleName: 40
Inte
nsity
500.00
1000.00
1500.00
Minutes
1.00 2.00 3.00 4.00 5.00 6.00 7.00 8.00 9.00 10.00 11.00 12.00 13.00 14.00
Fig. 26(107)Thermal/Alkali product chromatograph screening for FMASld @ 7 day 2nd replicate.

364
106
SampleName: 40
Inte
nsity
0.0
1000.0
2000.0
3000.0
Minutes
1.00 2.00 3.00 4.00 5.00 6.00 7.00 8.00 9.00 10.00 11.00 12.00 13.00 14.00
Fig. 26(108)Thermal/Alkali product chromatograph screening for FBAL @ 7 day 2nd replicate.

365
149
SampleName: 40
Inte
nsity
200.00
400.00
600.00
800.00
1000.00
1200.00
1400.00
1600.00
Minutes
1.00 2.00 3.00 4.00 5.00 6.00 7.00 8.00 9.00 10.00 11.00 12.00 13.00 14.00
Fig. 26(109)Thermal/Alkali product chromatograph screening for FUPA @ 7 day 2nd replicate.

366
129
SampleName: 40
Inte
nsity
0.0
2000.0
4000.0
6000.0
8000.0
10000.0
Minutes
1.00 2.00 3.00 4.00 5.00 6.00 7.00 8.00 9.00 10.00 11.00 12.00 13.00 14.00
Fig. 26(110)Thermal/Alkali product chromatograph screening for 5-FU @ 7 day 2nd replicate.

367
41
77
SampleName: 41
Inte
nsity
0.0
2000.0
4000.0
6000.0
8000.0
Minutes
1.00 2.00 3.00 4.00 5.00 6.00 7.00 8.00 9.00 10.00 11.00 12.00 13.00 14.00
Fig. 26(111)Thermal/Alkali product chromatograph screening for FAC @ 7 day 3rd replicate.

368
105
SampleName: 41
Inte
nsity
200.00
400.00
600.00
800.00
1000.00
1200.00
1400.00
1600.00
Minutes
1.00 2.00 3.00 4.00 5.00 6.00 7.00 8.00 9.00 10.00 11.00 12.00 13.00 14.00
Fig. 26(112)Thermal/Alkali product chromatograph screening for FMASld @ 7 day 3rd replicate.

369
106
SampleName: 41
Inte
nsity
0.00
500.00
1000.00
1500.00
2000.00
2500.00
Minutes
1.00 2.00 3.00 4.00 5.00 6.00 7.00 8.00 9.00 10.00 11.00 12.00 13.00 14.00
Fig. 26(113)Thermal/Alkali product chromatograph screening for FBAL @ 7 day 3rd replicate.

370
149
SampleName: 41
Inte
nsity
500.00
1000.00
1500.00
Minutes
1.00 2.00 3.00 4.00 5.00 6.00 7.00 8.00 9.00 10.00 11.00 12.00 13.00 14.00
Fig. 26(114)Thermal/Alkali product chromatograph screening for FUPA @ 7 day 3rd replicate.

371
129
SampleName: 41
Inte
nsity
0.0
2000.0
4000.0
6000.0
8000.0
Minutes
1.00 2.00 3.00 4.00 5.00 6.00 7.00 8.00 9.00 10.00 11.00 12.00 13.00 14.00
Fig. 26(115)Thermal/Alkali product chromatograph screening for 5-FU @ 7 day 3rd replicate.

372
1
77
105
SampleName: 1B
Inte
nsity
0.0
2000.0
4000.0
6000.0
8000.0
10000.0
12000.0
14000.0
16000.0
18000.0
20000.0
22000.0
24000.0
26000.0
Minutes
1.00 2.00 3.00 4.00 5.00 6.00 7.00 8.00 9.00 10.00 11.00 12.00 13.00 14.00
Fig. 27e Thermal/Acidic study’s product chromatograph screening for FAC sample 1.

373
106
SampleName: 1B
Inte
nsity
500.00
1000.00
1500.00
2000.00
2500.00
3000.00
3500.00
4000.00
Minutes
1.00 2.00 3.00 4.00 5.00 6.00 7.00 8.00 9.00 10.00 11.00 12.00 13.00 14.00
Fig. 27f Thermal/Acidic study’s product chromatograph screening for FMASld sample 1.

374
149
SampleName: 1B
Inte
nsity
0.00
200.00
400.00
600.00
800.00
1000.00
1200.00
1400.00
1600.00
1800.00
2000.00
Minutes
1.00 2.00 3.00 4.00 5.00 6.00 7.00 8.00 9.00 10.00 11.00 12.00 13.00 14.00
Fig. 27g Thermal/Acidic study’s product chromatograph screening for FBAL sample 1.

375
129
SampleName: 1B
Inte
nsity
200.00
250.00
300.00
350.00
400.00
450.00
500.00
550.00
600.00
650.00
700.00
750.00
800.00
850.00
900.00
950.00
Minutes
1.00 2.00 3.00 4.00 5.00 6.00 7.00 8.00 9.00 10.00 11.00 12.00 13.00 14.00
Fig. 27h Thermal/Acidic study’s product chromatograph screening for FUPA sample 1.

376
2
SampleName: 1B
Inte
nsity
0.0
1000.0
2000.0
3000.0
4000.0
5000.0
6000.0
7000.0
8000.0
9000.0
Minutes
1.00 2.00 3.00 4.00 5.00 6.00 7.00 8.00 9.00 10.00 11.00 12.00 13.00 14.00
Fig. 27i Thermal/Acidic study’s product chromatograph screening for 5-FU sample 1.

377
77
SampleName: 2B
Inte
nsity
0.0
2000.0
4000.0
6000.0
8000.0
10000.0
12000.0
14000.0
16000.0
18000.0
Minutes
1.00 2.00 3.00 4.00 5.00 6.00 7.00 8.00 9.00 10.00 11.00 12.00 13.00 14.00
Fig. 27j Thermal/Acidic study’s product chromatograph screening for FAC sample 2.

378
105
SampleName: 2B
Inte
nsity
200.00
400.00
600.00
800.00
1000.00
1200.00
1400.00
1600.00
1800.00
2000.00
2200.00
2400.00
2600.00
2800.00
3000.00
3200.00
3400.00
3600.00
3800.00
Minutes
1.00 2.00 3.00 4.00 5.00 6.00 7.00 8.00 9.00 10.00 11.00 12.00 13.00 14.00
Fig. 27k Thermal/Acidic study’s product chromatograph screening for FMASld sample 2.

379
106
SampleName: 2B
Inte
nsity
0.00
200.00
400.00
600.00
800.00
1000.00
1200.00
1400.00
1600.00
1800.00
2000.00
2200.00
2400.00
2600.00
2800.00
Minutes
1.00 2.00 3.00 4.00 5.00 6.00 7.00 8.00 9.00 10.00 11.00 12.00 13.00 14.00
Fig. 27l Thermal/Acidic study’s product chromatograph screening for FBAL sample 2.

380
149
SampleName: 2B
Inte
nsity
200.00
300.00
400.00
500.00
600.00
700.00
800.00
900.00
1000.00
1100.00
Minutes
1.00 2.00 3.00 4.00 5.00 6.00 7.00 8.00 9.00 10.00 11.00 12.00 13.00 14.00
Fig. 27m Thermal/Acidic study’s product chromatograph screening for FUPA sample 2.

381
129
SampleName: 2B
Inte
nsity
0.0
1000.0
2000.0
3000.0
4000.0
5000.0
6000.0
7000.0
8000.0
9000.0
Minutes
1.00 2.00 3.00 4.00 5.00 6.00 7.00 8.00 9.00 10.00 11.00 12.00 13.00 14.00
Fig. 27n Thermal/Acidic study’s product chromatograph screening for 5-FU sample 2.

382
3
77
SampleName: 3B
Inte
nsity
0.0
2000.0
4000.0
6000.0
8000.0
10000.0
12000.0
14000.0
16000.0
Minutes
1.00 2.00 3.00 4.00 5.00 6.00 7.00 8.00 9.00 10.00 11.00 12.00 13.00 14.00
Fig. 27o Thermal/Acidic study’s product chromatograph screening for FAC sample 3.

383
105
SampleName: 3B
Inte
nsity
500.00
1000.00
1500.00
2000.00
2500.00
3000.00
3500.00
4000.00
Minutes
1.00 2.00 3.00 4.00 5.00 6.00 7.00 8.00 9.00 10.00 11.00 12.00 13.00 14.00
Fig. 27p Thermal/Acidic study’s product chromatograph screening for FMASld sample 3.

384
106
SampleName: 3B
Inte
nsity
0.00
200.00
400.00
600.00
800.00
1000.00
1200.00
1400.00
1600.00
1800.00
2000.00
2200.00
Minutes
1.00 2.00 3.00 4.00 5.00 6.00 7.00 8.00 9.00 10.00 11.00 12.00 13.00 14.00
Fig. 27q Thermal/Acidic study’s product chromatograph screening for FBAL sample 3.

385
149
SampleName: 3B
Inte
nsity
200.00
300.00
400.00
500.00
600.00
700.00
800.00
900.00
1000.00
1100.00
1200.00
1300.00
1400.00
1500.00
1600.00
Minutes
1.00 2.00 3.00 4.00 5.00 6.00 7.00 8.00 9.00 10.00 11.00 12.00 13.00 14.00
Fig. 27r Thermal/Acidic study’s product chromatograph screening for FUPA sample 3.

386
129
SampleName: 3B
Inte
nsity
0.0
1000.0
2000.0
3000.0
4000.0
5000.0
6000.0
7000.0
8000.0
9000.0
Minutes
1.00 2.00 3.00 4.00 5.00 6.00 7.00 8.00 9.00 10.00 11.00 12.00 13.00 14.00
Fig. 27s Thermal/Acidic study’s product chromatograph screening for 5-FU sample 3.

387
4
77
SampleName: 4B
Inte
nsity
0.0
1000.0
2000.0
3000.0
4000.0
5000.0
6000.0
7000.0
8000.0
9000.0
10000.0
11000.0
12000.0
13000.0
14000.0
Minutes
1.00 2.00 3.00 4.00 5.00 6.00 7.00 8.00 9.00 10.00 11.00 12.00 13.00 14.00
Fig. 27t Thermal/Acidic study’s product chromatograph screening for FAC sample 4.

388
105
SampleName: 4B
Inte
nsity
200.00
400.00
600.00
800.00
1000.00
1200.00
1400.00
1600.00
1800.00
2000.00
2200.00
2400.00
2600.00
2800.00
3000.00
3200.00
3400.00
3600.00
3800.00
4000.00
Minutes
1.00 2.00 3.00 4.00 5.00 6.00 7.00 8.00 9.00 10.00 11.00 12.00 13.00 14.00
Fig. 27u Thermal/Acidic study’s product chromatograph screening for FMASld sample 4.

389
106
SampleName: 4B
Inte
nsity
0.00
200.00
400.00
600.00
800.00
1000.00
1200.00
1400.00
1600.00
1800.00
2000.00
Minutes
1.00 2.00 3.00 4.00 5.00 6.00 7.00 8.00 9.00 10.00 11.00 12.00 13.00 14.00
Fig. 27v Thermal/Acidic study’s product chromatograph screening for FBAL sample 4.

390
149
SampleName: 4B
Inte
nsity
200.00
300.00
400.00
500.00
600.00
700.00
800.00
900.00
1000.00
1100.00
Minutes
1.00 2.00 3.00 4.00 5.00 6.00 7.00 8.00 9.00 10.00 11.00 12.00 13.00 14.00
Fig. 27w Thermal/Acidic study’s product chromatograph screening for FUPA sample 4.

391
129
SampleName: 4B
Inte
nsity
0.0
1000.0
2000.0
3000.0
4000.0
5000.0
6000.0
7000.0
8000.0
9000.0
Minutes
1.00 2.00 3.00 4.00 5.00 6.00 7.00 8.00 9.00 10.00 11.00 12.00 13.00 14.00
Fig. 27x Thermal/Acidic study’s product chromatograph screening for 5-FU sample 4.

392
5
77
SampleName: 5B
Inte
nsity
0.0
1000.0
2000.0
3000.0
4000.0
5000.0
6000.0
7000.0
8000.0
9000.0
10000.0
11000.0
12000.0
Minutes
1.00 2.00 3.00 4.00 5.00 6.00 7.00 8.00 9.00 10.00 11.00 12.00 13.00 14.00
Fig. 27y Thermal/Acidic study’s product chromatograph screening for FAC sample 5.

393
105
SampleName: 5B
Inte
nsity
200.00
400.00
600.00
800.00
1000.00
1200.00
1400.00
1600.00
1800.00
2000.00
2200.00
2400.00
2600.00
2800.00
3000.00
3200.00
3400.00
3600.00
3800.00
4000.00
Minutes
1.00 2.00 3.00 4.00 5.00 6.00 7.00 8.00 9.00 10.00 11.00 12.00 13.00 14.00
Fig. 27z Thermal/Acidic study’s product chromatograph screening for FMASld sample 5.

394
106
SampleName: 5B
Inte
nsity
0.00
200.00
400.00
600.00
800.00
1000.00
1200.00
1400.00
1600.00
1800.00
Minutes
1.00 2.00 3.00 4.00 5.00 6.00 7.00 8.00 9.00 10.00 11.00 12.00 13.00 14.00
Fig. 27aa Thermal/Acidic study’s product chromatograph screening for FBAL sample 5.
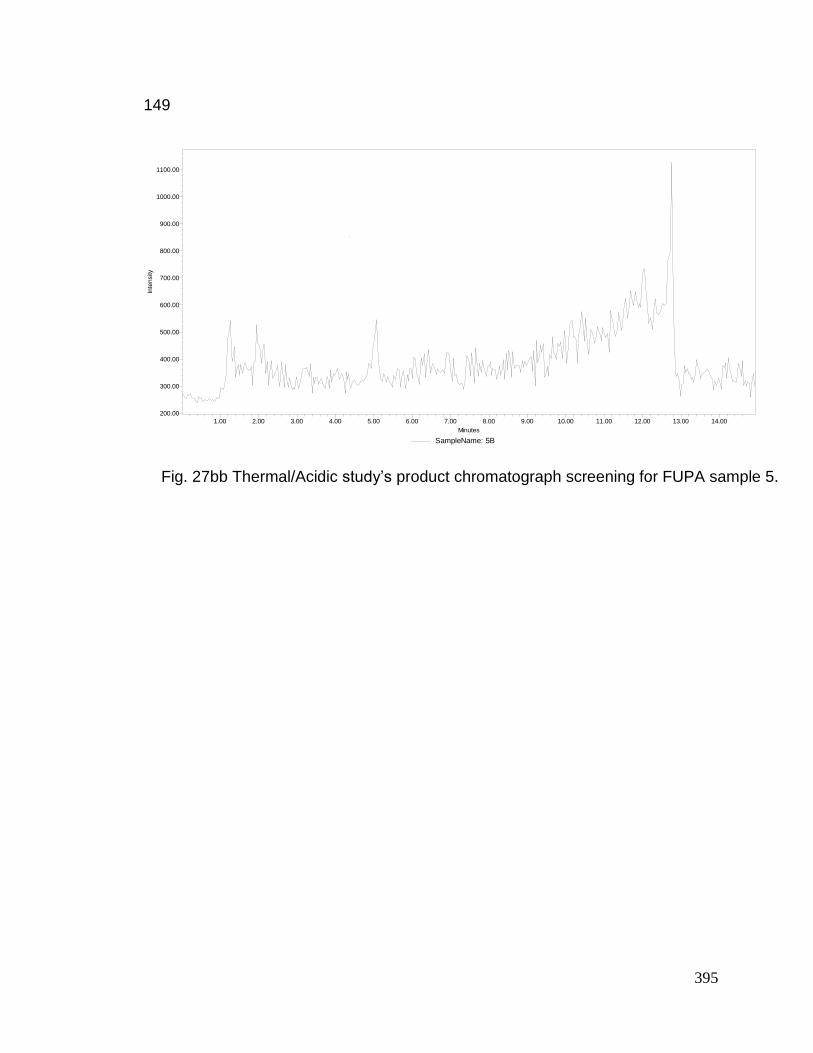
395
149
SampleName: 5B
Inte
nsity
200.00
300.00
400.00
500.00
600.00
700.00
800.00
900.00
1000.00
1100.00
Minutes
1.00 2.00 3.00 4.00 5.00 6.00 7.00 8.00 9.00 10.00 11.00 12.00 13.00 14.00
Fig. 27bb Thermal/Acidic study’s product chromatograph screening for FUPA sample 5.

396
129
SampleName: 5B
Inte
nsity
0.0
1000.0
2000.0
3000.0
4000.0
5000.0
6000.0
7000.0
8000.0
9000.0
Minutes
1.00 2.00 3.00 4.00 5.00 6.00 7.00 8.00 9.00 10.00 11.00 12.00 13.00 14.00
Fig. 27cc Thermal/Acidic study’s product chromatograph screening for 5-FU sample 5.

397
6
77
SampleName: 5B
Inte
nsity
0.0
1000.0
2000.0
3000.0
4000.0
5000.0
6000.0
7000.0
8000.0
9000.0
Minutes
1.00 2.00 3.00 4.00 5.00 6.00 7.00 8.00 9.00 10.00 11.00 12.00 13.00 14.00
Fig. 27dd Thermal/Acidic study’s product chromatograph screening for FAC sample 6.

398
105
SampleName: 6B
Inte
nsity
500.00
1000.00
1500.00
2000.00
2500.00
3000.00
3500.00
4000.00
4500.00
Minutes
1.00 2.00 3.00 4.00 5.00 6.00 7.00 8.00 9.00 10.00 11.00 12.00 13.00 14.00
Fig. 27ee Thermal/Acidic study’s product chromatograph screening for FMASld sample 6.

399
106
SampleName: 6B
Inte
nsity
0.00
200.00
400.00
600.00
800.00
1000.00
1200.00
1400.00
1600.00
1800.00
Minutes
1.00 2.00 3.00 4.00 5.00 6.00 7.00 8.00 9.00 10.00 11.00 12.00 13.00 14.00
Fig. 27ff Thermal/Acidic study’s product chromatograph screening for FBAL sample 6.

400
149
SampleName: 6B
Inte
nsity
200.00
300.00
400.00
500.00
600.00
700.00
800.00
900.00
1000.00
1100.00
1200.00
1300.00
Minutes
1.00 2.00 3.00 4.00 5.00 6.00 7.00 8.00 9.00 10.00 11.00 12.00 13.00 14.00
Fig. 27gg Thermal/Acidic study’s product chromatograph screening for FUPA sample 6.

401
129
SampleName: 6B
Inte
nsity
0.0
1000.0
2000.0
3000.0
4000.0
5000.0
6000.0
7000.0
8000.0
9000.0
Minutes
1.00 2.00 3.00 4.00 5.00 6.00 7.00 8.00 9.00 10.00 11.00 12.00 13.00 14.00
Fig. 27hh Thermal/Acidic study’s product chromatograph screening for 5-FU sample 6.

402
7
77
SampleName: 7B
Inte
nsity
0.0
1000.0
2000.0
3000.0
4000.0
5000.0
6000.0
7000.0
8000.0
9000.0
10000.0
Minutes
1.00 2.00 3.00 4.00 5.00 6.00 7.00 8.00 9.00 10.00 11.00 12.00 13.00 14.00
Fig. 27ii Thermal/Acidic study’s product chromatograph screening for FAC sample 7.

403
105
SampleName: 7B
Inte
nsity
500.00
1000.00
1500.00
2000.00
2500.00
3000.00
3500.00
4000.00
4500.00
Minutes
1.00 2.00 3.00 4.00 5.00 6.00 7.00 8.00 9.00 10.00 11.00 12.00 13.00 14.00
Fig. 27jj Thermal/Acidic study’s product chromatograph screening for FMASld sample 7.

404
106
SampleName: 7B
Inte
nsity
0.00
200.00
400.00
600.00
800.00
1000.00
1200.00
1400.00
1600.00
1800.00
2000.00
Minutes
1.00 2.00 3.00 4.00 5.00 6.00 7.00 8.00 9.00 10.00 11.00 12.00 13.00 14.00
Fig. 27kk Thermal/Acidic study’s product chromatograph screening for FBAL sample 7.
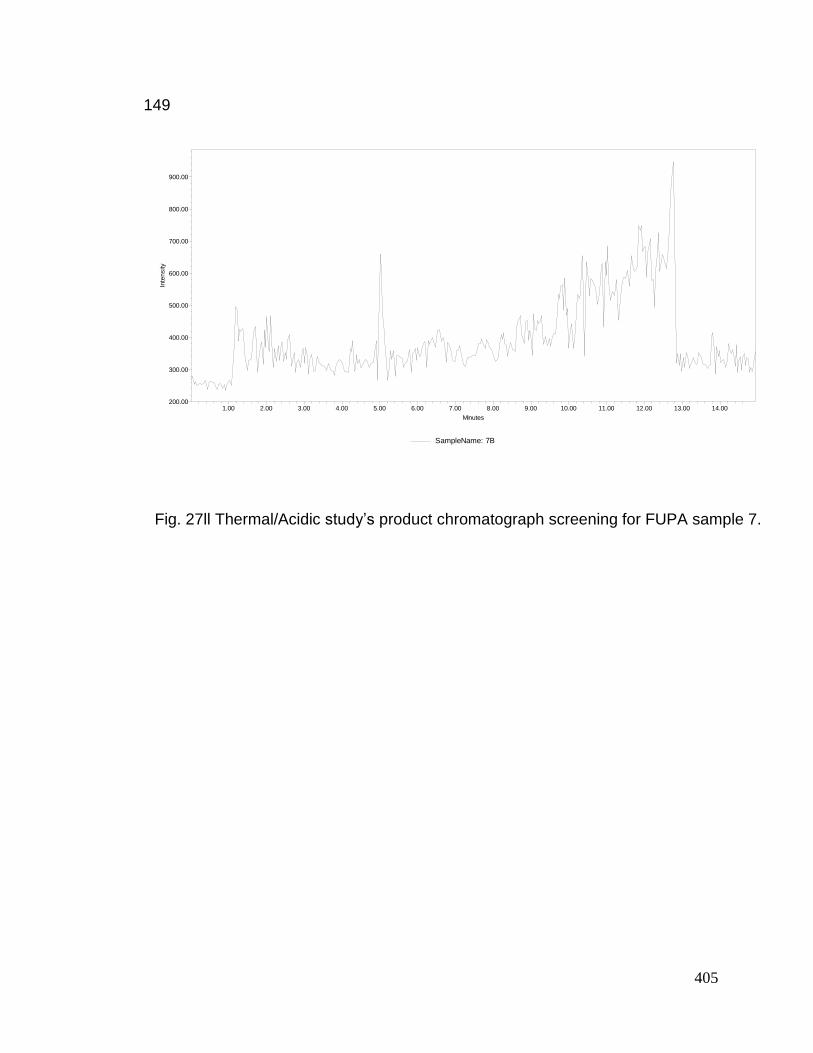
405
149
SampleName: 7B
Inte
nsity
200.00
300.00
400.00
500.00
600.00
700.00
800.00
900.00
Minutes
1.00 2.00 3.00 4.00 5.00 6.00 7.00 8.00 9.00 10.00 11.00 12.00 13.00 14.00
Fig. 27ll Thermal/Acidic study’s product chromatograph screening for FUPA sample 7.

406
129
SampleName: 7B
Inte
nsity
0.0
1000.0
2000.0
3000.0
4000.0
5000.0
6000.0
7000.0
8000.0
9000.0
Minutes
1.00 2.00 3.00 4.00 5.00 6.00 7.00 8.00 9.00 10.00 11.00 12.00 13.00 14.00
Fig. 27mm Thermal/Acidic study’s product chromatograph screening for 5-FU sample 7.

407
8
77
SampleName: 8B
Inte
nsity
0.0
1000.0
2000.0
3000.0
4000.0
5000.0
6000.0
7000.0
8000.0
9000.0
10000.0
Minutes
1.00 2.00 3.00 4.00 5.00 6.00 7.00 8.00 9.00 10.00 11.00 12.00 13.00 14.00
Fig. 27nn Thermal/Acidic study’s product chromatograph screening for FAC sample 8.

408
105
SampleName: 8B
Inte
nsity
200.00
400.00
600.00
800.00
1000.00
1200.00
1400.00
1600.00
1800.00
2000.00
2200.00
2400.00
2600.00
2800.00
3000.00
3200.00
Minutes
1.00 2.00 3.00 4.00 5.00 6.00 7.00 8.00 9.00 10.00 11.00 12.00 13.00 14.00
Fig. 27oo Thermal/Acidic study’s product chromatograph screening for FMASld sample 8.

409
106
SampleName: 8B
Inte
nsity
0.00
200.00
400.00
600.00
800.00
1000.00
1200.00
1400.00
1600.00
1800.00
2000.00
2200.00
2400.00
2600.00
Minutes
1.00 2.00 3.00 4.00 5.00 6.00 7.00 8.00 9.00 10.00 11.00 12.00 13.00 14.00
Fig. 27pp Thermal/Acidic study’s product chromatograph screening for FBAL sample 8.

410
149
SampleName: 8B
Inte
nsity
200.00
300.00
400.00
500.00
600.00
700.00
800.00
900.00
1000.00
1100.00
Minutes
1.00 2.00 3.00 4.00 5.00 6.00 7.00 8.00 9.00 10.00 11.00 12.00 13.00 14.00
Fig. 27qq Thermal/Acidic study’s product chromatograph screening for FUPA sample 8.

411
129
SampleName: 8B
Inte
nsity
0.0
1000.0
2000.0
3000.0
4000.0
5000.0
6000.0
7000.0
8000.0
9000.0
10000.0
Minutes
1.00 2.00 3.00 4.00 5.00 6.00 7.00 8.00 9.00 10.00 11.00 12.00 13.00 14.00
Fig. 27rr Thermal/Acidic study’s product chromatograph screening for 5-FU sample 8.

412
9
77
SampleName: 9B
Inte
nsity
0.0
1000.0
2000.0
3000.0
4000.0
5000.0
6000.0
7000.0
8000.0
9000.0
Minutes
1.00 2.00 3.00 4.00 5.00 6.00 7.00 8.00 9.00 10.00 11.00 12.00 13.00 14.00
Fig. 27ss Thermal/Acidic study’s product chromatograph screening for FAC sample 9.

413
105
SampleName: 9B
Inte
nsity
0.0
1000.0
2000.0
3000.0
4000.0
5000.0
6000.0
7000.0
8000.0
9000.0
Minutes
1.00 2.00 3.00 4.00 5.00 6.00 7.00 8.00 9.00 10.00 11.00 12.00 13.00 14.00
Fig. 27tt Thermal/Acidic study’s product chromatograph screening for FMASld sample 9.

414
106
SampleName: 9B
Inte
nsity
0.00
200.00
400.00
600.00
800.00
1000.00
1200.00
1400.00
1600.00
1800.00
2000.00
2200.00
Minutes
1.00 2.00 3.00 4.00 5.00 6.00 7.00 8.00 9.00 10.00 11.00 12.00 13.00 14.00
Fig. 27uu Thermal/Acidic study’s product chromatograph screening for FBAL sample 9.

415
149
SampleName: 9B
Inte
nsity
200.00
300.00
400.00
500.00
600.00
700.00
800.00
900.00
1000.00
1100.00
1200.00
1300.00
1400.00
Minutes
1.00 2.00 3.00 4.00 5.00 6.00 7.00 8.00 9.00 10.00 11.00 12.00 13.00 14.00
Fig. 27vv Thermal/Acidic study’s product chromatograph screening for FUPA sample 9.

416
129
SampleName: 9B
Inte
nsity
0.0
1000.0
2000.0
3000.0
4000.0
5000.0
6000.0
7000.0
8000.0
Minutes
1.00 2.00 3.00 4.00 5.00 6.00 7.00 8.00 9.00 10.00 11.00 12.00 13.00 14.00
Fig. 27ww Thermal/Acidic study’s product chromatograph screening for 5-FU sample 9.

417
10
77
SampleName: 10B
Inte
nsity
0.0
1000.0
2000.0
3000.0
4000.0
5000.0
6000.0
7000.0
8000.0
Minutes
1.00 2.00 3.00 4.00 5.00 6.00 7.00 8.00 9.00 10.00 11.00 12.00 13.00 14.00
Fig. 27vv Thermal/Acidic study’s product chromatograph screening for FAC sample 10.

418
105
SampleName: 10B
Inte
nsity
200.00
400.00
600.00
800.00
1000.00
1200.00
1400.00
1600.00
1800.00
2000.00
2200.00
2400.00
2600.00
2800.00
3000.00
3200.00
3400.00
3600.00
Minutes
1.00 2.00 3.00 4.00 5.00 6.00 7.00 8.00 9.00 10.00 11.00 12.00 13.00 14.00
Fig. 27xx Thermal/Acidic study’s product chromatograph screening for FMASld sample 10.

419
106
SampleName: 10B
Inte
nsity
0.00
200.00
400.00
600.00
800.00
1000.00
1200.00
1400.00
1600.00
1800.00
2000.00
2200.00
2400.00
Minutes
1.00 2.00 3.00 4.00 5.00 6.00 7.00 8.00 9.00 10.00 11.00 12.00 13.00 14.00
Fig. 27yy Thermal/Acidic study’s product chromatograph screening for FBAL sample 10.

420
149
SampleName: 10B
Inte
nsity
200.00
300.00
400.00
500.00
600.00
700.00
800.00
900.00
1000.00
1100.00
1200.00
Minutes
1.00 2.00 3.00 4.00 5.00 6.00 7.00 8.00 9.00 10.00 11.00 12.00 13.00 14.00
Fig. 27zz Thermal/Acidic study’s product chromatograph screening for FUPA sample 10.

421
129
SampleName: 10B
Inte
nsity
0.0
1000.0
2000.0
3000.0
4000.0
5000.0
6000.0
7000.0
8000.0
9000.0
Minutes
1.00 2.00 3.00 4.00 5.00 6.00 7.00 8.00 9.00 10.00 11.00 12.00 13.00 14.00
Fig. 27aa Thermal/Acidic study’s product chromatograph screening for 5-FU sample 10.

422
11
77
SampleName: 11B
Inte
nsity
0.0
1000.0
2000.0
3000.0
4000.0
5000.0
6000.0
7000.0
8000.0
Minutes
1.00 2.00 3.00 4.00 5.00 6.00 7.00 8.00 9.00 10.00 11.00 12.00 13.00 14.00
Fig. 27bb Thermal/Acidic study’s product chromatograph screening for FAC sample 11.

423
105
SampleName: 11B
Inte
nsity
500.00
1000.00
1500.00
2000.00
2500.00
3000.00
3500.00
4000.00
4500.00
Minutes
1.00 2.00 3.00 4.00 5.00 6.00 7.00 8.00 9.00 10.00 11.00 12.00 13.00 14.00
Fig. 27cc Thermal/Acidic study’s product chromatograph screening for FMASld sample 11.

424
106
SampleName: 11B
Inte
nsity
0.00
200.00
400.00
600.00
800.00
1000.00
1200.00
1400.00
1600.00
1800.00
2000.00
Minutes
1.00 2.00 3.00 4.00 5.00 6.00 7.00 8.00 9.00 10.00 11.00 12.00 13.00 14.00
Fig. 27dd Thermal/Acidic study’s product chromatograph screening for FBAL sample 11.

425
149
SampleName: 11B
Inte
nsity
200.00
300.00
400.00
500.00
600.00
700.00
800.00
900.00
1000.00
1100.00
1200.00
1300.00
Minutes
1.00 2.00 3.00 4.00 5.00 6.00 7.00 8.00 9.00 10.00 11.00 12.00 13.00 14.00
Fig. 27ee Thermal/Acidic study’s product chromatograph screening for FUPA sample 11.

426
129
SampleName: 11B
Inte
nsity
0.0
1000.0
2000.0
3000.0
4000.0
5000.0
6000.0
7000.0
8000.0
9000.0
Minutes
1.00 2.00 3.00 4.00 5.00 6.00 7.00 8.00 9.00 10.00 11.00 12.00 13.00 14.00
Fig. 27ff Thermal/Acidic study’s product chromatograph screening for 5-FU sample 11.

427
12
77
SampleName: 12B
Inte
nsity
0.0
1000.0
2000.0
3000.0
4000.0
5000.0
6000.0
7000.0
8000.0
Minutes
1.00 2.00 3.00 4.00 5.00 6.00 7.00 8.00 9.00 10.00 11.00 12.00 13.00 14.00
Fig. 27gg Thermal/Acidic study’s product chromatograph screening for FAC sample 12.

428
105
SampleName: 12B
Inte
nsity
500.00
1000.00
1500.00
2000.00
2500.00
3000.00
3500.00
4000.00
Minutes
1.00 2.00 3.00 4.00 5.00 6.00 7.00 8.00 9.00 10.00 11.00 12.00 13.00 14.00
Fig. 27hh Thermal/Acidic study’s product chromatograph screening for FMASld sample 12.

429
106
SampleName: 12B
Inte
nsity
0.00
200.00
400.00
600.00
800.00
1000.00
1200.00
1400.00
1600.00
1800.00
2000.00
Minutes
1.00 2.00 3.00 4.00 5.00 6.00 7.00 8.00 9.00 10.00 11.00 12.00 13.00 14.00
Fig. 27ii Thermal/Acidic study’s product chromatograph screening for FBAL sample 12.

430
149
SampleName: 12B
Inte
nsity
200.00
300.00
400.00
500.00
600.00
700.00
800.00
900.00
1000.00
1100.00
1200.00
Minutes
1.00 2.00 3.00 4.00 5.00 6.00 7.00 8.00 9.00 10.00 11.00 12.00 13.00 14.00
Fig. 27jj Thermal/Acidic study’s product chromatograph screening for FUPA sample 12.

431
129
SampleName: 12B
Inte
nsity
0.0
1000.0
2000.0
3000.0
4000.0
5000.0
6000.0
7000.0
8000.0
9000.0
Minutes
1.00 2.00 3.00 4.00 5.00 6.00 7.00 8.00 9.00 10.00 11.00 12.00 13.00 14.00
Fig. 27kk Thermal/Acidic study’s product chromatograph screening for 5-FU sample 12.

432
13
77
SampleName: 13B
Inte
nsity
0.00
500.00
1000.00
1500.00
2000.00
2500.00
3000.00
3500.00
4000.00
4500.00
5000.00
5500.00
6000.00
6500.00
7000.00
7500.00
Minutes
1.00 2.00 3.00 4.00 5.00 6.00 7.00 8.00 9.00 10.00 11.00 12.00 13.00 14.00
Fig. 27ll Thermal/Acidic study’s product chromatograph screening for FAC sample 13.

433
105
SampleName: 13B
Inte
nsity
200.00
400.00
600.00
800.00
1000.00
1200.00
1400.00
1600.00
1800.00
2000.00
2200.00
2400.00
2600.00
2800.00
3000.00
3200.00
3400.00
3600.00
3800.00
4000.00
Minutes
1.00 2.00 3.00 4.00 5.00 6.00 7.00 8.00 9.00 10.00 11.00 12.00 13.00 14.00
Fig. 27mm Thermal/Acidic study’s product chromatograph screening for FMASld sample 13.

434
106
SampleName: 13B
Inte
nsity
0.00
200.00
400.00
600.00
800.00
1000.00
1200.00
1400.00
1600.00
1800.00
2000.00
2200.00
2400.00
2600.00
2800.00
3000.00
3200.00
3400.00
3600.00
Minutes
1.00 2.00 3.00 4.00 5.00 6.00 7.00 8.00 9.00 10.00 11.00 12.00 13.00 14.00
Fig. 27nn Thermal/Acidic study’s product chromatograph screening for FBAL sample 13.

435
149
SampleName: 13B
Inte
nsity
200.00
300.00
400.00
500.00
600.00
700.00
800.00
900.00
1000.00
1100.00
1200.00
Minutes
1.00 2.00 3.00 4.00 5.00 6.00 7.00 8.00 9.00 10.00 11.00 12.00 13.00 14.00
Fig. 27oo Thermal/Acidic study’s product chromatograph screening for FUPA sample 13.

436
129
SampleName: 13B
Inte
nsity
0.0
1000.0
2000.0
3000.0
4000.0
5000.0
6000.0
7000.0
8000.0
9000.0
Minutes
1.00 2.00 3.00 4.00 5.00 6.00 7.00 8.00 9.00 10.00 11.00 12.00 13.00 14.00
Fig. 27pp Thermal/Acidic study’s product chromatograph screening for 5-FU sample 13.

437
14
77
SampleName: 14B
Inte
nsity
0.00
500.00
1000.00
1500.00
2000.00
2500.00
3000.00
3500.00
4000.00
4500.00
5000.00
5500.00
6000.00
6500.00
7000.00
7500.00
Minutes
1.00 2.00 3.00 4.00 5.00 6.00 7.00 8.00 9.00 10.00 11.00 12.00 13.00 14.00
Fig. 27qq Thermal/Acidic study’s product chromatograph screening for FAC sample 14.

438
105
SampleName: 14B
Inte
nsity
500.00
1000.00
1500.00
2000.00
2500.00
3000.00
3500.00
4000.00
Minutes
1.00 2.00 3.00 4.00 5.00 6.00 7.00 8.00 9.00 10.00 11.00 12.00 13.00 14.00
Fig. 27rr Thermal/Acidic study’s product chromatograph screening for FMASld sample 14.

439
106
SampleName: 14B
Inte
nsity
0.00
200.00
400.00
600.00
800.00
1000.00
1200.00
1400.00
1600.00
1800.00
2000.00
2200.00
2400.00
Minutes
1.00 2.00 3.00 4.00 5.00 6.00 7.00 8.00 9.00 10.00 11.00 12.00 13.00 14.00
Fig. 27ss Thermal/Acidic study’s product chromatograph screening for FBAL sample 14.

440
149
SampleName: 14B
Inte
nsity
200.00
300.00
400.00
500.00
600.00
700.00
800.00
900.00
1000.00
1100.00
1200.00
Minutes
1.00 2.00 3.00 4.00 5.00 6.00 7.00 8.00 9.00 10.00 11.00 12.00 13.00 14.00
Fig. 27tt Thermal/Acidic study’s product chromatograph screening for FUPA sample 14.

441
129
SampleName: 14B
Inte
nsity
0.0
1000.0
2000.0
3000.0
4000.0
5000.0
6000.0
7000.0
8000.0
9000.0
Minutes
1.00 2.00 3.00 4.00 5.00 6.00 7.00 8.00 9.00 10.00 11.00 12.00 13.00 14.00
Fig. 27uu Thermal/Acidic study’s product chromatograph screening for 5-FU sample 14.

442
15
77
SampleName: 14B
Inte
nsity
0.0
1000.0
2000.0
3000.0
4000.0
5000.0
6000.0
7000.0
8000.0
9000.0
Minutes
1.00 2.00 3.00 4.00 5.00 6.00 7.00 8.00 9.00 10.00 11.00 12.00 13.00 14.00
Fig. 27vv Thermal/Acidic study’s product chromatograph screening for FAC sample 15.

443
105
SampleName: 15B
Inte
nsity
500.00
1000.00
1500.00
2000.00
2500.00
3000.00
3500.00
4000.00
4500.00
Minutes
1.00 2.00 3.00 4.00 5.00 6.00 7.00 8.00 9.00 10.00 11.00 12.00 13.00 14.00
Fig. 27ww Thermal/Acidic study’s product chromatograph screening for FMASld sample 15.

444
106
SampleName: 15B
Inte
nsity
0.00
200.00
400.00
600.00
800.00
1000.00
1200.00
1400.00
1600.00
1800.00
2000.00
2200.00
Minutes
1.00 2.00 3.00 4.00 5.00 6.00 7.00 8.00 9.00 10.00 11.00 12.00 13.00 14.00
Fig. 27xx Thermal/Acidic study’s product chromatograph screening for FBAL sample 15.

445
149
SampleName: 15B
Inte
nsity
200.00
300.00
400.00
500.00
600.00
700.00
800.00
900.00
1000.00
Minutes
1.00 2.00 3.00 4.00 5.00 6.00 7.00 8.00 9.00 10.00 11.00 12.00 13.00 14.00
Fig. 27yy Thermal/Acidic study’s product chromatograph screening for FUPA sample 15.

446
129
SampleName: 15B
Inte
nsity
0.0
1000.0
2000.0
3000.0
4000.0
5000.0
6000.0
7000.0
8000.0
9000.0
10000.0
Minutes
1.00 2.00 3.00 4.00 5.00 6.00 7.00 8.00 9.00 10.00 11.00 12.00 13.00 14.00
Fig. 27zz Thermal/Acidic study’s product chromatograph screening for 5-FU sample 15.

447
16
77
SampleName: 16B
Inte
nsity
0.00
500.00
1000.00
1500.00
2000.00
2500.00
3000.00
3500.00
4000.00
4500.00
5000.00
5500.00
6000.00
6500.00
7000.00
Minutes
1.00 2.00 3.00 4.00 5.00 6.00 7.00 8.00 9.00 10.00 11.00 12.00 13.00 14.00
Fig. 27aaa Thermal/Acidic study’s product chromatograph screening for FAC sample 16.

448
105
SampleName: 16B
Inte
nsity
200.00
400.00
600.00
800.00
1000.00
1200.00
1400.00
1600.00
1800.00
2000.00
2200.00
2400.00
2600.00
2800.00
3000.00
3200.00
3400.00
3600.00
Minutes
1.00 2.00 3.00 4.00 5.00 6.00 7.00 8.00 9.00 10.00 11.00 12.00 13.00 14.00
Fig. 27bbb Thermal/Acidic study’s product chromatograph screening for FMASld sample 16.

449
106
SampleName: 16B
Inte
nsity
0.00
200.00
400.00
600.00
800.00
1000.00
1200.00
1400.00
1600.00
1800.00
2000.00
2200.00
2400.00
Minutes
1.00 2.00 3.00 4.00 5.00 6.00 7.00 8.00 9.00 10.00 11.00 12.00 13.00 14.00
Fig. 27ccc Thermal/Acidic study’s product chromatograph screening for FBAL sample 16.

450
149
SampleName: 16B
Inte
nsity
200.00
300.00
400.00
500.00
600.00
700.00
800.00
900.00
1000.00
1100.00
1200.00
1300.00
Minutes
1.00 2.00 3.00 4.00 5.00 6.00 7.00 8.00 9.00 10.00 11.00 12.00 13.00 14.00
Fig. 27ddd Thermal/Acidic study’s product chromatograph screening for FUPA sample 16.

451
129
SampleName: 16B
Inte
nsity
0.0
1000.0
2000.0
3000.0
4000.0
5000.0
6000.0
7000.0
8000.0
9000.0
Minutes
1.00 2.00 3.00 4.00 5.00 6.00 7.00 8.00 9.00 10.00 11.00 12.00 13.00 14.00
Fig. 27eee Thermal/Acidic study’s product chromatograph screening for 5-FU sample 16.

452
17
77
SampleName: 17B
Inte
nsity
0.00
500.00
1000.00
1500.00
2000.00
2500.00
3000.00
3500.00
4000.00
4500.00
5000.00
5500.00
6000.00
6500.00
7000.00
Minutes
1.00 2.00 3.00 4.00 5.00 6.00 7.00 8.00 9.00 10.00 11.00 12.00 13.00 14.00
Fig. 27fff Thermal/Acidic study’s product chromatograph screening for FAC sample 17.

453
105
SampleName: 17B
Inte
nsity
200.00
400.00
600.00
800.00
1000.00
1200.00
1400.00
1600.00
1800.00
2000.00
2200.00
2400.00
2600.00
2800.00
3000.00
3200.00
3400.00
3600.00
3800.00
Minutes
1.00 2.00 3.00 4.00 5.00 6.00 7.00 8.00 9.00 10.00 11.00 12.00 13.00 14.00
Fig. 27ggg Thermal/Acidic study’s product chromatograph screening for FMASld sample 17.

454
106
SampleName: 17B
Inte
nsity
0.00
200.00
400.00
600.00
800.00
1000.00
1200.00
1400.00
1600.00
1800.00
Minutes
1.00 2.00 3.00 4.00 5.00 6.00 7.00 8.00 9.00 10.00 11.00 12.00 13.00 14.00
Fig. 27hhh Thermal/Acidic study’s product chromatograph screening for FBAL sample 17.

455
149
SampleName: 17B
Inte
nsity
200.00
300.00
400.00
500.00
600.00
700.00
800.00
900.00
1000.00
Minutes
1.00 2.00 3.00 4.00 5.00 6.00 7.00 8.00 9.00 10.00 11.00 12.00 13.00 14.00
Fig. 27iii Thermal/Acidic study’s product chromatograph screening for FUPA sample 17.

456
129
SampleName: 17B
Inte
nsity
0.0
1000.0
2000.0
3000.0
4000.0
5000.0
6000.0
7000.0
8000.0
9000.0
Minutes
1.00 2.00 3.00 4.00 5.00 6.00 7.00 8.00 9.00 10.00 11.00 12.00 13.00 14.00
Fig. 27jjj Thermal/Acidic study’s product chromatograph screening for 5-FU sample 17.

457
18
77
SampleName: 18B
Inte
nsity
0.00
500.00
1000.00
1500.00
2000.00
2500.00
3000.00
3500.00
4000.00
4500.00
5000.00
5500.00
6000.00
Minutes
1.00 2.00 3.00 4.00 5.00 6.00 7.00 8.00 9.00 10.00 11.00 12.00 13.00 14.00
Fig. 27iii Thermal/Acidic study’s product chromatograph screening for FAC sample 18.

458
105
SampleName: 18B
Inte
nsity
0.00
500.00
1000.00
1500.00
2000.00
2500.00
3000.00
3500.00
4000.00
4500.00
Minutes
1.00 2.00 3.00 4.00 5.00 6.00 7.00 8.00 9.00 10.00 11.00 12.00 13.00 14.00
Fig. 27jjj Thermal/Acidic study’s product chromatograph screening for FMASld sample 18.

459
106
SampleName: 18B
Inte
nsity
0.00
200.00
400.00
600.00
800.00
1000.00
1200.00
1400.00
1600.00
1800.00
2000.00
2200.00
2400.00
2600.00
2800.00
Minutes
1.00 2.00 3.00 4.00 5.00 6.00 7.00 8.00 9.00 10.00 11.00 12.00 13.00 14.00
Fig. 27kkk Thermal/Acidic study’s product chromatograph screening for FBAL sample 18.

460
149
SampleName: 18B
Inte
nsity
200.00
300.00
400.00
500.00
600.00
700.00
800.00
900.00
1000.00
1100.00
1200.00
1300.00
1400.00
1500.00
Minutes
1.00 2.00 3.00 4.00 5.00 6.00 7.00 8.00 9.00 10.00 11.00 12.00 13.00 14.00
Fig. 27lll Thermal/Acidic study’s product chromatograph screening for FUPA sample 18.

461
129
SampleName: 18B
Inte
nsity
0.0
1000.0
2000.0
3000.0
4000.0
5000.0
6000.0
7000.0
8000.0
9000.0
Minutes
1.00 2.00 3.00 4.00 5.00 6.00 7.00 8.00 9.00 10.00 11.00 12.00 13.00 14.00
Fig. 27mmm Thermal/Acidic study’s product chromatograph screening for 5-FU sample 18.
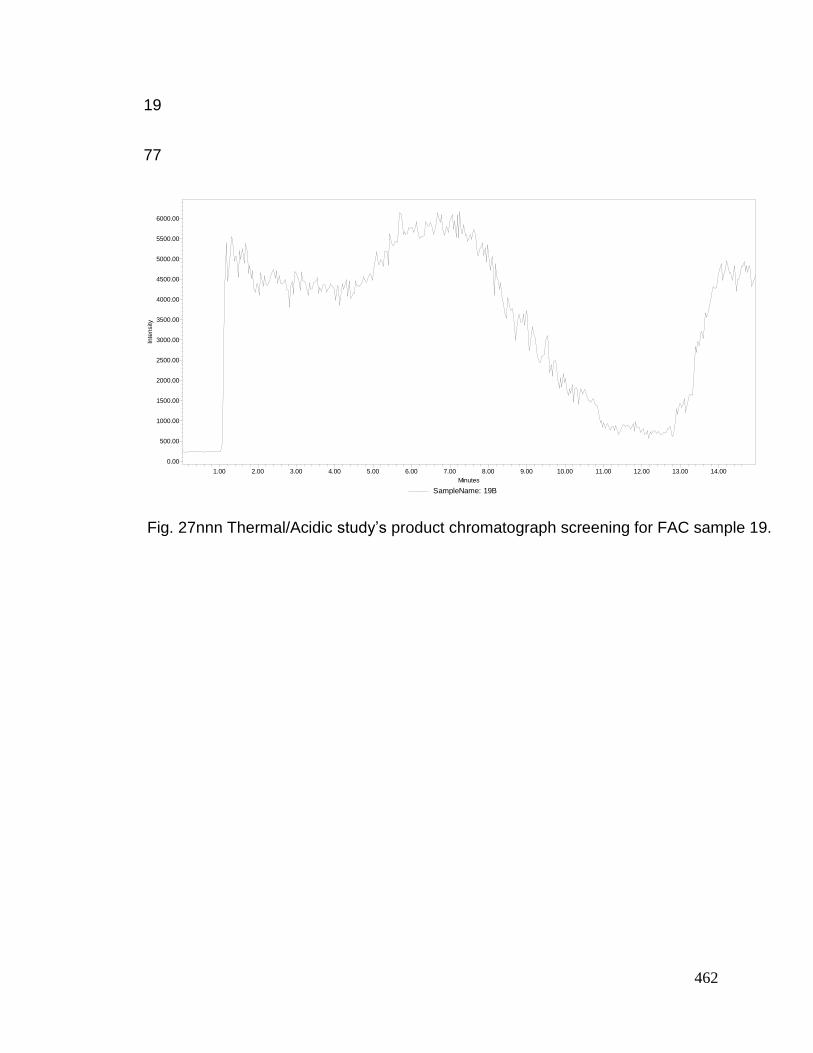
462
19
77
SampleName: 19B
Inte
nsity
0.00
500.00
1000.00
1500.00
2000.00
2500.00
3000.00
3500.00
4000.00
4500.00
5000.00
5500.00
6000.00
Minutes
1.00 2.00 3.00 4.00 5.00 6.00 7.00 8.00 9.00 10.00 11.00 12.00 13.00 14.00
Fig. 27nnn Thermal/Acidic study’s product chromatograph screening for FAC sample 19.

463
105
SampleName: 19B
Inte
nsity
500.00
1000.00
1500.00
2000.00
2500.00
3000.00
3500.00
4000.00
Minutes
1.00 2.00 3.00 4.00 5.00 6.00 7.00 8.00 9.00 10.00 11.00 12.00 13.00 14.00
Fig. 27ooo Thermal/Acidic study’s product chromatograph screening for FMASld sample 19.

464
106
SampleName: 19B
Inte
nsity
0.00
200.00
400.00
600.00
800.00
1000.00
1200.00
1400.00
1600.00
1800.00
2000.00
2200.00
2400.00
2600.00
2800.00
3000.00
3200.00
Minutes
1.00 2.00 3.00 4.00 5.00 6.00 7.00 8.00 9.00 10.00 11.00 12.00 13.00 14.00
Fig. 27ppp Thermal/Acidic study’s product chromatograph screening for FBAL sample 19.

465
149
SampleName: 19B
Inte
nsity
200.00
300.00
400.00
500.00
600.00
700.00
800.00
900.00
1000.00
1100.00
1200.00
Minutes
1.00 2.00 3.00 4.00 5.00 6.00 7.00 8.00 9.00 10.00 11.00 12.00 13.00 14.00
Fig. 27qqq Thermal/Acidic study’s product chromatograph screening for FUPA sample 19.

466
129
SampleName: 19B
Inte
nsity
0.0
1000.0
2000.0
3000.0
4000.0
5000.0
6000.0
7000.0
8000.0
9000.0
10000.0
Minutes
1.00 2.00 3.00 4.00 5.00 6.00 7.00 8.00 9.00 10.00 11.00 12.00 13.00 14.00
Fig. 27rrr Thermal/Acidic study’s product chromatograph screening for 5-FU sample 19.

467
1
77
SampleName: 1
Inte
nsity
0.0
5000.0
10000.0
15000.0
20000.0
25000.0
30000.0
35000.0
40000.0
Minutes
1.00 2.00 3.00 4.00 5.00 6.00 7.00 8.00 9.00 10.00 11.00 12.00 13.00 14.00
Fig. 28(1) product chromatograph for 5-FUr 1st replicate/screen for FAC.

468
105
SampleName: 1
Inte
nsity
0.0
2000.0
4000.0
6000.0
8000.0
10000.0
12000.0
14000.0
16000.0
18000.0
20000.0
22000.0
Minutes
1.00 2.00 3.00 4.00 5.00 6.00 7.00 8.00 9.00 10.00 11.00 12.00 13.00 14.00
Fig. 28(2) product chromatograph for 5-FUr 1st replicate/screen for FMASld.

469
106
SampleName: 1
Inte
nsity
0.00
500.00
1000.00
1500.00
2000.00
2500.00
3000.00
3500.00
4000.00
4500.00
5000.00
Minutes
1.00 2.00 3.00 4.00 5.00 6.00 7.00 8.00 9.00 10.00 11.00 12.00 13.00 14.00
Fig. 28(3) product chromatograph for 5-FUr 1st replicate/screen for FBAL.

470
149
SampleName: 1
Inte
nsity
200.00
400.00
600.00
800.00
1000.00
1200.00
1400.00
1600.00
1800.00
2000.00
Minutes
1.00 2.00 3.00 4.00 5.00 6.00 7.00 8.00 9.00 10.00 11.00 12.00 13.00 14.00
Fig. 28(4) product chromatograph for 5-FUr 1st replicate/screen for FUPA.

471
129
SampleName: 1
Inte
nsity
180.00
190.00
200.00
210.00
220.00
230.00
240.00
250.00
Minutes
1.00 2.00 3.00 4.00 5.00 6.00 7.00 8.00 9.00 10.00 11.00 12.00 13.00 14.00
Fig. 28(5) product chromatograph for 5-FUr 1st replicate/screen for 5-FU.

472
1A
77
SampleName: 1A
Inte
nsity
0.0
5000.0
10000.0
15000.0
20000.0
25000.0
30000.0
Minutes
1.00 2.00 3.00 4.00 5.00 6.00 7.00 8.00 9.00 10.00 11.00 12.00 13.00 14.00
Fig. 28(6) product chromatograph for ts0 1st replicate/screen for FAC.

473
105
SampleName: 1A
Inte
nsity
200.00
400.00
600.00
800.00
1000.00
1200.00
1400.00
1600.00
1800.00
Minutes
1.00 2.00 3.00 4.00 5.00 6.00 7.00 8.00 9.00 10.00 11.00 12.00 13.00 14.00
Fig. 28(7) product chromatograph for ts0 1st replicate/screen for FMASld.

474
106
SampleName: 1A
Inte
nsity
0.00
500.00
1000.00
1500.00
2000.00
2500.00
3000.00
3500.00
4000.00
4500.00
Minutes
1.00 2.00 3.00 4.00 5.00 6.00 7.00 8.00 9.00 10.00 11.00 12.00 13.00 14.00
Fig. 28(8) product chromatograph for ts0 1st replicate/screen for FBAL.

475
149
SampleName: 1A
Inte
nsity
200.00
400.00
600.00
800.00
1000.00
1200.00
1400.00
1600.00
1800.00
2000.00
Minutes
1.00 2.00 3.00 4.00 5.00 6.00 7.00 8.00 9.00 10.00 11.00 12.00 13.00 14.00
Fig. 28(9) product chromatograph for ts0 1st replicate/screen for FUPA.

476
129
SampleName: 1A
Inte
nsity
0.0
2000.0
4000.0
6000.0
8000.0
10000.0
12000.0
Minutes
1.00 2.00 3.00 4.00 5.00 6.00 7.00 8.00 9.00 10.00 11.00 12.00 13.00 14.00
Fig. 28(10) product chromatograph for ts0 1st replicate/screen for 5-FU.

477
2
77
SampleName: 2
Inte
nsity
0.0
5000.0
10000.0
15000.0
20000.0
25000.0
Minutes
1.00 2.00 3.00 4.00 5.00 6.00 7.00 8.00 9.00 10.00 11.00 12.00 13.00 14.00
Fig. 28(11) Thermal/Saline product chromatograph screening for FAC @ .04 day 1st replicate.

478
105
SampleName: 2
Inte
nsity
0.0
2000.0
4000.0
6000.0
8000.0
10000.0
12000.0
14000.0
16000.0
18000.0
20000.0
22000.0
Minutes
1.00 2.00 3.00 4.00 5.00 6.00 7.00 8.00 9.00 10.00 11.00 12.00 13.00 14.00
Fig. 28(12) Thermal/Saline product chromatograph screening for FMASld @ .04 day 1st replicate.

479
106
SampleName: 2
Inte
nsity
0.00
500.00
1000.00
1500.00
2000.00
2500.00
3000.00
3500.00
Minutes
1.00 2.00 3.00 4.00 5.00 6.00 7.00 8.00 9.00 10.00 11.00 12.00 13.00 14.00
Fig. 28(13) Thermal/Saline product chromatograph screening for FBAL @ .04 day 1st replicate.

480
149
SampleName: 2
Inte
nsity
200.00
400.00
600.00
800.00
1000.00
1200.00
1400.00
1600.00
1800.00
Minutes
1.00 2.00 3.00 4.00 5.00 6.00 7.00 8.00 9.00 10.00 11.00 12.00 13.00 14.00
Fig. 28(14) Thermal/Saline product chromatograph screening for FUPA @ .04 day 1st replicate.

481
129
SampleName: 2
Inte
nsity
230.00
240.00
250.00
260.00
270.00
280.00
290.00
300.00
310.00
Minutes
1.00 2.00 3.00 4.00 5.00 6.00 7.00 8.00 9.00 10.00 11.00 12.00 13.00 14.00
Fig. 28(15) Thermal/Saline product chromatograph screening for 5-FU @ .04 day 1st replicate.

482
3
77
SampleName: 3
Inte
nsity
0.0
2000.0
4000.0
6000.0
8000.0
10000.0
12000.0
14000.0
16000.0
18000.0
20000.0
22000.0
24000.0
Minutes
1.00 2.00 3.00 4.00 5.00 6.00 7.00 8.00 9.00 10.00 11.00 12.00 13.00 14.00
Fig. 28(16)Thermal/Saline product chromatograph screening for FAC @ .04 day 2nd replicate.

483
105
SampleName: 3
Inte
nsity
0.0
2000.0
4000.0
6000.0
8000.0
10000.0
12000.0
14000.0
16000.0
18000.0
20000.0
22000.0
Minutes
1.00 2.00 3.00 4.00 5.00 6.00 7.00 8.00 9.00 10.00 11.00 12.00 13.00 14.00
Fig. 28(17)Thermal/Saline product chromatograph screening for FMASld @ .04 day 2nd replicate.

484
106
SampleName: 3
Inte
nsity
0.0
1000.0
2000.0
3000.0
4000.0
5000.0
6000.0
Minutes
1.00 2.00 3.00 4.00 5.00 6.00 7.00 8.00 9.00 10.00 11.00 12.00 13.00 14.00
Fig. 28(18)Thermal/Saline product chromatograph screening for FBAL @ .04 day 2nd replicate.

485
149
SampleName: 3
Inte
nsity
200.00
400.00
600.00
800.00
1000.00
1200.00
1400.00
1600.00
1800.00
2000.00
Minutes
1.00 2.00 3.00 4.00 5.00 6.00 7.00 8.00 9.00 10.00 11.00 12.00 13.00 14.00
Fig. 28(19)Thermal/Saline product chromatograph screening for FUPA @ .04 day 2nd replicate.

486
129
SampleName: 3
Inte
nsity
240.00
250.00
260.00
270.00
280.00
290.00
300.00
310.00
Minutes
1.00 2.00 3.00 4.00 5.00 6.00 7.00 8.00 9.00 10.00 11.00 12.00 13.00 14.00
Fig. 28(20)Thermal/Saline product chromatograph screening for 5-FU @ .04 day 2nd replicate.

487
4
77
SampleName: 4
Inte
nsity
0.0
2000.0
4000.0
6000.0
8000.0
10000.0
12000.0
14000.0
16000.0
18000.0
20000.0
22000.0
Minutes
1.00 2.00 3.00 4.00 5.00 6.00 7.00 8.00 9.00 10.00 11.00 12.00 13.00 14.00
Fig. 28(21)Thermal/Saline product chromatograph screening for FAC @ .04 day 3rd replicate.

488
105
SampleName: 4
Inte
nsity
0.0
2000.0
4000.0
6000.0
8000.0
10000.0
12000.0
14000.0
16000.0
18000.0
20000.0
22000.0
Minutes
1.00 2.00 3.00 4.00 5.00 6.00 7.00 8.00 9.00 10.00 11.00 12.00 13.00 14.00
Fig. 28(22)Thermal/Saline product chromatograph screening for FMASld @ .04 day 3rd replicate.

489
106
SampleName: 4
Inte
nsity
0.00
500.00
1000.00
1500.00
2000.00
2500.00
3000.00
3500.00
4000.00
4500.00
Minutes
1.00 2.00 3.00 4.00 5.00 6.00 7.00 8.00 9.00 10.00 11.00 12.00 13.00 14.00
Fig. 28(23)Thermal/Saline product chromatograph screening for FBAL @ .04 day 3rd replicate.

490
149
SampleName: 4
Inte
nsity
200.00
400.00
600.00
800.00
1000.00
1200.00
1400.00
1600.00
1800.00
Minutes
1.00 2.00 3.00 4.00 5.00 6.00 7.00 8.00 9.00 10.00 11.00 12.00 13.00 14.00
Fig. 28(24)Thermal/Saline product chromatograph screening for FUPA @ .04 day 3rd replicate.
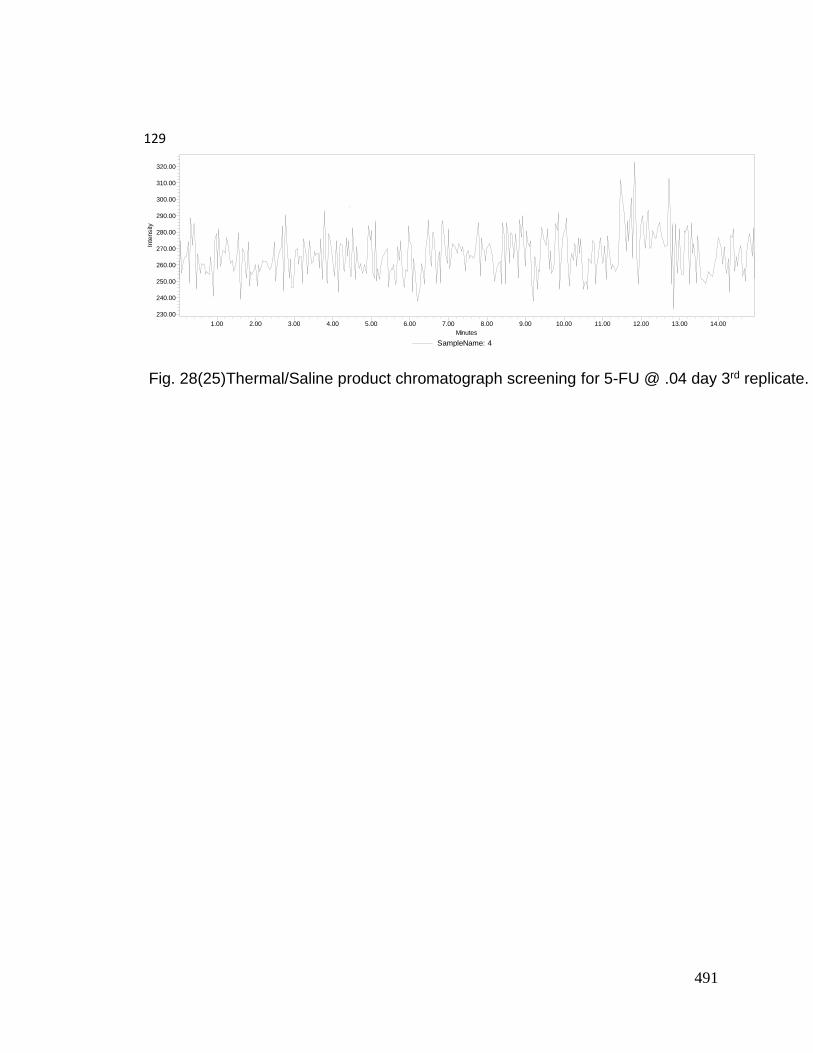
491
129
SampleName: 4
Inte
nsity
230.00
240.00
250.00
260.00
270.00
280.00
290.00
300.00
310.00
320.00
Minutes
1.00 2.00 3.00 4.00 5.00 6.00 7.00 8.00 9.00 10.00 11.00 12.00 13.00 14.00
Fig. 28(25)Thermal/Saline product chromatograph screening for 5-FU @ .04 day 3rd replicate.

492
5
77
SampleName: 5
Inte
nsity
0.0
2000.0
4000.0
6000.0
8000.0
10000.0
12000.0
14000.0
16000.0
18000.0
20000.0
Minutes
1.00 2.00 3.00 4.00 5.00 6.00 7.00 8.00 9.00 10.00 11.00 12.00 13.00 14.00
Fig. 28(26)Thermal/Saline product chromatograph screening for FAC @ .08 day 1st replicate.

493
105
SampleName: 5
Inte
nsity
0.0
2000.0
4000.0
6000.0
8000.0
10000.0
12000.0
14000.0
16000.0
18000.0
20000.0
22000.0
Minutes
1.00 2.00 3.00 4.00 5.00 6.00 7.00 8.00 9.00 10.00 11.00 12.00 13.00 14.00
Fig. 28(27)Thermal/Saline product chromatograph screening for FMASld @ .08 day 1st replicate.

494
106
SampleName: 5
Inte
nsity
0.00
500.00
1000.00
1500.00
2000.00
2500.00
3000.00
Minutes
1.00 2.00 3.00 4.00 5.00 6.00 7.00 8.00 9.00 10.00 11.00 12.00 13.00 14.00
Fig. 28(28)Thermal/Saline product chromatograph screening for FBAL @ .08 day 1st replicate.

495
149
SampleName: 5
Inte
nsity
200.00
400.00
600.00
800.00
1000.00
1200.00
1400.00
1600.00
1800.00
Minutes
1.00 2.00 3.00 4.00 5.00 6.00 7.00 8.00 9.00 10.00 11.00 12.00 13.00 14.00
Fig. 28(29)Thermal/Saline product chromatograph screening for FUPA @ .08 day 1st replicate.

496
129
SampleName: 5
Inte
nsity
170.00
180.00
190.00
200.00
210.00
220.00
230.00
240.00
250.00
Minutes
1.00 2.00 3.00 4.00 5.00 6.00 7.00 8.00 9.00 10.00 11.00 12.00 13.00 14.00
Fig. 28(30)Thermal/Saline product chromatograph screening for 5-FU @ .08 day 1st replicate.

497
6
77
SampleName: 6
Inte
nsity
0.0
2000.0
4000.0
6000.0
8000.0
10000.0
12000.0
14000.0
16000.0
18000.0
Minutes
1.00 2.00 3.00 4.00 5.00 6.00 7.00 8.00 9.00 10.00 11.00 12.00 13.00 14.00
Fig. 28(31)Thermal/Saline product chromatograph screening for FAC @ .08 day 2nd replicate.

498
105
SampleName: 6
Inte
nsity
0.0
5000.0
10000.0
15000.0
20000.0
Minutes
1.00 2.00 3.00 4.00 5.00 6.00 7.00 8.00 9.00 10.00 11.00 12.00 13.00 14.00
Fig. 28(32)Thermal/Saline product chromatograph screening for FMASld @ .08 day 2nd
replicate.

499
106
SampleName: 6
Inte
nsity
0.00
500.00
1000.00
1500.00
2000.00
2500.00
3000.00
3500.00
4000.00
4500.00
Minutes
1.00 2.00 3.00 4.00 5.00 6.00 7.00 8.00 9.00 10.00 11.00 12.00 13.00 14.00
Fig. 28(33)Thermal/Saline product chromatograph screening for FBAL @ .08 day 2nd replicate.

500
149
SampleName: 6
Inte
nsity
200.00
400.00
600.00
800.00
1000.00
1200.00
1400.00
1600.00
1800.00
Minutes
1.00 2.00 3.00 4.00 5.00 6.00 7.00 8.00 9.00 10.00 11.00 12.00 13.00 14.00
Fig. 28(34)Thermal/Saline product chromatograph screening for FUPA @ .08 day 2nd replicate.

501
129
SampleName: 6
Inte
nsity
230.00
240.00
250.00
260.00
270.00
280.00
290.00
300.00
310.00
Minutes
1.00 2.00 3.00 4.00 5.00 6.00 7.00 8.00 9.00 10.00 11.00 12.00 13.00 14.00
Fig. 28(35)Thermal/Saline product chromatograph screening for 5-FU @ .08 day 2nd replicate.

502
7
77
SampleName: 7
Inte
nsity
0.0
2000.0
4000.0
6000.0
8000.0
10000.0
12000.0
14000.0
16000.0
18000.0
Minutes
1.00 2.00 3.00 4.00 5.00 6.00 7.00 8.00 9.00 10.00 11.00 12.00 13.00 14.00
Fig. 28(36)Thermal/Saline product chromatograph screening for FAC @ .08 day 3rd replicate.

503
105
SampleName: 7
Inte
nsity
0.0
5000.0
10000.0
15000.0
20000.0
Minutes
1.00 2.00 3.00 4.00 5.00 6.00 7.00 8.00 9.00 10.00 11.00 12.00 13.00 14.00
Fig. 28(37)Thermal/Saline product chromatograph screening for FMASld @ .08 day 3rd replicate.

504
106
SampleName: 7
Inte
nsity
0.0
1000.0
2000.0
3000.0
4000.0
Minutes
1.00 2.00 3.00 4.00 5.00 6.00 7.00 8.00 9.00 10.00 11.00 12.00 13.00 14.00
Fig. 28(38)Thermal/Saline product chromatograph screening for FBAL @ .08 day 3rd replicate.

505
149
SampleName: 7
Inte
nsity
200.00
400.00
600.00
800.00
1000.00
1200.00
1400.00
1600.00
1800.00
2000.00
Minutes
1.00 2.00 3.00 4.00 5.00 6.00 7.00 8.00 9.00 10.00 11.00 12.00 13.00 14.00
Fig. 28(39)Thermal/Saline product chromatograph screening for FUPA @ .08 day 3rd replicate.
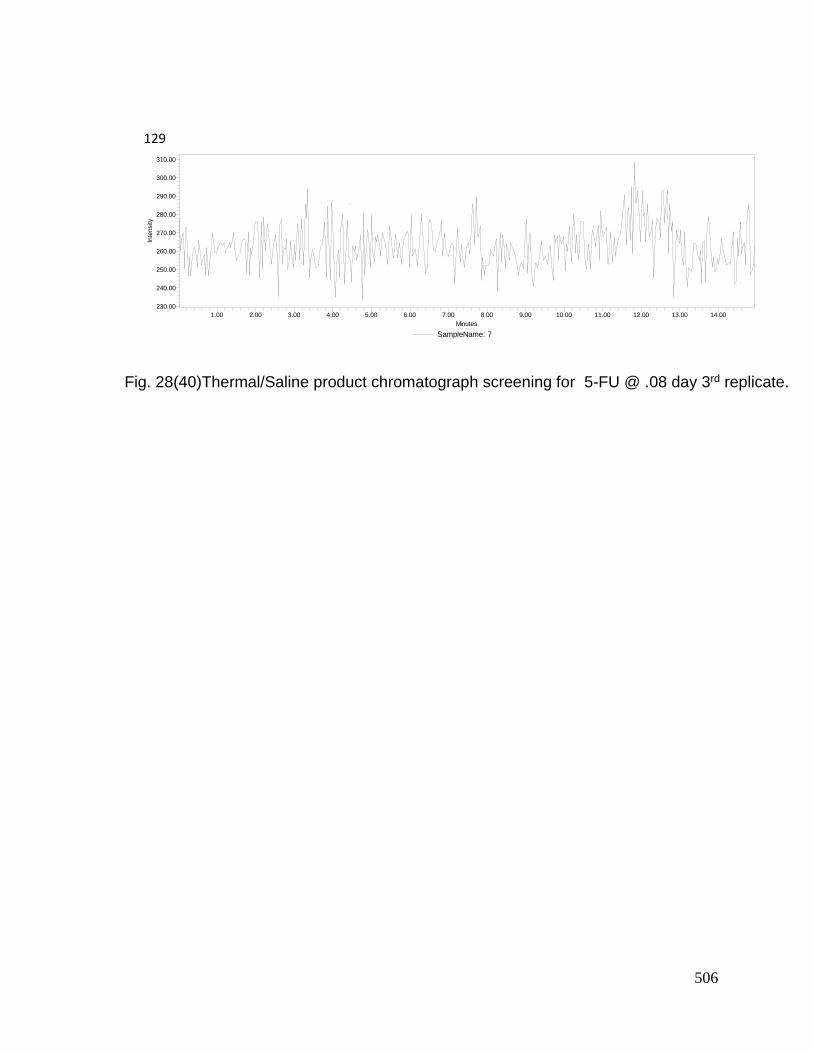
506
129
SampleName: 7
Inte
nsity
230.00
240.00
250.00
260.00
270.00
280.00
290.00
300.00
310.00
Minutes
1.00 2.00 3.00 4.00 5.00 6.00 7.00 8.00 9.00 10.00 11.00 12.00 13.00 14.00
Fig. 28(40)Thermal/Saline product chromatograph screening for 5-FU @ .08 day 3rd replicate.

507
8
77
SampleName: 8
Inte
nsity
0.0
2000.0
4000.0
6000.0
8000.0
10000.0
12000.0
14000.0
16000.0
18000.0
Minutes
1.00 2.00 3.00 4.00 5.00 6.00 7.00 8.00 9.00 10.00 11.00 12.00 13.00 14.00
Fig. 28(41)Thermal/Saline product chromatograph screening for FAC @ .13 day 1st replicate.

508
105
SampleName: 8
Inte
nsity
0.0
5000.0
10000.0
15000.0
20000.0
Minutes
1.00 2.00 3.00 4.00 5.00 6.00 7.00 8.00 9.00 10.00 11.00 12.00 13.00 14.00
Fig. 28(42)Thermal/Saline product chromatograph screening for FMASld @ .13 day 1st replicate.

509
106
SampleName: 8
Inte
nsity
0.0
1000.0
2000.0
3000.0
4000.0
Minutes
1.00 2.00 3.00 4.00 5.00 6.00 7.00 8.00 9.00 10.00 11.00 12.00 13.00 14.00
Fig. 28(43)Thermal/Saline product chromatograph screening for FBAL @ .13 day 1st replicate.

510
149
SampleName: 8
Inte
nsity
200.00
400.00
600.00
800.00
1000.00
1200.00
1400.00
1600.00
1800.00
Minutes
1.00 2.00 3.00 4.00 5.00 6.00 7.00 8.00 9.00 10.00 11.00 12.00 13.00 14.00
Fig. 28(44)Thermal/Saline product chromatograph screening for FUPA @ .13 day 1st replicate.

511
129
SampleName: 8
Inte
nsity
240.00
260.00
280.00
300.00
Minutes
1.00 2.00 3.00 4.00 5.00 6.00 7.00 8.00 9.00 10.00 11.00 12.00 13.00 14.00
Fig. 28(45)Thermal/Saline product chromatograph screening for 5-FU @ .13 day 1st replicate.

512
9
77
SampleName: 9
Inte
nsity
0.0
2000.0
4000.0
6000.0
8000.0
10000.0
12000.0
14000.0
16000.0
18000.0
Minutes
1.00 2.00 3.00 4.00 5.00 6.00 7.00 8.00 9.00 10.00 11.00 12.00 13.00 14.00
Fig. 28(46)Thermal/Saline product chromatograph screening for FAC @ .13 day 2nd replicate.

513
105
SampleName: 9
Inte
nsity
0.0
5000.0
10000.0
15000.0
20000.0
Minutes
1.00 2.00 3.00 4.00 5.00 6.00 7.00 8.00 9.00 10.00 11.00 12.00 13.00 14.00
Fig. 28(47)Thermal/Saline product chromatograph screening for FMASld @ .13 day 2nd replicate.

514
106
SampleName: 9
Inte
nsity
0.00
500.00
1000.00
1500.00
2000.00
2500.00
3000.00
3500.00
4000.00
Minutes
1.00 2.00 3.00 4.00 5.00 6.00 7.00 8.00 9.00 10.00 11.00 12.00 13.00 14.00
Fig. 28(48)Thermal/Saline product chromatograph screening for FBAL @ .13 day 2nd replicate.

515
149
SampleName: 9
Inte
nsity
200.00
400.00
600.00
800.00
1000.00
1200.00
1400.00
1600.00
1800.00
2000.00
Minutes
1.00 2.00 3.00 4.00 5.00 6.00 7.00 8.00 9.00 10.00 11.00 12.00 13.00 14.00
Fig. 28(49)Thermal/Saline product chromatograph screening for FUPA @ .13 day 2nd replicate.

516
129
SampleName: 9
Inte
nsity
220.00
240.00
260.00
280.00
300.00
Minutes
1.00 2.00 3.00 4.00 5.00 6.00 7.00 8.00 9.00 10.00 11.00 12.00 13.00 14.00
Fig. 28(50)Thermal/Saline product chromatograph screening for 5-FU @ .13 day 2nd replicate.

517
10
77
SampleName: 10
Inte
nsity
0.0
2000.0
4000.0
6000.0
8000.0
10000.0
12000.0
14000.0
16000.0
Minutes
1.00 2.00 3.00 4.00 5.00 6.00 7.00 8.00 9.00 10.00 11.00 12.00 13.00 14.00
Fig. 28(51)Thermal/Saline product chromatograph screening for FAC @ .13 day 3rd replicate.

518
105
SampleName: 10
Inte
nsity
0.0
5000.0
10000.0
15000.0
20000.0
Minutes
1.00 2.00 3.00 4.00 5.00 6.00 7.00 8.00 9.00 10.00 11.00 12.00 13.00 14.00
Fig. 28(52)Thermal/Saline product chromatograph screening for FMASld @ .13 day 3rd replicate.

519
106
SampleName: 10
Inte
nsity
0.00
500.00
1000.00
1500.00
2000.00
2500.00
3000.00
3500.00
Minutes
1.00 2.00 3.00 4.00 5.00 6.00 7.00 8.00 9.00 10.00 11.00 12.00 13.00 14.00
Fig. 28(53)Thermal/Saline product chromatograph screening for FBAL @ .13 day 3rd replicate.

520
149
SampleName: 10
Inte
nsity
200.00
400.00
600.00
800.00
1000.00
1200.00
1400.00
1600.00
1800.00
2000.00
Minutes
1.00 2.00 3.00 4.00 5.00 6.00 7.00 8.00 9.00 10.00 11.00 12.00 13.00 14.00
Fig. 28(54)Thermal/Saline product chromatograph screening for FUPA @ .13 day 3rd replicate.

521
129
SampleName: 10
Inte
nsity
180.00
190.00
200.00
210.00
220.00
230.00
240.00
250.00
Minutes
1.00 2.00 3.00 4.00 5.00 6.00 7.00 8.00 9.00 10.00 11.00 12.00 13.00 14.00
Fig. 28(55)Thermal/Saline product chromatograph screening for 5-FU @ .13 day 3rd replicate.

522
11
77
SampleName: 11
Inte
nsity
0.0
2000.0
4000.0
6000.0
8000.0
10000.0
12000.0
14000.0
Minutes
1.00 2.00 3.00 4.00 5.00 6.00 7.00 8.00 9.00 10.00 11.00 12.00 13.00 14.00
Fig. 28(56)Thermal/Saline product chromatograph screening for FAC @ .17 day 1st replicate.

523
105
SampleName: 11
Inte
nsity
0.0
5000.0
10000.0
15000.0
20000.0
Minutes
1.00 2.00 3.00 4.00 5.00 6.00 7.00 8.00 9.00 10.00 11.00 12.00 13.00 14.00
Fig. 28(57)Thermal/Saline product chromatograph screening for FMASld @ .17 day 1st replicate.

524
106
SampleName: 11
Inte
nsity
0.0
1000.0
2000.0
3000.0
4000.0
Minutes
1.00 2.00 3.00 4.00 5.00 6.00 7.00 8.00 9.00 10.00 11.00 12.00 13.00 14.00
Fig. 28(58)Thermal/Saline product chromatograph screening for FBAL @ .17 day 1st replicate.

525
149
SampleName: 11
Inte
nsity
200.00
400.00
600.00
800.00
1000.00
1200.00
1400.00
1600.00
1800.00
Minutes
1.00 2.00 3.00 4.00 5.00 6.00 7.00 8.00 9.00 10.00 11.00 12.00 13.00 14.00
Fig. 28(59)Thermal/Saline product chromatograph screening for FUPA @ .17 day 1st replicate.

526
129
SampleName: 11
Inte
nsity
180.00
190.00
200.00
210.00
220.00
230.00
240.00
Minutes
1.00 2.00 3.00 4.00 5.00 6.00 7.00 8.00 9.00 10.00 11.00 12.00 13.00 14.00
Fig. 28(60)Thermal/Saline product chromatograph screening for 5-FU @ .17 day 1st replicate.

527
12
77
SampleName: 12
Inte
nsity
0.0
2000.0
4000.0
6000.0
8000.0
10000.0
12000.0
14000.0
Minutes
1.00 2.00 3.00 4.00 5.00 6.00 7.00 8.00 9.00 10.00 11.00 12.00 13.00 14.00
Fig. 28(61)Thermal/Saline product chromatograph screening for FAC @ .17 day 2nd replicate.

528
105
SampleName: 12
Inte
nsity
0.0
5000.0
10000.0
15000.0
20000.0
Minutes
1.00 2.00 3.00 4.00 5.00 6.00 7.00 8.00 9.00 10.00 11.00 12.00 13.00 14.00
Fig. 28(62)Thermal/Saline product chromatograph screening for FMASld @ .17 day 2nd replicate.

529
106
SampleName: 12
Inte
nsity
0.0
1000.0
2000.0
3000.0
4000.0
Minutes
1.00 2.00 3.00 4.00 5.00 6.00 7.00 8.00 9.00 10.00 11.00 12.00 13.00 14.00
Fig. 28(63)Thermal/Saline product chromatograph screening for FBAL @ .17 day 2nd replicate.

530
149
SampleName: 12
Inte
nsity
200.00
400.00
600.00
800.00
1000.00
1200.00
1400.00
1600.00
1800.00
Minutes
1.00 2.00 3.00 4.00 5.00 6.00 7.00 8.00 9.00 10.00 11.00 12.00 13.00 14.00
Fig. 28(64)Thermal/Saline product chromatograph screening for FUPA @ .17 day 2nd replicate.

531
129
SampleName: 12
Inte
nsity
170.00
180.00
190.00
200.00
210.00
220.00
230.00
Minutes
1.00 2.00 3.00 4.00 5.00 6.00 7.00 8.00 9.00 10.00 11.00 12.00 13.00 14.00
Fig. 28(65)Thermal/Saline product chromatograph screening for 5-FU @ .17 day 2nd replicate.

532
13
77
SampleName: 13
Inte
nsity
0.0
2000.0
4000.0
6000.0
8000.0
10000.0
12000.0
14000.0
Minutes
1.00 2.00 3.00 4.00 5.00 6.00 7.00 8.00 9.00 10.00 11.00 12.00 13.00 14.00
Fig. 28(66)Thermal/Saline product chromatograph screening for FAC @ .17 day 3rd replicate.

533
105
SampleName: 13
Inte
nsity
0.0
5000.0
10000.0
15000.0
20000.0
Minutes
1.00 2.00 3.00 4.00 5.00 6.00 7.00 8.00 9.00 10.00 11.00 12.00 13.00 14.00
Fig. 28(67)Thermal/Saline product chromatograph screening for FMASld @ .17 day 3rd replicate.
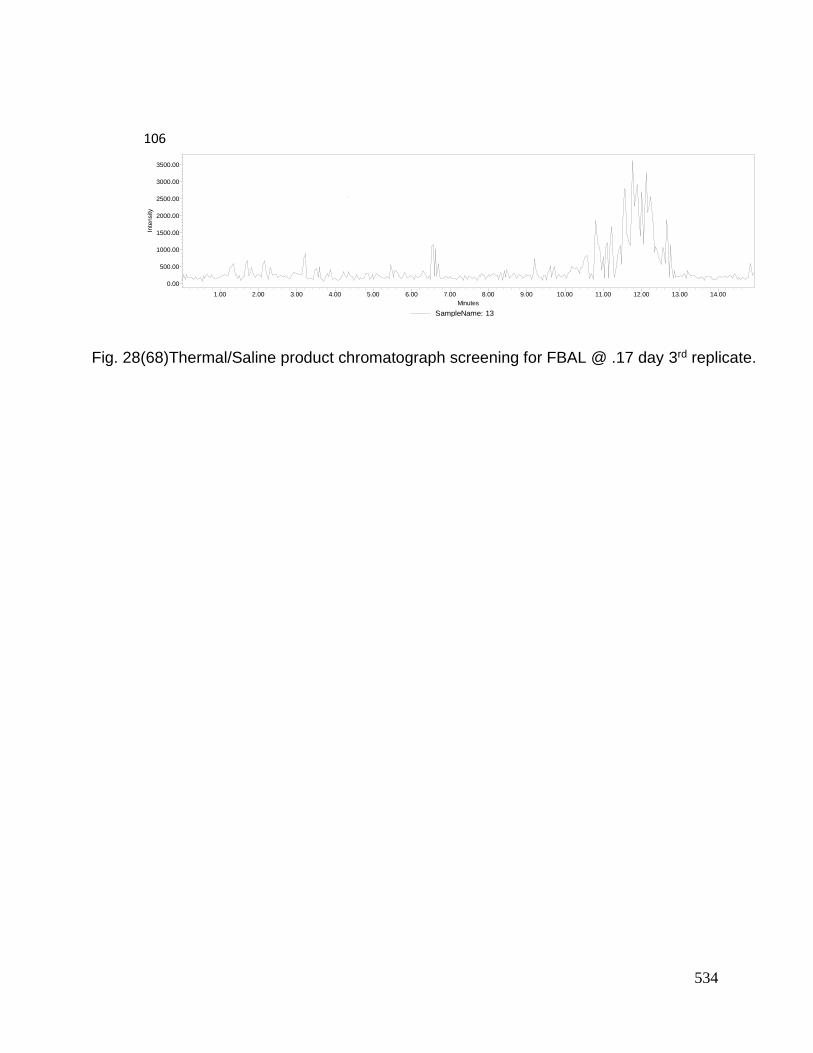
534
106
SampleName: 13
Inte
nsity
0.00
500.00
1000.00
1500.00
2000.00
2500.00
3000.00
3500.00
Minutes
1.00 2.00 3.00 4.00 5.00 6.00 7.00 8.00 9.00 10.00 11.00 12.00 13.00 14.00
Fig. 28(68)Thermal/Saline product chromatograph screening for FBAL @ .17 day 3rd replicate.

535
149
SampleName: 13
Inte
nsity
200.00
400.00
600.00
800.00
1000.00
1200.00
1400.00
1600.00
1800.00
Minutes
1.00 2.00 3.00 4.00 5.00 6.00 7.00 8.00 9.00 10.00 11.00 12.00 13.00 14.00
Fig. 28(69)Thermal/Saline product chromatograph screening for FUPA @ .17 day 3rd replicate.

536
129
SampleName: 13
Inte
nsity
180.00
200.00
220.00
240.00
Minutes
1.00 2.00 3.00 4.00 5.00 6.00 7.00 8.00 9.00 10.00 11.00 12.00 13.00 14.00
Fig. 28(70)Thermal/Saline product chromatograph screening for 5-FU @ .17 day 3rd replicate.

537
14
77
SampleName: 14
Inte
nsity
0.0
2000.0
4000.0
6000.0
8000.0
10000.0
12000.0
14000.0
Minutes
1.00 2.00 3.00 4.00 5.00 6.00 7.00 8.00 9.00 10.00 11.00 12.00 13.00 14.00
Fig. 28(71)Thermal/Saline product chromatograph screening for FAC @ .21 day 1st replicate.

538
105
SampleName: 14
Inte
nsity
0.0
5000.0
10000.0
15000.0
20000.0
Minutes
1.00 2.00 3.00 4.00 5.00 6.00 7.00 8.00 9.00 10.00 11.00 12.00 13.00 14.00
Fig. 28(72)Thermal/Saline product chromatograph screening for FMASld @ .21 day 1st replicate.

539
106
SampleName: 14
Inte
nsity
0.0
1000.0
2000.0
3000.0
4000.0
Minutes
1.00 2.00 3.00 4.00 5.00 6.00 7.00 8.00 9.00 10.00 11.00 12.00 13.00 14.00
Fig. 28(73)Thermal/Saline product chromatograph screening for FBAL @ .21 day 1st replicate.

540
149
SampleName: 14
Inte
nsity
200.00
400.00
600.00
800.00
1000.00
1200.00
1400.00
1600.00
Minutes
1.00 2.00 3.00 4.00 5.00 6.00 7.00 8.00 9.00 10.00 11.00 12.00 13.00 14.00
Fig. 28(74)Thermal/Saline product chromatograph screening for FUPA @ .21 day 1st replicate.

541
129
SampleName: 14
Inte
nsity
170.00
180.00
190.00
200.00
210.00
220.00
230.00
240.00
Minutes
1.00 2.00 3.00 4.00 5.00 6.00 7.00 8.00 9.00 10.00 11.00 12.00 13.00 14.00
Fig. 28(75)Thermal/Saline product chromatograph screening for 5-FU @ .21 day 1st replicate.

542
15
77
SampleName: 15
Inte
nsity
0.0
2000.0
4000.0
6000.0
8000.0
10000.0
12000.0
14000.0
Minutes
1.00 2.00 3.00 4.00 5.00 6.00 7.00 8.00 9.00 10.00 11.00 12.00 13.00 14.00
Fig. 28(76)Thermal/Saline product chromatograph screening for FAC @ .21 day 2nd replicate.

543
105
SampleName: 15
Inte
nsity
0.0
5000.0
10000.0
15000.0
20000.0
Minutes
1.00 2.00 3.00 4.00 5.00 6.00 7.00 8.00 9.00 10.00 11.00 12.00 13.00 14.00
Fig. 28(77)Thermal/Saline product chromatograph screening for FMASld @ .21 day 2nd replicate.

544
106
SampleName: 15
Inte
nsity
0.0
1000.0
2000.0
3000.0
4000.0
Minutes
1.00 2.00 3.00 4.00 5.00 6.00 7.00 8.00 9.00 10.00 11.00 12.00 13.00 14.00
Fig. 28(78)Thermal/Saline product chromatograph screening for FBAL @ .21 day 2nd replicate.

545
149
SampleName: 15
Inte
nsity
200.00
400.00
600.00
800.00
1000.00
1200.00
1400.00
1600.00
Minutes
1.00 2.00 3.00 4.00 5.00 6.00 7.00 8.00 9.00 10.00 11.00 12.00 13.00 14.00
Fig. 28(79)Thermal/Saline product chromatograph screening for FUPA @ .21 day 2nd replicate.

546
129
SampleName: 15
Inte
nsity
180.00
200.00
220.00
240.00
260.00
Minutes
1.00 2.00 3.00 4.00 5.00 6.00 7.00 8.00 9.00 10.00 11.00 12.00 13.00 14.00
Fig. 28(80)Thermal/Saline product chromatograph screening for 5-FU @ .21 day 2nd replicate.

547
16
77
SampleName: 16
Inte
nsity
0.0
2000.0
4000.0
6000.0
8000.0
10000.0
12000.0
14000.0
Minutes
1.00 2.00 3.00 4.00 5.00 6.00 7.00 8.00 9.00 10.00 11.00 12.00 13.00 14.00
Fig. 28(81)Thermal/Saline product chromatograph screening for FAC @ .21 day 3rd replicate.

548
105
SampleName: 16
Inte
nsity
0.0
5000.0
10000.0
15000.0
20000.0
Minutes
1.00 2.00 3.00 4.00 5.00 6.00 7.00 8.00 9.00 10.00 11.00 12.00 13.00 14.00
Fig. 28(82)Thermal/Saline product chromatograph screening for FMASld @ .21 day 3rd replicate.

549
106
SampleName: 16
Inte
nsity
0.0
1000.0
2000.0
3000.0
4000.0
Minutes
1.00 2.00 3.00 4.00 5.00 6.00 7.00 8.00 9.00 10.00 11.00 12.00 13.00 14.00
Fig. 28(83)Thermal/Saline product chromatograph screening for FBAL @ .21 day 3rd replicate.

550
149
SampleName: 16
Inte
nsity
200.00
400.00
600.00
800.00
1000.00
1200.00
1400.00
1600.00
1800.00
Minutes
1.00 2.00 3.00 4.00 5.00 6.00 7.00 8.00 9.00 10.00 11.00 12.00 13.00 14.00
Fig. 28(84)Thermal/Saline product chromatograph screening for FUPA @ .21 day 3rd replicate.

551
129
SampleName: 16
Inte
nsity
180.00
190.00
200.00
210.00
220.00
230.00
240.00
250.00
Minutes
1.00 2.00 3.00 4.00 5.00 6.00 7.00 8.00 9.00 10.00 11.00 12.00 13.00 14.00
Fig. 28(85)Thermal/Saline product chromatograph screening for 5-FU @ .21 day 3rd replicate.

552
17
77
SampleName: 17
Inte
nsity
0.0
2000.0
4000.0
6000.0
8000.0
10000.0
12000.0
Minutes
1.00 2.00 3.00 4.00 5.00 6.00 7.00 8.00 9.00 10.00 11.00 12.00 13.00 14.00
Fig. 28(86)Thermal/Saline product chromatograph screening for FAC @ .38 day 1st replicate.

553
105
SampleName: 17
Inte
nsity
0.0
5000.0
10000.0
15000.0
20000.0
Minutes
1.00 2.00 3.00 4.00 5.00 6.00 7.00 8.00 9.00 10.00 11.00 12.00 13.00 14.00
Fig. 28(87)Thermal/Saline product chromatograph screening for FMASld @ .38 day 1st replicate.

554
106
SampleName: 17
Inte
nsity
0.0
1000.0
2000.0
3000.0
4000.0
5000.0
Minutes
1.00 2.00 3.00 4.00 5.00 6.00 7.00 8.00 9.00 10.00 11.00 12.00 13.00 14.00
Fig. 28(88)Thermal/Saline product chromatograph screening for FBAL @ .38 day 1st replicate.

555
149
SampleName: 17
Inte
nsity
200.00
400.00
600.00
800.00
1000.00
1200.00
1400.00
1600.00
1800.00
Minutes
1.00 2.00 3.00 4.00 5.00 6.00 7.00 8.00 9.00 10.00 11.00 12.00 13.00 14.00
Fig. 28(89)Thermal/Saline product chromatograph screening for FUPA @ .38 day 1st replicate.

556
129
SampleName: 17
Inte
nsity
190.00
200.00
210.00
220.00
230.00
240.00
Minutes
1.00 2.00 3.00 4.00 5.00 6.00 7.00 8.00 9.00 10.00 11.00 12.00 13.00 14.00
Fig. 28(90)Thermal/Saline product chromatograph screening for 5-FU @ .38 day 1st replicate.

557
18
77
SampleName: 18
Inte
nsity
0.0
2000.0
4000.0
6000.0
8000.0
10000.0
12000.0
Minutes
1.00 2.00 3.00 4.00 5.00 6.00 7.00 8.00 9.00 10.00 11.00 12.00 13.00 14.00
Fig. 28(91)Thermal/Saline product chromatograph screening for FAC @ .38 day 2nd replicate.

558
105
SampleName: 18
Inte
nsity
0.0
5000.0
10000.0
15000.0
20000.0
Minutes
1.00 2.00 3.00 4.00 5.00 6.00 7.00 8.00 9.00 10.00 11.00 12.00 13.00 14.00
Fig. 28(92)Thermal/Saline product chromatograph screening for FMASld @ .38 day 2nd replicate.

559
106
SampleName: 18
Inte
nsity
0.0
1000.0
2000.0
3000.0
4000.0
Minutes
1.00 2.00 3.00 4.00 5.00 6.00 7.00 8.00 9.00 10.00 11.00 12.00 13.00 14.00
Fig. 28(93)Thermal/Saline product chromatograph screening for FBAL @ .38 day 2nd replicate.

560
149
SampleName: 18
Inte
nsity
500.00
1000.00
1500.00
Minutes
1.00 2.00 3.00 4.00 5.00 6.00 7.00 8.00 9.00 10.00 11.00 12.00 13.00 14.00
Fig. 28(94)Thermal/Saline product chromatograph screening for FUPA @ .38 day 2nd replicate.

561
129
SampleName: 18
Inte
nsity
190.00
200.00
210.00
220.00
230.00
240.00
250.00
Minutes
1.00 2.00 3.00 4.00 5.00 6.00 7.00 8.00 9.00 10.00 11.00 12.00 13.00 14.00
Fig. 28(95)Thermal/Saline product chromatograph screening for 5-FU @ .38 day 2nd replicate.

562
19
77
SampleName: 19
Inte
nsity
0.0
2000.0
4000.0
6000.0
8000.0
10000.0
12000.0
Minutes
1.00 2.00 3.00 4.00 5.00 6.00 7.00 8.00 9.00 10.00 11.00 12.00 13.00 14.00
Fig. 28(96)Thermal/Saline product chromatograph screening for FAC @ .38 day 3rd replicate.

563
105
SampleName: 19
Inte
nsity
0.0
5000.0
10000.0
15000.0
20000.0
Minutes
1.00 2.00 3.00 4.00 5.00 6.00 7.00 8.00 9.00 10.00 11.00 12.00 13.00 14.00
Fig. 28(97)Thermal/Saline product chromatograph screening for FMASld @ .38 day 3rd replicate.

564
106
SampleName: 19
Inte
nsity
0.0
1000.0
2000.0
3000.0
4000.0
Minutes
1.00 2.00 3.00 4.00 5.00 6.00 7.00 8.00 9.00 10.00 11.00 12.00 13.00 14.00
Fig. 28(98)Thermal/Saline product chromatograph screening for FBAL @ .38 day 3rd replicate.

565
149
SampleName: 19
Inte
nsity
500.00
1000.00
1500.00
Minutes
1.00 2.00 3.00 4.00 5.00 6.00 7.00 8.00 9.00 10.00 11.00 12.00 13.00 14.00
Fig. 28(99)Thermal/Saline product chromatograph screening for FUPA @ .38 day 3rd replicate.

566
129
SampleName: 19
Inte
nsity
180.00
200.00
220.00
240.00
260.00
Minutes
1.00 2.00 3.00 4.00 5.00 6.00 7.00 8.00 9.00 10.00 11.00 12.00 13.00 14.00
Fig. 28(100)Thermal/Saline product chromatograph screening for 5-FU @ .38 day 3rd replicate.

567
1
77
105
SampleName: 1
Inte
nsity
0.0
2000.0
4000.0
6000.0
8000.0
10000.0
12000.0
14000.0
16000.0
18000.0
Minutes
1.00 2.00 3.00 4.00 5.00 6.00 7.00 8.00 9.00 10.00 11.00 12.00 13.00 14.00
Fig. 29e Photolytic/Alkaline product chromatographs for FAC/sample 1.

568
SampleName: 1
Inte
nsity
0.0
2000.0
4000.0
6000.0
8000.0
10000.0
12000.0
14000.0
16000.0
Minutes
1.00 2.00 3.00 4.00 5.00 6.00 7.00 8.00 9.00 10.00 11.00 12.00 13.00 14.00
Fig. 29f Photolytic/Alkaline product chromatographs for FMASld/sample 1.

569
106
SampleName: 1
Inte
nsity
100.00
200.00
300.00
400.00
500.00
600.00
700.00
800.00
900.00
Minutes
1.00 2.00 3.00 4.00 5.00 6.00 7.00 8.00 9.00 10.00 11.00 12.00 13.00 14.00
Fig. 29g Photolytic/Alkaline product chromatographs for FBAL/sample 1.

570
149
SampleName: 1
Inte
nsity
200.00
250.00
300.00
350.00
400.00
450.00
500.00
550.00
600.00
650.00
700.00
750.00
Minutes
1.00 2.00 3.00 4.00 5.00 6.00 7.00 8.00 9.00 10.00 11.00 12.00 13.00 14.00
Fig. 29h Photolytic/Alkaline product chromatographs for FUPA/sample 1.

571
129
SampleName: 1
Inte
nsity
0.00
500.00
1000.00
1500.00
2000.00
2500.00
3000.00
3500.00
4000.00
4500.00
5000.00
Minutes
1.00 2.00 3.00 4.00 5.00 6.00 7.00 8.00 9.00 10.00 11.00 12.00 13.00 14.00
Fig. 29i Photolytic/Alkaline product chromatographs for 5-FU/sample 1.
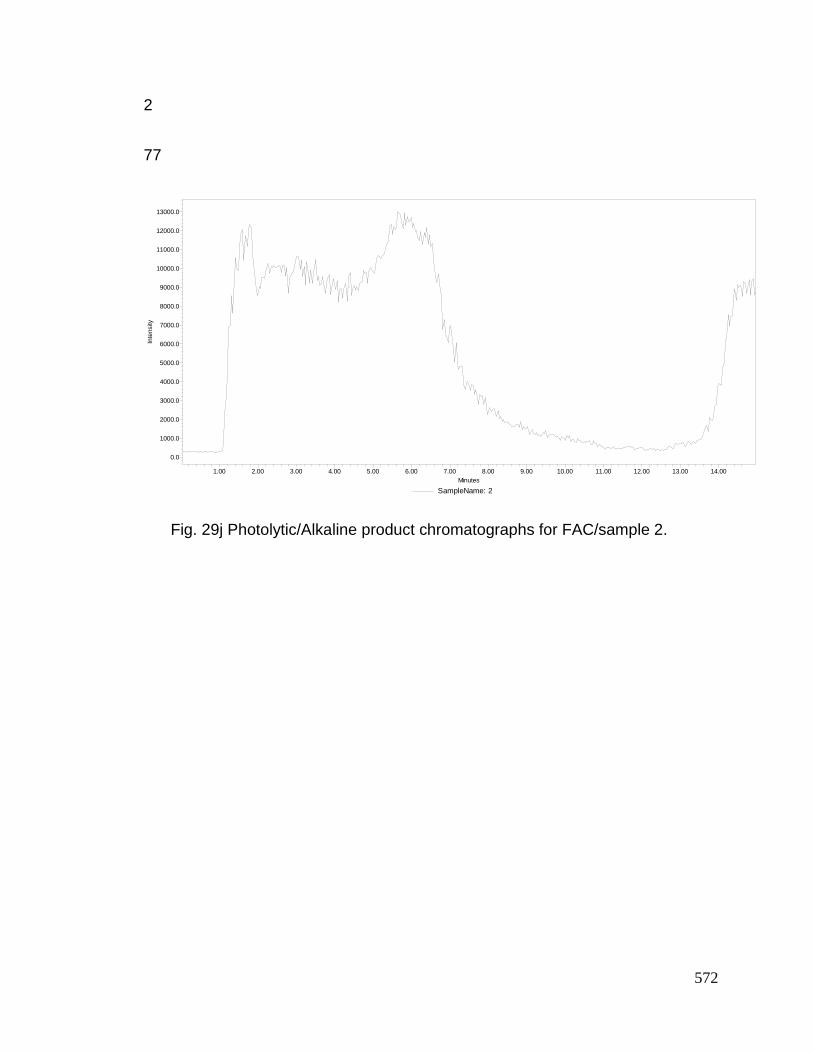
572
2
77
SampleName: 2
Inte
nsity
0.0
1000.0
2000.0
3000.0
4000.0
5000.0
6000.0
7000.0
8000.0
9000.0
10000.0
11000.0
12000.0
13000.0
Minutes
1.00 2.00 3.00 4.00 5.00 6.00 7.00 8.00 9.00 10.00 11.00 12.00 13.00 14.00
Fig. 29j Photolytic/Alkaline product chromatographs for FAC/sample 2.

573
105
SampleName: 2
Inte
nsity
0.0
1000.0
2000.0
3000.0
4000.0
5000.0
6000.0
7000.0
8000.0
Minutes
1.00 2.00 3.00 4.00 5.00 6.00 7.00 8.00 9.00 10.00 11.00 12.00 13.00 14.00
Fig. 29k Photolytic/Alkaline product chromatographs for FMASld/sample 2.

574
106
SampleName: 2
Inte
nsity
100.00
200.00
300.00
400.00
500.00
600.00
700.00
800.00
900.00
1000.00
1100.00
1200.00
1300.00
1400.00
Minutes
1.00 2.00 3.00 4.00 5.00 6.00 7.00 8.00 9.00 10.00 11.00 12.00 13.00 14.00
Fig. 29l Photolytic/Alkaline product chromatographs for FBAL/sample 2.

575
149
SampleName: 2
Inte
nsity
250.00
300.00
350.00
400.00
450.00
500.00
550.00
600.00
650.00
700.00
750.00
Minutes
1.00 2.00 3.00 4.00 5.00 6.00 7.00 8.00 9.00 10.00 11.00 12.00 13.00 14.00
Fig. 29m Photolytic/Alkaline product chromatographs for FUPA/sample 2.

576
129
SampleName: 2
Inte
nsity
0.0
1000.0
2000.0
3000.0
4000.0
5000.0
6000.0
7000.0
8000.0
Minutes
1.00 2.00 3.00 4.00 5.00 6.00 7.00 8.00 9.00 10.00 11.00 12.00 13.00 14.00
Fig. 29n Photolytic/Alkaline product chromatographs for 5-FU/sample 2.

577
3
77
SampleName: 3
Inte
nsity
0.0
1000.0
2000.0
3000.0
4000.0
5000.0
6000.0
7000.0
8000.0
9000.0
10000.0
11000.0
Minutes
1.00 2.00 3.00 4.00 5.00 6.00 7.00 8.00 9.00 10.00 11.00 12.00 13.00 14.00
Fig. 29o Photolytic/Alkaline product chromatographs for FAC/sample 3.

578
105
SampleName: 3
Inte
nsity
0.0
1000.0
2000.0
3000.0
4000.0
5000.0
6000.0
7000.0
8000.0
9000.0
10000.0
11000.0
Minutes
1.00 2.00 3.00 4.00 5.00 6.00 7.00 8.00 9.00 10.00 11.00 12.00 13.00 14.00
Fig. 29p Photolytic/Alkaline product chromatographs for FMASld/sample 3.

579
106
SampleName: 3
Inte
nsity
200.00
400.00
600.00
800.00
1000.00
1200.00
1400.00
1600.00
Minutes
1.00 2.00 3.00 4.00 5.00 6.00 7.00 8.00 9.00 10.00 11.00 12.00 13.00 14.00
Fig. 29q Photolytic/Alkaline product chromatographs for FBAL/sample 3.

580
149
SampleName: 3
Inte
nsity
250.00
300.00
350.00
400.00
450.00
500.00
550.00
600.00
650.00
700.00
750.00
800.00
Minutes
1.00 2.00 3.00 4.00 5.00 6.00 7.00 8.00 9.00 10.00 11.00 12.00 13.00 14.00
Fig. 29r Photolytic/Alkaline product chromatographs for FUPA/sample 3.
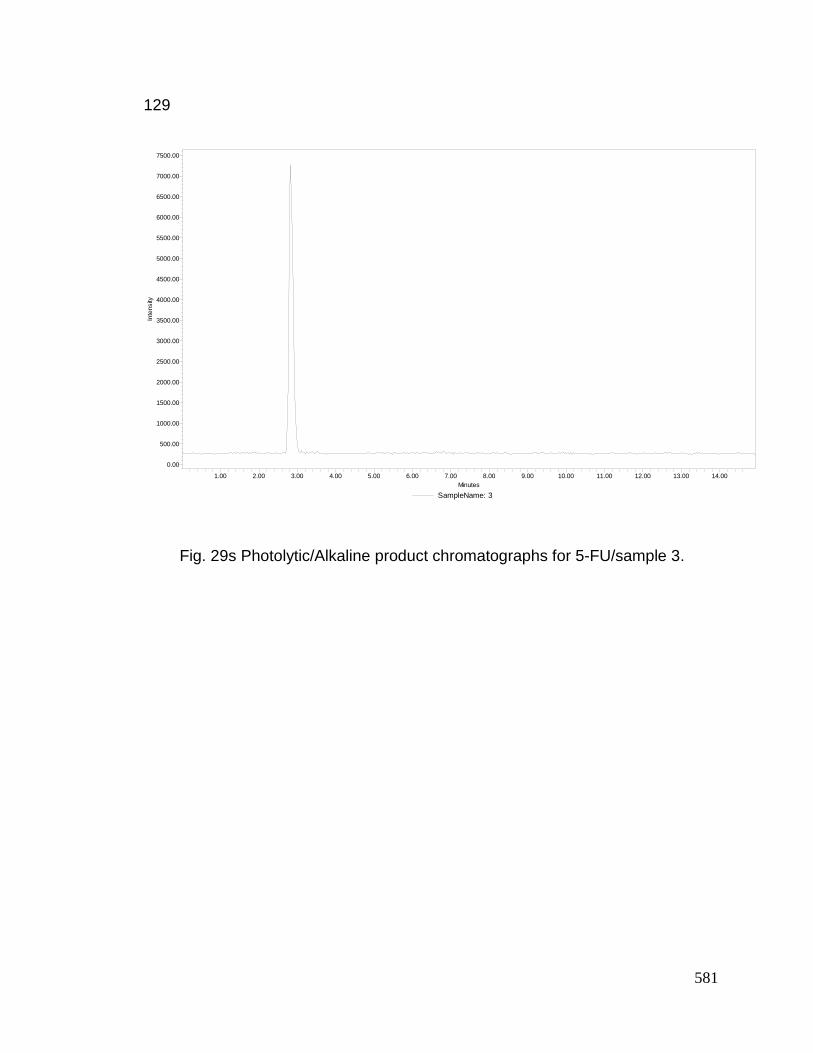
581
129
SampleName: 3
Inte
nsity
0.00
500.00
1000.00
1500.00
2000.00
2500.00
3000.00
3500.00
4000.00
4500.00
5000.00
5500.00
6000.00
6500.00
7000.00
7500.00
Minutes
1.00 2.00 3.00 4.00 5.00 6.00 7.00 8.00 9.00 10.00 11.00 12.00 13.00 14.00
Fig. 29s Photolytic/Alkaline product chromatographs for 5-FU/sample 3.

582
4
77
SampleName: 4
Inte
nsity
0.0
1000.0
2000.0
3000.0
4000.0
5000.0
6000.0
7000.0
8000.0
9000.0
10000.0
Minutes
1.00 2.00 3.00 4.00 5.00 6.00 7.00 8.00 9.00 10.00 11.00 12.00 13.00 14.00
Fig. 29t Photolytic/Alkaline product chromatograph for FAC/sample 4.

583
105
SampleName: 4
Inte
nsity
0.0
1000.0
2000.0
3000.0
4000.0
5000.0
6000.0
7000.0
8000.0
9000.0
10000.0
Minutes
1.00 2.00 3.00 4.00 5.00 6.00 7.00 8.00 9.00 10.00 11.00 12.00 13.00 14.00
Fig. 29u Photolytic/Alkaline product chromatograph for FMASld/sample 4.

584
106
SampleName: 4
Inte
nsity
100.00
200.00
300.00
400.00
500.00
600.00
700.00
800.00
900.00
1000.00
1100.00
1200.00
1300.00
1400.00
1500.00
1600.00
1700.00
Minutes
1.00 2.00 3.00 4.00 5.00 6.00 7.00 8.00 9.00 10.00 11.00 12.00 13.00 14.00
Fig. 29v Photolytic/Alkaline product chromatograph for FBAL/sample 4.

585
149
SampleName: 4
Inte
nsity
250.00
300.00
350.00
400.00
450.00
500.00
550.00
600.00
650.00
700.00
Minutes
1.00 2.00 3.00 4.00 5.00 6.00 7.00 8.00 9.00 10.00 11.00 12.00 13.00 14.00
Fig. 29w Photolytic/Alkaline product chromatograph for FUPA/sample 4.

586
129
SampleName: 4
Inte
nsity
0.00
500.00
1000.00
1500.00
2000.00
2500.00
3000.00
3500.00
4000.00
4500.00
5000.00
5500.00
6000.00
6500.00
7000.00
Minutes
1.00 2.00 3.00 4.00 5.00 6.00 7.00 8.00 9.00 10.00 11.00 12.00 13.00 14.00
Fig. 29x Photolytic/Alkaline product chromatograph for 5-FU/sample 4.

587
5
77
SampleName: 5
Inte
nsity
0.0
1000.0
2000.0
3000.0
4000.0
5000.0
6000.0
7000.0
8000.0
9000.0
Minutes
1.00 2.00 3.00 4.00 5.00 6.00 7.00 8.00 9.00 10.00 11.00 12.00 13.00 14.00
Fig. 29y Photolytic/Alkaline product chromatograph for FAC/sample 5.

588
105
SampleName: 5
Inte
nsity
0.0
1000.0
2000.0
3000.0
4000.0
5000.0
6000.0
7000.0
8000.0
9000.0
10000.0
Minutes
1.00 2.00 3.00 4.00 5.00 6.00 7.00 8.00 9.00 10.00 11.00 12.00 13.00 14.00
Fig. 29z Photolytic/Alkaline product chromatograph for FMASld/sample 5.

589
106
SampleName: 5
Inte
nsity
200.00
400.00
600.00
800.00
1000.00
1200.00
1400.00
1600.00
1800.00
2000.00
Minutes
1.00 2.00 3.00 4.00 5.00 6.00 7.00 8.00 9.00 10.00 11.00 12.00 13.00 14.00
Fig. 29aa Photolytic/Alkaline product chromatograph for FBAL/sample 5.

590
149
SampleName: 5
Inte
nsity
250.00
300.00
350.00
400.00
450.00
500.00
550.00
600.00
650.00
700.00
750.00
Minutes
1.00 2.00 3.00 4.00 5.00 6.00 7.00 8.00 9.00 10.00 11.00 12.00 13.00 14.00
Fig. 29bb Photolytic/Alkaline product chromatograph for FUPA/sample 5.

591
129
SampleName: 5
Inte
nsity
0.00
500.00
1000.00
1500.00
2000.00
2500.00
3000.00
3500.00
4000.00
4500.00
5000.00
5500.00
6000.00
6500.00
Minutes
1.00 2.00 3.00 4.00 5.00 6.00 7.00 8.00 9.00 10.00 11.00 12.00 13.00 14.00
Fig. 29cc Photolytic/Alkaline product chromatograph for 5-FU/sample 5.

592
6
77
SampleName: 6
Inte
nsity
0.00
500.00
1000.00
1500.00
2000.00
2500.00
3000.00
3500.00
4000.00
4500.00
5000.00
5500.00
6000.00
6500.00
7000.00
7500.00
8000.00
8500.00
9000.00
Minutes
1.00 2.00 3.00 4.00 5.00 6.00 7.00 8.00 9.00 10.00 11.00 12.00 13.00 14.00
Fig. 29dd Photolytic/Alkaline product chromatograph for FAC/sample 6.

593
105
SampleName: 6
Inte
nsity
0.00
500.00
1000.00
1500.00
2000.00
2500.00
3000.00
3500.00
4000.00
4500.00
5000.00
5500.00
6000.00
6500.00
7000.00
7500.00
8000.00
8500.00
Minutes
1.00 2.00 3.00 4.00 5.00 6.00 7.00 8.00 9.00 10.00 11.00 12.00 13.00 14.00
Fig. 29ee Photolytic/Alkaline product chromatograph for FMASld/sample 6.

594
106
SampleName: 6
Inte
nsity
0.00
200.00
400.00
600.00
800.00
1000.00
1200.00
1400.00
1600.00
1800.00
Minutes
1.00 2.00 3.00 4.00 5.00 6.00 7.00 8.00 9.00 10.00 11.00 12.00 13.00 14.00
Fig. 29ff Photolytic/Alkaline product chromatograph for FBAL/sample 6.

595
149
SampleName: 6
Inte
nsity
250.00
300.00
350.00
400.00
450.00
500.00
550.00
600.00
650.00
700.00
750.00
800.00
850.00
Minutes
1.00 2.00 3.00 4.00 5.00 6.00 7.00 8.00 9.00 10.00 11.00 12.00 13.00 14.00
Fig. 29gg Photolytic/Alkaline product chromatograph for FUPA/sample 6.

596
129
SampleName: 6
Inte
nsity
0.00
500.00
1000.00
1500.00
2000.00
2500.00
3000.00
3500.00
4000.00
4500.00
5000.00
5500.00
6000.00
6500.00
7000.00
Minutes
1.00 2.00 3.00 4.00 5.00 6.00 7.00 8.00 9.00 10.00 11.00 12.00 13.00 14.00
Fig. 29hh Photolytic/Alkaline product chromatograph for 5-FU/sample 6.

597
7
77
SampleName: 7
Inte
nsity
0.00
500.00
1000.00
1500.00
2000.00
2500.00
3000.00
3500.00
4000.00
4500.00
5000.00
5500.00
6000.00
6500.00
7000.00
7500.00
8000.00
8500.00
Minutes
1.00 2.00 3.00 4.00 5.00 6.00 7.00 8.00 9.00 10.00 11.00 12.00 13.00 14.00
Fig. 29ii Photolytic/Alkaline product chromatograph for FAC/sample 7.

598
105
SampleName: 7
Inte
nsity
0.0
1000.0
2000.0
3000.0
4000.0
5000.0
6000.0
7000.0
8000.0
9000.0
10000.0
Minutes
1.00 2.00 3.00 4.00 5.00 6.00 7.00 8.00 9.00 10.00 11.00 12.00 13.00 14.00
Fig. 29jj Photolytic/Alkaline product chromatograph for FMASld/sample 7.

599
106
SampleName: 7
Inte
nsity
100.00
200.00
300.00
400.00
500.00
600.00
700.00
800.00
900.00
1000.00
1100.00
1200.00
Minutes
1.00 2.00 3.00 4.00 5.00 6.00 7.00 8.00 9.00 10.00 11.00 12.00 13.00 14.00
Fig. 29kk Photolytic/Alkaline product chromatograph for FBAL/sample 7.

600
149
SampleName: 7
Inte
nsity
200.00
300.00
400.00
500.00
600.00
700.00
800.00
900.00
1000.00
1100.00
1200.00
Minutes
1.00 2.00 3.00 4.00 5.00 6.00 7.00 8.00 9.00 10.00 11.00 12.00 13.00 14.00
Fig. 29ll Photolytic/Alkaline product chromatograph for FUPA/sample 7.

601
129
SampleName: 7
Inte
nsity
0.00
500.00
1000.00
1500.00
2000.00
2500.00
3000.00
3500.00
4000.00
4500.00
5000.00
5500.00
6000.00
6500.00
7000.00
Minutes
1.00 2.00 3.00 4.00 5.00 6.00 7.00 8.00 9.00 10.00 11.00 12.00 13.00 14.00
Fig. 29mm Photolytic/Alkaline product chromatograph for 5-FU/sample 7.

602
8
77
SampleName: 8
Inte
nsity
0.00
500.00
1000.00
1500.00
2000.00
2500.00
3000.00
3500.00
4000.00
4500.00
5000.00
5500.00
6000.00
6500.00
7000.00
7500.00
8000.00
Minutes
1.00 2.00 3.00 4.00 5.00 6.00 7.00 8.00 9.00 10.00 11.00 12.00 13.00 14.00
Fig. 29nn Photolytic/Alkaline product chromatograph for FAC/sample 8.

603
105
SampleName: 8
Inte
nsity
0.0
1000.0
2000.0
3000.0
4000.0
5000.0
6000.0
7000.0
8000.0
9000.0
Minutes
1.00 2.00 3.00 4.00 5.00 6.00 7.00 8.00 9.00 10.00 11.00 12.00 13.00 14.00
Fig. 29oo Photolytic/Alkaline product chromatograph for FMASld/sample 8.

604
106
SampleName: 8
Inte
nsity
100.00
200.00
300.00
400.00
500.00
600.00
700.00
800.00
900.00
1000.00
1100.00
1200.00
1300.00
1400.00
1500.00
1600.00
1700.00
1800.00
Minutes
1.00 2.00 3.00 4.00 5.00 6.00 7.00 8.00 9.00 10.00 11.00 12.00 13.00 14.00
Fig. 29pp Photolytic/Alkaline product chromatograph for FBAL/sample 8.

605
149
SampleName: 8
Inte
nsity
200.00
300.00
400.00
500.00
600.00
700.00
800.00
900.00
1000.00
1100.00
Minutes
1.00 2.00 3.00 4.00 5.00 6.00 7.00 8.00 9.00 10.00 11.00 12.00 13.00 14.00
Fig. 29qq Photolytic/Alkaline product chromatograph for FUPA/sample 8.

606
129
SampleName: 8
Inte
nsity
0.00
500.00
1000.00
1500.00
2000.00
2500.00
3000.00
3500.00
4000.00
4500.00
5000.00
5500.00
6000.00
6500.00
7000.00
7500.00
8000.00
Minutes
1.00 2.00 3.00 4.00 5.00 6.00 7.00 8.00 9.00 10.00 11.00 12.00 13.00 14.00
Fig. 29rr Photolytic/Alkaline product chromatograph for 5-FU/sample 8.

607
9
77
SampleName: 9
Inte
nsity
0.00
500.00
1000.00
1500.00
2000.00
2500.00
3000.00
3500.00
4000.00
4500.00
5000.00
5500.00
6000.00
6500.00
7000.00
7500.00
Minutes
1.00 2.00 3.00 4.00 5.00 6.00 7.00 8.00 9.00 10.00 11.00 12.00 13.00 14.00
Fig. 29ss Photolytic/Alkaline product chromatograph for FAC/sample 9.

608
105
SampleName: 9
Inte
nsity
0.00
500.00
1000.00
1500.00
2000.00
2500.00
3000.00
3500.00
4000.00
4500.00
5000.00
5500.00
6000.00
6500.00
7000.00
7500.00
8000.00
Minutes
1.00 2.00 3.00 4.00 5.00 6.00 7.00 8.00 9.00 10.00 11.00 12.00 13.00 14.00
Fig. 29tt Photolytic/Alkaline product chromatograph for FMASld/sample 9.

609
106
SampleName: 9
Inte
nsity
100.00
200.00
300.00
400.00
500.00
600.00
700.00
800.00
900.00
1000.00
1100.00
1200.00
1300.00
1400.00
1500.00
Minutes
1.00 2.00 3.00 4.00 5.00 6.00 7.00 8.00 9.00 10.00 11.00 12.00 13.00 14.00
Fig. 29uu Photolytic/Alkaline product chromatograph for FBAL/sample 9.

610
149
SampleName: 9
Inte
nsity
200.00
300.00
400.00
500.00
600.00
700.00
800.00
900.00
1000.00
1100.00
1200.00
Minutes
1.00 2.00 3.00 4.00 5.00 6.00 7.00 8.00 9.00 10.00 11.00 12.00 13.00 14.00
Fig. 29vv Photolytic/Alkaline product chromatograph for FUPA/sample 9.

611
129
SampleName: 9
Inte
nsity
200.00
400.00
600.00
800.00
1000.00
1200.00
1400.00
1600.00
1800.00
2000.00
2200.00
2400.00
2600.00
2800.00
3000.00
3200.00
3400.00
3600.00
3800.00
4000.00
4200.00
Minutes
1.00 2.00 3.00 4.00 5.00 6.00 7.00 8.00 9.00 10.00 11.00 12.00 13.00 14.00
Fig. 29ww Photolytic/Alkaline product chromatograph for 5-FU/sample 9.

612
10
77
SampleName: 10
Inte
nsity
0.00
500.00
1000.00
1500.00
2000.00
2500.00
3000.00
3500.00
4000.00
4500.00
5000.00
5500.00
6000.00
6500.00
7000.00
7500.00
Minutes
1.00 2.00 3.00 4.00 5.00 6.00 7.00 8.00 9.00 10.00 11.00 12.00 13.00 14.00
Fig. 29xx Photolytic/Alkaline product chromatograph for FAC/sample 10.

613
105
SampleName: 10
Inte
nsity
0.00
500.00
1000.00
1500.00
2000.00
2500.00
3000.00
3500.00
4000.00
4500.00
5000.00
5500.00
6000.00
6500.00
7000.00
7500.00
8000.00
8500.00
Minutes
1.00 2.00 3.00 4.00 5.00 6.00 7.00 8.00 9.00 10.00 11.00 12.00 13.00 14.00
Fig. 29yy Photolytic/Alkaline product chromatograph for FMASld/sample 10.

614
106
SampleName: 10
Inte
nsity
0.00
100.00
200.00
300.00
400.00
500.00
600.00
700.00
800.00
900.00
1000.00
1100.00
1200.00
1300.00
1400.00
1500.00
1600.00
Minutes
1.00 2.00 3.00 4.00 5.00 6.00 7.00 8.00 9.00 10.00 11.00 12.00 13.00 14.00
Fig. 29zz Photolytic/Alkaline product chromatograph for FBAL/sample 10.

615
149
SampleName: 10
Inte
nsity
200.00
300.00
400.00
500.00
600.00
700.00
800.00
900.00
1000.00
1100.00
Minutes
1.00 2.00 3.00 4.00 5.00 6.00 7.00 8.00 9.00 10.00 11.00 12.00 13.00 14.00
Fig. 29aaa Photolytic/Alkaline product chromatograph for FUPA/sample 10.

616
129
SampleName: 10
Inte
nsity
200.00
400.00
600.00
800.00
1000.00
1200.00
1400.00
1600.00
1800.00
2000.00
2200.00
2400.00
2600.00
2800.00
3000.00
3200.00
3400.00
3600.00
3800.00
4000.00
Minutes
1.00 2.00 3.00 4.00 5.00 6.00 7.00 8.00 9.00 10.00 11.00 12.00 13.00 14.00
Fig. 29bbb Photolytic/Alkaline product chromatograph for 5-FU/sample 10.

617
11
77
SampleName: 11
Inte
nsity
0.00
500.00
1000.00
1500.00
2000.00
2500.00
3000.00
3500.00
4000.00
4500.00
5000.00
5500.00
6000.00
6500.00
7000.00
Minutes
1.00 2.00 3.00 4.00 5.00 6.00 7.00 8.00 9.00 10.00 11.00 12.00 13.00 14.00
Fig. 29ccc Photolytic/Alkaline product chromatograph for FAC/sample 11.

618
105
SampleName: 11
Inte
nsity
0.0
1000.0
2000.0
3000.0
4000.0
5000.0
6000.0
7000.0
8000.0
9000.0
Minutes
1.00 2.00 3.00 4.00 5.00 6.00 7.00 8.00 9.00 10.00 11.00 12.00 13.00 14.00
Fig. 29ddd Photolytic/Alkaline product chromatograph for FMASld/sample 11.

619
106
SampleName: 11
Inte
nsity
0.00
200.00
400.00
600.00
800.00
1000.00
1200.00
1400.00
1600.00
1800.00
2000.00
2200.00
2400.00
2600.00
2800.00
3000.00
Minutes
1.00 2.00 3.00 4.00 5.00 6.00 7.00 8.00 9.00 10.00 11.00 12.00 13.00 14.00
Fig. 29eee Photolytic/Alkaline product chromatograph for FBAL/sample 11.

620
149
SampleName: 11
Inte
nsity
200.00
250.00
300.00
350.00
400.00
450.00
500.00
550.00
600.00
650.00
700.00
750.00
800.00
850.00
900.00
950.00
Minutes
1.00 2.00 3.00 4.00 5.00 6.00 7.00 8.00 9.00 10.00 11.00 12.00 13.00 14.00
Fig. 29fff Photolytic/Alkaline product chromatograph for FUPA/sample 11.

621
129
SampleName: 11
Inte
nsity
200.00
400.00
600.00
800.00
1000.00
1200.00
1400.00
1600.00
1800.00
2000.00
2200.00
2400.00
2600.00
2800.00
3000.00
3200.00
3400.00
3600.00
3800.00
4000.00
Minutes
1.00 2.00 3.00 4.00 5.00 6.00 7.00 8.00 9.00 10.00 11.00 12.00 13.00 14.00
Fig. 29ggg Photolytic/Alkaline product chromatograph for 5-FU/sample 11.

622
12
77
SampleName: 12
Inte
nsity
0.00
500.00
1000.00
1500.00
2000.00
2500.00
3000.00
3500.00
4000.00
4500.00
5000.00
5500.00
6000.00
6500.00
Minutes
1.00 2.00 3.00 4.00 5.00 6.00 7.00 8.00 9.00 10.00 11.00 12.00 13.00 14.00
Fig. 29hhh Photolytic/Alkaline product chromatograph for FAC/sample 12.

623
105
SampleName: 12
Inte
nsity
0.0
1000.0
2000.0
3000.0
4000.0
5000.0
6000.0
7000.0
8000.0
9000.0
10000.0
Minutes
1.00 2.00 3.00 4.00 5.00 6.00 7.00 8.00 9.00 10.00 11.00 12.00 13.00 14.00
Fig. 29iii Photolytic/Alkaline product chromatograph for FMASld/sample 12.

624
106
SampleName: 12
Inte
nsity
0.00
200.00
400.00
600.00
800.00
1000.00
1200.00
1400.00
1600.00
1800.00
2000.00
Minutes
1.00 2.00 3.00 4.00 5.00 6.00 7.00 8.00 9.00 10.00 11.00 12.00 13.00 14.00
Fig. 29jjj Photolytic/Alkaline product chromatograph for FBAL/sample 12.

625
149
SampleName: 12
Inte
nsity
200.00
250.00
300.00
350.00
400.00
450.00
500.00
550.00
600.00
650.00
700.00
750.00
800.00
850.00
900.00
950.00
Minutes
1.00 2.00 3.00 4.00 5.00 6.00 7.00 8.00 9.00 10.00 11.00 12.00 13.00 14.00
Fig. 29kkk Photolytic/Alkaline product chromatograph for FUPA/sample 12.

626
129
SampleName: 12
Inte
nsity
0.00
500.00
1000.00
1500.00
2000.00
2500.00
3000.00
3500.00
4000.00
4500.00
5000.00
5500.00
6000.00
6500.00
7000.00
Minutes
1.00 2.00 3.00 4.00 5.00 6.00 7.00 8.00 9.00 10.00 11.00 12.00 13.00 14.00
Fig. 29lll Photolytic/Alkaline product chromatograph for 5-FU/sample 12.

627
13
77
SampleName: 13
Inte
nsity
0.00
500.00
1000.00
1500.00
2000.00
2500.00
3000.00
3500.00
4000.00
4500.00
5000.00
5500.00
6000.00
Minutes
1.00 2.00 3.00 4.00 5.00 6.00 7.00 8.00 9.00 10.00 11.00 12.00 13.00 14.00
Fig. 29mmm Photolytic/Alkaline product chromatograph for FAC/sample 13.

628
105
SampleName: 13
Inte
nsity
0.00
500.00
1000.00
1500.00
2000.00
2500.00
3000.00
3500.00
4000.00
4500.00
5000.00
5500.00
6000.00
6500.00
7000.00
7500.00
8000.00
8500.00
Minutes
1.00 2.00 3.00 4.00 5.00 6.00 7.00 8.00 9.00 10.00 11.00 12.00 13.00 14.00
Fig. 29nnn Photolytic/Alkaline product chromatograph for FMASld/sample 13.

629
106
SampleName: 13
Inte
nsity
0.00
100.00
200.00
300.00
400.00
500.00
600.00
700.00
800.00
900.00
1000.00
1100.00
1200.00
1300.00
1400.00
1500.00
Minutes
1.00 2.00 3.00 4.00 5.00 6.00 7.00 8.00 9.00 10.00 11.00 12.00 13.00 14.00
Fig. 29ooo Photolytic/Alkaline product chromatograph for FBAL/sample 13.

630
149
SampleName: 13
Inte
nsity
200.00
300.00
400.00
500.00
600.00
700.00
800.00
900.00
1000.00
1100.00
1200.00
Minutes
1.00 2.00 3.00 4.00 5.00 6.00 7.00 8.00 9.00 10.00 11.00 12.00 13.00 14.00
Fig. 29ppp Photolytic/Alkaline product chromatograph for FUPA/sample 13.

631
129
SampleName: 13
Inte
nsity
220.00
240.00
260.00
280.00
300.00
320.00
340.00
360.00
380.00
400.00
420.00
440.00
460.00
480.00
500.00
Minutes
1.00 2.00 3.00 4.00 5.00 6.00 7.00 8.00 9.00 10.00 11.00 12.00 13.00 14.00
Fig. 29qqq Photolytic/Alkaline product chromatograph for 5-FU/sample 13.

632
14
77
SampleName: 14
Inte
nsity
0.00
500.00
1000.00
1500.00
2000.00
2500.00
3000.00
3500.00
4000.00
4500.00
5000.00
5500.00
6000.00
Minutes
1.00 2.00 3.00 4.00 5.00 6.00 7.00 8.00 9.00 10.00 11.00 12.00 13.00 14.00
Fig. 29rrr Photolytic/Alkaline product chromatograph for FAC/sample 14.

633
105
SampleName: 14
Inte
nsity
0.00
500.00
1000.00
1500.00
2000.00
2500.00
3000.00
3500.00
4000.00
4500.00
5000.00
5500.00
6000.00
6500.00
7000.00
7500.00
8000.00
Minutes
1.00 2.00 3.00 4.00 5.00 6.00 7.00 8.00 9.00 10.00 11.00 12.00 13.00 14.00
Fig. 29sss Photolytic/Alkaline product chromatograph for FMASld/sample 14.

634
106
SampleName: 14
Inte
nsity
100.00
200.00
300.00
400.00
500.00
600.00
700.00
800.00
900.00
1000.00
1100.00
1200.00
1300.00
1400.00
1500.00
1600.00
Minutes
1.00 2.00 3.00 4.00 5.00 6.00 7.00 8.00 9.00 10.00 11.00 12.00 13.00 14.00
Fig. 29ttt Photolytic/Alkaline product chromatograph for FBAL/sample 14.

635
149
SampleName: 14
Inte
nsity
200.00
300.00
400.00
500.00
600.00
700.00
800.00
900.00
1000.00
1100.00
1200.00
Minutes
1.00 2.00 3.00 4.00 5.00 6.00 7.00 8.00 9.00 10.00 11.00 12.00 13.00 14.00
Fig. 29uuu Photolytic/Alkaline product chromatograph for FUPA/sample 14.

636
129
SampleName: 14
Inte
nsity
200.00
210.00
220.00
230.00
240.00
250.00
260.00
270.00
280.00
290.00
300.00
310.00
320.00
Minutes
1.00 2.00 3.00 4.00 5.00 6.00 7.00 8.00 9.00 10.00 11.00 12.00 13.00 14.00
Fig. 29vvv Photolytic/Alkaline product chromatograph for 5-FU/sample 14.

637
15
77
SampleName: 15
Inte
nsity
0.00
500.00
1000.00
1500.00
2000.00
2500.00
3000.00
3500.00
4000.00
4500.00
5000.00
5500.00
6000.00
Minutes
1.00 2.00 3.00 4.00 5.00 6.00 7.00 8.00 9.00 10.00 11.00 12.00 13.00 14.00
Fig. 29www Photolytic/Alkaline product chromatograph for FAC/sample 15.

638
105
SampleName: 15
Inte
nsity
0.0
1000.0
2000.0
3000.0
4000.0
5000.0
6000.0
7000.0
8000.0
9000.0
Minutes
1.00 2.00 3.00 4.00 5.00 6.00 7.00 8.00 9.00 10.00 11.00 12.00 13.00 14.00
Fig. 29xxx Photolytic/Alkaline product chromatograph for FMASld/sample 15.

639
106
SampleName: 15
Inte
nsity
0.00
200.00
400.00
600.00
800.00
1000.00
1200.00
1400.00
1600.00
1800.00
2000.00
2200.00
Minutes
1.00 2.00 3.00 4.00 5.00 6.00 7.00 8.00 9.00 10.00 11.00 12.00 13.00 14.00
Fig. 29yyy Photolytic/Alkaline product chromatograph for FBAL/sample 15.

640
149
SampleName: 15
Inte
nsity
200.00
250.00
300.00
350.00
400.00
450.00
500.00
550.00
600.00
650.00
700.00
750.00
800.00
850.00
Minutes
1.00 2.00 3.00 4.00 5.00 6.00 7.00 8.00 9.00 10.00 11.00 12.00 13.00 14.00
Fig. 29zzz Photolytic/Alkaline product chromatograph for FUPA/sample 15.

641
129
SampleName: 15
Inte
nsity
200.00
220.00
240.00
260.00
280.00
300.00
320.00
340.00
360.00
Minutes
1.00 2.00 3.00 4.00 5.00 6.00 7.00 8.00 9.00 10.00 11.00 12.00 13.00 14.00
Fig. 29aaaa Photolytic/Alkaline product chromatograph for 5-FU/sample 15.

642
16
77
SampleName: 16
Inte
nsity
0.00
500.00
1000.00
1500.00
2000.00
2500.00
3000.00
3500.00
4000.00
4500.00
5000.00
5500.00
6000.00
Minutes
1.00 2.00 3.00 4.00 5.00 6.00 7.00 8.00 9.00 10.00 11.00 12.00 13.00 14.00
Fig. 29bbbb Photolytic/Alkaline product chromatograph for FAC/sample 16.

643
105
SampleName: 16
Inte
nsity
0.0
1000.0
2000.0
3000.0
4000.0
5000.0
6000.0
7000.0
8000.0
9000.0
10000.0
Minutes
1.00 2.00 3.00 4.00 5.00 6.00 7.00 8.00 9.00 10.00 11.00 12.00 13.00 14.00
Fig. 29cccc Photolytic/Alkaline product chromatograph for FMASld/sample 16.

644
106
SampleName: 16
Inte
nsity
0.00
200.00
400.00
600.00
800.00
1000.00
1200.00
1400.00
1600.00
1800.00
Minutes
1.00 2.00 3.00 4.00 5.00 6.00 7.00 8.00 9.00 10.00 11.00 12.00 13.00 14.00
Fig. 29dddd Photolytic/Alkaline product chromatograph for FBAL/sample 16.

645
149
SampleName: 16
Inte
nsity
200.00
300.00
400.00
500.00
600.00
700.00
800.00
900.00
1000.00
1100.00
Minutes
1.00 2.00 3.00 4.00 5.00 6.00 7.00 8.00 9.00 10.00 11.00 12.00 13.00 14.00
Fig. 29eeee Photolytic/Alkaline product chromatograph for FUPA/sample 16.

646
129
SampleName: 16
Inte
nsity
0.00
500.00
1000.00
1500.00
2000.00
2500.00
3000.00
3500.00
4000.00
4500.00
5000.00
5500.00
6000.00
6500.00
7000.00
7500.00
8000.00
Minutes
1.00 2.00 3.00 4.00 5.00 6.00 7.00 8.00 9.00 10.00 11.00 12.00 13.00 14.00
Fig. 29ffff Photolytic/Alkaline product chromatograph for 5-FU/sample 16.

647
17
77
SampleName: 17
Inte
nsity
0.00
500.00
1000.00
1500.00
2000.00
2500.00
3000.00
3500.00
4000.00
4500.00
5000.00
5500.00
Minutes
1.00 2.00 3.00 4.00 5.00 6.00 7.00 8.00 9.00 10.00 11.00 12.00 13.00 14.00
Fig. 29gggg Photolytic/Alkaline product chromatograph for FAC/sample 17.

648
105
SampleName: 17
Inte
nsity
0.0
1000.0
2000.0
3000.0
4000.0
5000.0
6000.0
7000.0
8000.0
9000.0
10000.0
11000.0
Minutes
1.00 2.00 3.00 4.00 5.00 6.00 7.00 8.00 9.00 10.00 11.00 12.00 13.00 14.00
Fig. 29hhhh Photolytic/Alkaline product chromatograph for FMASld/sample 17.

649
106
SampleName: 17
Inte
nsity
0.00
200.00
400.00
600.00
800.00
1000.00
1200.00
1400.00
1600.00
1800.00
2000.00
Minutes
1.00 2.00 3.00 4.00 5.00 6.00 7.00 8.00 9.00 10.00 11.00 12.00 13.00 14.00
Fig. 29iiii Photolytic/Alkaline product chromatograph for FBAL/sample 17.

650
149
SampleName: 17
Inte
nsity
200.00
250.00
300.00
350.00
400.00
450.00
500.00
550.00
600.00
650.00
700.00
750.00
800.00
850.00
900.00
950.00
1000.00
Minutes
1.00 2.00 3.00 4.00 5.00 6.00 7.00 8.00 9.00 10.00 11.00 12.00 13.00 14.00
Fig. 29jjjj Photolytic/Alkaline product chromatograph for FUPA/sample 17.

651
129
SampleName: 17
Inte
nsity
215.00
220.00
225.00
230.00
235.00
240.00
245.00
250.00
255.00
260.00
265.00
270.00
275.00
280.00
Minutes
1.00 2.00 3.00 4.00 5.00 6.00 7.00 8.00 9.00 10.00 11.00 12.00 13.00 14.00
Fig. 29kkkk Photolytic/Alkaline product chromatograph for 5-FU/sample 17.

652
18
77
SampleName: 18
Inte
nsity
0.00
500.00
1000.00
1500.00
2000.00
2500.00
3000.00
3500.00
4000.00
4500.00
5000.00
5500.00
Minutes
1.00 2.00 3.00 4.00 5.00 6.00 7.00 8.00 9.00 10.00 11.00 12.00 13.00 14.00
Fig. 29llll Photolytic/Alkaline product chromatograph for FAC/sample 18.

653
105
SampleName: 18
Inte
nsity
0.0
1000.0
2000.0
3000.0
4000.0
5000.0
6000.0
7000.0
8000.0
9000.0
10000.0
Minutes
1.00 2.00 3.00 4.00 5.00 6.00 7.00 8.00 9.00 10.00 11.00 12.00 13.00 14.00
Fig. 29mmmm Photolytic/Alkaline product chromatograph for FMASld/sample 18.

654
106
SampleName: 18
Inte
nsity
0.00
500.00
1000.00
1500.00
2000.00
2500.00
3000.00
3500.00
4000.00
Minutes
1.00 2.00 3.00 4.00 5.00 6.00 7.00 8.00 9.00 10.00 11.00 12.00 13.00 14.00
Fig. 29nnnn Photolytic/Alkaline product chromatograph for FBAL/sample 18.

655
149
SampleName: 18
Inte
nsity
200.00
300.00
400.00
500.00
600.00
700.00
800.00
900.00
1000.00
1100.00
1200.00
1300.00
1400.00
1500.00
Minutes
1.00 2.00 3.00 4.00 5.00 6.00 7.00 8.00 9.00 10.00 11.00 12.00 13.00 14.00
Fig. 29oooo Photolytic/Alkaline product chromatograph for FUPA/sample 18.

656
129
SampleName: 18
Inte
nsity
210.00
215.00
220.00
225.00
230.00
235.00
240.00
245.00
250.00
255.00
260.00
265.00
270.00
275.00
280.00
Minutes
1.00 2.00 3.00 4.00 5.00 6.00 7.00 8.00 9.00 10.00 11.00 12.00 13.00 14.00
Fig. 29pppp Photolytic/Alkaline product chromatograph for 5-FU/sample 18.

657
19
77
SampleName: 19
Inte
nsity
0.00
500.00
1000.00
1500.00
2000.00
2500.00
3000.00
3500.00
4000.00
4500.00
5000.00
Minutes
1.00 2.00 3.00 4.00 5.00 6.00 7.00 8.00 9.00 10.00 11.00 12.00 13.00 14.00
Fig. 29qqqq Photolytic/Alkaline product chromatograph for FAC/sample 19.
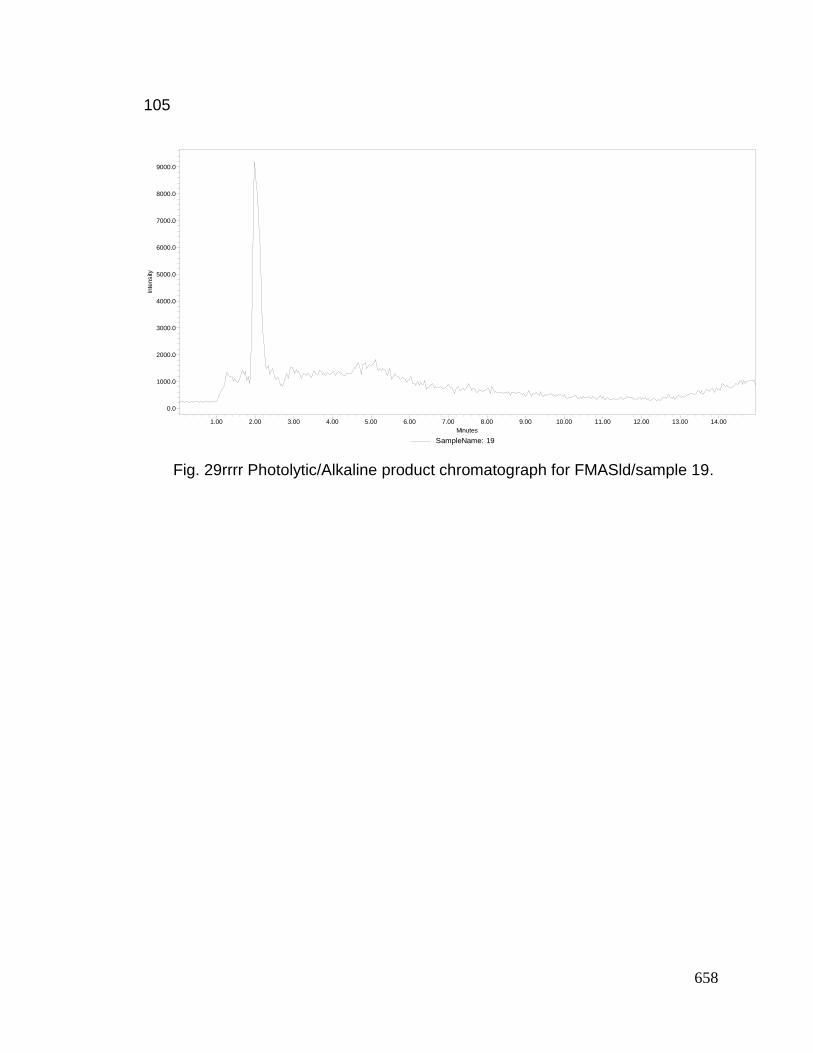
658
105
SampleName: 19
Inte
nsity
0.0
1000.0
2000.0
3000.0
4000.0
5000.0
6000.0
7000.0
8000.0
9000.0
Minutes
1.00 2.00 3.00 4.00 5.00 6.00 7.00 8.00 9.00 10.00 11.00 12.00 13.00 14.00
Fig. 29rrrr Photolytic/Alkaline product chromatograph for FMASld/sample 19.

659
106
SampleName: 19
Inte
nsity
0.00
200.00
400.00
600.00
800.00
1000.00
1200.00
1400.00
1600.00
1800.00
2000.00
2200.00
2400.00
2600.00
Minutes
1.00 2.00 3.00 4.00 5.00 6.00 7.00 8.00 9.00 10.00 11.00 12.00 13.00 14.00
Fig. 29ssss Photolytic/Alkaline product chromatograph for FBAL/sample 19.

660
149
SampleName: 19
Inte
nsity
200.00
300.00
400.00
500.00
600.00
700.00
800.00
900.00
1000.00
1100.00
Minutes
1.00 2.00 3.00 4.00 5.00 6.00 7.00 8.00 9.00 10.00 11.00 12.00 13.00 14.00
Fig. 29tttt Photolytic/Alkaline product chromatograph for 5-FU/sample 19.

661
129
SampleName: 19
Inte
nsity
200.00
300.00
400.00
500.00
600.00
700.00
800.00
900.00
1000.00
1100.00
Minutes
1.00 2.00 3.00 4.00 5.00 6.00 7.00 8.00 9.00 10.00 11.00 12.00 13.00 14.00
Fig. 29uuuu Photolytic/Alkaline product chromatograph for 5-FU/sample 19.

662
20
77
SampleName: 20
Inte
nsity
0.00
500.00
1000.00
1500.00
2000.00
2500.00
3000.00
3500.00
4000.00
4500.00
5000.00
Minutes
1.00 2.00 3.00 4.00 5.00 6.00 7.00 8.00 9.00 10.00 11.00 12.00 13.00 14.00
Fig. 29vvvv Photolytic/Alkaline product chromatograph for FAC/sample 20.

663
105
SampleName: 20
Inte
nsity
0.00
500.00
1000.00
1500.00
2000.00
2500.00
3000.00
3500.00
4000.00
4500.00
5000.00
5500.00
6000.00
6500.00
7000.00
7500.00
8000.00
Minutes
1.00 2.00 3.00 4.00 5.00 6.00 7.00 8.00 9.00 10.00 11.00 12.00 13.00 14.00
Fig. 29wwww Photolytic/Alkaline product chromatograph for FMASld/sample 20.

664
106
SampleName: 20
Inte
nsity
0.00
200.00
400.00
600.00
800.00
1000.00
1200.00
1400.00
1600.00
1800.00
Minutes
1.00 2.00 3.00 4.00 5.00 6.00 7.00 8.00 9.00 10.00 11.00 12.00 13.00 14.00
Fig. 29xxxx Photolytic/Alkaline product chromatograph for FBAL/sample 20.

665
149
SampleName: 20
Inte
nsity
200.00
250.00
300.00
350.00
400.00
450.00
500.00
550.00
600.00
650.00
700.00
750.00
800.00
850.00
900.00
Minutes
1.00 2.00 3.00 4.00 5.00 6.00 7.00 8.00 9.00 10.00 11.00 12.00 13.00 14.00
Fig. 29yyyy Photolytic/Alkaline product chromatograph for FUPA/sample 20.

666
129
SampleName: 20
Inte
nsity
0.00
500.00
1000.00
1500.00
2000.00
2500.00
3000.00
3500.00
4000.00
4500.00
5000.00
5500.00
6000.00
6500.00
7000.00
7500.00
Minutes
1.00 2.00 3.00 4.00 5.00 6.00 7.00 8.00 9.00 10.00 11.00 12.00 13.00 14.00
Fig. 29zzzz Photolytic/Alkaline product chromatograph for 5-FU/sample 20.

667
21
77
SampleName: 21
Inte
nsity
500.00
1000.00
1500.00
2000.00
2500.00
3000.00
3500.00
4000.00
4500.00
Minutes
1.00 2.00 3.00 4.00 5.00 6.00 7.00 8.00 9.00 10.00 11.00 12.00 13.00 14.00
Fig. 29aaaaa Photolytic/Alkaline product chromatograph for FAC/sample 21.

668
105
SampleName: 21
Inte
nsity
0.0
1000.0
2000.0
3000.0
4000.0
5000.0
6000.0
7000.0
8000.0
9000.0
10000.0
Minutes
1.00 2.00 3.00 4.00 5.00 6.00 7.00 8.00 9.00 10.00 11.00 12.00 13.00 14.00
Fig. 29bbbbb Photolytic/Alkaline product chromatograph for FMASld/sample 21.

669
106
SampleName: 21
Inte
nsity
0.00
200.00
400.00
600.00
800.00
1000.00
1200.00
1400.00
1600.00
Minutes
1.00 2.00 3.00 4.00 5.00 6.00 7.00 8.00 9.00 10.00 11.00 12.00 13.00 14.00
Fig. 29ccccc Photolytic/Alkaline product chromatograph for FBAL/sample 21.

670
149
SampleName: 21
Inte
nsity
200.00
300.00
400.00
500.00
600.00
700.00
800.00
900.00
1000.00
1100.00
1200.00
Minutes
1.00 2.00 3.00 4.00 5.00 6.00 7.00 8.00 9.00 10.00 11.00 12.00 13.00 14.00
Fig. 29ddddd Photolytic/Alkaline product chromatograph for FUPA/sample 21.

671
129
SampleName: 21
Inte
nsity
210.00
215.00
220.00
225.00
230.00
235.00
240.00
245.00
250.00
255.00
260.00
265.00
270.00
275.00
280.00
Minutes
1.00 2.00 3.00 4.00 5.00 6.00 7.00 8.00 9.00 10.00 11.00 12.00 13.00 14.00
Fig. 29eeeee Photolytic/Alkaline product chromatograph for 5-FU/sample 21.

672
VITA
Eddie LaReece Pittman was born in Tarboro, North Carolina which is
where he grew up and graduated from Tarboro High School. He then
entered the U.S. Army Reserves and received several athletic physical
testing honors. Soon thereafter he commenced his college career at the
North Carolina State University and was recognized as an Honors student
after his first year. He then transferred his studies down to Florida and
eventually earned his Bachelor of Science in chemistry from the University
of South Florida in Tampa. During that time, he worked at an
environmental analytical lab called GTEL and it was there where he
developed strong interests in environmental related issues. Years later, he
pursued and completed his Master of Science degree in chemistry at the
University of North Carolina Wilmington under the guidance of Dr. Ned
Martin. This achievement helped him get several PhD program offers from
which he chose the University of Missouri to pursue under guidance of Dr.
Renee JiJi with intent on having his research agenda correlated with
environmental issues. Dr. Chu Lin played a significant role in this
correlation process. Finally, with the completion of the PhD agenda here
at Mizzou, he anticipates on publishing at least 6 research articles and is
on track in eventually purchasing full ownership of his own environmental

673
analytical environmental lab in Canada in which both may be seen as rare
accomplishments.