Surfactant-sensitized spectrophotometric determination of ...
Spectrophotometric Determination of Magnesium, Calcium, Strontium and Barium Present in Pairs by Use
of Tetramethylmurexide
R. KOHN
Institute of Chemistry, Slovak Academy of Sciences, Bratislava 9
Received June 30, 1969
A spectre-photometric method is described for the determination of magnesium* calcium, strontium and barium coexisting in binary mixtures. The method employs totramethyimurexide as an auxiliary ligand, and has been developed for pure two-component systems, such as are involved in investigations of cation-exchange equilibria on anionic polymers. The analysis is performed with calibration curves of the cp = f[Me(I), Me(II)], where q? is the ratio of two absorbances А г and A 2 measured at two suitable wavelengths, Xl and Я2. The wavelengths Ax and$A2
a r o chosen from the absorption spectra of solutions containing the separate metals Me(I) or Me(II). The absorption spectra of solutions containing the tetramethylmurexide complexes of Ca2 +, Sr2 + or Ba 2 + ions are independent of the identity of the anions present in the system (Cl~, NOg and CH3COO~). The results show that two arbitrarily chosen elements of the alkaline earths can be determined with a good accuracy in the presence of each other over a large concentration range (0.001 —0.05 м). Calcium, strontium and barium can bo estimated with high accuracy in solutions containing a considerable excess of either magnesium or potassium, this exceeding the concentrations of the above alkaline-earth elements by factors of 100, 50 and 20, respectively. Calcium can also be estimated with barium or strontium present in a 30-fold or a 20-fold molar excess, respectively.
The use of murexide as an indicator for complexometric determination of calcium, copper and nickel is well known [1]. This compound (the ammonium salt of 5,5'-nitri-lodibarbituric acid) forms coloured complexes with many bivalent and multivalent cations [1—4], and has been used for the spectrophotometric determination of calcium [5—7], strontium [8], zinc [9], and elements of the rare earths such as scandium, yt tr ium, lanthanum [10, 11] and ytterbium [12].
Eaaflaub [5] used murexide as an auxiliary ligand for the spectrophotometric determination of C a 2 + ions in biological fluids (see also [13]). The formation of the coloured complex between calcium and murexide is, however, ra ther dependent upon the p H of the solution because of the presence of four imido groups in the murexide molecule. For this reason, this method requires the maintenance of a fixed p H value during the spectrophotometric determination. Raaflaub [14] overcame this disadvantage by using tetramethylmurexide instead of murexide. The keto groups neighbouring the methyl groups in a molecule of tetramethylmurexide cannot assume the enolic form in contrast to murexide, and the formation of the coloured complex of tetramethylmurexide with cations is independent of p H within the
79 1 Chem. zvesti 23, 721—735 (1969)
lt. КОНУ
range 4.8—8.1 [14]. Tetramethylmurexide has been successfully used for the s tudy of the binding of C a 2 b ions to the carboxyl groups of pectin, monouronides and polyuronides [15—17].
I n connection with the application of pectin as a natural prophylactic or remedy against poisoning with heavy metals or radioactive strontium, it is important t o study the exchange of Ca 2 + , Sr 2 + and B a 2 + ions on this material. During work on these problems, it was necessary to have a simple b u t exacte method for the determination of magnesium, calcium, strontium and barium in arbitrarily chosen binary mixtures.
Hitherto, murexide has been used only for the determination of calcium and magnesium in the presence of each other either by complexometric or by spectro-photometric methods [1, 7]. (The chelatometric determination of magnesium, stront ium and barium in the presence of each other is unsatisfactory because t h e stability constants of the complexes formed between ethylenediaminetetraacetic acid and these metals are very similar [1].) We have therefore developed a spectrophoto-metric method for the determination of arbitrarily chosen binary mixtures of elements from the series magnesium, calcium, strontium and barium by using tetramethylmurexide as an auxiliary coloured ligand. The method permits the analysis of pure solutions containing the salts of these elements, and was developed, as stated primarily to facilitate the s tudy of exchange equilibria on ion-exchangers. The principle of the method could, however, be applied to solutions containing more components. The method is rather simple and does not require expensive equipment, in contrast to the determination of these elements by atomic absorption spectrometry; in some combinations of elements it is also more exact.
Experimental
Chemicals
Tetramethylmurexide was synthesized from caffoin via tetramethylalloxantin [18, 19]. The molar absorptivities of tho ammonium salt of tetramethylmurexide (e5 3 0 = 13,800) and of its Ca-complox (e490 = 20,000) were consistent with corresponding values of murexide cited in literature [2, 131.
The salts [CaCl,, SrCl2, BaCU, MgCl2, KCl, Ba(N0 3 ) 2 and Ba(OAc)2] and the o t h e r chomicals used were of analytical grade. The calcium acetate solution waa prepared b y decomposing 0aCO3 with acetic acid, filtering off the undissolved carbonate resid no, expelling the released C 0 2 by heating on a boiling water bath, and adjusting tho p H . Tho solutions of s.rontium nitrate and strontium acetate were prepared by neutralization of the corresponding acids to p H 7.0 — 7.5 with 0.1 N solutions of strontium hydroxide. Tho solutions of magnesium nit rat о and magnesium acetate wore prepared by neutralization of MgO with the corresponding acid. After filtering off the residual MgO, the p H of the filtrate was adjusted with the corresponding acid to 6.5—7.0. The specific conductivity of the distilled water was 3 X 10~6 o h m - 1 c m - 1 .
Analytical methods
The principle of quantitative determination of alkaline earth cations is fully described in the next section.
Tho absorbances of solutions were determined with a compensation spectrophotometer (UVISPEC-Hilger) with 0.1 mm slit width and 1 cm cells at 23-25°C. The wavelength
' w * Chem. zvesti 23, 721—735 (19Ü9)
SPECTROPHOTOMETRIC DETERMINATION OV MAGNESIUM
scalo was calibrated with the hydrogen spectral lines at 486 and 656 nm and by use of a didymium glass filter within the wavelength region 400 — 650 nm [20]. The stock solution of 2 x 10 - 4 M tetramethylmurexide ( N H | form) was prepared separately for each series of moasuromonts just before use. All absorbance measurements were carried out with 4 x 10~5 M solutions of tetramethylmurexide.
The molar concentrations of metal chlorides in solution wore determined by Potentiometrie titration with either 0.1 N or 0.01 N solutions of AgN0 3, using a silver electrode. The molar concentrations of solutions of calcium and magnesium salts wore determined by the usual chelatometric titration, murexide or oriochrome black being used as indicators. The concentrations of strontium nitrate and acetate solutions were computed from the consumption (to neutrality) of strontium hydroxide by the respective acids. The concentrations of barium nitrate and acetate solutions were calculated directly from the weights of the analytically pure preparations used.
Results and Discussion
Absorption spectra of tetramethylmurexide in solutions of calcium, strontium, barium and magnesium salts
As mentioned, murexide (NH^ form) forms coloured complexes with Ca 2 + , Sr 2 4
and B a 2 + ions. The stability constants (K) of these complexes and the wavelengths corresponding to maximum absorbance (Л т а х)> found by some authors, are summarized in Table 1. The stabilities of the complexes decrease in the order: (CaMur+) > > (SrMur+) > (BaMur+).
Table 1
Stability constants (K) of murexido complexing with Ca2+, Sr2+, Ba 2 + and Mg2 + ions and w a v e l e n g t h s c o r r e s p o n d i n g t o m a x i m u m a b s o r b a n c e (/max)
Mo
C a 2 + S r 2 + B a 2 + Mg*+
К
500^
[ n m ]
487
К
2102
К
5003 280 138
0 .3—0.5
[ n m ]
483
— 513 487
К
398* ÍOO5
100* < I4
[nm]
483 495 510
Kef. [2] [13] [3] [4]
1. pH 7.0, fi 0.005—0.10; 2. pH 7.2, /Í 0.15 (KCl); :$. neutral solutions; 4. // 0.10 (KN0 3 ) , 10°C; J. 23°C.
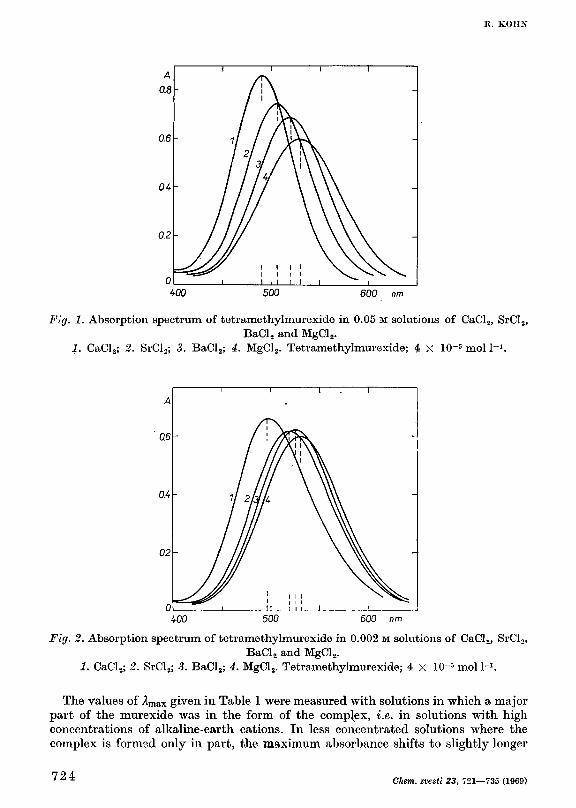
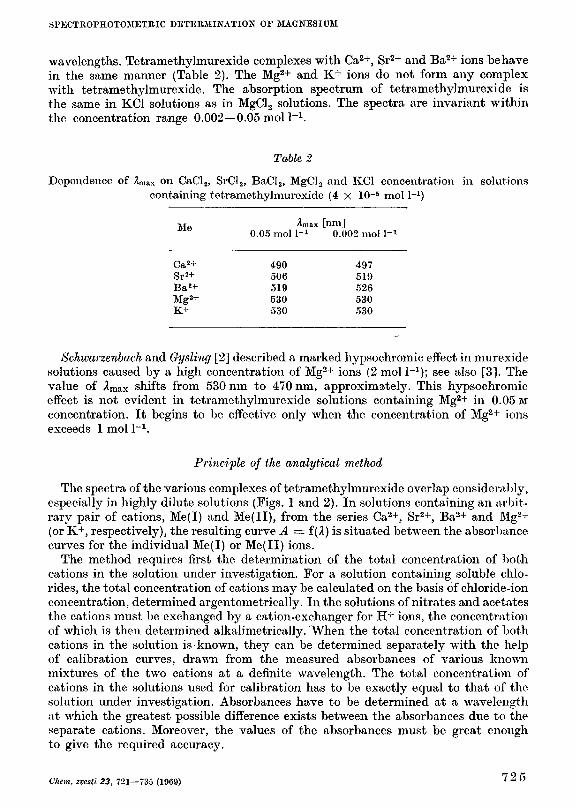
Tetramethylmurexide shows the same stability constant for its Ca-complex as does murexide (K = 500). The absorption spectra of both indicators are practically identical [19]. We have determined the absorption spectra of tetramethylmurexide (4 x 10⁻⁵ mol l-1) in 0.05 м (Fig. 1) as well as in 0.002 м (Fig. 2) solutions of CaCl2, SrCl2, BaCl 2 and MgCl2. Absorption spectra were also measured on 0.002 м solutions of the nitrates and acetates of these metals, but they were identical with the spectra obtained with the chlorides. This means t h a t the spectra of the complexes of tetramethylmurexide with Ca 2 + , Sr 2 + and B a 2 + (and also Mg 2 +) are independent of the presence of CI", NO.j and CH3COO~ ions.
C/iem. zvesti 23, 721—73Г> (1009) ' L **
E. KOHN
A
0.8
0.6
ОЛ
0.2
О
1
1J
/ i J
i
i l
/ 1 \
2 / A \\ 3 / \ i \ \\
/ 11 \ \ \ \
i i i i \ i i i i i i i i i i
1
-
-
-
\ \
400 500 600 nm
Fig. 1. Absorption spectrum of tetramethylmurexido in 0.05 м solutions of CaCl2, SrCL BaCl2 and MgCl2.
1. CaCl2; 2. SrCL; 3. BaCl2; 4. MgCl2. Tetramethylmurexide; 4 X lO-Smoll" 1 .
Ш 500 600 n m
Fig. 2. Absorption spectrum of tetramethylmurexide in 0.002 м solutions of CaCl2, SrCl2, BaCl2 and MgCl2.
1. CaCl2; 2. SrCl2; 3. BaCl2; 4. MgCL. Tetramethylmurexide; 4 x 10~5 mol l-1.
The values of Amax given in Table 1 were measured with solutions in which a major p a r t of the murexide was in the form of the complex, i.e. in solutions with high concentrations of alkaline-earth cations. I n less concentrated solutions where the complex is formed only in part , the maximum absorbance shifts to slightly longer
724 Chem. zvesti 23, 721—735 (1969)
SPECTROPHOTOMETRY DETERMINATION OF MAGNESIUM
wavelengths. Tetramethylmurexide complexes with Ca 2 + , Sr 2 + and B a 2 + ions behave in the same manner (Table 2). The Mg 2 + and K+ ions do not form any complex with tetramethylmurexide. The absorption spectrum of tetramethy]murexide is the same in KCl solutions as in MgCl2 solutions. The spectra are invariant wi thin the concentration range 0.002—0.05 mol l - 1 .
Table 2
Dependence of Amax on CaCl2, SrCl2, BaCl2, MgCl2 and KCl concentration in solutions containing tetramethylmurexide (4 x 10~5 mol 1_1)
Mo
Ca2+ Sr2+ Ba 2 + Mg2+ K+
Am« 0.05 mol l- 1
490 506 519 530 530
[nm]
0.002 m o l l " 1
497 519 526 530 530
Schwarzenbach and Gysling [2] described a marked hypsochromic effect in murexide solutions caused by a high concentration of Mg2+ ions (2 mol 1_1); see also [3]. The value of Ящах shifts from 530 nm to 470 nm, approximately. This hypsochromic effect is not evident in tetramethylmurexide solutions containing Mg 2 + in 0.05 м concentration. I t begins to be effective only when the concentration of M g 2 + ions exceeds 1 mol 1 _ 1 .
Principle of the analytical method
The spectra of the various complexes of tetramethylmurexide overlap considerably, especially in highly dilute solutions (Figs. 1 and 2). I n solutions containing an arbitrary pair of cations, Me(I) and Me(II), from the series Ca 2 + , Sr 2 + , B a 2 + and Mg 2 +
(or K + , respectively), the resulting curve A = f (A) is s ituated between the absorbance curves for the individual Me (I) or Me (II) ions.
The method requires first the determination of the tota l concentration of both cations in the solution under investigation. For a solution containing soluble chlorides, the total concentration of cations may be calculated on the basis of chloride-ion concentration, determined argentometrically. I n the solutions of nitrates and acetates the cations must be exchanged by a cation-exchanger for H+ ions, the concentration of which is then determined alkalimetrically. When the total concentration of both cations in the solution is known, they can be determined separately with the help of calibration curves, drawn from the measured absorbances of various known mixtures of the two cations a t a definite wavelength. The total concentration of cations in the solutions used for calibration has to be exactly equal to t h a t of the solution under investigation. Absorbances have to be determined at a wavelength a t which the greatest possible difference exists between the absorbances due to the separate cations. Moreover, the values of the absorbances must be great enough to give the required accuracy.
Chem. zvesti 23, 721—735 (1909) ^ -1 °
K. KOIIN
Quotient (p
Buddecke and Drzenieh [13] following the method of Ettori and Scoggan [22] constructed calibration curves for the system CaCl 2—KCl by measuring absorbances a t two wavelengths, corresponding to the maximum absorbances of murexide in the presence of CaCl2 (Яса) and KCl (Як), respectively. They computed the quotient cp = AtcJAxK on the basis of measured absorbances. Then they drew the calibration curve as the relationship between the quotient <p and the concentration of Ca 2 + ions in solution; cp = f [Ca 2 + ].
This procedure [22, 13] has the following advantages, when the absorbance of a particular solution is measured a t two wavelengths in the same cell: 1. The calculation of the quotient (p, which is given by the rat io of both absorbances, eliminates incidental small differences in the path-lengths of individual cells. 2. The stock solution of tetramethylmurexide need not to be measured especially carefully into the test solution. 3. The error due to slow decomposition of tetramethylmurexide in the course of measurement lessens. The tetramethylmurexide is subject to decomposition under the weakly alkaline conditions of the experiment. If a small amount decomposes, a small and approximately proportional decrease in the absorbances determined a t two diiBFerent wavelengths occurs, but the ratio of these absorbances (the quotient cp) does not change significantly [22].
We prefer, therefore, to construct the calibration curve by means of the quotient cp t h a n to use absorbances measured only a t one wavelength.
I n highly dilute solutions (e.g. 0.002 м) the absorption spectra of SrCl2 and BaCl 2
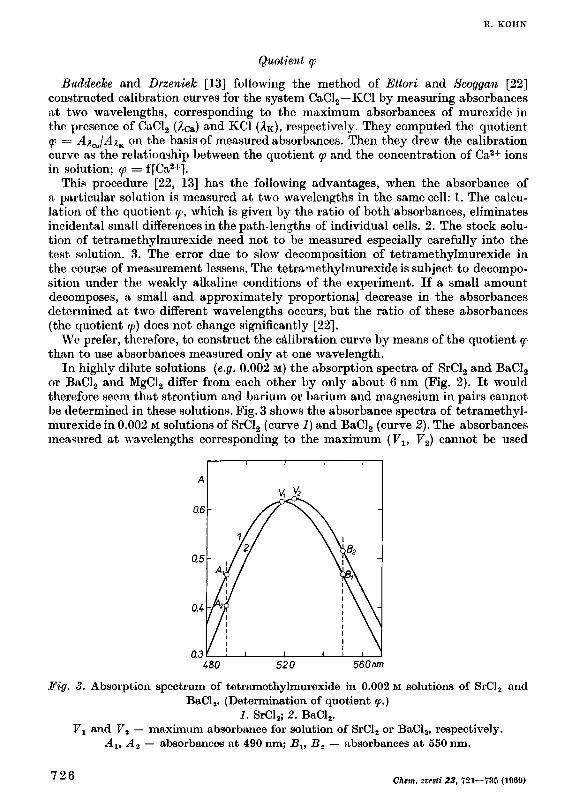
or BaCl 2 and MgCl2 differ from each other by only about 6 nm (Fig. 2). I t would therefore seem t h a t strontium and barium or barium and magnesium in pairs cannot be determined in these solutions. Fig. 3 shows the absorbance spectra of tetramethylmurexide in 0.002 M solutions of SrCl2 (curve 1) and BaCl 2 (curve 2). The absorbances measured a t wavelengths corresponding to the maximum (Vlt V2) cannot be used
A
0.6
0.5
0Л
0.3 480 520 560 nm
Fig. 3. Absorption spectrum of tetramethylmurexide in 0.002 м solutions of SrCJ2 and BaCL. (Determination of quotient q?.)
1. SrCl2; 2. BaCl2. V1 and F 2 — maximum absorbance for solution of SrCl2 or BaCL, respectively.
Alf А о — absorbances at 490 nm; Blf B2 — absorbances at 550 nm.
i i i г
726 Chem. zvesti 23, 721—735 (1969)
SÍVKCTEOťHOTOMETKIC DETERMINATION OF MAGNESIUM
for computing the quotient cp in the same manner as performed by Buddecke and Drzeniek [13], because the absorbance changes very little with varying concentration of both cations. The quotient cp must therefore be determined for wavelengths s i tuated at both sides of the maxima of curves, e.g. a t 490 and 550 nm. With increasing proportion of S r 2 + ions in the mixture, the absorbance Aá90 rises from the limiting value A2 to a limiting value Ax while the absorbance A650 falls from t h e limiting value B2 to the limiting value Bv Thus, the quotient cp = ^á490/^4550
grows with increasing proportions of Sr 2 + ions in solution to such an extent t h a t the concentrations of Sr 2 + and B a 2 + ions can still be determined with sufficient •accuracy. On the other hand, the small difference in absorption spectra of dilute solutions containing SrCl2 andBaCl 2 , BaCl 2 and MgCl2 (or BaCl 2 and KCl, respectively), requires a considerable accuracy in the determination of the quotient cp.
Conditions for exact determination of the quotient cp
Tetramethylmurexide has a great advantage over murexide in t h a t the absor-bances of solutions containing the complexes of tetramethylmurexide with metals -are independent of p H within the range 4.8—8.1 [14]. We have tested experimentally this property of tetramethylmurexide. The values of cp, determined in the solutions of tetramethylmurexide (4 x 10~5 mol b 1 ) containing 0—3 millimoles Ca/1000 ml with ionic strength /LI = 0.15 (KCl) have been constant and independent of p H within the range 4.7 — 8.7 [15].
Stability of tetramethylmurexide solution
The solution of tetramethylmurexide is not stable and decomposes slowly, especially in weakly alkaline solutions. I t is, therefore, necessary to prepare the stock solution of tetramethylmurexide immediately before use. The stability of tetramethylmurexide solution (4 X 10~~5 mol 1_1) in distilled water and in 0.025 м, unbuffered CaCl2,SrCl2 and BaCl 2 (pH 5.8—6.2) was studied by measuring the changes in absorbance a t 500 and 530 nm as a function of t ime. The values of the quotient cp for the salt solutions were constant within the limits of error for 4 hours, and thereafter decreased slowly. I n distilled water without added salts, they were constant for two hours, and then decreased significantly, unti l after 4 hours, the total decrease was about 1%. If the analysis is, therefore, carried out immediately after the preparation of the solution of tetramethylmurexide, the t ime interval not exceeding 4 hours, the slow decomposition of tetramethylmurexide is not significant. T h e rate of decomposition is, however, much more significant in weakly alkaline solutions. At the limiting value of p H 8.7, the tetramethylmurexide decomposition is already rather fast. Correct values can be obtained in this case only when the analysis is carried out within one hour. From the point of view of accuracy, the p H of calibration solutions as well as analysed samples should be within the range 5.0—7.0. (Note: According to Spare [21], glycerol, methanol and propyleneglycol retard murexide decomposition in alkaline solutions a t p H 12.)
Adjustment of the wavelength
I n most cases, the absorbance measurements are performed a t a wavelength where the absorbance curve is steep. A small alteration of wavelength (e.g. 1 nm) -corresponds to a considerable change of absorbance which also causes a change in
Chem. zvesti 23, 721—735 (1969) 727
R. K0HN
the quotient cp (Fig. 3). For instance, the determination of the absorbance ^4490
with an error of ±0 .001 requires an adjustment of wavelength with a precision of about ± 0 . 1 nm. Such a precise adjustment of wavelength, cannot be achieved with the spectrophotometer, but i t is easy to overcome this difficulty. Absorbances of both calibration solutions and analysed solutions must be measured first a t the first wavelength, e.g. 490 nm (with only one adjustment of wavelength) and subsequently a t the second wavelength, e.g. 550 nm. In this way, the absorbance of the analysed solutions are measured a t exactly the same wavelengths as those of the calibration solutions. The absorbance measurements with a given solution must be carried out for both wavelengths with the same cell.
Accurate measurements require tha t the calibration curve be drawn afresh for each series of analysed samples. The values of the absorbances were read twice with an error of less than 0.001. Under the above conditions, the results are quite reproducible. I t followed from a great number of analyses (more than 100) tha t the quotient cp may be determined with considerable accuracy, the error being less than ±0 .0025.
Influence of ionic strength of solution
The absorbance of solutions containing tetramethylmurexide complexes is affected by the activity of ions present in solution in addition to the indicator concentration. (This topic has been dealt with in more detail in one of our preceding papers [15], in which it has been demonstrated tha t tetramethylmurexide can be used for the determination of Ca2+ ion activity in solutions containing biological substances.) I t is, therefore, necessary for both calibration solutions and analysed solutions to have the same ionic strength.
Determination of two cations in the presence of each other
Accuracy of analysis
The calibration curves, shown later in this paper were determined by using solutions of the chlorides of the various metals. For two cations where absorption spectra were quite different {e.g. Ca2+—Mg2+), the absorbances were determined a t wavelengths of maximum absorbance, whereas they were determined a t wavelengths on either side of the absorbance maxima for the other systems. The wavelengths were chosen according to the type of cation pair and the concentration of the solution. The wavelengths, used for every particular absorbance measurement, are given in subsequent tables.
The estimates of analytical error for all cation pairs are based on the assumption tha t the overall cation concentration in solution is known. The correct relative error in the determination of the concentrations of the individual cations is then determined by the slope of the calibration curve for the cation-ratio, considered in relation to the error in the determination of the quotient cp. This error (A<p) was assumed to be ±0 .0025 for all measurements. The application of the method has confirmed the correctness of the experimental error determined in this way.
Determination of calcium and magnesium in the presence of each other
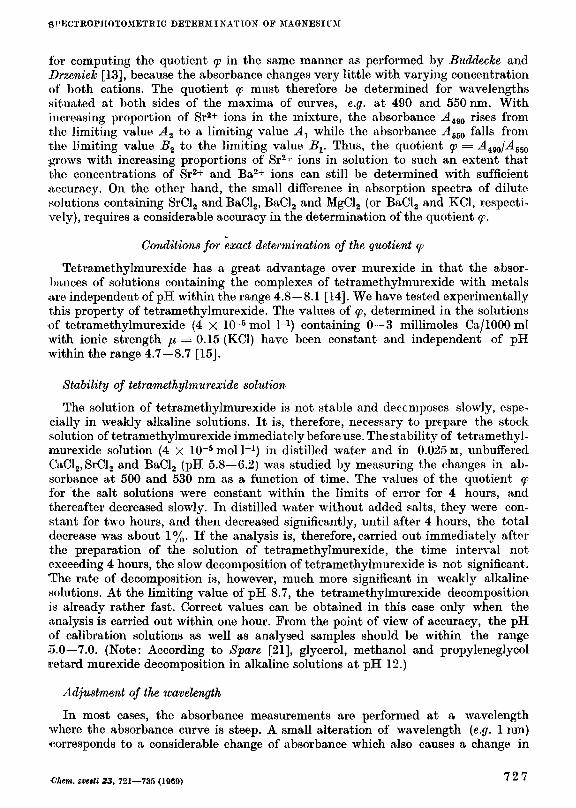
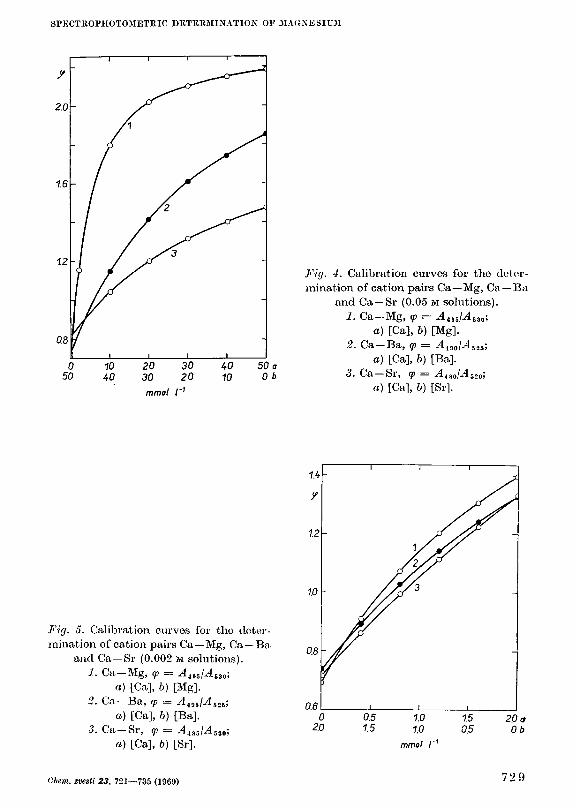
The calibration curve for mixtures of solutions of calcium and magnesium chlorides having an overall concentration of 0.05 mol l-1 is shown in Fig. 4 (curve Í ) , while the corresponding curve for an overall concentration of 0.002 mol l-1 is given in
7 2 8 Chemm zvesti 23) 721—735 (1969)
SPECTllOľHOTOMETRIC DETERMINATION OF MAGNESIUM
0 50
10 40
20 30 30 20 mmol ľ1
АО 10
50 а Ob
Fig. 4. Calibration curves for t h e deter
m i n a t i o n of ca t ion pairs C a — M g , Ca — B a
a n d C a — S r (0.05 м solutions).
1. C a — M g , <p = AAJA5S0;
a) [Ca], b) [Mg].
2. C a — B a , cp = Ai00IA525;
a) [Ca], b) [Ba].
3. C a — S r , cp = AASQ!A520;
a) [Ca], b) [Sr].
Fig. 5. Cal ibrat ion curves for t h o deter
m i n a t i o n of ca t ion pairs C a — M g , Ca — B a
a n d Ca —Sr (0.002 м solutions).
1. C a - M g , cp =-- Л 4 9 5 / Л 5 3 0 ;
a) [Ca], b) [Mg].
2. C a - B a , cp = A405jAb25;
a) [Ca], b) [Ba].
3. Ca —Sr, cp = Aíls5IA530; a) [Ca], b) [Sr].
0 2D
0.5 1.5
1.0 1.0
mmol ľ1
1.5 0.5
20 a 0b
Chem. zvesti 23, 721—735 (1969) 7 2 9
3t. коих
Fig. 5 (curve 1). The considerable curvature of the calibration curve at higher calcium content (Fig. 4) is due to a relatively high value of the stability constant of the tetramethylmurexide complex of calcium.
As magnesium does not form any complex with tet . amethylmurexide, and the solutions of both elements show a considerable difference in absorption spectra (Figs. 1 and 2), calcium and magnesium may be determined in the presence of each other within a broad range of concentrations (0.002—0.05 м). Calcium alone can .be determined in the presence of a considerable excess of magnesium (ratio 1:100).
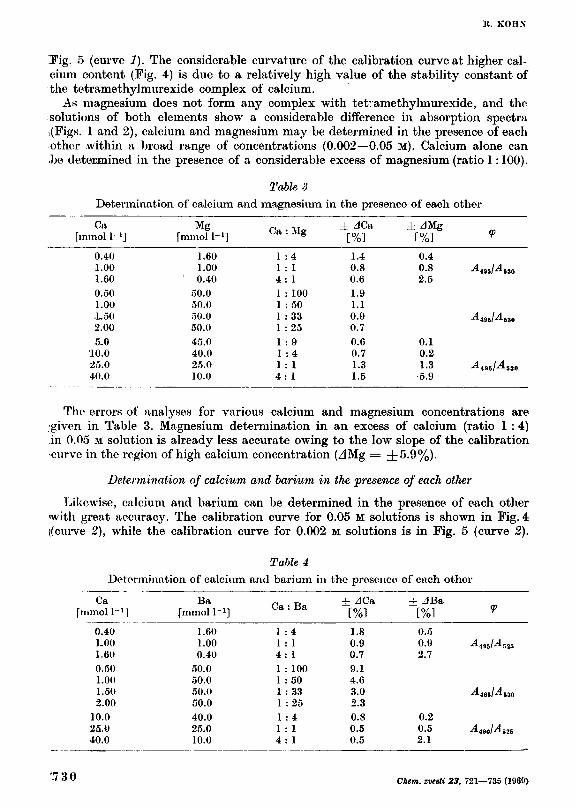
Table 3
Determination of calcium and magnesium in the presence of each other
Ca [mmol 1_1]
0.40 1.00 1.60 0.50 1.00 ,L50 2.00 5.0
10.0 25.0 40.0
Mg [mmol l - 1 ]
1.60 1.00
1 0.40 50.0 50.0 50.0 50.0 45.0 40.0 25.0 10.0
Ca : Mg
1 : 4 1 4 1 1 1 1 1 1 1 4 .
1 1 100 50 33 25 9
: 4 1 1
± zdCa
[%]
1.4 0.8 0.6 1.9 1.1 0.9 0.7 0.6 0.7 1.3 1.5
± Z l M g
Г%]
0.4 0.8 2.5
0.1 0.2 1.3 5.9
9
•^495/^530
^ 4 9 5 / ^ 6 3 0
•^495/^530
The errors of analyses for various calcium and magnesium concentrations are •given in Table 3. Magnesium determination in an excess of calcium (ratio 1 : 4) in 0:05 M solution is already less accurate owing to the low slope of the calibration •curve in the region of high calcium concentration (ZlMg = ± 5 . 9 % ) .
Determination of calcium and barium in the presence of each otlier
Likewise, calcium and barium can be determined in the presence of each other wi th great accuracy. The calibration curve for 0.05 м solutions is shown in Fig. 4 ((curve 2), while the calibration curve for 0.002 м solutions is in Fig. 5 (curve 2).
Table 4
D e t e r m i n a t i o n of calcium a n d b a r i u m in t h e presence of each o t h e r
Ca [mmol I 1 1
Ba [mmol l" 1]
C a : Ba + zlCa
[%] ± AB&
[%]
0.40 L00 1.60 0.50 1.00 1.50 2.00
10.0 25.0 40.0
1.60 1.00 0.40
50.0 50.0 50.0 50.0
40.0 25.0 10.0
1 : 4 1 : 1 4 : 1
1 : 100 1 : 50 1 : 33 1 : 25
1 : 4 1 : 1 4 : 1
1.8 0.9 0.7
9.1 4.6 3.0 2.3 0.8 0.5 0.5
0.5 0.9 2.7
0.2 0.5 2.1
-^•405/^525
^485/^530
^490/^*525
30 CÄero. zvesti 23, 721—735 (1960)
SPECTROPHOTOMETRIC DETERMINATION OF MAGNESIUM
The errors of analyses for various concentrations of calcium and barium are given in Table 4. I n contrast to magnesium, barium forms a complex with tetramethyl-murexide. Calcium determination in the presence of a large excess of barium (Ba : Ca > 30 : 1) is, therefore, less accurate (/ICa > ± 3 % ) .
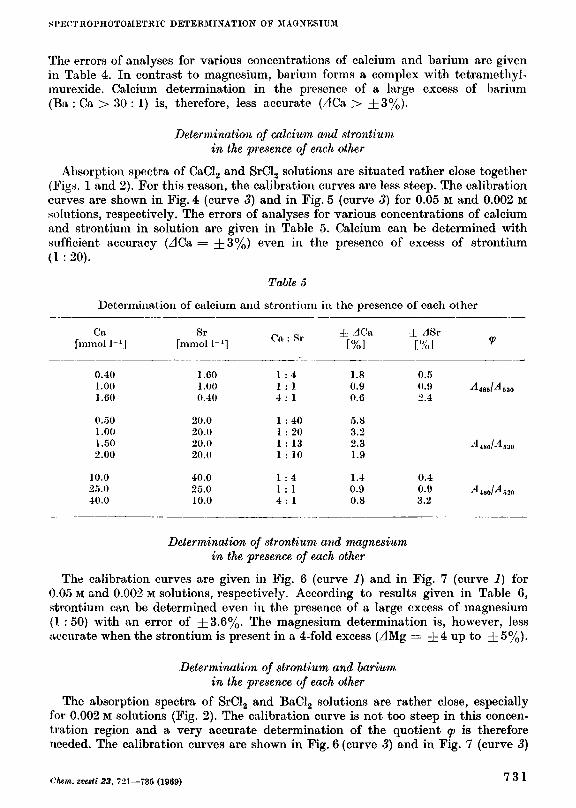
Determination of calcium and strontium in the presence of each other
Absorption spectra of CaCl2 and SrCl2 solutions are situated rather close together (Figs. 1 and 2). For this reason, the calibration curves are less steep. The calibration curves are shown in Fig. 4 (curve 3) and in Fig. 5 (curve 3) for 0.05 м and 0.002 м solutions, respectively. The errors of analyses for various concentrations of calcium and strontium in solution are given in Table 5. Calcium can be determined with sufficient accuracy (ZlCa = ± 3 % ) even in the presence of excess of strontium (1 : 20).
Table 5
Determination of calcium and strontium in the presence of each other
Ca [mmol l - 1 ]
0.40 1.00 1.60
0.50 1.00 1.50 2.00
10.0 25.0 40.0
8r [mmol l - 1 ]
1.60 1.00 0.40
20.0 20.0 20.0 20.0
40.0 25.0 10.0
Ca : Sr
1 : 4 1 : 1 4 : 1
1 :40 1 : 20 1 : 13 1 : 10
1 : 4 1 : 1 4 : 1
± ЛС& [%]
1.8 0.9 0.6
5.8 3.2 2.3 1.9
1.4 0.9 0.8
[%J
0.5 0.9 2.4
0.4 0.9 3.2
<P
^-485/^530
^480/^530
^ 4 8 o M ó 2 0
Determination of strontium and magnesium in the presence of each other
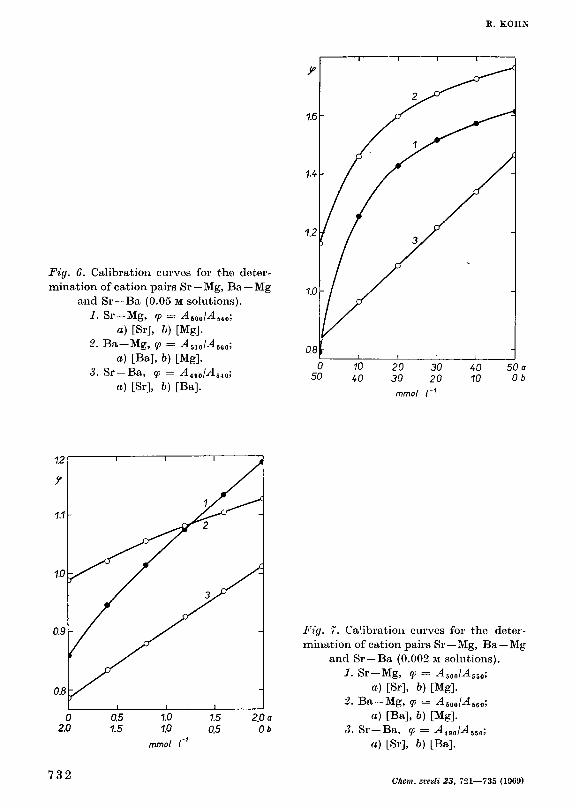
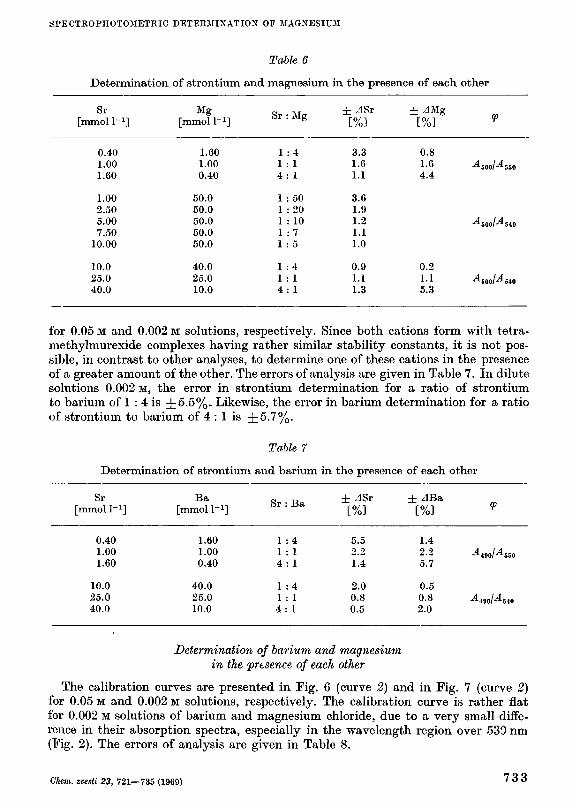
The calibration curves are given in Fig. 6 (curve 1) and in Fig. 7 (curve 1) for 0.05 M and 0.002 м solutions, respectively. According to results given in Table 6, strontium can be determined even in the presence of a large excess of magnesium (1 : 50) with an error of ± 3 . 6 % . The magnesium determination is, however, Jess accurate when the strontium is present in a 4-fold excess (ZlMg = ± 4 up to ± 5 % ) .
Determination of strontium and barium in the presence of each other
The absorption spectra of SrCl2 and BaCl 2 solutions are rather close, especially for 0.002 M solutions (Fig. 2). The calibration curve is not too steep in this concentrat ion region and a very accurate determination of the quotient cp is therefore needed. The calibration curves are shown in Fig. 6 (curve 3) and in Fig. 7 (curve 3)
ehem. zvesti 23, 721—735 (1969) " *
R. КОШ*
Fig. G. Cal ibrat ion curvos for t h e deter
m i n a t i o n of ca t ion pairs Sr —Mg, B a — Mg
a n d Sr — B a (0.05 м solutions).
1. S r — M g , (p =- A500IA5i0;
a) [Sr], b) [Mg].
2. B a - M g , cp = AS10IAM0;
a) [Ba], b) [Mg].
3. Sr — B a , <p == ^4 4 0 0 /Л 5 4 0 ;
a) [Sr], b) [Ba].
0 10 20 30 АО 50 40 30 20 10
mmol Г1
50 a Ob
mmol I
Fig. 7. Cal ibrat ion curves for t h e deter
m i n a t i o n of cat ion pairs Sr —Mg, B a —Mg
a n d Sr — B a (0.002 м solutions).
1. S r - M g , cp = А50О1А5Ъ0;
a) [Sr], b) [Mg].
2. B a - M g , cp = A500IA5&0;
a) [Ba], b) [Mg].
3. S r — B a , cp = A49QIA550;
a) [Sr], b) [Ba].
732 C/iem. zvesti 23, 721—735 (1969)
SPECTROPHOTOMETRY DETERMINATION OF MAGNESIUM
Table 6
Determination of strontium and magnesium in the presence of each other
Sr [mmol l~ r |
0.40 1.00
1.60
1.00 2.50 5.00
7.50 10.00
10.0 25.0
40.0
Mg
[mmol l - 1 ]
1.60 1.00
0.40
50.0 50.0 50.0
50.0 50.0
40.0 25.0
10.0
Sr : Mg
1 : 4 1 : 1
4 : 1
1 :50 1 :20 1 : 10
1 : 7 1 : 5
1 : 4 1 : 1
4 : 1
± zlSr [%]
3.3 1.6
1.1
3.6 1.9 1.2
1.1 1.0
0.9 1.1
1.3
± ^Mg [%]
0.8 1.6
4.4
0.2 1.1
5.3
93
^ 5 0 0 / ^ 5 5 0
-^•500/^540
-^500/^540
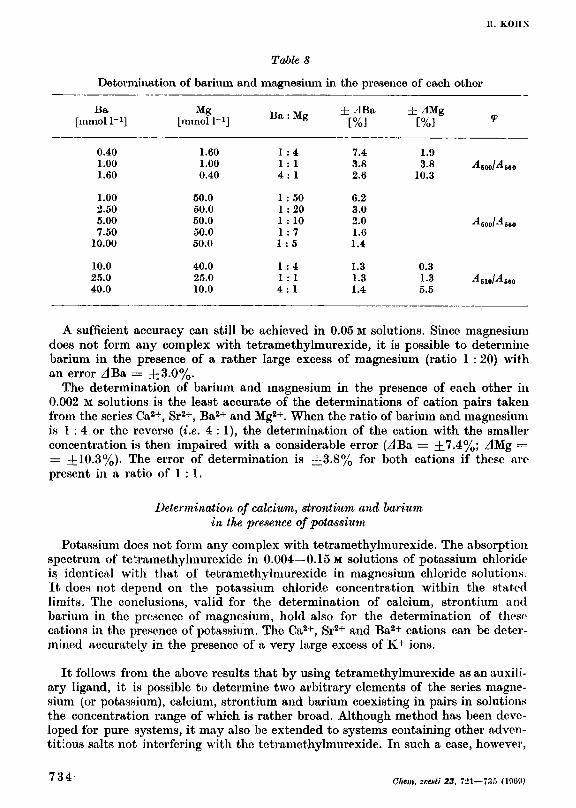
for 0.05 M and 0.002 м solutions, respectively. Since both cations form with tetra-methylmurexide complexes having rather similar stability constants, it is not possible, in contrast to other analyses, to determine one of these cations in the presence of a greater amount of the other. The errors of analysis are given in Table 7. I n dilute solutions 0.002 M, the error in strontium determination for a ratio of strontium to barium of 1 : 4 is ± 5 . 5 % . Likewise, the error in barium determination for a ratio of s trontium to barium of 4 : 1 is ±5.1%.
Table 7
Determination of strontium and barium in the presence of each other
Sr Ba « R ± ASr ± zJBa [mmol l-i] [mmol l-i] b r : Ь а [%] [%] ?
0.40 1.00
1.60
10.0 25.0
40.0
1.60 1.00
0.40
40.0 25.0
10.0
1 : 4 1 : 1
4 : 1
1 : 4 1 : 1
4 : 1
5.5 2.2
1.4
2.0 0.8
0.5
1.4 2.2
5.7
0.5 0.8
2.0
^490/^-550
^490/-^510
Determination of barium and magnesium in the presence of each other
The calibration curves are presented in Fig. 6 (curve 2) and in Fig. 7 (curve 2) for 0.05 M and 0.002 м solutions, respectively. The calibration curve is rather flat for 0.002 M solutions of barium and magnesium chloride, due to a very small difference in their absorption spectra, especially in the wavelength region over 530 nm (Fig. 2). The errors of analysis are given in Table 8.
Chem. zvesti 23, 721—735 (1969) 733
H. SLOH X
Table 8
Determination of barium and magnesium in the presence of each other
Ba [mmol 1 - 1 |
0.40 1.00 1.60
1.00 2.50 5.00 7.50
10.00
10.0 25.0 40.0
Mg [mmol 1~l J
1.60 1.00 0.40
50.0 50.0 50.0 50.0 50.0
40.0 25.0 10.0
Ba : Mg
1 : 4 1 : 1 4 : 1
1 :50 1 :20 1 : 10 1 : 7 1 : 5
1 : 4 1 : 1 4 : 1
± /IBa [%]
7.4 3.8 2.6
6.2 3.0 2.0 1.6 1.4
1.3 1.3 1.4
±AMg
[%]
1.9 3.8
10.3
0.3 1.3 5.5
<P
^ 6 0 0 / ^ 5 6 0
•^БОо/^обО
^ Б Ш ^ Б б О
A sufficient accuracy can still be achieved in 0.05 м solutions. Since magnesium does not form any complex with tetramethylmurexide, i t is possible t o determine barium in the presence of a rather large excess of magnesium (ratio 1 : 20) with an error ZlBa = ± 3 . 0 % .
The determination of barium and magnesium in the presence of each other in 0.002 M solutions is the least accurate of the determinations of cation pairs taken from the series Ca 2 + , Sr 2 + , B a 2 + and Mg 2 + . When the rat io of barium and magnesium is 1 : 4 or the reverse (i.e. 4 : 1 ) , the determination of the cation with the smaller concentration is then impaired with a considerable error (ZlBa = ± 7 . 4 % ; AMg = = ± 1 0 . 3 % ) . The error of determination is ± 3 . 8 % for both cations if these are present in a ratio of 1 : 1.
Determination of calcium, strontium and barium in the presence of potassium
Potassium does not form any complex with tetramethylmurexide. The absorption spectrum of tetramethylmurexide in 0.004—0.15 м solutions of potassium chloride is identical with t h a t of tetramethylmurexide in magnesium chloride solutions. I t does not depend on the potassium chloride concentration within the stated limits. The conclusions, valid for the determination of calcium, s tront ium and barium in the presence of magnesium, hold also for the determination of these cations in the presence of potassium. The Ca 2 + , Sr 2 + and B a 2 + cations can be determined accurately in the presence of a very large excess of K + ions.
I t follows from the above results t h a t by using tetramethylmurexide as an auxiliary ligand, it is possible to determine two arbitrary elements of the series magnesium (or potassium), calcium, strontium and barium coexisting in pairs in solutions the concentration range of which is rather broad. Although method has been developed for pure systems, it may also be extended to systems containing other adventitious salts not interfering with the tetramethylmurexide. I n such a case, however,
' 3 4 Chem. zvesti 23, 721—735 (1000)
SPECTROPHOTOMETlilC DETERMINATION OF MAGNESIUM
the concentration of non-interfering salts must be the same in both calibration, and investigated solutions, because the ionic strength of the investigated solutions must equal the ionic strength of calibration solutions. The described method has-proved to be fully suitable for the study of the binding of calcium, strontium and barium to the carboxyl groups of pectin.
References
1. Přibil R., Komplexometrie I, /J, III. Státní nakladatelství technické literatury-(State Publishing House of Technical Literature.) Prague, 1957 (I), 1959 {II), 1961 (III).
2. Schwarzenbach G., Gysling H., Helv. Chim. Acta 32, 1314 (1949). 3. Feschotte-Ostertag H., Compt. Rend. 250, 1061 (1960). 4. Geier G., Helv. Chim. Acta 50, 1879 (1967). 5. Raaflaub J., Z. Physiol. Chem. 288, 228 (1951). 6. Karanovich G. G., Trudy Vsesoyuz. Nauvh. Issledovatel. Inst. Khim. Reaktivov 1956V
No. 21, 48; Chem. Abstr. 53, 8918 (1959). 7. Panosyan G. A., Izv. Akad. Nauk Armyan SSR; Biol. Nauki 12, No. 8, 15 (1959)?
Chem. Abstr. 54, 9606 (1960). 8. Russell D. S., Campbell J . В., Berman S. S., Anal. Chim. Acta 25, 81 (1961). 9. Shih-Lu Та, Mei-Hou Feng, Chin-Ch'eng Hsiao, Ch'ang-1 Ho, Ching Ch'u Chang,.
Shu-Hai Ch'en, Wu Han Та Hsüeh, T zu Jan ICo Hsüeh Hsüeh Pao 5, 89 (1959): Chem. Abstr. 54, 4267 (1960).
10. Sangal S. P., Microchem. J. 11, 508 (1966). 11. Sangal S. P., Chemist-Analyst 55, 104 (1966). 12. Spacu P., Mavrodin M., Rev. Roum. Chim. 11, 1151 (1966). 13. Buddccke E., Drzeniek R., Z. Physiol. Chem. 327, 49 (1962). 14. Raaflaub J., Z. Physiol. Chem. 328, 198 (1962). 15. Kohn R., Furda L, Collect. Czech. Chem. Commun. 32, 1925 (1967). 16. Kohn R., Furda I., Collect. Czech. Chem. Commun. 32, 4470 (1967). 17. Kohn R„ Furda L, Hang A., Smidsrod O., Acta Chem. Scand. 22, 3098 (1968). 18. Biltz H., Ber. 45, 3673 (1912). 19. Gysling H., Schwarzenbach G., Helv. Chim. Acta 32, 1484 (1949). 20. Gibson К., in Analytical Absorption Spectroscojiy, Absorptiometry and Colorimelri/-
(M. G. Mellon, Editor.) New York, 1950. 21. Spare P. D., Clin. Chem. 10, 726 (1964). 22. Ettori J., Scoggan S. M., Arch. Biochem. Biophys. 78, 213 (1958).
Translated by R. Domanský
C1 hew. zvesti 23, 721—735 (1009) 78Г>