Spectrochimica Acta Part B - lbl.gov
6
Laser Ablation Molecular Isotopic Spectrometry Richard E. Russo a,b, ⁎, Alexander A. Bol'shakov b , Xianglei Mao a , Christopher P. McKay c , Dale L. Perry a , Osman Sorkhabi a a Lawrence Berkeley National Laboratory, University of California, Berkeley, CA 94720, USA b Applied Spectra, Inc., 46661 Fremont Boulevard, Fremont, CA 94538, USA c NASA-Ames Research Center, Moffett Field, CA 94035, USA abstract article info Article history: Received 20 December 2010 Accepted 20 January 2011 Available online 31 January 2011 Keywords: Optical isotopic measurements Laser ablation plasma Molecular emission spectra Real-time chemical analysis Chemical analysis LAMIS A new method of performing optical isotopic analysis of condensed samples in ambient air and at ambient pressure has been developed: Laser Ablation Molecular Isotopic Spectrometry (LAMIS). The technique uses radiative transitions from molecular species either directly vaporized from a sample or formed by associative mechanisms of atoms or ions in a laser ablation plume. This method is an advanced modification of a known atomic emission technique called laser-induced breakdown spectroscopy (LIBS). The new method — LAMIS — can determine not only chemical composition but also isotopic ratios of elements in the sample. Isotopic measurements are enabled by significantly larger isotopic shifts found in molecular spectra relative to atomic spectra. Analysis can be performed from a distance and in real time. No sample preparation or pre-treatment is required. Detection of the isotopes of hydrogen, boron, carbon, and oxygen are discussed to illustrate the technique. © 2011 Elsevier B.V. All rights reserved. 1. Introduction Isotopic analysis is essential in medicine, chemistry, materials science, radiochemistry, archeology, and nuclear non-proliferation. Isotopic data provide answers to fundamental questions related to research and development in these disciplines as well as providing important insight into more applied fields. This paper presents the concept and the first results obtained with newly developed Laser Ablation Molecular Isotopic Spectrometry (LAMIS) technology for real-time isotopic analyses of samples at ambient pressures. We have chosen diatomic molecules containing hydrogen, boron, and carbon as examples in this paper, but this approach can be easily extended to other diatomic and multi-atomic molecules. Benefits of such a laser based technique are rapid and direct chemical characterization of condensed samples without chemical dissolution procedures. The ultimate goal is to demonstrate a new technique for isotopic analysis with good discrimination, good sensitivity (down to ppm levels), with the potential for stand-off capability, and one that does not require (i) sample preparation or (ii) a vacuum environment for the sample. Mass based isotopic measurements are well established and include IRMS [1,2], TIMS [3,4], SIMS [5], accelerator mass spectrometry [6], GCMS [2,7], ICP-MS [8–10], and MALDI-MS [11]. High sensitivity and resolving power are characteristic of these mass spectrometric techniques but they generally tend to be laboratory-based and require complex sample preparation procedures. Laser ablation coupled with ICP-MS [9,10,12–14] or laser desorption in MALDI-MS eliminates the need for laborious sample preparation. To some extent other elemental techniques also are useful for isotopic analysis. Examples include inductively coupled plasma — atomic emission spectrometry [15,16], atomic absorption spectrometry (AAS) including tunable laser AAS [17,18] and laser-excited atomic fluorescence [19,20]. Doppler-free and other high-resolution laser techniques have been detailed in several books [21,22]. Previously, optical spectroscopic techniques for isotopic analysis of both organic and inorganic samples were developed for determination of the light elements, such as hydrogen, boron, carbon, nitrogen, and oxygen [23–27]. These techniques were based on plasma sputtering or pyrolysis of the samples to convert them into a gaseous form, and spectroscopic analysis using radio-frequency discharges as a source of molecular emission excitation. The approach was mainly used for biochemical and agrochemical experiments with stable isotope tracers or labels. Laser induced breakdown spectroscopy (LIBS) offers ideal char- acteristics for real-time elemental analysis at atmospheric pressure [28–30]. Several studies were conducted for isotopic analysis but only at reduced pressure [31–34], except for measuring the deuterium/ hydrogen ratio [35]. Low pressure was necessary to minimize collisional, Stark and Doppler broadening of spectral lines; linewidths must be narrower than the isotopic shift. Broadening of spectral lines Spectrochimica Acta Part B 66 (2011) 99–104 ⁎ Corresponding author at: Lawrence Berkeley National Laboratory, University of California, Berkeley, CA 94720, USA. E-mail address: [email protected] (R.E. Russo). 0584-8547/$ – see front matter © 2011 Elsevier B.V. All rights reserved. doi:10.1016/j.sab.2011.01.007 Contents lists available at ScienceDirect Spectrochimica Acta Part B journal homepage: www.elsevier.com/locate/sab
Transcript of Spectrochimica Acta Part B - lbl.gov

Spectrochimica Acta Part B 66 (2011) 99–104
Contents lists available at ScienceDirect
Spectrochimica Acta Part B
j ourna l homepage: www.e lsev ie r.com/ locate /sab
Laser Ablation Molecular Isotopic Spectrometry
Richard E. Russo a,b,⁎, Alexander A. Bol'shakov b, Xianglei Mao a, Christopher P. McKay c,Dale L. Perry a, Osman Sorkhabi a
a Lawrence Berkeley National Laboratory, University of California, Berkeley, CA 94720, USAb Applied Spectra, Inc., 46661 Fremont Boulevard, Fremont, CA 94538, USAc NASA-Ames Research Center, Moffett Field, CA 94035, USA
⁎ Corresponding author at: Lawrence Berkeley NatiCalifornia, Berkeley, CA 94720, USA.
E-mail address: [email protected] (R.E. Russo).
0584-8547/$ – see front matter © 2011 Elsevier B.V. Aldoi:10.1016/j.sab.2011.01.007
a b s t r a c t
a r t i c l e i n f oArticle history:Received 20 December 2010Accepted 20 January 2011Available online 31 January 2011
Keywords:Optical isotopic measurementsLaser ablation plasmaMolecular emission spectraReal-time chemical analysisChemical analysisLAMIS
A new method of performing optical isotopic analysis of condensed samples in ambient air and at ambientpressure has been developed: Laser Ablation Molecular Isotopic Spectrometry (LAMIS). The technique usesradiative transitions from molecular species either directly vaporized from a sample or formed by associativemechanisms of atoms or ions in a laser ablation plume. This method is an advanced modification of a knownatomic emission technique called laser-induced breakdown spectroscopy (LIBS). The newmethod— LAMIS—can determine not only chemical composition but also isotopic ratios of elements in the sample. Isotopicmeasurements are enabled by significantly larger isotopic shifts found in molecular spectra relative to atomicspectra. Analysis can be performed from a distance and in real time. No sample preparation or pre-treatmentis required. Detection of the isotopes of hydrogen, boron, carbon, and oxygen are discussed to illustrate thetechnique.
onal Laboratory, University of
l rights reserved.
© 2011 Elsevier B.V. All rights reserved.
1. Introduction
Isotopic analysis is essential in medicine, chemistry, materialsscience, radiochemistry, archeology, and nuclear non-proliferation.Isotopic data provide answers to fundamental questions related toresearch and development in these disciplines as well as providingimportant insight into more applied fields. This paper presents theconcept and the first results obtained with newly developed LaserAblation Molecular Isotopic Spectrometry (LAMIS) technology forreal-time isotopic analyses of samples at ambient pressures. We havechosen diatomicmolecules containing hydrogen, boron, and carbon asexamples in this paper, but this approach can be easily extended toother diatomic and multi-atomic molecules. Benefits of such a laserbased technique are rapid and direct chemical characterization ofcondensed samples without chemical dissolution procedures. Theultimate goal is to demonstrate a new technique for isotopic analysiswith good discrimination, good sensitivity (down to ppm levels),with the potential for stand-off capability, and one that does notrequire (i) sample preparation or (ii) a vacuum environment for thesample.
Mass based isotopic measurements are well established andinclude IRMS [1,2], TIMS [3,4], SIMS [5], acceleratormass spectrometry
[6], GCMS [2,7], ICP-MS [8–10], and MALDI-MS [11]. High sensitivityand resolving power are characteristic of these mass spectrometrictechniques but they generally tend to be laboratory-based and requirecomplex sample preparation procedures. Laser ablation coupled withICP-MS [9,10,12–14] or laser desorption in MALDI-MS eliminates theneed for laborious sample preparation.
To some extent other elemental techniques also are useful forisotopic analysis. Examples include inductively coupled plasma —
atomic emission spectrometry [15,16], atomic absorption spectrometry(AAS) including tunable laser AAS [17,18] and laser-excited atomicfluorescence [19,20]. Doppler-free and other high-resolution lasertechniques have been detailed in several books [21,22]. Previously,optical spectroscopic techniques for isotopic analysis of both organicand inorganic samples were developed for determination of the lightelements, such as hydrogen, boron, carbon, nitrogen, and oxygen[23–27]. These techniqueswere based onplasma sputteringor pyrolysisof the samples to convert them into a gaseous form, and spectroscopicanalysis using radio-frequency discharges as a source of molecularemission excitation. The approachwasmainly used for biochemical andagrochemical experiments with stable isotope tracers or labels.
Laser induced breakdown spectroscopy (LIBS) offers ideal char-acteristics for real-time elemental analysis at atmospheric pressure[28–30]. Several studies were conducted for isotopic analysis but onlyat reduced pressure [31–34], except for measuring the deuterium/hydrogen ratio [35]. Low pressure was necessary to minimizecollisional, Stark and Doppler broadening of spectral lines; linewidthsmust be narrower than the isotopic shift. Broadening of spectral lines

100 R.E. Russo et al. / Spectrochimica Acta Part B 66 (2011) 99–104
in laser-generated plasmas is known to be primarily determined bythe Stark effect. At electron number density of ~1017 cm3, atomicspectral linewidths are typically ~0.01 nm. For example of isotopeshifts, uranium 235U and 238U have an isotopic shift 0.025 nm in theirrespective ionic emission lines at 424.412 nm and 424.437 nm. For theplutonium isotopes 239Pu and 240Pu, the isotopic shift is 0.005 nm atits emission line of 594.522 nm.
Isotopic shifts can be orders of magnitude larger in molecular thanatomic spectra [23–27,33] (Figs. 1 and 2). In Fig. 1, the left diagramshows the fine structure of the 2s2p2 2D levels of 11B (solid line). Thedashed lines represent the 10B levels. The directions of the 10B energylevel shifts with respect to the 11B levels are from Ref [36]. In Boron, thenet isotope effect of the ground state is zero and the ionization potentialhas the same value for the two isotopes [36]. The 11B–10B isotopic shiftfrom atomic emission lines for this transition is 0.46 cm−1, or 0.002 nm,which is several orders of magnitude smaller than the isotopic shiftmeasured for boronmonoxide. Themeasured shift for BO is113 cm−1 or0.73 nm for the B2Σ+ (v=0)→X2Σ+ (v=2) transition.
Atomic isotope shifts depend on the transition [37]. The data inFig. 2 represent prominent lines used in emission spectroscopy.Molecular isotope pairs (Fig. 2) used in this work are listed in Table 1.Molecular vibronic (i.e. vibrational, rotational, and electronic)emission wavelengths depend on the rotational and vibrationalenergy levels between two different electronic states (see Fig. 1):
υ = T′−T′′ = ðT′e−T′′eÞ + ðG′v−G′′vÞ + ðF′J−F′′JÞ ð1Þ
where the single primed symbols refer to the upper state and doubleprimed symbols refer to lower state; Te is the electronic energy, Gv is the
Fig. 1. Energy diagram of 2s2 2p 2P01/2, 3/2←2s2 2p 2D5/2,3/2 electronic transitions of atomic btransition is 0.46 cm−1 or 0.002 nm. The measured shift for the BO transition B2Σ+ (v=0)
vibrational energy, and FJ is the rotational energy. Expressions for G and Fcan be found in literature [38–41]; they can be used for spectrumsimulation and fitting to measured spectra, thus enabling calculation ofisotope abundances. The molecular emission intensity is the function oftemperature:
I = Cem
qv′v″SJ′J″
Qv′υ4e−E =kT ð2Þ
where Cem is the emission coefficient, qv′v″ is the Franck–Condon factorand SJ′J″ is the Hönl–London factor. Q is the partition function and υ is theoptical emission light frequency. E is the upper energy and k is theBoltzmann constant.
The effect of mass difference between isotopes is primarilyobserved in terms Gv and FJ of vibronic transitions, while for theelectronic component, Te the mass effect is significantly smaller.Consequently, molecular transitions involving change of vibrationaland rotational states can exhibit significantly larger isotopic shiftsthan atomic transitions which are purely electronic in nature (Fig. 2).Larger isotopic shifts significantly simplify measurement require-ments. Isotope ratio measurements from molecular spectra areadvantageous for light elements (Fig. 2) that are particularlyimportant for biological organic life sciences. For heavy elements,the molecular isotopic effect is smaller because it scales with thereduced mass of the formed molecules. Moreover, the vibrationaland rotational lines in heavy molecules are closer than in lightmolecules.
oron is shown on the left (not to scale). The measured 11B and 10B isotopic shift for this→X2Σ+ (v=2) is 113 cm−1 or 0.73 nm.
alexandb
Text Box
12
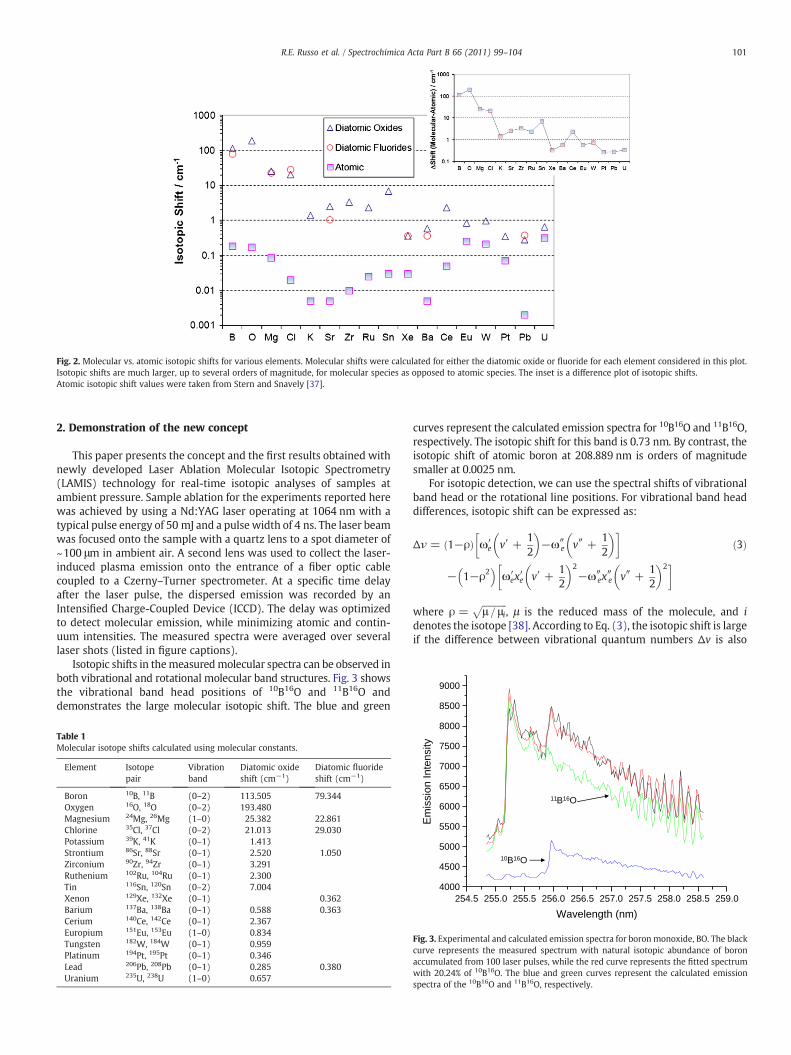
Fig. 2. Molecular vs. atomic isotopic shifts for various elements. Molecular shifts were calculated for either the diatomic oxide or fluoride for each element considered in this plot.Isotopic shifts are much larger, up to several orders of magnitude, for molecular species as opposed to atomic species. The inset is a difference plot of isotopic shifts.Atomic isotopic shift values were taken from Stern and Snavely [37].
8500
9000
101R.E. Russo et al. / Spectrochimica Acta Part B 66 (2011) 99–104
2. Demonstration of the new concept
This paper presents the concept and the first results obtained withnewly developed Laser Ablation Molecular Isotopic Spectrometry(LAMIS) technology for real-time isotopic analyses of samples atambient pressure. Sample ablation for the experiments reported herewas achieved by using a Nd:YAG laser operating at 1064 nm with atypical pulse energy of 50 mJ and a pulse width of 4 ns. The laser beamwas focused onto the sample with a quartz lens to a spot diameter of~100 μm in ambient air. A second lens was used to collect the laser-induced plasma emission onto the entrance of a fiber optic cablecoupled to a Czerny–Turner spectrometer. At a specific time delayafter the laser pulse, the dispersed emission was recorded by anIntensified Charge-Coupled Device (ICCD). The delay was optimizedto detect molecular emission, while minimizing atomic and contin-uum intensities. The measured spectra were averaged over severallaser shots (listed in figure captions).
Isotopic shifts in themeasuredmolecular spectra can be observed inboth vibrational and rotational molecular band structures. Fig. 3 showsthe vibrational band head positions of 10B16O and 11B16O anddemonstrates the large molecular isotopic shift. The blue and green
Table 1Molecular isotope shifts calculated using molecular constants.
Element Isotopepair
Vibrationband
Diatomic oxideshift (cm−1)
Diatomic fluorideshift (cm−1)
Boron 10B, 11B (0–2) 113.505 79.344Oxygen 16O, 18O (0–2) 193.480Magnesium 24Mg, 26Mg (1–0) 25.382 22.861Chlorine 35Cl, 37Cl (0–2) 21.013 29.030Potassium 39K, 41K (0–1) 1.413Strontium 86Sr, 88Sr (0–1) 2.520 1.050Zirconium 90Zr, 94Zr (0–1) 3.291Ruthenium 102Ru, 104Ru (0–1) 2.300Tin 116Sn, 120Sn (0–2) 7.004Xenon 129Xe, 132Xe (0–1) 0.362Barium 137Ba, 138Ba (0–1) 0.588 0.363Cerium 140Ce, 142Ce (0–1) 2.367Europium 151Eu, 153Eu (1–0) 0.834Tungsten 182W, 184W (0–1) 0.959Platinum 194Pt, 195Pt (0–1) 0.346Lead 206Pb, 208Pb (0–1) 0.285 0.380Uranium 235U, 238U (1–0) 0.657
curves represent the calculated emission spectra for 10B16O and 11B16O,respectively. The isotopic shift for this band is 0.73 nm. By contrast, theisotopic shift of atomic boron at 208.889 nm is orders of magnitudesmaller at 0.0025 nm.
For isotopic detection, we can use the spectral shifts of vibrationalband head or the rotational line positions. For vibrational band headdifferences, isotopic shift can be expressed as:
Δν = 1−ρð Þ�ω′
e v′ +12
� �−ω″
e v″ +12
� ��
− 1−ρ2� �
ω′ex′e v′ +
12
� �2−ω″
ex″e v″ +12
� �2��ð3Þ
where ρ =ffiffiffiffiffiffiffiffiffiffiffiμ = μi
p, μ is the reduced mass of the molecule, and i
denotes the isotope [38]. According to Eq. (3), the isotopic shift is largeif the difference between vibrational quantum numbers Δv is also
254.5 255.0 255.5 256.0 256.5 257.0 257.5 258.0 258.5 259.04000
4500
5000
5500
6000
6500
7000
7500
8000
Em
issi
on In
tens
ity
Wavelength (nm)
10B16O
11B16O
Fig. 3. Experimental and calculated emission spectra for boron monoxide, BO. The blackcurve represents the measured spectrum with natural isotopic abundance of boronaccumulated from 100 laser pulses, while the red curve represents the fitted spectrumwith 20.24% of 10B16O. The blue and green curves represent the calculated emissionspectra of the 10B16O and 11B16O, respectively.

102 R.E. Russo et al. / Spectrochimica Acta Part B 66 (2011) 99–104
large. When choosing vibrational band heads for isotopic detection,transitions with the largest Δv and reasonable emission intensitiesshould be used.
The emission spectra in Fig. 3 represent transitions of the (0, 2)band of the X2Σ+−B2Σ+ system for boron monoxide. These datawere measured from the plasma plume of a laser ablated solid pelletof boron nitride in air and at atmospheric pressure. The black line plotis the experimental spectrum of BO with the 11B and 10B ratio beingthe naturally occurring isotopic abundance of 80.2% and 19.8%,respectively. The other plots are calculated spectra using Eqs. (1)and (2). The results in Fig. 3 can be used to determine the isotopicconcentration and demonstrate the isotopic detection capabilities ofusing molecular emission. Using a least squares fitting technique, theexperimental data were fit by varying the isotopic fraction. The fitresulted in a calculated concentration of 20.2% for 10B, which is veryclose to the natural abundance of 19.8% for 10B.
Rotational structure also can be used for isotopic detection. Theisotopic shift for rotational energy in diatomic molecules is:
ΔF = ð1−ρ2Þ B′v J′ J′ + 1
−B′′v J″ J′′ + 1 ��
ð4Þ
According to Eq. (4), the isotopic shift depends on both vibrationaland rotational quantum numbers and increases with both J and v. Asan example, the wide range of boron monoxide rotational structurebetween 350 and 700 nm represent vibronic transitions of the BOA2Πi−X2Σ+ system. Fig. 4 shows a narrow spectral range of thissystem for enriched and naturally occurring boron monoxide whichresulted from the laser ablation of the following samples: 10B216O3
(99% 10B, red curve), 11B216O3 (95% 11B, green curve), and boron nitride(80.2% 11B and 19.8% 10B, the naturally occurring abundance for boron,black curve). Some of the lines observed in the spectrum of themixture of the two isotopes are attributed to 10B, while others belongto 11B. The strong line at 583.75 nm is indicative of 10B from the BOradical formed at the highest plasma temperature. As an example, thispeak may be used to identify 10B in a mixture of the two boronisotopes and to quantify isotopic concentration of 10B in the sample.
The concentration of individual isotopes also can be determinedusing Partial Least-Squares (PLS) calibration procedure. The PLS
583.5 584.0 584.5 585.0 585.50
100
200
300
400
500
B-O
em
issi
on
Wavelength (nm)
19.8% 10B + 80.2% 11B
99% 10B
95% 11B
Fig. 4. Boron monoxide rotational band spectra obtained from ablation of 10B2O3,11B2O3, and BN. The isotopic ratio of boron is the natural isotopic abundance for BN. Theblack curve represents boron oxide ro-vibronic emission with the natural isotopeabundance. The red and green curves represent the rotational-emission of the 10B16Oand 11B16O, respectively. The spectra from BN accumulated using 30 laser pulses andspectra from B2O3 accumulated using 60 laser pulses.
model for boron isotopes was established using ten LAMIS referencespectra. Each spectrum was accumulated from six laser pulses from10B2
16O3 (99% 10B) and 11B216O3 (95% 11B) samples. Boron nitride with
natural abundance was used as the unknown sample. Three laserpulses were accumulated for each spectra and ten of these spectrawere measured. The 11B concentration was calculated to be 80.5 ±0.9%. With this PLS calibration model, an estimated detection limitfor 10B isotope was approximately 1% in boron nitride.
In another experiment, vapors of ordinary water (H2O) and heavywater (D2O) were ablated; the OH and OD molecular emission fromthe plasma plume was measured. Molecular spectra in a laser-generated plasma become relatively stronger at longer time delays.The gate width of the ICCD detector was set to 60 μs with the delay of25 μs, contrary to a usual value of ~1 μs typically used for atomicemission detection in LIBS measurements. The data in Fig. 5 clearlydemonstrate the prominent spectral features of OH A2Σ+−X2Πi (0,0)transition at ~306 nm (R1, R2 branch heads) and ~309 nm (Q2 branchhead) with partially resolved individual rotational lines. The exper-imental shift between the Q2 branch heads of OH and OD isapproximately 0.68 nm. This shift is larger than the 0.18 nmseparation between H and D atomic lines at 656.29 and 656.11 nm,respectively. However, more important in this case is that thehydroxyl spectra are significantly less prone to Stark broadeningthan atomic lines of H and D. Spectral lines of light atoms such ashydrogen and deuterium can be broadened up to ~1 nmwidth in laserablation plasmas. Segregation of H and D has been measured in laserinduced and DC arc plasmas [34,42]. The possibility of segregationcould influence these molecular spectral measurements, and needs tobe investigated. However, at the long delay time and atmosphericpressure used in this work, multiple collisions between ablated andatmospheric species would likely equilibrate the spatial isotopicdistribution.
Simulation of the 16OH, 18OH, and 16OD vibronic spectrademonstrate that sufficient spectral resolution (~0.03 nm) to selec-tively detect all these species simultaneously can be attained withmodern compact echelle-based spectrometers. In laser ablation, thenumber density of species vaporized in each laser shot is usually 1015–1019 cm−3. Most of the molecular species in a plume ejected fromwater are expected to be 16OH. Following the isotopic abundances, thenumber of 18OH radicals will be approximately 500 times less.Therefore, the estimated 18OH number density of at least ~1012 cm−3
in a laser-vaporized plume from water ice can be expected. Such
305.5 306.0 306.5 307.0 307.5 308.0 308.5 309.0 309.5 310.0
0
10000
Em
issi
on s
pect
ra
Wavelength (nm)
O-D O-H
Fig. 5. Emission band of OH and OD generated from water and deuterium monoxide,respectively. The green curve represents the OH spectrum, while the red curve representthe OD spectrum. Spectra accumulated from 600 laser pulses.
103R.E. Russo et al. / Spectrochimica Acta Part B 66 (2011) 99–104
quantities of species are readily detectable in emission spectroscopy.The real-time determination of oxygen isotopes from ice will be ofsignificant consequence to studies in paleoclimatology, hydrogeologyand glaciology.
Additional experiments were performed to measure carbon iso-topes. LAMIS measurements of carbon isotopic signatures wereaccomplished using diatomic CN and C2 radicals that are known toform effectively in laser ablation plumes and are among the well-investigated species. The experiments were performed with regulargraphite (99% 12C) and isotopically enriched urea (99% 13C) as theablation samples. The C2 from the sample and N2 from ambient air arethe precursors for CN formation in laser ablation plasma. The CNradicalsare generated in comparable abundance toC2 and both these species areroutinely observed in LIBS of carbon-containing samples. At near-threshold ablation of graphite, vapor in the plume is dominated by C2and C3 radicals that are directly ejected as the intact molecules.Evaporation of carbon in the molecular versus atomic form isthermodynamically favored because of relatively high bond energiesof C2 and C3. With the increasing laser fluence, molecular emissionremains roughly constant while atomic carbon emission increasesdrastically indicating themajor fraction of the plume becomes atomized[43].
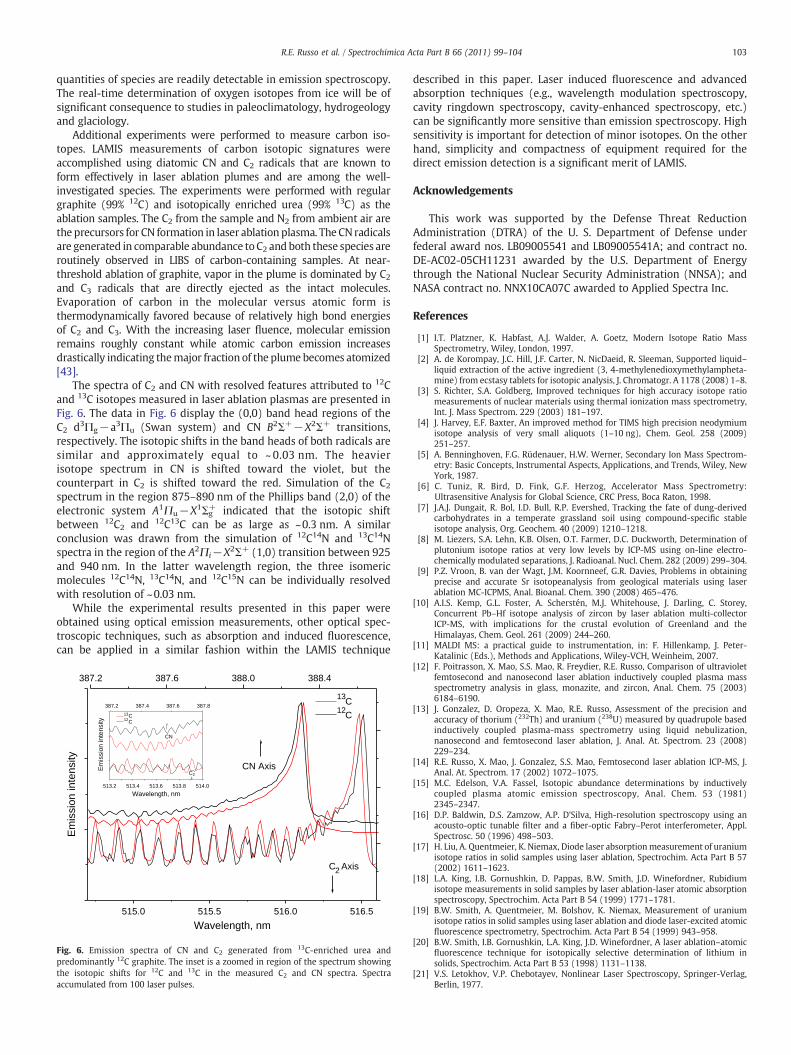
The spectra of C2 and CN with resolved features attributed to 12Cand 13C isotopes measured in laser ablation plasmas are presented inFig. 6. The data in Fig. 6 display the (0,0) band head regions of theC2 d3Πg−a3Πu (Swan system) and CN B2Σ+−X2Σ+ transitions,respectively. The isotopic shifts in the band heads of both radicals aresimilar and approximately equal to ~ 0.03 nm. The heavierisotope spectrum in CN is shifted toward the violet, but thecounterpart in C2 is shifted toward the red. Simulation of the C2spectrum in the region 875–890 nm of the Phillips band (2,0) of theelectronic system A1Πu−X1Σg
+ indicated that the isotopic shiftbetween 12C2 and 12C13C can be as large as ~0.3 nm. A similarconclusion was drawn from the simulation of 12C14N and 13C14Nspectra in the region of the A2Πi−X2Σ+ (1,0) transition between 925and 940 nm. In the latter wavelength region, the three isomericmolecules 12C14N, 13C14N, and 12C15N can be individually resolvedwith resolution of ~0.03 nm.
While the experimental results presented in this paper wereobtained using optical emission measurements, other optical spec-troscopic techniques, such as absorption and induced fluorescence,can be applied in a similar fashion within the LAMIS technique
515.0 515.5 516.0 516.5
Wavelength, nm
13C
12C
387.2 387.6 388.0 388.4
C2 Axis
CN Axis
513.2 513.4 513.6 513.8 514.0
Wavelength, nm
13C 12C
387.2 387.4 387.6 387.8
C2
CN
Em
issi
on in
tens
ity
Em
issi
on in
tens
ity
Fig. 6. Emission spectra of CN and C2 generated from 13C-enriched urea andpredominantly 12C graphite. The inset is a zoomed in region of the spectrum showingthe isotopic shifts for 12C and 13C in the measured C2 and CN spectra. Spectraaccumulated from 100 laser pulses.
described in this paper. Laser induced fluorescence and advancedabsorption techniques (e.g., wavelength modulation spectroscopy,cavity ringdown spectroscopy, cavity-enhanced spectroscopy, etc.)can be significantly more sensitive than emission spectroscopy. Highsensitivity is important for detection of minor isotopes. On the otherhand, simplicity and compactness of equipment required for thedirect emission detection is a significant merit of LAMIS.
Acknowledgements
This work was supported by the Defense Threat ReductionAdministration (DTRA) of the U. S. Department of Defense underfederal award nos. LB09005541 and LB09005541A; and contract no.DE-AC02-05CH11231 awarded by the U.S. Department of Energythrough the National Nuclear Security Administration (NNSA); andNASA contract no. NNX10CA07C awarded to Applied Spectra Inc.
References
[1] I.T. Platzner, K. Habfast, A.J. Walder, A. Goetz, Modern Isotope Ratio MassSpectrometry, Wiley, London, 1997.
[2] A. de Korompay, J.C. Hill, J.F. Carter, N. NicDaeid, R. Sleeman, Supported liquid–liquid extraction of the active ingredient (3, 4-methylenedioxymethylampheta-mine) from ecstasy tablets for isotopic analysis, J. Chromatogr. A 1178 (2008) 1–8.
[3] S. Richter, S.A. Goldberg, Improved techniques for high accuracy isotope ratiomeasurements of nuclear materials using thermal ionization mass spectrometry,Int. J. Mass Spectrom. 229 (2003) 181–197.
[4] J. Harvey, E.F. Baxter, An improved method for TIMS high precision neodymiumisotope analysis of very small aliquots (1–10 ng), Chem. Geol. 258 (2009)251–257.
[5] A. Benninghoven, F.G. Rüdenauer, H.W. Werner, Secondary Ion Mass Spectrom-etry: Basic Concepts, Instrumental Aspects, Applications, and Trends, Wiley, NewYork, 1987.
[6] C. Tuniz, R. Bird, D. Fink, G.F. Herzog, Accelerator Mass Spectrometry:Ultrasensitive Analysis for Global Science, CRC Press, Boca Raton, 1998.
[7] J.A.J. Dungait, R. Bol, I.D. Bull, R.P. Evershed, Tracking the fate of dung-derivedcarbohydrates in a temperate grassland soil using compound-specific stableisotope analysis, Org. Geochem. 40 (2009) 1210–1218.
[8] M. Liezers, S.A. Lehn, K.B. Olsen, O.T. Farmer, D.C. Duckworth, Determination ofplutonium isotope ratios at very low levels by ICP-MS using on-line electro-chemically modulated separations, J. Radioanal. Nucl. Chem. 282 (2009) 299–304.
[9] P.Z. Vroon, B. van der Wagt, J.M. Koornneef, G.R. Davies, Problems in obtainingprecise and accurate Sr isotopeanalysis from geological materials using laserablation MC-ICPMS, Anal. Bioanal. Chem. 390 (2008) 465–476.
[10] A.I.S. Kemp, G.L. Foster, A. Scherstén, M.J. Whitehouse, J. Darling, C. Storey,Concurrent Pb–Hf isotope analysis of zircon by laser ablation multi-collectorICP-MS, with implications for the crustal evolution of Greenland and theHimalayas, Chem. Geol. 261 (2009) 244–260.
[11] MALDI MS: a practical guide to instrumentation, in: F. Hillenkamp, J. Peter-Katalinic (Eds.), Methods and Applications, Wiley-VCH, Weinheim, 2007.
[12] F. Poitrasson, X. Mao, S.S. Mao, R. Freydier, R.E. Russo, Comparison of ultravioletfemtosecond and nanosecond laser ablation inductively coupled plasma massspectrometry analysis in glass, monazite, and zircon, Anal. Chem. 75 (2003)6184–6190.
[13] J. Gonzalez, D. Oropeza, X. Mao, R.E. Russo, Assessment of the precision andaccuracy of thorium (232Th) and uranium (238U) measured by quadrupole basedinductively coupled plasma-mass spectrometry using liquid nebulization,nanosecond and femtosecond laser ablation, J. Anal. At. Spectrom. 23 (2008)229–234.
[14] R.E. Russo, X. Mao, J. Gonzalez, S.S. Mao, Femtosecond laser ablation ICP-MS, J.Anal. At. Spectrom. 17 (2002) 1072–1075.
[15] M.C. Edelson, V.A. Fassel, Isotopic abundance determinations by inductivelycoupled plasma atomic emission spectroscopy, Anal. Chem. 53 (1981)2345–2347.
[16] D.P. Baldwin, D.S. Zamzow, A.P. D'Silva, High-resolution spectroscopy using anacousto-optic tunable filter and a fiber-optic Fabry–Perot interferometer, Appl.Spectrosc. 50 (1996) 498–503.
[17] H. Liu, A. Quentmeier, K. Niemax, Diode laser absorptionmeasurement of uraniumisotope ratios in solid samples using laser ablation, Spectrochim. Acta Part B 57(2002) 1611–1623.
[18] L.A. King, I.B. Gornushkin, D. Pappas, B.W. Smith, J.D. Winefordner, Rubidiumisotope measurements in solid samples by laser ablation-laser atomic absorptionspectroscopy, Spectrochim. Acta Part B 54 (1999) 1771–1781.
[19] B.W. Smith, A. Quentmeier, M. Bolshov, K. Niemax, Measurement of uraniumisotope ratios in solid samples using laser ablation and diode laser-excited atomicfluorescence spectrometry, Spectrochim. Acta Part B 54 (1999) 943–958.
[20] B.W. Smith, I.B. Gornushkin, L.A. King, J.D. Winefordner, A laser ablation–atomicfluorescence technique for isotopically selective determination of lithium insolids, Spectrochim. Acta Part B 53 (1998) 1131–1138.
[21] V.S. Letokhov, V.P. Chebotayev, Nonlinear Laser Spectroscopy, Springer-Verlag,Berlin, 1977.
104 R.E. Russo et al. / Spectrochimica Acta Part B 66 (2011) 99–104
[22] E.W. Otten, Investigation of Short-Lived Isotopes by Laser Spectroscopy, HarwoodAcademic Publishers, Chur, 1989.
[23] N.A. Zakorina, G.S. Lazeeva, A.A. Petrov, Spectroscopic determination of theisotopic composition of boron trifluoride, J. Nucl. Energy 21 (1967) 309–313.
[24] N.A. Zakorina, A.A. Petrov, Isotopic spectral analysis of oxygen in a hot hollowcathode, J. Appl. Spectrosc. 23 (1975) 1157–1160.
[25] G.S. Lazeeva, A.A. Petrov, R.V. Khomyakov, Spectral-isotope method for deter-mining carbon in biological objects, J. Appl. Spectrosc. 25 (1976) 1199–1205.
[26] G.S. Lazeeva, V.M. Nemets, A.A. Petrov, Spectral-isotopic method of determinationof gas-forming elements in organic and inorganic substances, Spectrochim. ActaPart B 36 (1981) 1233–1242.
[27] V.M. Nemets, I.A. Rodushkin, A.A. Solov'ev, V.N. Funtov, Isotopic carbon analysisusing the C2 molecule spectrum, J. Appl. Spectrosc. 52 (1990) 461–465.
[28] R.E. Russo, X. Mao, C. Liu, J. Gonzalez, Laser assisted plasma spectrochemistry:laser ablation, J. Anal. Atom. Spectrom. 19 (2004) 1084–1089.
[29] R.E. Russo, X. Mao, S.S. Mao, The physics of laser ablation in microchemicalanalysis, Anal. Chem. 74 (2002) 70A–77A.
[30] R.W. Bogue, Boom time for LIBS technology, Sensor Rev. 24 (2004) 353–357.[31] W. Pietsch, A. Petit, A. Briand, Isotope ratio determination of uranium by optical
emission spectroscopy on a laser-produced plasma — basic investigations andanalytical results, Spectrochim. Acta Part B 53 (1998) 751–761.
[32] C.A. Smith, M.A. Martinez, D.K. Veirs, D.A. Cremers, Pu-239/Pu-240 isotope ratiosdetermined using high resolution emission spectroscopy in a laser-inducedplasma, Spectrochim. Acta Part B 57 (2002) 929–937.
[33] H. Niki, T. Yasuda, I. Kitazima, Measurement technique of boron isotopic ratio bylaser-induced breakdown spectroscopy, J. Nucl. Sci. Technol. 35 (1998) 34–39.
[34] L. Mercadier, J. Hermann, C. Grisolia, A. Semerok, Plume segregation observed inhydrogen and deuterium containing plasmas produced by laser ablation of carbonfiber tiles from a fusion reactor, Spectrochim. Acta Part B 65 (2010) 715–720.
[35] A. D'Ulivo, M. Onor, E. Pitzalis, R. Spiniello, L. Lampugnani, G. Cristoforetti, S.Legnaioli, V. Palleschi, A. Salvetti, E. Tognoni, Determination of the deuterium/hydrogen ratio in gas reaction products by laser-induced breakdown spectros-copy, Spectrochim. Acta Part B 61 (2006) 797–802.
[36] B. Edian, A. Olme, G. Herzberga, J.W.C. Johns, Ionization potential of boron, and theisotopic and fine structure of 2s2p2 2D, J. Opt. Soc. Am. 60 (1970) 889.
[37] R.C. Stern, B.B. Snavely, The Laser Isotope Separation Program at LawrenceLivermore Laboratory, Ann. NY Acad. Sci. 267 (1976) 71–79.
[38] G. Herzberg, Molecular spectra and molecular structure, I, Spectra of DiatomicMolecules, 2nd Ed., Van Nostrand Reinhold, New York, 1950.
[39] E.L. Hill, J.H. Van Vleck, On the quantum mechanics of the rotational distortion ofmultiplets in molecular spectra, Phys. Rev. 32 (1928) 250.
[40] J.H. Van Vleck, On σ-type doubling and electron spin in the spectra of diatomicmolecules, Phys. Rev. 33 (1929) 467–506.
[41] J.H. Van Vleck, The coupling of angular momentum vectors in molecules, Rev.Mod. Phys. 23 (1951) 213–227.
[42] D. Vukanovic, V. Vukanovic, On the behaviour of hydrogen isotopes in a d.c. arcplasma, Spectrochim. Acta Part B 24 (1969) 579–683.
[43] L. St-Onge, R. Sing, S. Béchard, M. Sabsabi, Carbon emissions following 1.064 μmlaser ablation of graphite and organic samples in ambient air, Appl. Phys. A 69(1999) S913–S916.
alexandb
Text Box
,


![Spectrochimica Acta Part A: Molecular and Biomolecular ...download.xuebalib.com/xuebalib.com.22323.pdf · shape and chemical compositions [3,4]. The semiconductors have been applied](https://static.fdocuments.us/doc/165x107/601f18c7480ec35b366b3c38/spectrochimica-acta-part-a-molecular-and-biomolecular-shape-and-chemical-compositions.jpg)