Spectral properties and rotational spectral heterogeneity ... · Spectral properties and rotational...
14
JOURNAL OF GEOPHYSICAL RESEARCH, VOL. 101, NO. El, PAGES 2201-2214, JANUARY 25, 1996 Spectral properties and rotational spectral heterogeneity of 433 Eros Scott L. Murchie AppliedPhysics Laboratory, The Johns Hopkins University, Laurel,Maryland Carle M. Pieters Department of Geological Sciences, Brown University, Providence• Rhode Island Abstract. Composite spectra of different rotational aspects of the S asteroid 433 Eros were assembled fromprevious studies, covering thewavelength range 0ø33-2.5 grn. These dataallow us to measure significant attributes of Eros's spectrum• its maficmineral absorptions, andthe degree and nature of compositional heterogeneity of its surfaceo We also evaluated previous S- asteroid taxonomies using independent methods• andf_rom thistestdete__rrnined that the taxonomy of Gaffey et al. [1993] provides a sound basis for relating Eros to other S asteroids. On average, Eros resembles the S(IV) asteroids, whichbearthe closest resemblance to ordinary chondrites in maficmineralogy• However• Eros alsoexhibits distinct rotational spectral variations comparable to the greatest yet recognized on an S asteroid. One side of the asteroid has a shorter-wavelength 1-pm absorption anda stronger 2-grn absorption thanthe globat average, andis interpreted to be richer in pyroxene; the opposite facehasa longer-wavelength I-grn absorption anda weaker 2-grn absorption, andis interpreted to be richerin olivineo The pyroxene-rich side coincides with a facet-like faceidentified in radar studies, andtheolivine-hch side coincides with a convex-shaped face. Each side of theasteroid exhibits spectral affinities with a different spectral class of S asteroids, demonstrating that such subdivisions of S asteroids represent different parts of a compositional continuum. High spatial resolution measurement of the mineralogic andelemental compositions andespecially the geologic settings of these different materials by theNear-Earth Asteroid Rendezvous mission will provide a great advance in the understanding of the originand evolution of a candidate ordinary chondrite parent body. Introduction The rendezvous of the Near Earth Asteroid Rendezvous (NEAR) spacecraft with asteroid 433 Eros will representthe first detailed investigation of an asteroid from a spacecraft [Cheng, 1995]. Previous flyby encounters of Galileo with main-belt asteroids951 Gaspra [Belton et al., 1992] and 243 Ida [Belton et al•, 1994] provided moderate resolution CCD imagery of surface morphology, some color imagery that revealed variations in the asteroids'surface properties, and limited compositional information from a near-•nfrared imaging spectrometer [Granahan et al., 1994, 1995]• NEAR's investigation of Eros will be a totally different class of encounter, providing the first spacecraft investigation of a near-earth asteroid,and the first global coverage of an asteroid akin to Viking coverage of Mars and Magellan coverage of Venus. The instrument complement of NEAR is designed simultaneously to provide very high resolution multicolor imaging of the asteroid surfhce, and to measure both mineralogicaland elemental composition using near-infrared, X-ray, and y-ray spectrometers [Veverka et al., 1995; Trombka et al., 1995]. Prior to undertaking this first global studyof an asteroid, it is necessary to understand the nature of Eros and to place it Copyright 1996 by the American Geophysical Union. Papernumber95JE03438. 0148-0227/96/95JE-03438505.00 into an accurate context among other asteroids. Perhaps no other small asteroid has been so thoroughly characterizedby remote sensing studies, largely by virtue of its 1975 opposition when it was at an unusually close range to earth• Theseinclude measurement of three-, five-, and eight-color spectral properties in the extended visiblewavelength range [Millis et al., 1976; Wisniewski, 1976; Miner and Young• 1976; Zellner et al.•. 1985], moderate spectral resolution (including "24-color") measurements over the same wavelength rangeat differentrotational phases [Wisniewski, 1976; Pieters et al., 1976], high spectralresolution CCD spectra [Vilas and MCFadden, 1992], low spectral resolution near-infrared (NIR) reflectance measurements [Veeder et al., 1976], high spectral resolution NIR spectra at different rotational phases [Larson et al., 1976], polarimetric observations [Zellner and Gradie, 1976], mid- and thermal- infraredobservations [Morrison, 1976; Lebofsky and Rieke, 1979], andradar observations [Campbell et al., 1976; Jurgens and Goldstein, 1976;Ostro et al., 1990]. These studies show thatEros is a member of the S spectral class [Zellner et al., 1985]• Its geometric albedo at 0.56 gm hasbeenestimated as 0.18+0.03 [Jones and Morrison, 1974; Morrison, 1976], 0.17+0.01 [Zellner and Gradie, 1976], 0.19+0.01 [Zellner, 1976], and 0.125+0.025[Lebofsky and Rieke, 1979]. Thermal and polarimetric properties are consistent with a medium-grained regolith with a component of either largerfragments or barerock [Zellner and Gradie• 1976; Morrison, 1976;Lebofskyand Rieke, 1979]. The dimensions of Eros have been estimated as 36x15x13 km 2201
Transcript of Spectral properties and rotational spectral heterogeneity ... · Spectral properties and rotational...
JOURNAL OF GEOPHYSICAL RESEARCH, VOL. 101, NO. El, PAGES 2201-2214, JANUARY 25, 1996
Spectral properties and rotational spectral heterogeneity of 433 Eros
Scott L. Murchie
Applied Physics Laboratory, The Johns Hopkins University, Laurel, Maryland
Carle M. Pieters
Department of Geological Sciences, Brown University, Providence• Rhode Island
Abstract. Composite spectra of different rotational aspects of the S asteroid 433 Eros were assembled from previous studies, covering the wavelength range 0ø33-2.5 grn. These data allow us to measure significant attributes of Eros's spectrum• its mafic mineral absorptions, and the degree and nature of compositional heterogeneity of its surfaceo We also evaluated previous S- asteroid taxonomies using independent methods• and f_rom this test dete__rrnined that the taxonomy of Gaffey et al. [1993] provides a sound basis for relating Eros to other S asteroids. On average, Eros resembles the S(IV) asteroids, which bear the closest resemblance to ordinary chondrites in mafic mineralogy• However• Eros also exhibits distinct rotational spectral variations comparable to the greatest yet recognized on an S asteroid. One side of the asteroid has a shorter-wavelength 1-pm absorption and a stronger 2-grn absorption than the globat average, and is interpreted to be richer in pyroxene; the opposite face has a longer-wavelength I-grn absorption and a weaker 2-grn absorption, and is interpreted to be richer in olivineo The pyroxene-rich side coincides with a facet-like face identified in radar studies, and the olivine-hch side coincides with a convex-shaped face. Each side of the asteroid exhibits spectral affinities with a different spectral class of S asteroids, demonstrating that such subdivisions of S asteroids represent different parts of a compositional continuum. High spatial resolution measurement of the mineralogic and elemental compositions and especially the geologic settings of these different materials by the Near-Earth Asteroid Rendezvous mission will provide a great advance in the understanding of the origin and evolution of a candidate ordinary chondrite parent body.
Introduction
The rendezvous of the Near Earth Asteroid Rendezvous
(NEAR) spacecraft with asteroid 433 Eros will represent the first detailed investigation of an asteroid from a spacecraft [Cheng, 1995]. Previous flyby encounters of Galileo with main-belt asteroids 951 Gaspra [Belton et al., 1992] and 243 Ida [Belton et al•, 1994] provided moderate resolution CCD imagery of surface morphology, some color imagery that revealed variations in the asteroids' surface properties, and limited compositional information from a near-•nfrared imaging spectrometer [Granahan et al., 1994, 1995]• NEAR's investigation of Eros will be a totally different class of encounter, providing the first spacecraft investigation of a near-earth asteroid, and the first global coverage of an asteroid akin to Viking coverage of Mars and Magellan coverage of Venus. The instrument complement of NEAR is designed simultaneously to provide very high resolution multicolor imaging of the asteroid surfhce, and to measure both mineralogical and elemental composition using near-infrared, X-ray, and y-ray spectrometers [Veverka et al., 1995; Trombka et al., 1995].
Prior to undertaking this first global study of an asteroid, it is necessary to understand the nature of Eros and to place it
Copyright 1996 by the American Geophysical Union.
Paper number 95JE03438. 0148-0227/96/95JE-03438505.00
into an accurate context among other asteroids. Perhaps no other small asteroid has been so thoroughly characterized by remote sensing studies, largely by virtue of its 1975 opposition when it was at an unusually close range to earth• These include measurement of three-, five-, and eight-color spectral properties in the extended visible wavelength range [Millis et al., 1976; Wisniewski, 1976; Miner and Young• 1976; Zellner et al.•. 1985], moderate spectral resolution (including "24-color") measurements over the same wavelength range at different rotational phases [Wisniewski, 1976; Pieters et al., 1976], high spectral resolution CCD spectra [Vilas and MCFadden, 1992], low spectral resolution near-infrared (NIR) reflectance measurements [Veeder et al., 1976], high spectral resolution NIR spectra at different rotational phases [Larson et al., 1976], polarimetric observations [Zellner and Gradie, 1976], mid- and thermal- infrared observations [Morrison, 1976; Lebofsky and Rieke, 1979], and radar observations [Campbell et al., 1976; Jurgens and Goldstein, 1976; Ostro et al., 1990].
These studies show that Eros is a member of the S spectral class [Zellner et al., 1985]• Its geometric albedo at 0.56 gm has been estimated as 0.18+0.03 [Jones and Morrison, 1974; Morrison, 1976], 0.17+0.01 [Zellner and Gradie, 1976], 0.19+0.01 [Zellner, 1976], and 0.125+0.025 [Lebofsky and Rieke, 1979]. Thermal and polarimetric properties are consistent with a medium-grained regolith with a component of either larger fragments or bare rock [Zellner and Gradie• 1976; Morrison, 1976; Lebofsky and Rieke, 1979]. The dimensions of Eros have been estimated as 36x15x13 km
2201

2202 MURC• AND PIETERS' SPECTRUM AND HETEROGE•ITY OF 433 EROS
[Zellner, 1976] or 39x16 km [LeboJ•ky and Rieke, 1979] using polarimetry and photometry, 35x16 km using radar [Ostro et al., 1990], and 40x14 km using speckle interferometry [Drummond et al., 1985]. The shape is nonaxisymmetric, with one of its elongate faces being relatively flat and the other highly convex [Ostro et al., 1990].
Differing studies have yielded different conclusions about the presence and nature of spectral heterogeneity on the surface. Some find no evidence for spectral variations [Millis et al., 1976; Miner and Young, 1976; Veeder et al., 1976; Larson et al., 1976], while others note a shift in the band minimum of the 1-•tm mafic mineral absorption with rotational phase [Wisniewski, 1976; Pieters et al., 1976]. The latter studies suggest that one face of Eros exhibits a somewhat stronger absorption at a shorter wavelength whereas the other face exhibits a shallower longer-wavelength absorption, implying differences in mineralogy on a regional or hemispheric scale. Interestingly, these studies had not previously been integrated to produce a high spectral resolution reflectance spectrum covering both extended visible and NIR wavelengths. Such data are necessary to assess the position and character of the 1-wn and 2-!.tm mafic mineral absorptions which are indicative of the composition and relative abundance of mafic mineral phases.
In this study we first examine the classification of S asteroids into different spectral-compositional groupings, in order to identify a sound framework for relating Eros to other S asteroids. We then combine previously acquired spectral data covering the extended visible and NIR wavelength ranges to derive a composite spectrum of Eros from 0.33 to 2.5 !xm, and to examine the question of spectral variations with rotational phase. We use these data to address the questions: What is the nature of Eros? Is it compositionally homogeneous or heterogeneous? If there are heterogeneities, how are they distributed across the surface? How is Eros related to other members of the S asteroid classes? Finally, we examine the implications of our results for investigation of Eros by the NEAR mission.
Background
The S Class of Asteroids
The S class of asteroids was first defined by Chapman et al. [1975] based on albedo, spectral, and polarimetric propertiesø The basic spectral attributes of the class are a moderate albedo, a relatively red continuum slope (reflecting more light at longer wavelengths), and broad absorptions near 1 !.tm and 2 !.tm (Figure 1). These attributes are characteristic of mixtures of olivine, pyroxene, and probably Ni-Fe metal. S asteroids dominate the inner main melt and constitute a significant fraction of near-Earth asteroids, and are thus a huge potential reservoir of meteorite materials.
The metal-olivine-pyroxene assemblage of S asteroids is also present in meteorite types with highly divergent histories, and substantial debate has arisen regarding the connection between S asteroids and various classes of
meteorites. One school of thought focuses on the relative abundances of different meteorite and asteroid types. It holds that because this mineral assemblage is shared with the most common type of meteorites, primitive undifferentiated ordinary chondrites, the most common type of nearby asteroids (S) is the logical source [e.g., Wetherill and
z0% Representative S Asteroid Spectra
. 1036 Ganymed = "Sp"
.... I .... I .... I .... I ' '' ' I '' ''
0 0.5 1.0 1.5 2.0 2.5 3.0 Wavelength in Microns
Figure 1. Representative spectra of S asteroids spanning the range of variability in 1-!.tm absorption center and 2-!.tm absorption depth. Data are scaled to unity at 0.56 Abbreviations are from Howell et al. [1994] and denote the mineralogy inferred from overall spectral character: 114 Amalthea (So) is rich in olivine, 1036 Ganymed (Sp) is rich in pyroxene, and 7 Iris (S) has an intermediate composition. Note the decreasing Band II strength and shift in Band I position with the increase in inferred olivine contenL
Chapman, 1988]. However, spectrally the S asteroids exhibit a redder continuum and weaker absorption bands than do the ordinary chondrites measured in terrestrial laboratoriesø The difference in spectral properties is attributed to optical alteration that reddens and decreases absorption band depth in asteroidal regoliths, or "space weathering" [Pieters et al., 1993]. The other school of thought focuses on the spectral properties of the asteroids, and mineralogic interpretations that do not require space weathering effects [Bell et al., 1989; Gaffey et al., 1989]. The meteorites most closely resembling the S asteroids are stony-iron meteorites, which have undergone varying degrees of igneous melting and separation of mineral phases. Ordinary chondrites then derive either or both from a minority of S asteroids or from the very uncommon Q asteroids, which are in orbits that are
dynamically favorable for delivery of impact-ejected meteoritic fragments to Earth [e.g., McFadden et al., 1984; Bell and Keil, 1988; Bell et al., 1989; Gaffey et al., 1993; Hiroi et al., 1993; Bell, 1995]. The implications of either model for the origin and evolution of S asteroids and their relation to meteorite classes are profound: in the first case, S asteroids are little evolved since their accretion and are well sampled by meteorites, but in the second case the S asteroids represent fragments of relatively evolved parent bodies that are poorly sampled by meteorites.
Key S Asteroid Spectral Properties
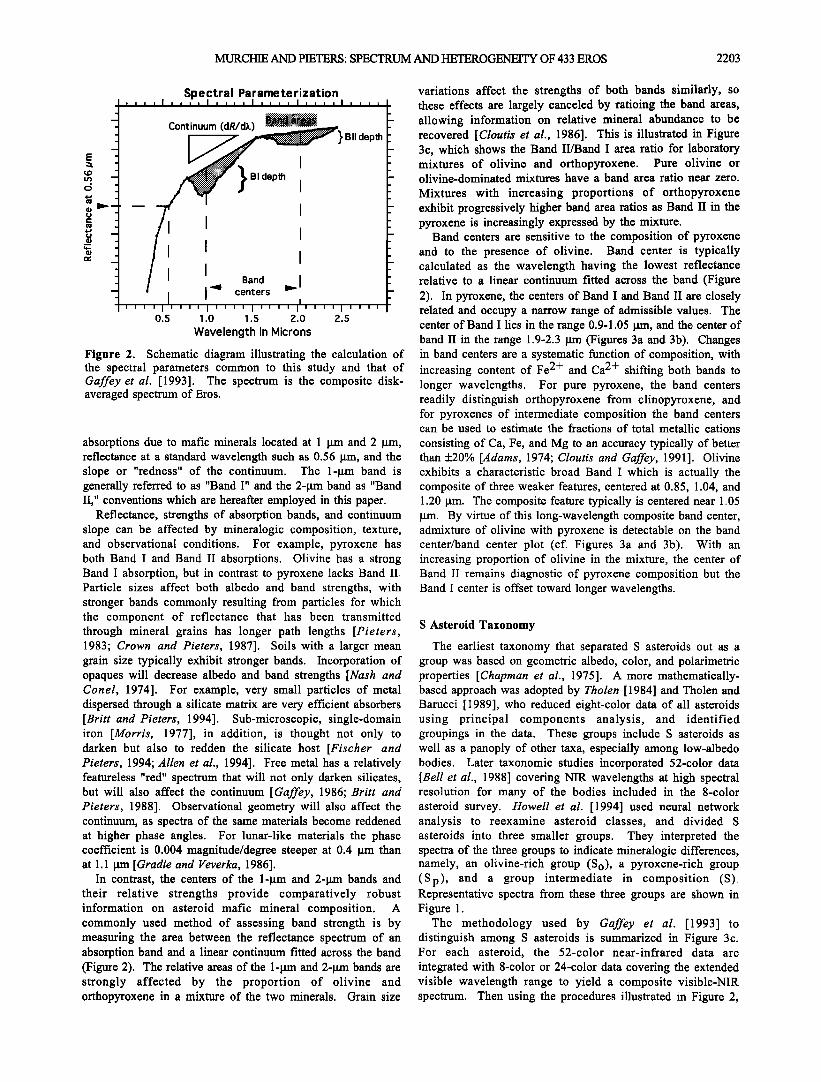
Objectively approaching the subject of S asteroid composition and compositional diversity requires sorting those aspects of spectroscopic data which are relatively clear in significance from those which are ambiguousø The key spectral attributes of S asteroids are illustrated in Figure 2. These include the strength and wavelength position of
MURCHIE AND PIETEILS: SPECTRUM AND HETEROGENEITY OF 433 EROS 2203
E
S,p,e •ct, r ,a I P, ara, mete r•ization , , , , I , , , , , ,
- Continuum (Ur/U i"?i'ii?iii?½i'iIiiiii'iiit'iiiii "-- •"" '"•'•'••;•} B II depth ' .
- epth ..-- -
•.- __ _- .
--. -
.
-' ' I I" centers "' - 0.5 1.0 1.5 2.0 2.5
Wavelength in Microns
Figure 2. Schematic diagram illustrating the calculation of the spectral parameters common to this study and that of Gaffey et al. [1993]. The spectrum is the composite disk- averaged spectrum of Eros.
absorptions due to mafic minerals located at 1 gm and 2 gm, reflectance at a standard wavelength such as 0.56 •xm, and the slope or "redness" of the continuum. The 1-•xm band is generally referred to as "Band I" and the 2-grn band as "Band II," conventions which are hereafter employed in this papero
Reflectance, strengths of absorption bands, and continuum slope can be affected by mineralogic composition, texture, and observational conditions. For example, pyroxene has both Band I and Band II absorptions. Olivine has a strong Band I absorption, but in contrast to pyroxene lacks Band 11o Particle sizes affect both albedo and band strengths, with stronger bands commonly resulting from particles for which the component of reflectance that has been transmitted through mineral grains has longer path lengths [Pieters, 1983; Crown and Pieters, 1987]. Soils with a larger mean grain size typically exhibit stronger bands. Incorporation of opaques will decrease albedo and band strengths [Nash and Conel, 1974]. For example, very small particles of metal dispersed through a silicate matrix are very efficient absorbers [Britt and Pieters, 1994]. Sub-microscopic, single-domain iron [Morris, 1977], in addition, is thought not only to darken but also to redden the silicate host [Fischer and Pieters, 1994; Allen et al., 1994]. Free metal has a relatively featureless "red" spectrum that will not only darken silicates, but will also affect the continuum [Gaffey, 1986; Britt and Pieters, 1988]. Observational geometry will also affect the continuum, as spectra of the same materials become reddened at higher phase angles. For lunar-like materials the phase coefficient is 0.004 magnitude/degree steeper at 004 •xm than at 1.1 Ixrn [Gradie and Veverka, 1986].
In contrast, the centers of the 1-gm and 2-grn bands and their relative strengths provide comparatively robust information on asteroid mafic mineral composition. A commonly used method of assessing band strength is by measuring the area between the reflectance spectrum of an absorption band and a linear continuum fitted across the band (Figure 2). The relative areas of the 1-grn and 2dxm bands are strongly affected by the proportion of olivine and orthopyroxene in a mixture of the two minerals. Grain size
variations affect the strengths of both bands similarly, so these effects are largely canceled by ratioing the band areas, allowing information on relative mineral abundance to be recovered [Cloutis et al., 1986]. This is illustrated in Figure 3c, which shows the Band II/Band I area ratio for laboratory mixtures of olivine and orthopyroxene. Pure olivine or olivine-dominated mixtures have a band area ratio near zero.
Mixtures with increasing proportions of orthopyroxene exhibit progressively higher band area ratios as Band II in the pyroxene is increasingly expressed by the mixtureø
Band centers are sensitive to the composition of pyroxene and to the presence of olivine. Band center is typically calculated as the wavelength having the lowest reflectance relative to a linear continuum fitted across the band (Figure 2). In pyroxene, the centers of Band I and Band II are closely related and occupy a narrow range of admissible valueso The center of Band I lies in the range 0.9-1.05 grn, and the center of band II in the range 1.9-2.3 Ixrn (Figures 3a and 3b). Changes in band centers are a systematic function of composition, with increasing content of Fe 2+ and Ca 2+ shifting both bands to longer wavelengthso For pure pyroxene, the band centers readily distinguish orthopyroxene from clinopyroxene, and for pyroxenes of intermediate composition the band centers can be used to estimate the fractions of total metallic cations
consisting of Ca, Fe, and Mg to an accuracy typically of better than +20% [Adams, 1974; Cloutis and Gaffey, 1991]. Olivine exhibits a characteristic broad Band I which is actually the composite of three weaker features, centered at 0.85, 1.04, and 1.20 •Xmo The composite feature typically is centered near 1o05 •xm. By virtue of this long-wavelength composite band center, admixture of olivine with pyroxene is detectable on the band center/band center plot (cf. Figures 3a and 3b). With an increasing proportion of olivine in the mixture, the center of Band II remains diagnostic of pyroxene composition but the Band I center is offset toward longer wavelengths.
S Asteroid Taxonomy
The earliest taxonomy that separated S asteroids out as a group was based on geometric albedo, color, and polarimetric properties [Chapman et al., 19751o A more mathematically- based approach was adopted by Tholen [1984] and Tholen and Barucci [1989], who reduced eight-color data of all asteroids using principal components analysis, and identified groupings in the data. These groups include S asteroids as well as a panoply of other taxa, especially among low-albedo bodies. Later taxonomic studies incorporated 52-color data [Bell et al., 1988] covering NIR wavelengths at high spectral resolution for many of the bodies included in the 8-color asteroid survey. Howell et al. [1994] used neural network analysis to reexamine asteroid classes, and divided S asteroids into three smaller groups. They interpreted the spectra of the three groups to indicate mineralogic differences, namely, an olivine-rich group (So), a pyroxene-rich group (Sp), and a group intermediate in composition (S)o Representative spectra from these three groups are shown in Figure 1o
The methodology used by Gaffey etak [1993] to distinguish among S asteroids is summarized in Figure 3c. For each asteroid, the 52-color near-infrared data are integrated with 8-color or 24-color data covering the extended visible wavelength range to yield a composite visible-NIR spectrum. Then using the procedures illustrated in Figure 2,

2204 MURCHIE AND PIETEr: SPECTRUM AND HETEROGENEITY OF 433 EROS
(a)
1.20
1.15
1.10
1.05
1.00
0.95
0.90
0.85
Gaffey et al. taxa:
- o
ol o [] - O0 •
- ' _ _ _"_ :: -
opx field ß
s(•) s(•) s(m) s(•v) s(v)
s(v,) . s(vjJ)-"
•,
cpx field
Eros ol-rich
Eros px-rich Eros avg
-,,,,I,,,,i .... I , , , , I , , j , I , , , , I , , , ,
1.7 1.8 1.9 2.0 2.1 2,2 2.3
BII center
(b)
1.20
1.15
1,10 -
1.05-
1.oo- _
0.95 - _
0.90 - _
_
0.85
2.4 1.8
' ' ' , I , i , i I , J , , I i , , I I I , , i
Howell et al. taxa:
&
&
ol o *
0 o 0 & o
c•& .* •,...,-' o o% . 6
.... o '7.'.; ........... _ _ .......• -- opx field -
o sp & s o so
ß
.-"'"cpx field
1.9 2.0 2.1 2.2
BII center
2.3
(c)
1.15
110
1.05
1.00-
0,95
0.90
Bas. achon. o $(I) [] s(•)
. _ field ß S(111) Ord. chon. field & S(IV)
....... Oily. field ß S(V) o s(v•)
s(vll) Eros, ol-rich Eros, px-rich Eros, avg
0.0 3.0
1
I
0.5 1.0 1.5 2.0 2.5
BII/BI area ratio
Figure 3. Graphical representations of compositional variations in meteorites, S asteroids, and laboratory mixtures of marie minerals (olivine, orthopyroxene, clinopyroxene). Symbols represent the 39 S asteroids belonging to the seven taxa of Galley et al. [1993], or the same asteroids as classified into the three taxa of Howell et al. [1994]. Average Eros is shown with a large solid square; the olivine-rich face is shown with a large solid circle; and the pyroxene-rich face is shown with a large solid triangle. (a) Band I center versus Band II center, after Adams [1974] and Cloutis and Galley [1991]. For pyroxene the band centers vary over a narrow admissible range related to composition. Addition of olivine leaves the Band II center unaffected but shifts Band I to longer wavelengths. The asteroids have band centers consistent with a pyroxene fraction dominated by orthopyroxene and varying proportions of olivine. Asteroid taxa are those of Galley et al. [1993]. Six of the seven taxa group nearly separately; subgroup S(IV) overlaps several other subgroups. Average Eros overlaps subgroups S(III), S(IV) and S(V)o The olivine-rich face is transitional to S(II), and falls well outside the pyroxene field indicating a significant component of olivine. The pyroxene-rich face falls in the pyroxene field and groups most closely with S(V). (b) Same type of diagram as Figure 3a, showing the three asteroid taxa of Howell et al. [1994]. Half of the Sp asteroids plot within the orthopyroxene domain; S and S o asteroids exhibit comparable scatter between this and the olivine-rich regions of the diagram. (c) Band I center versus Band II/Band I area ratio, after Galley et al. [ 1993]. The band area ratio is zero for olivine and becomes larger with progressively greater fractions of pyroxene. Band I center is near 0.9 !xm for orthopyroxene and approaches 1.05 !xm for pure olivine or clinopyroxene. The heavy shaded line is the result of mixing varying proportions of olivine and orthopyroxene; the arrow shows the effect of adding clinopyroxene to this mixture. Dashed regions outline the fields occupied by major meteorite types. The letters show the portions of the ordinary chondrite domain occupied by H, L, and LL Ordinary chondrites. Asteroid taxa are those of Galley et al. [1993]. The asteroids plot close to the trend expected for compositional variations within a mixture of olivine and orthopyroxene. All Eros spectra fall within the domain of S(IV) asteroids, but the olivine-rich face is transitional to S(II) and the pyroxene-rich face is transitional to S(VI).
MURCHIE AND PIETERS: SPECTRUM AND I-IE•ROG•I• OF 433 EROS 2205
the spectra are parameterized. Gaffey et al. found that a diagram of Band I center plotted against Band II/Band I area ratio is particularly useful for discerning the spectral variations indicative of mafic mineralogy.
The same procedure can be carried out using analogous data for mineral mixtures or meteorite powders measured in the laboratory. In Figure 3c, the heavy gray line shows the variations of these parameters for mixtures of olivine and orthopyroxene. Pure olivine, with Band I near 1.05 pm and no Band II absorption, plots in the upper left of the diagram. Pure orthopyroxene, with a relative large Band II/Band I area ratio and a Band I center near 0.90 !xm, plots on the lower right. Mixtures of the two minerals plot along a curvilinear trend. Incorporation of clinopyroxene into such a mixture offsets the plot of the spectrum above that trend, by virtue of the long wavelength of Band I. Laboratory spectra of powders of several meteorite classes plot close to the olivine- orthopyroxene trend: the olivine component of olivine-rich meteorites such as pallasires plots in the rectangular domain in the upper left; pyroxene-rich basaltic achondrites (e.go eucrites) plot in the rectangular domain in the lower right, near orthopyroxene; and H, L, and LL ordinary chondrites, which have mixed olivine-pyroxene marie mineral compositions, plot in the intervening polygonal domain.
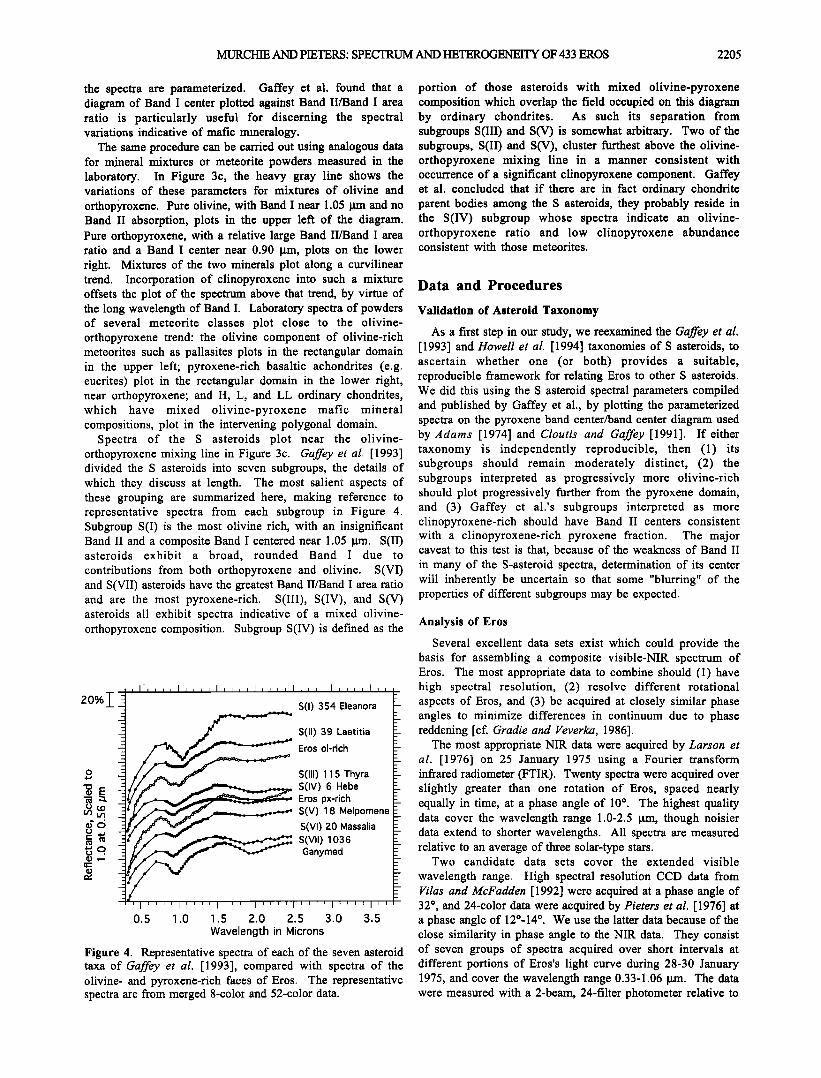
Spectra of the S asteroids plot near the olivine- orthopyroxene mixing line in Figure 3c. Gaffey et aL [1993] divided the S asteroids into seven subgroups, the details of which they discuss at lengthø The most salient aspects of these grouping are summarized here, making reference to representative spectra from each subgroup in Figure 4. Subgroup S(I) is the most olivine rich, with an insignificant Band II and a composite Band I centered near 1.05 !xm. S(II) asteroids exhibit a broad, rounded Band I due to contributions from both orthopyroxene and olivine. S(VI) and S(VII) asteroids have the greatest Band II/Band I area ratio and are the most pyroxene-richo S(III), S(IV), and S(V) asteroids all exhibit spectra indicative of a mixed olivine- orthopyroxene composition. Subgroup S(IV) is defined as the
zo%- -• S(I) 354 Eleanora _
ros o,-rc
l/•./'•'"'•'•• S(111)115 Thyra •f////,• • ..• S(IV)6 Hebe - •/••• Eros px-rich : •'••/• S(V)18 Melpomene: •//• S(VI) 20 Massalia -
i Ganymled I _
0.5 3.0 3.5 2.0 2.5 3.0 3.5
Wavelength in Microns
Figure 4. •cpresentativc spectra of each of the seven asteroid taxa o• •aff•y et aL [19933, compared with spectra o• the olivinc- and pyroxcnc-rich faces of Eros, The representative spectra are from merged 8-colin and 52-color data.
portion of those asteroids with mixed olivine-pyroxene composition which overlap the field occupied on this diagram by ordinary chondrites. As such its separation from subgroups S(III) and S(V) is somewhat arbitrary. Two of the subgroups, S(II) and S(V), cluster furthest above the olivine- orthopyroxene mixing line in a manner consistent with occurrence of a significant clinopyroxene component. Gaffey et al. concluded that if there are in fact ordinary chondrite parent bodies among the S asteroids, they probably reside in the S(IV) subgroup whose spectra indicate an olivine- orthopyroxene ratio and low clinopyroxene abundance consistent with those meteorites.
Data and Procedures
Validation of Asteroid Taxonomy
As a first step in our study, we reexamined the Gaffey et al. [1993] and Howell et al. [1994] taxonomies of S asteroids, to ascertain whether one (or both) provides a suitable, reproducible framework for relating Eros to other S asteroids. We did this using the S asteroid spectral parameters compiled and published by Galley et al., by plotting the parameterized spectra on the pyroxene band center/band center diagram used by Adams [1974] and Cloutis and Gaffey [1991]. If either taxonomy is independently reproducible, then (1) its subgroups should remain moderately distinct, (2) the subgroups interpreted as progressively more olivine-rich should plot progressively further from the pyroxene domain, and (3) Galley et al.'s subgroups interpreted as more clinopyroxene-rich should have Band II centers consistent with a clinopyroxene-rich pyroxene fraction. The major caveat to this test is that, because of the weakness of Band II in many of the S-asteroid spectra, determination of its center will inherently be uncertain so that some "blurring" of the properties of different subgroups may be expecte&
Analysis of Eros
Several excellent data sets exist which could provide the basis for assembling a composite visible-NIR spectrum of Erosø The most appropriate data to combine should (1) have high spectral resolution, (2) resolve different rotational aspects of Eros, and (3) be acquired at closely similar phase angles to minimize differences in continuum due to phase reddening [cf. Gradie and Veverka, 1986].
The most appropriate NIR data were acquired by Larson et al. [1976] on 25 January 1975 using a Fourier transform infrared radiometer (FTIR). Twenty spectra were acquired over slightly greater than one rotation of Eros, spaced nearly equally in time, at a phase angle of 10øo The highest quality data cover the wavelength range 1.0-2.5 gm, though noisier data extend to shorter wavelengths. All spectra are measured relative to an average of three solar-type stars.
Two candidate data sets cover the extended visible
wavelength range. High spectral resolution CCD data from Vilas and McFadden [1992] were acquired at a phase angle of 32 ø, and 24-color data were acquired by Pieters et al. [1976] at a phase angle of 12 ø- 14 ø. We use the latter data because of the close similarity in phase angle to the NIR data. They consist of seven groups of spectra acquired over short intervals at different portions of Eros's light curve during 28-30 January 1975, and cover the wavelength range 0.33-1.06 gm. The data were measured with a 2-beam, 24-filter photometer relative to
2206 MURCHIE AND PIETERS: SPECTRUM AND HETEROG•I• OF 433 EROS
the star g Geminorum and were converted to reflectance relative to the Sun.
The Pieters et al. and Larson et al. data sets were merged by scaling the NIR data to the extended visible wavelength data, using the overlapping wavelength range 1.00-1.06 (Shorter-wavelength NIR data were not used because of their noisiness.) Wavelengths inside the strong 1.4- and 1.9-lxrn terrestrial atmospheric absorptions were ignored because of the much greater uncertainty in asteroid reflectanceø For estimation of Band II properties, reflectances at wavelengths near 2 }xm were estimated using a fourth-order polynomial fit to data at wavelengths longer than 1.6 }Xmo All data were scaled to unity at 0.56 }xm. Geometric albedos at different wavelengths were estimated by multiplying the scaled reflectances at different wavelengths by a geometric albedo at 0.56 grn Pv of 0.17, which is an average of earlier estimates.
Two sets of composite spectra were produced: (1) a disk- averaged spectrum in which both the visible and NIR data were averaged before merging, and (2) spectra of different rotational aspects of Eros, in which data covering corresponding portions of the light curve were averaged before merging. Selection of the spectra to average was made based upon rotational variations in the extended visible wavelength range, as discussed below. Spectra of two nearly opposite faces of Eros were thus derived, covering 170ø-320 ø rotational phase and 320ø-170 ø rotational phase, where 0 ø is the minimum in the light curve occurring just prior to the primary maximum.
The composite spectra were parameterized following the conventions of Gaffey et al. [1993]. A linear continuum was fitted across Band I between tangent points on the spectrum. In fitting a linear continuum for Band II, the long-wavelength end was assumed to be at the longest wavelength of useful data (2.44 }xm), and the short-wavelength end was the tangent point on the opposite side of the absorption. (Figure 2 illustrates the actual continua fitted to the disk-averaged spectrum.) Each band area was calculated as the summed area between the reflectance spectrum and the continuum. Each band center was calculated as the wavelength of the maximum difference between the continuum and a fit to the data made
using either a smooth curve or a polynomial of degree 4-8 that maximized correlation with the data. Uncertainties were
estimated from the error bars in the composite spectra, the effects of using slightly different continua, and (where appropriate) the effects of using different fitting techniques to the spectra.
Results
Asteroid Taxonomy
The band centers of the S asteroid spectra examined by Gaffey et al. [1993] are compared with those observed for pyroxene in Figure 3a. Three aspects of this diagram are particularly noteworthy. First, spectra for six of their seven subgroups (S(I), S(II), S(III), S(V), S(VI), and S(VII)) cluster separately or nearly so. Thus the distinctiveness of these subgroups is largely maintained, consistent with Gaffey et al. actually having identified different compositional groupings. However, the space occupied by subgroup S(IV) overlaps that occupied by subgroups S(III), S(V), S(VI) and S(VII). S(IV) asteroids appear to be more heterogeneous than other groups, consistent with the arbitrary definition of that subgroup as
overlapping ordinary chondrites on the band center/band area ratio diagram.
Second, the subgroups interpreted by Gaffey et al. as most pyroxene-rich, S(VI) and S(VII), fall on the pyroxene trend in the 0rthopyroxene domain. Lower-numbered, putatively more olivine-rich subgroups plot progressively further from that domain. The most olivine-rich subgroups, S(I) and S(II), plot well above the pyroxene field. S(III) asteroids plot closer but still well above the pyroxene field. Subgroups S(IV) and S(V) are dominantly outside the pyroxene domain, but individual asteroids within those groups overlap the pyroxene field. These trends generally validate Gaffey et al.'s interpretation of variations in the olivine-orthopyroxene mixing ratio among S asteroids.
Third, the subgroups S(II) and S(V) were interpreted by Gaffey et al. to be richest in clinopyroxene. Although Figure 3a does not reveal these groups consistently to be clinopyroxene-enriched, individual members of the groups have the longest wavelength Band II centers, consistent with at least some clinopyroxene enrichment•
Locations on the band center/band center diagram of asteroids belonging to the So, S, and Sp taxa of Howell et al. [1994] are shown in Figure 3b. About half of the "pyroxene- rich" (Sp) asteroids plot within the orthopyroxene domain, but several plot well outside. The "olivine-rich" (So) and intermediate (S) asteroids range approximately equally from within the orthopyroxene domain to the region of the diagram indicating olivine enrichment. Overall that taxonomy appears less indicative of mineralogy as determined using the methods of Adams [ 1974] and Cloutis and Gaffey [ 1991 ].
Taken together, this work shows that the S asteroid taxonomy of Gaffey et al. is generally reproducible using the methodology of Adams [1974] and Cloutis and Gaffey [1991], and that most details about mineralogic variations between subgroups are corroborated. In this paper we will use that taxonomy as a vehicle for classifying Eros and rela•ing it to other bodies, for three reasons. First, the method is based on aspects of NIR spectra that have clear compositional significance. Second, different groups of S asteroids distinguished by this method have the potential for being related to different rock types. That is, based on these parameters, some bodies are clearly pyroxene-rich whereas others are clearly olivine-rich, but at present uniquely matching asteroids with rock (i.e., meteorite) types may be hampered by the inability to separate the spectral effects of space weathering and incorporation of Fe-Ni metal. Third, most of the S asteroid groups identified by Gaffey et al. appear to exhibit particular systematics between diameter, albedo, and/or spectral parameters such as band depth and continuum. These relationships provide clues to the nature of surface processes and their effects on the asteroid materials, and suggest a basis for testing the consistency of the spectrum of a given asteroid (e.go Eros) with the overall properties of a particular spectral grouping.
Disk Averaged Spectrum of Eros
The disk-averaged composite spectrum of Eros is shown in Figure 5o Superficially, it strongly resembles "intermediate" S asteroid spectra such as 7 Iris in Figure 1. Disk-averaged Eros has a Band I center of 0.969+0.015, a Band II center of 2.0+0.1 ]•n, a Band I depth of 0.19+0.01, and a Band II/Band I area ratio of 0.62+0.12, listed in Table 1.

MURCHIE AND PIETE•: SPECTRUM AND HETEROGENEITY OF 433 EROS 2207
2.00
1.80
1.60
1 40
1.20
1.00
0.80
0.60
0.40
0.20
0.00 0.0
i• ß Larsen et al. 1976 -
Interpolated spectrum _
- 0.5 2.5
0.32
0.28
0.24 m o
o.zo o z
0.16 •
0.12 •. o
0.08
0.04
1 .o 1.5 2.0
Wavelength in Microns
0.00 3.0
Figure 5. Composite disk-averaged spectrum of Eros. Squares denote data from Pieters et al. [1976], and circles denote data from Larson et al. [1976]. Gaps represent strong terrestrial atmospheric absorptions where the data are less reliable. The thin solid line is interpolated, except in the gap near 2 gm, where it represents a polynomial fit to data at wavelengths longer than 1.6 gm.
Before proceeding further, it is instructive to place the disk-integrated spectrum into the taxonomy of Gaffey et al. Figure 3c shows how "average Eros" compares with other S asteroids on a Band ! center versus Band II/Band ! area ratio
plot. Eros plots with subgroup S(IV) and has mafic mineral absorptions consistent with the olivine-pyroxene assemblage in ordinary chondrites. It does not overlap the regions of the plot occupied by the adjacent groups S(II), S(III), or S(V)• Figure 3a shows a band center/band center plot. Here average Eros overlaps the fields occupied by classes S(III), S(IV), and S(V). The Band I! center is longer in wavelength than for most other S asteroids, suggesting relatively more clinopyroxc,e; however, the large error bars on this parameter could also accommodate only an orthopyroxene component. Taken at face value, these results would indicate that Eros is a typical S(IV) asteroid.
Rotational Spectral Variations
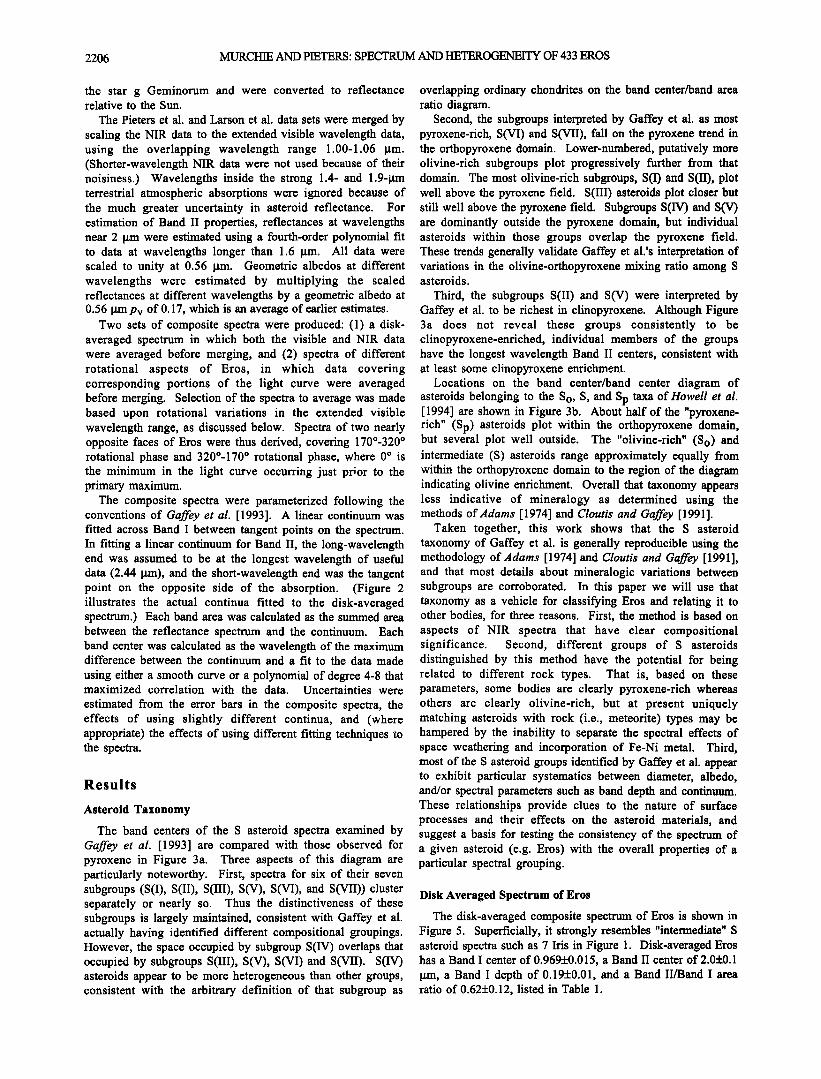
The spectral measurements of different sides of Eros present a far richer picture of the asteroid's surface than does the disk- integrated spectrum alone. Pieters et alo [1976] noted in their 24-color data an apparent dependence of the character of Band I on rotational phase. This is illustrated in Figure 6a, where their seven spectra are ordered by rotational phase• starting with the spectrum corresponding to the primary maximum of the light curve. Near the primary maximum there is a strongly
reddened visible-wavelength continuum, a relatively narrow Band I centered at short wavelengths, and possibly a weak absorption just longward of 0.6 gxn. Half a rotation later the continuum is essentially unchanged, but Band I has broadened to longer wavelengths. As Eros rotated back toward the primary maximum, Band I again moves back to shorter wavelengths. (Spectra 6 and 1 are for similar rotational phases but were acquired on different days. The relatively high values in the 0.93- and 0.96-gm channels in spectra 6 and 7 are probably an artifact of variations in atmospheric water during the observations.)
These spectra form two groups based on the character of Band I: spectra 1, 6, and 7, corresponding to rotational phases of 170ø-320ø; and spectra 2, 3, 4, and 5, corresponding to rotational phases of 320ø-170øo The averaged spectra over each of the rotational phase intervals are illustrated in Figure 6bo These corroborate the differences described above. The
continuum is closely similar between two opposite faces of Eroso However one face of Eros has a short-wavelength Band I with evidence for a 0.6-gm absorption, while the other face lacks evidence for the 0.6-gm absorption and has a broad, weaker Band I located at a longer wavelength.
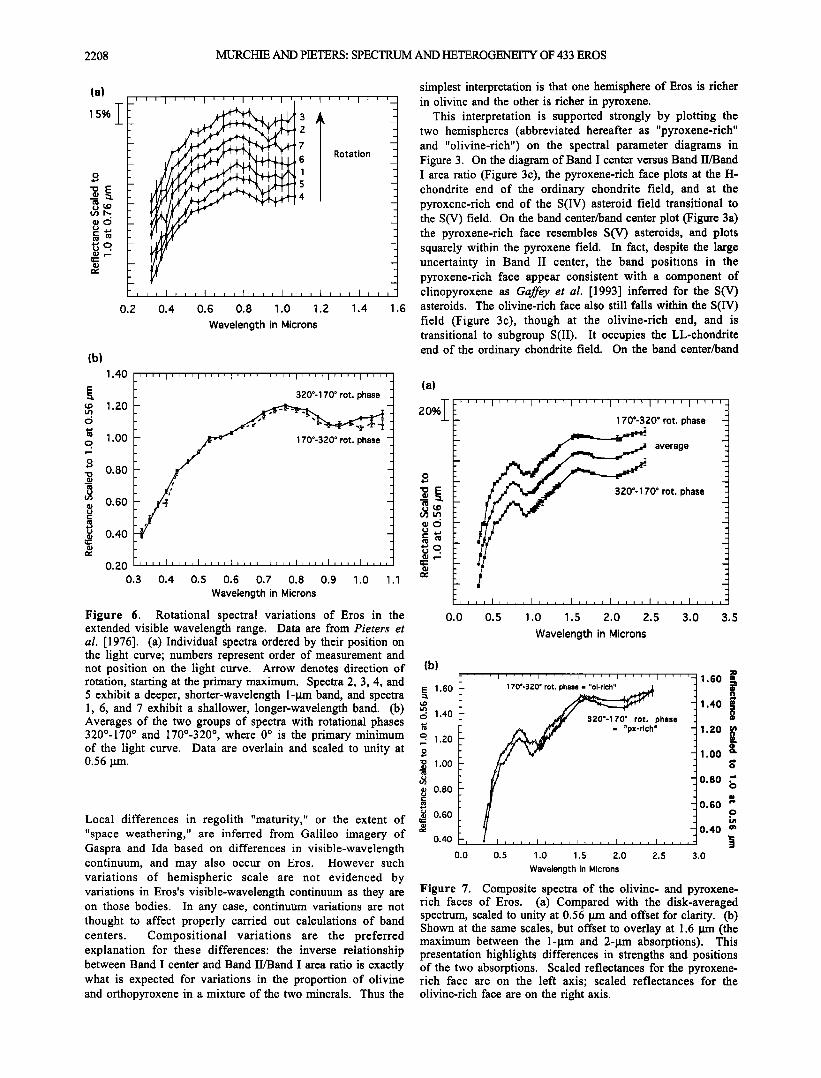
Merging the rotationally resolved spectra in Figure 6b with the NIR spectra covering the corresponding rotational phases extends the wavelength coverage to near 2.5 gm. The rotationally resolved composite spectra are illustrated in Figure 7a, where they are compared with the disk-integrated composite spectrum. In Figure 7b the two resolved composite spectra are displayed at the same scales (labeled on the left and right axes), offset to overlay at 1.6 gm. Examination of Figure 7b clarifies the difference between the two hemispheres of Eros. The hemisphere centered at rotational phases of 320 ø- 170 ø has a Band ! center of 0.948+0.015 gm, a relatively strong Band II absorption (Band II/Band I area ratio of 0.8+0.2), and a weak 0.6-gm absorption. The hemisphere centered at rotational phases of 170ø-320 ø has a Band I center of 1.007+0.015 gm, a Band II strength only half as great as for the opposing hemisphere (a Band II/Band I area ratio of 0.4+0.12), and little or no 0.6-gm absorption. Spectral parameters for each hemisphere are listed in Table 1.
Possible explanations for spectral differences between the two hemispheres include uncertainty in the data, particle size differences, differences in "space weathering" effects, and compositional differences. Random errors are likely not the source of the variations, as error bars of the spectra themselves, of Band ! center, and of Band II/Band I area ratio do not overlap between hemispheres. Lateral variations in average surface particle size may and probably do occur, and could affect both continuum and depth of absorption bands. However they should not greatly affect the Band II/Band ! area ratio, nor should they cause strong variations in Band I center.
Table 1. Spectral Parameters for Eros
Spectral Parameter
Continuum slope Band I center
Band I depth Band II center
Band II/Band I area aatio
px / (px+ol)
Average Px-Rich face O1-Rich face
0.368__+0.015 0•396__+0 •025 0.336__+0.025 0.969__+0.015 0.948__+0.0,015 1.007__+0.015
O. 19__+0.01 O. 18__+0.01 O. 19__+0.02 2.0__+0.1 2.0-!0.1 2.0__+0.1
0.62__+0.12 0.81__+0.20 0.39__+0.12
- 0.39__+0.10 0.22__+0.07
2208 MURCH• AND PIETEr: SPECTRUM AND HE•ROG•I• OF 433 EROS
(a)
15%
lb)
E
O.g 0.4 0.6 0,8 1.0 1 .g 1.4
Wavelength in Microns
1.40
1.6
simplest interpretation is that one hemisphere of Eros is richer in olivine and the other is richer in pyroxene.
This interpretation is supported strongly by plotting the two hemispheres (abbreviated hereafter as "pyroxene-rich" and "olivine-rich") on the spectral parameter diagrams in Figure 3o On the diagram of Band I center versus Band II/Band I area ratio (Figure 3c), the pyroxene-rich face plots at the H- chondrite end of the ordinary chondrite field, and at the pyroxene-rich end of the S(IV) asteroid field transitional to the S(V) fieldø On the band center/band center plot (Figure 3a) the pyroxene-rich face resembles S(V) asteroids, and plots squarely within the pyroxene field. In fact, despite the large uncertainty in Band II center, the band positions in the pyroxene-rich face appear consistent with a component of clinopyroxene as Gaffey et al. [1993] inferred for the S(V) asteroids. The olivine-rich face also still falls within the S(IV) field (Figure 3c), though at the olivine-rich end, and is transitional to subgroup S(II). It occupies the LL-chondrite end of the ordinary chondrite field. On the band center/band
_- (a) _ 320ø-170 ø rot, phase
1.20 - 20%]- 1.00
0.80 S
0.60
0.40
0.20 -'''' I .... i .... I .... I .... I .... I .... J .... 0.3 0.4 0.5 0.6 0.7 0.8 0.9 1.0 1.1
Wavelength in Microns
Figure 6. Rotational spectral variations of Eros in the extended visible wavelength range. Data are from Pieters et al. [1976]. (a) Individual spectra ordered by their position on the light curve; numbers represent order of measurement and not position on the light curve. Arrow denotes direction of rotation, starting at the primary maximum. Spectra 2, 3, 4, and 5 exhibit a deeper, shorter-wavelength 1-!.tm band, and spectra 1, 6, and 7 exhibit a shallower, longer-wavelength band. (b) Averages of the two groups of spectra with rotational phases 320 ø- 170 ø and 1700-320 ø, where 0 ø is the primary minimum of the light curve. Data are overlain and scaled to unity at 0.56 gm.
Local differences in regolith "maturity," or the extent of "space weathering," are inferred from Galileo imagery of Gaspra and Ida based on differences in visible-wavelength continuum, and may also occur on Eros. However such variations of hemispheric scale are not evidenced by variations in Eros's visible-wavelength continuum as they are on those bodiesø In any case, continuum variations are not thought to affect properly carried out calculations of band centers. Compositional variations are the preferred explanation for these differences: the inverse relationship between Band I center and Band II/Band I area ratio is exactly what is expected for variations in the proportion of olivine and orthopyroxene in a mixture of the two minerals. Thus the
0.0 0.5 1.0 1.5 2.0 2.5 3.0 3.5
Wavelength in Microns
(b}
1.60
1.40
1.20
1.oo
0.80
0.60
0.40
170ø-320 ø rot. phase = "ol-r• 140 ß
,• 320%170 • rot. phase m" - ' " 120
ß
1.00
0.80
-0.60
0.40
0.0 0.5 1.0 1 o5 2.0 2.5 3.0
Wavelength in Microns
Figure 7. Composite spectra of the olivine- and pyroxene- rich faces of Eros. (a) Compared with the disk-averaged spectrum, scaled to unity at 0.56 grn and offset for clarityø (b) Shown at the same scales, but offset to overlay at 1.6 pm (the maximum between the 1-!.tm and 2-!.tm absorptions). This presentation highlights differences in strengths and positions of the two absorptions. Scaled reflectances for the pyroxene- rich face are on the left axis; scaled reflectances for the olivine-rich face are on the right axis.

MI. YRCHIE AND PIETERS: SPECTRUM AND HETEROGENEITY OF 433 EROS 2209
center plot (Figure 3a) the olivine-rieh face plots well out of the pyroxene field, and again appears transitional to subgroup S(II).
Estimated Mineral Abundance Variations
The Band II/Band I area ratio has been measured for a variety of olivine-orthopyroxene mixtures in the laboratory [Cloutis et al., 1986], and shows a high degree of correlation with the fraction of marie minerals consisting of orthopyroxene (opx / ol+opx)o Based on the band area ratios and uncertainties listed in Table 1, this technique yields estimated marie mineral fractions of 39ñ10% pyroxene and 61ñ10% olivine on the pyroxene-rich side of Eros, and 22ñ7% pyroxene and 78+7% olivine on the olivine-rich side of Eros. We emphasize, however, that these values are only estimates because (among other reasons) the work of Cloutis et al. [1986] was based on orthopyroxene, and there is evidence from Eros's band centers for a non-negligible component of clinopyroxene.
Discussion
Eros Among the S Asteroids
The most basic question a•ising from the work above concerns the consistency of the measured properties of Eros with the general properties of S asteroids. One of the most pronounced trends in spectral properties of S asteroids is variation in Band I depth with asteroid diameter, as shown in Figure 8 [Galley et al., 1993]. At diameters above 100 km, Band I depth is relatively constant; at lesser diameters it increases with decreasing asteroid diameter. This may indicate progressively greater exposure of optically "fresh," "unweathered" regolith on smaller asteroids with lesser surface gravities to retain space-weathered regoliths. Eros is smaller than the bodies included in the Galley et al. study, but nevertheless exhibits a strong band expected for a small asteroid which retains little altered regolith.
Heterogeneities in mafic mineral absorptions have also been observed telescopically on other S asteroids, and it is
0.25 :::::::::::::::::::::::::::::
i ß S asteroids
ß 0 Eros, ol-rich
O. ZO • ß ß • Eros, px-rich ß ß ß [] Eros, avg • 0.15
..• - ß ß ß
• 0.10 - • • - _
_
0.05 - i typica I ß uncertainty _
0.00 .... I .... I .... I .... I .... I .... 0 50 1 O0 150 ZOO Z50 300
Diameter
Figure 8. The relationship between depth of the 1-•m absorption and asteroid diameter for S asteroids, after Gaffey et al. [1993]. Average Eros is shown with a large open square; the olivine-rich face is shown with a large open circle; and the pyroxene-rich face is shown with a large open triangle.
instructive to compare these with the heterogeneity seen on Eros. The best documented telescopic evidence for rotational spectral heterogeneities in marie mineral absorptions is for the large S asteroids 8 Flora and 15 Eunomia. Flora (diameter 141 km [Tedesco, 1989]) exhibits a range in Band I center from 0.99 to 1.01 Bm, and a Band II/Band I area ratio of 0.45- 0.60 [Gaffey, 1984]. As with Eros, the two parameters are inversely related, but the magnitude of variation is only half or less as great as on Eros. Eunomia (diameter 272 km [Tedesco, 1989]) exhibits variations in Band I center, and variations in Band II/Band I area ratio of 0.3-0.7 [Gaffey and Ostro, 1987], the latter of the same magnitude as on Eros. These comparisons show that Eros exhibits heterogeneity in maf'lc mineralogy comparable to the greatest that has been well determined on any S asteroid. This is not unexpected in light of its small size, where geologic features such as igneous intrusions inherited from a parent body could occupy a large relative portion of the surface.
Eros Compared to S Asteroid Subgroups
The disk-averaged spectral properties of Eros place it as a member of the S(IV) subgroup, having mafic mineral absorptions similar to those in ordinary chondriteso However, the spectral heterogeneity recognized on the asteroid's surface suggests that Eros's affinity with specific S asteroid classes is more complicated.
According to Galley et al. [1993], two of the distinguishing features of the S(IV) subgroup are the correlations of continuum slope with asteroid diameter and with Band I depth. The correlation between continuum slope and diameter is illustrated in Figure 9a. The disk-averaged spectrum of Eros as well as spectra of the olivine- and pyroxene-rich hemispheres have continua consistent with that expected for a small S(IV) asteroid. The correlation between Band I depth and continuum ?lope is shown in Figure 9b. Here, all three spectra of E, os exhibit much stronger Band I absorptions than are expected if this relationship extends to asteroids with the small size of Eros. The inferred mineralogle dissimilarity of the two faces of Eros, similarity of the olivine-rich and pyroxene-rich faces to different asteroid classes, and the dissimilarity of Band I strength with that of subgroup S(IV) all suggest that comparisons of Eros with those other asteroid classes would be instructive.
The pyroxene-rich face of Eros appears transitional to subgroup S(V) in the diagrams in Figure 3. Galley et al. [1993] noted that a characteristic of S(V) bodies is a weak correlation between Band I depth and continuum slope. This is illustrated in Figure i0o in fact, except t•r one outlier (18 Melpomene), the correlation is quite close. This relationship differs from the similar correlation exhibited among S(IV) asteroids in that the variation in Band I depth is larger, and at red continuum slopes (like that of Eros) Band I depth is greater. Figure 10 shows that the pyroxene-rich face of Eros exhibits close affinity in this aspect with S(V) asteroids, although the disk average and oilvine-rich faces do noL An additional similarity to the S(V) asteroids is the apparently clinopyroxene-rich composition characteristic of this subgroup (see especially Figure 3a).
In the diagrams in Figure 3, the olivine-rich face of Eros appears transitional to subgroups S(II) and S(III). Gaffey et alo [1993] found that S(III) is the most spectrally heterogeneous subgroup, such that clear spuctral systematics are not as

2210 MURCHIE AND PI••: SPECTRUM AND I-IETEROGE2qEITY OF 433 EROS
(a) 0.60
0.50
0.40'
0.30
0.20
0.10
0.00
- i typica I uncertainty _
_
.
0 50 1 O0 1 50 200 250 300
Diameter, km
(b)
0.22
0.20
0.18
0.16
0.14
0.12
0.10
0.08
I I I I I i I I , • ,
e- -S(IV) and linear ß Eros ol-rich
ß Eros px-rich ß Eros avg
typical uncertainty
0.0 0.1 0.2 0.3 0.4 0.5
Continuum slope across Band l 0.6
Figure 9. Comparison of parameterized spectral properties of S(IV) asteroids with those of Eros. S(IV) asteroids are shown as small solid circles. Average Eros is shown with a large solid square; the oilvine-rich face is shown with a large solid circle; and the pyroxene-rich face is shown with a large solid triangle. (a) Continuum slope and asteroid diameter, after Guffey et el. [1993]. Here Eros appears consistent with a small S(IV) body. (b) Depth of the 1-gm absorption and continuum slope. Here Eros exhibits a deeper 1-lxm absorption than is typical of the S(IV) asteroids.
evident in this subgroup as in others. However, subgroup S(II) is characterized by a broad, rounded Band I not observed in the other subgroups, due to significant contributions to this feature from both olivine and pyroxene. In Figure 4 the spectrum of Eros's oilvine-rich face is compared with representative spectra of the seven subgroups. The broad, rounded nature of Band I and the similarity with S(II) spectra are evident. This characteristic of the olivine-rich face of Eros
is a strong indicator of some affinity with subgroup S(II). These comparisons demonstrate the significance of the
rotational spectral heterogeneity of Eros, but they should not be construed to mean, exactly, that half of Eros is an S(II) asteroid and that the other half is an S(V). There is simply too much overlap in the spectral properties of subgroup S(IV) with adjacent subgroups to justify such a statement (see, for example, Figure 3a). But the comparisons do show that the very S(IV)-like average spectrum of Eros results from the
0.25
0.20
0.15
0.10
0.05
e- -Most S(V) and linear fit
ß Outlier S(V) • , .I_ , • 0 Eros ol-rich ; ' : T• ' I ß Eros px-rich ß Eros avg ß
typical •, uncertainty • ß
0.00 , , , , I • i I , I I I I , I .... I .... 0.20 0.25 0.30 0.35 0.40 0.45
Continuum slope across Band l
Figure 10. Comparison of Eros's properties with the spectral systematics of S(V) asteroids. The most characteristic relationship of that group (with the exception of one outlier) is the correlation between depth of the 1-1xm absorption with continuum slope. This relationship is different from that exhibited by S(IV) asteroids. The pyroxene-rich face of Eros (large solid triangle) is consistent in this respect with S(V) bodies, but the disk-average (large solid square) and the olivine-rich face (large solid circle) are not.
mixing of the properties of two distinctly different materials having affinities with the materials composing S asteroids of other subgroups. To that extent, our work underlines the fact that the Guffey et el. subgroups are not distinct and separate, but in reality form a compositional continuum. This in no way diminishes the great utility of that taxonomy, but it does place limits on the interpretabilily of the subgroups.
Correspondence With Other Studies of Eros
Several previous photometric studies have examined the question of rotational spectral variations of Eros and reached differing conclusions. These are actually consistent with the results presented in this paper, once consideration is made of the wavelengths and precision of the observations. The wavelengths of these observations are listed in Table 2.
Studies covering only visible wavelengths have found no evidence for significant color heterogeneity of Eros. Millis et al. [1976] conducted UBV photometry (0.3-0.5 gm) over the course of many asteroid rotations and found no evidence for color heterogeneity. The five-color UVBGR (0.3-0.7 gm) study of Miner and Young [1976] found that any rotational color variations in this wavelength range are of the order of only 1%. Veeder et al. [1976] examined the whole wavelength region from 0.65-2.2 gm, but with low spectral resolution and
Table 20 Wavelengths of Astronomical Filters of Eros Used in Previous Studies
Filter Name Abbreviation Center,
Ultraviolet U 0.343 Violet V 0.400 Blue B 0.495 Green G 0.595 Red R 0.670 Infrared I 0.9

MURCHIE AND PIETERS: SPECTRUM AND HE•R••• OF 433 EROS 2211
relatively large uncertainties in measured reflectances. They did not find convincing evidence for spectral heterogeneity, but we might have drawn the same conclusions from our own data if they had comparable precision and limited wavelength coverage. These previous results are therefore not inconsistent with our own, which show that rotational color variations at visible wavelengths are within the error bars, with the possible exception of variations in the band at 0.6 prn.
Other studies covering extended visible and NIR wavelengths with high spectral resolution agree with our results, except for differences probably related to observational geometry and the extent of data analysisø Wisniewski [1976] measured two hemispheres of Eros in the 0.4- to 1.0-•rn wavelength range, and found rotational spectral differences. One hemisphere (corresponding approximately in rotational phase with the pyroxene-rich hemisphere) exhibited a short-wavelength Band I and an absorption near 0.6 •-n. The other (corresponding approximately in rotational phase with the olivine-rich hemisphere) exhibited a longer- wavelength Band I and lacked the 0.6-•Lm absorption. These results are consistent with those presented here, but Wisniewski's Band I minima are consistently shorter than those evident in our data. This could be due in large part to the greater phase angle of his coverage (17ø), which would introduce phase reddening and move band minima to shorter wavelengths. Alternatively, it could be due to calibration difficulties. Vilas and McFadden [1992] produced a very high spectral resolution CCD spectrum of Eros covering part of the wavelength range of the Pieters et al. [1976] data used here (Figure 11). Their spectrum is even redder than Wisniewski's, probably due once again to a higher phase angle of the observations (32ø), introducing phase rcddening effects. Larson et al. [1976], in their original analysis of data used in this paper, found no obvious rotational spectral variations. This may be due to the lower precision of the single spectra they used than the averaged spectra binned by rotational phase that we used.
Perhaps the most interesting comparison to make with the results of other studies, though, is with Ostro et al.'s [1990]
1.60
--' 1.40
, 1.;>0
._e 1.00
u 0.80
• 0.60
ß o 0.40
•n 0.20
' ' ' I ' ' ' I • ' ' I ' ' ' I ' ' ' I ' ' ' 1.40
1 .ZO
Pieters et al., • . .•... average spectrum •,•/-, '• 1.00
s and McFadd , 0.80
' CCD spectrum _ _
0.60
0.40
0.20
0.00 ,, •l,i i I J • iJ ,,, I,., i , , , 0.00 0.0 0.2 0.4 0,6 0.8 1.0 1.2
Wavelength in Microns
Figure 11. Comparison of high spectral resolution measurements of Eros in the extended visible wavelength range acquired at different phase angles. The spectrum of Yilas and McFadden [1992] has a more strongly sloped continuum than the spectra of Pieters et al. [1976] due to the higher phase angle of the former observations.
radar determination of Eros's shape. That work shows one of Eros's hemispheres to be relatively flat or facet-like, and the other to be convex in shape. The general shape of Eros is depicted schematically in Figure 12. The facet-like face is the one presented at rotational phases of 0ø-180 ø, and the convex face is the one presented at rotational phases of 180ø-360 ø. These ranges closely match the rotational phases of the pyroxene-rich and olivine-rich faces, 320ø-170 ø and 170 ø- 320% respectively. Together our work and that of Ostro et al. indicate that one face of Eros is facet-like in shape and rich in pyroxene, and that the other face is convex in shape and rich in olivine.
Implications for NEAR
Two of the most important questions to be addressed by the NEAR mission arc the composition of Eros and the arrangement and geologic setting of its compositional hctcrogcncitics. These attributes of Eros will provide some of the strongest evidence for addressing the astcroid*s parentage and evolution, the holy grail of which is resolution of the S asteroid-meteorite connection. The results in this paper bear on these questions, and highlight the necessity of a spacecraft mission to answer them.
Attempting to match asteroid and meteorite spectra has a long and checkered history. The composite spectra of Eros presented here are constrained by the same limitation as most other asteroid spectral data: although rotational spectral variations are clearly evident, any particular spectrum integrates over a whole face of Eros and whatever geologic units are present there. The clearest compositional information derives from the absorption bands, so the effects of this limitation on interpretation of absorption bands warrants detailed examination. The most complete collection of spectra of relevant meteorite types is that of Gaffey [1976], who determined Band I and Band II centers for a variety of mafic-rich types. Hiroi et al. [1993] presented spectra and band centers of meteorites not included in Gaffey's compilation. Among known meteorite types, the band centers for Eros*s pyroxenc-rich face could be fit by pyroxene-rich meteorites such as undiffercntiated H or L ordinary chondrites or partly differentiated lodranite. A differentiated, basaltic achondrite such as a eucrite also fits the band centers, though the band strengths of cuerites are incomparably larger than on Eros. The olivinc-rich face has band centers consistent with
the undiffcrcntiatcd LL ordinary chondritcs or differentiated urcilites (though the albedo is incomparably higher than for ureilites). Galley et al. [1993] also suggested unknown but plausible differentiated meteorite types possibly matching this spectrum, including olivinc-pyroxcne cumulatcs and pyroxene-containing pallasitc. In other words, averaged spectra of Eros*s two faces could match either differentiated or undiffercntiatcd meteorite types, so our spectral results alone do not suggest a unique parentage of Eros.
The NEAR mission will improve this situation most significantly by acquiring data with high spatial resolution sufficient to ascertain the geologic setting of the compositional variations, and hence to better constrain the nature of the geologic processes involved in their formation. NEAR is equipped with a multispectral imager and a near- infrared spectrometer that will measure marie absorption bands [Yeverka et al., 1995], as well as with X-ray and y-ray spectrometers that will measure elemental composition

2212 MURCHIE AND PIETERS: SPECTRUM AND HE•ROG•I• OF 433 EROS
End-member Models
Highly differentiated
P•oxene•ich exl•usions, inbusions
r metalrich
Gounby rock
IVlxed surface
layer
-----:;::=z-:;:: •
:---:-•:::_:___;__ _---i:¾•
;__•::::: ..... :::_•::::::
_
........
...........
:
•-; .... __2
;::::
Rubble
rotation
PTqo•ene•ich melt accumulated in shah o•ef
region of parent body
0 ø rotational phase
Figure 12. result either from a differentiated or an undifferentiated Eros. section derived by Ostro et al. [ 1990] from radar returns.
Intermediale Model
Slightly differentiated
'. '; :.:: i:;: :;;:! ::::::::::::::::::::::::::::::::::::::::::::::::::::::::::::::::::::: •"•- ---"•iii•:
ß '.';;: :: ,•!!:::?::•;i;::ii?5::!!i!11;iii?:iiiiiiii:•11ii!iiii!1115:. •:•-"-". ß "-'-'•, ß .' ?,:,!;. :.::: ':• ======================================================================================= * •':":'•----"'-"•}ii!;'-:!ii::ii::"
/• Oilvine+metal enriched r 9d duo con cen baled
rVlxed in deeper fogion of sur face par en t body layer
Schematic illustrations depicting how the spectral heterogeneities identified in this study might The outline is the actual equatorial cross-
[Trombka et al., 1995]. The combination of both mineralogic and elemental abundance information from these instruments will allow better discrimination of possible compositions of Eros's surface than does reflectance spectroscopy alone.
To help frame questions for NEAR, Figure 12 illustrates how the spectral heterogeneity seen on Eros could result from different degrees of igneous differentiation. In general, some amount of differentiation is likely, but its form and degree are unclear. One extreme case would be that Eros is an intact
fragment of a highly differentiated (Vesta-like) parent body. This "differentiated" Eros might consist of metabbearing, olivine-rich mantle material plus pyroxene-rich, basaltic crustal material occurring as dikes, sills, or even flows that formed on the parent body of which Eros is a fragment. In such a case, planar geologic contacts from the crustal region of the parent body might define Eros's facet-like faceø Mixing of the surface regolith may be expected somewhat to blur the underlying geologic contacts.
The second extreme case is that Eros is "rubble," a loosely bound collection of compositionally heterogeneous materials. This could consist of several major fragments from different regions of a disrupted, previously differentiated parent body, whose subangular shapes cluster together to form the body's overall profile. Alternatively, Eros could consist of large clasts of undifferentiated ordinary chondrite deriving from different source bodies, which have become
associated on Eros by collision. Spectrally, marie mineralogy of the pyroxene-rich material is consistent with H or L type ordinary chondrite, and that of the olivine-rich material is consistent with LL chondrite. With the latter compositions, a "space weathered" regolith would be necessary to redden the spectral continuum and weaken the marie absorption bands.
An intermediate case is that Eros is "slightly differentiated," as previously proposed for S(IV)-like asteroids [e.g., Bell et al., 1989; Gaffey et al., 1993]. In this case the olivine-rich material is a residuum of partial melting, and the pyroxene-rich material is the partial melt which in the parent body migrated to shallower depths. This case differs from the "highly differentiated" end-member model in the degree of development of an igneous system on the parent body.
Key observations by NEAR to test these models include Eros's shape and morphology, the sharpness of mineralogic heterogeneities, and the correspondence between elements of the asteroid's shape and its mineralogic variegations. These can be addressed using NEAR's multispectral imager and near- infrared spectrometer. The imager has spectral bands specifically chosen to distinguish marie mineralogy, and will acquire imagery with a pixel size as small as 5 mo The near- infrared spectrometer has 64 spectral channels in the range 0.8-2.7 gm, and will resolve features smaller than 300 m in size. Occurrence of pyroxene-rich material as discrete dikes or

MURCH]E AND PIETERS: SPECTRUM AND HETEROGE•ITY OF 433 EROS 2213
sills would evidence a highly differentiated parent body• whereas distinct "lumps" of olivine- and pyroxene-rich materials might support an origin as compositionally heterogeneous rubble. Gradational change in mineralogy across the surface would support the slightly differentiated model.
Conclusions
Taxonomy based on mafic mineral absorption features provides a powerful reference for comparing different S asteroids. We have used the Gaffey et al. [1993] taxonomy to characterize Eros and to relate it to other S asteroids.
Composite visible-NIR spectra of different rotational aspects of Eros were derived from the results of previous studies, allowing us to measure important attributes of Eros's spectrum, its mafic mineral absorptions, and the nature of its compositional heterogeneity. On average, Eros resembles the S(IV) asteroids which bear the closest resemblance to ordinary chondrites in mafic mineralogy. However, rotational spectral variations reveal two distinctly different compositional regions on the asteroid. The magnitude of the spectral heterogeneity is comparable to the greatest yet seen on an S asteroid. One region, located on the facet-like side of Eros, is rich in pyroxene, and the other region on the convex side is rich in divineø Each side of the asteroid exhibits affinities
with different spectral classes of S asteroids, demonstrating that such subdivisions of S asteroids represent different parts of a compositional continuum. Improved measurement of the mineralogic and elemental compositions and especially the geologic contexts of these different materials by NEAR will provide an enormous advance in the understanding of the origin and evolution of a candidate ordinary chondrite parent body.
Acknowledgments. Wc are grateful to H Larson for providing NIR spectra of Eros for this paper, and to M. Gaffey and C. Chapman for helpful discussions, and to L. McFadden and an anonymous reviewer for incisive reviews. We appreciate support from NASA grant NAGW-28 (C.M.P),
References
Adams, J., Visible and near-infrared diffuse reflectance spectra of pyroxenes as applied to remote sensing of solid objects n the solar system, Jo Geophys. Res., 79, 4829-4836, 1974.
Allen, C., R. Morris, and D. McKay, Experimental reduction of lunar mare soil and volcanic glass, J. Geophys. Res, 99, 23,173-23,185, 1994.
Bell, J., Q-class asteroids and ordinary chondrites (abstract), Lunar Planet. $ci., XXVI, 93-94, 1995.
Bell, J., and K. Keil, Spectral alteration effects in chondritic gas-rich breccias: Implications for S-class and Q-class asteroids, Proc• Lunar Planet. Sci. Conf, 18th, 573-580, 1988.
Bell, J., P Owensby, B• Hawke, and M• Gaffey, The 52-color asteroid survey: Final results and interpretation (abstract), Lunar Planet. Sci., X/X, 57-58, 1988.
Bell, J., D Davis, We Hartmann, and M. Gaffey, Asteroids: The big picture, in Asteroids II, edited by R. Binzel, T. Gehrels, and M.
Campbell, D., G. Pettengill, and I. Shapiro, 70-cm radar observations of 433 Eros, Icarus, 28, 17-20, 1976.
Chapman, C., D. Morrison, and B. Zellner, Surface properties of asteroids' A synthesis of polarimetry, radiometry, and spectrophotometry, Icarus, 25, 104-130, 1975.
Cheng, A., Near Earth Asteroid Rendezvous: First launch of the Discovery program (abstract), Lunar Planet. Sci., XXVI, 239-240, 1995.
Cloutis, E., and M. Gaffey, Pyroxene spectroscopy revisited: Spectral- compositional correlations and relationship to geothermometry, J. Geophys. Res., 96, 22,809-22,826, 1991.
Cloutis, E., M. Gaffey, T. Jackowski, and K. Reed, Calibration of phase abundance, composition, and particle size distribution for olivine- orthopyroxene mixtures from reflectance spectra, J. Geophys. Res., 91, 11,641-11,653, 1986.
Crown, D., and C. Pieters, Spectral properties of plagioclase and pyroxene mixtures and the interpretation of lunar soil samples, Icarus, 72, 402-506, 1987.
Drummond, J., W. Cocke, E. Hege, and P. Strittmatter, Speckle interferometry of asteroids, Icarus, 61, 132-151, 1985.
Fischer, E., and C. Pieters, Remote determination of exposure degree and iron concentration of lunar soils using VIS-NfR spectroscopic methods, Icarus, 111,475-488, 1994.
Gaffey, M., Spectral reflectance characteristics of the meteorite classes, d. Geophys. Res., 81,905-920, 1976.
Gaffey, M., Rotational spectral variations of asteroid 8 Flora' Implications for the nature of the S-type asteroids and for the parent bodies of the ordinary chondrites, Icarus, 60, 83-114, 1984ø
Gaffey, M., The spectral and physical properties of metal in meteoritic assemblages: Implications for asteroid surface materials, Icarus, 66, 468-486, 1986.
Gaffey, M., and S. Ostro, Surface lithologic heterogeneity and body shape for asteroid (15) Eunomia • Evidence from rotational spectral variations and multicolor light curve inversions (abstract), Lunar Planet. Sci •, XVIII, 310-311, 1987.
Gaffey, M., J. Bell, and D. Cruikshank, Reflectance spectroscopy and asteroid surface mineralogy, in Asteroids II, edited by R. Binzel, T. Gehrels, and M. Matthews, pp. 98-127, Univ. of Ariz. Press, Tucson, 1989.
Gaffey, M., J. Bell, R. Brown, T. Burbine, J. Piatek, K. Reed, and D. Chaky• Mineralogic variations within the S-type asteroid class, Icarus, 106, 573-602, 1993.
Gradie, J., and J. Veverka, The wavelength dependence of phase coefficients, Icarus, 66, 455-467, 1986.
Granahan, J., et al., A Galileo multi-instrument spectral analysis of 951 Gaspra (abstract), Lunar Planet. Sci., XXV, 453-454, 1994.
Granahan, J., et al., Galileo multi-instrument spectral observations of 243 Ida and Dactyl (abstract), Lunar Planet. Sci., XXVI, 489-490, 1995.
Hiroi, T., J. Bell, H. Takeda, and C. Pieters, Modeling of S-type asteroid spectra using primitive achondrites and iron meteorites, Icarus, 102, 107-116, 1993.
Howell, E., E. Merenyi, and L. Lebofsky, Classification of asteroid spectra using a neural network, J. Geophys. Res., 99, 10,847-10,865, 1994.
Jones, T., and D. Morrison, A recalibration of the radiometric/photometric method of determining asteroid sizes, Astron. d., 79, 892-895, 1974.
Jurgens, R., and R. Goldstein, Radar observ•ti,,-• •t • • and !2.6 cm wavelength of asteroid 433 Eros, Icarus, 28, 1-15, 1976.
Larson, H., U. Fink, R. Treffers, and T. Gauthier, The infrared spectrum of asteroid 433 Eros, Icarus, 28, 95-103, 1976.
Lebofsky, L., and G. Rieke, Thermal properties of 433 Eros, Icarus, 40, 297-308, 1979.
McFadden, L., M. Gaffey, and T. McCord, Mineralogical-petrological characterization of near-earth asteroids, Icarus, 59, 25-40, 1984•
Millis, R., E. Bowell, and D. Thompson, UBV photometry of asteroid 433 Matthews, pp. 921-945, Uniw of Ariz. Press, Tucson, 1989. Eros, Icarus, 28, 53-67, 1976.
Belt.n, M., et al., Galileo encounter with 951 Gaspra: First pictures of an Miner, E., and J. Young, Five-color photoelectric photometry of asteroid asteroid, Science, 257, 1647-1652, 1992. 433 Eros, Icarus, 28, 43-51, 1976.
Belt.n, M., et al., First images of asteroid 243 Ida, Science, 265, 1543- Morris, R., Origin and evolution of the grain-size dependence of the 1547, 1994. concentration of fine-grained metal in lunar soils: The maturation of
Britt, D., and C. Pieters, Bidirectional reflectance properties of iron- lunar soils to a steady-state stage, Proc. Lunar Planet. Sci. Conf. 8th, nickel meteorites, Proc. Lunar Planet. Sci. Conf., 18th, 503-512, 1988. 3719-3747, 1977.
Britt, D., and C. Pieters, Darkening in black and gas-rich ordinary Morrison, D., The diameter and thermal inertia of 433 Eros, Icarus, 28, chondrites: The spectral effects of opaque morphology and 125-132, 1976. distribution, Geochim. Cosmochim. Acta, 58, 3905-3919, 1994. Nash, D., and J. Conel, Spectral reflectance systematics for mixtures of
2214 MURCI-ffE AND PIETERS: SPECTRUM AND HE•ROG•I• OF 433 EROS
powdered hypersthene, labradorite, and ilmenite, J. Geophys. Res., 79, 1611-1621, 1974.
Ostro, S., K. Rosema, and R. Jurgens, The shape of Eros, Icarus, 84, 334-351, 1990.
Pieters, C., Strength of mineral absorption features in the transmitted component of near-infrared reflected light: First results from R.ELAB, J. Geophys. Res., 88, 9534-9544, 1983.
Pieters, C., M. Gaffey, C. Chapman, and T. McCord, Spectrophotometry (0.33-1.07 gin) of 433 Eros and compositional implications, Icarus, 28, 105-115, 1976.
Pieters, C., E. Fischer, O. Rode, and A. Basu, Optical effects of space weathering: The role of the finest fraction, J. Geophys. Res., 98, 20,81 ?-20,824, 1993.
Tedesco, E., Asteroid magnitudes, UBV colors, and IRAS albedos and diameters, in Asteroids II, edited by R. Binzel, T. Gehrels, and M. Matthews, pp. 1090-1138, Univ. of Ariz. Press, Tucson, 1989.
Tholen, D., Asteroid taxonomy from cluster analysis of photometry, Pho D. thesis, Univ. of Ariz., Tucson, 1984.
Tholen, D., and M. Barucci, Asteroid taxonomy, in Asteroids II, edited by R. Binzel, T. Gehrels, and M. Matthews, pp. 298-315, Univ. of Ariz. Press, Tucson, 1989.
Trombka, J., W. Boynton, J. Briickner, S. Squyres, S. Bailey, Po Clark, Lo Evans, S. Floyd, R. Starr, R. Gold, J. Goldsten, and R. McNutt, The X- ray/gamma-ray spectrometer for the NEAR mission (abstract), Lunar Planet. Sci.,XXVI, 1421-1422, 1995.
Veeder, G., D. Matson, J. Bergstralh, and T. Johnson, Photometry of 433 Eros from 0.65 to 2.2 gin, Icarus, 28, 79-85, 1976.
Veverka, J., M. Malin, S. Murchie, J. Bell III, C. Chapman, L. McFadden, M. Robinson, and P. Thomas, Asteroid 433 Eros: High resolution imaging and spectral mapping from NEAR (abstract), Lunar Planet. Sci., XXVI, 1447-1448, 1995.
Vilas, F., and L. McFadden, CCD Reflectance spectra of selected asteroids, Icarus, 100, 85-94, 1992.
Wetherill, G., and C. Chapman, Asteroids and meteorites, in Meteorites and the Early Solar System, edited by J. Kerridge and M. Matthews, pp. 35-67, Univo of Ariz. Press, Tucson, 1988.
Wisniewski, W., Spectrophotometry and UBVRI photometry of Eros, Icarus, 28, 87-90, 1976.
Zellner, B., Physical properties of asteroid 433 Eros, Icarus, 28, 149- 153, 1976.
Zellner, B., and J. Gradie, Polarization of the reflected light of asteroid 433 Eros, Icarus, 28, 117-123, 1976.
Zellner, B., D. Tholen, and E. Tedesco, The eight-color asteroid survey: Results for 589 minor planets, Icarus, 61,355-416, 1985.
S.L. Murchie, Applied Physics Laboratory, Room 24E152, The Johns Hopkins University, Johns Hopkins Road, Laurel, MD 20723. (e-mail: [email protected])
C.M. Pieters, Department of Geological Sciences, Brown University, Providence, RI 02912.
(Received May 12, 1995; revised October 30, 1995; accepted November 7, 1995.)