
Specifying Required Performance when Purchasing Reciprocating...
28
What Performance Do You Really Need.doc Page 1 of 28 www.ACIServicesInc.com Phone: (740) 435-0240 y Fax: (740) 435-0260 125 Steubenville Ave. y Cambridge, Ohio 43725 Specifying Required Performance when Purchasing Reciprocating Compressors Purchasing a new compressor can be an involved and expensive process. Therefore, it is prudent that companies require a full array of compressor performance from bidding compressor packagers/OEMs. Otherwise, buyers may end up with equipment that may not be useable over the full operating maps for which the customers expect to operate. OEMs and packagers have been delivering simple point performance to end-users for more than half a century. While these are important reports to receive and review, there are additional types of compressor performance reports available today. Not only do these new reports give further insight into compressor operations and safety, but they also allow end-users to quickly review the compressor’s abilities across entire envelopes of operating ranges, instead of just a handful of limited operating points. A full performance review of a packager’s proposed solution to a purchaser’s compression needs will help identify where the unit is truly useful, and where the proposed unit may have potential operating limitations. Unfortunately, the standard deliverable of just a few printouts of performance at the specified design points, along with a few printouts of select performance curves, may not always identify potentially serious operating issues with reciprocating compressors. In general, as a unit’s operating map expands, it becomes even more important to fully review that unit’s performance across its entire operating map – all pressures, all temperatures, all speeds, variations in gas being compressed, and all load steps. To meet the needs of end-users and to help clarify to packagers and OEMs what compressor performance end-users really need, a useful check list for identifying various types of performance has been co developed. This concise list is detailed on the following page. End-users can simply specify which items are required and which items are highly recommended in any bid proposals. Items of no interest are easily deleted from the list. During the biding process, required/suggested items should be based on modeling of the proposed unit(s), albeit with allowances for certain yet-to-be-determined parameters, such as more accurate pressure drops via acoustic pulsation modeling. However, after the unit is purchased, all items should reflect the final compression system – as delivered to the end-user. Finally, the remaining sections of this document detail explicit types of compressor performance end- users should require/request from their packagers/OEMs when specifying new equipment, along with justifications for why those types of performance are required, and what type of responses the end-user might consider if a bidding packager/OEM cannot provide the required performance. Finally, each section contains a sample report, plot, curve, or data table of format similar to what the buyer should be specifying. Note: The various sections in this document are written so as to be independent of other items. Thus an end-user can extract just the items desired and create a list of performance required by their company. Electronic versions of this document in MS Word format can be downloaded from either www.CompressorTech2.com or www.ACIServicesInc.com .
-
Upload
vuongthien -
Category
Documents
-
view
214 -
download
0
Transcript of Specifying Required Performance when Purchasing Reciprocating...

What Performance Do You Really Need.doc Page 1 of 28
www.ACIServicesInc.com Phone: (740) 435-0240 Fax: (740) 435-0260
125 Steubenville Ave. Cambridge, Ohio 43725
Specifying Required Performance when Purchasing Reciprocating Compressors Purchasing a new compressor can be an involved and expensive process. Therefore, it is prudent that companies require a full array of compressor performance from bidding compressor packagers/OEMs. Otherwise, buyers may end up with equipment that may not be useable over the full operating maps for which the customers expect to operate. OEMs and packagers have been delivering simple point performance to end-users for more than half a century. While these are important reports to receive and review, there are additional types of compressor performance reports available today. Not only do these new reports give further insight into compressor operations and safety, but they also allow end-users to quickly review the compressor’s abilities across entire envelopes of operating ranges, instead of just a handful of limited operating points. A full performance review of a packager’s proposed solution to a purchaser’s compression needs will help identify where the unit is truly useful, and where the proposed unit may have potential operating limitations. Unfortunately, the standard deliverable of just a few printouts of performance at the specified design points, along with a few printouts of select performance curves, may not always identify potentially serious operating issues with reciprocating compressors. In general, as a unit’s operating map expands, it becomes even more important to fully review that unit’s performance across its entire operating map – all pressures, all temperatures, all speeds, variations in gas being compressed, and all load steps. To meet the needs of end-users and to help clarify to packagers and OEMs what compressor performance end-users really need, a useful check list for identifying various types of performance has been co developed. This concise list is detailed on the following page. End-users can simply specify which items are required and which items are highly recommended in any bid proposals. Items of no interest are easily deleted from the list. During the biding process, required/suggested items should be based on modeling of the proposed unit(s), albeit with allowances for certain yet-to-be-determined parameters, such as more accurate pressure drops via acoustic pulsation modeling. However, after the unit is purchased, all items should reflect the final compression system – as delivered to the end-user. Finally, the remaining sections of this document detail explicit types of compressor performance end-users should require/request from their packagers/OEMs when specifying new equipment, along with justifications for why those types of performance are required, and what type of responses the end-user might consider if a bidding packager/OEM cannot provide the required performance. Finally, each section contains a sample report, plot, curve, or data table of format similar to what the buyer should be specifying. Note: The various sections in this document are written so as to be independent of other items. Thus an end-user can extract just the items desired and create a list of performance required by their company. Electronic versions of this document in MS Word format can be downloaded from either www.CompressorTech2.com or www.ACIServicesInc.com.

What Performance Do You Really Need.doc Page 2 of 28
www.ACIServicesInc.com Phone: (740) 435-0240 Fax: (740) 435-0260
125 Steubenville Ave. Cambridge, Ohio 43725
Check List for Required Compressor Performance for New Units
Point Performance Runs o All Guarantee and Design Points
OEM Compressor Modeling File
Full Unit Information
o Detailed unit diagram, geometries, unloading device types/volumes, weights, etc.
Expected Pressure Drops
Safe Startup Maps
Maps Where Rod Load Issues Exist o Include all pressure combinations, all load steps and full range of speeds
Maps Where Pin Non-reversal Issues Exist
o Include all pressure combinations, all load steps and full range of speeds
Highest Expected Discharge Temperature Maps o Include all pressure combinations, all load steps and full range of speeds o Include associated Flow Rates
Highest Expected Discharge Pressure Maps
o Include all pressure combinations, all load steps and full range of speeds
Sidestream Review
Unit Robustness Map
Performance Curves o Sets must include varying speed, when appropriate o Suction vs. Load, and Suction vs. Flow Curves: o Discharge vs. Load, and Discharge vs. Flow Curves:
Flow Maps
Unit (and/or System) Isentropic Efficiency Maps
Compression Ratio Maps
Load Step Curvature Review
Acoustic Review across Entire Operating Map

What Performance Do You Really Need.doc Page 3 of 28
www.ACIServicesInc.com Phone: (740) 435-0240 Fax: (740) 435-0260
125 Steubenville Ave. Cambridge, Ohio 43725
Point Performance Runs for All Guarantee Points and All Design Points Point Performance Runs – Required Item
Item(s) Point Performance runs for all Guarantee Points and all Design Points. Reason(s) Used as part of warranty for the unit being considered; used to verify that unit is correctly
sized to meet specified flow rates at the specified guarantee and design points. Response If data is not provided, then buyer should seriously consider an alternate
packager/OEM. In general, point performance reports are always supplied. Usually there are from one (1) to five (5) guarantee points, and anywhere from one (1) to thirty (30) design points.

What Performance Do You Really Need.doc Page 4 of 28
www.ACIServicesInc.com Phone: (740) 435-0240 Fax: (740) 435-0260
125 Steubenville Ave. Cambridge, Ohio 43725
Compressor’s Modeling File
Compressor Modeling File – Required Item Item(s) File of compressor model used in OEM software of unit, such as an eAjax file, an Ariel
RUN file, a Superior Cascade or Compass file, a DR-Size file, a KWPerformance file, or a GE EZ Size Pro file.
Reason(s) Used for identifying compressor performance after unit is brought online. Used to identify unit’s hardware configuration. Used by end-user and third parties to create models of unit for automation purposes, in-house modeling, for use in reservoir models, etc.
Response If file is not provided, then buyer should consider an alternate packager/OEM.
Each of the major compressor OEMs has their own performance software for modeling their line of compressors. Thus, when a new unit is ordered, specify that the electronic file used for the model is to also be delivered.
OEM Software Files Ajax (Cameron Compression Systems) eAjax™ *.eaj Ariel Ariel Performance Software™ *.run Dresser-Rand DRSize™ *.inp Gemini (GE Energy) EZSize Pro™ *.ezs Knox Western KW-Performance Software™ *.kps Superior (Cameron Compression Systems) Cascade™ *.cas Superior (Cameron Compression Systems) Compass™ *.ccs
Compressor performance software is used to predict loads, flow rates, and areas where high discharge temperatures, high interstage pressures, rod loads, pin non-lubrication, low volumetric efficiencies, and other issues, such as formation of liquids, may occur. These predictions are based on theoretical modeling, which should be reasonably close to measured data. Therefore, somewhere in the OEM software, there should be a section of text detailing within what tolerance levels the OEM predictions typically compare with measured data, and also specifications for when those tolerance levels actually apply.
Note: Attenuation devices, piping changes, cooler changes, different gas analyses, etc. all can impact system pressure drops and gas pulsations. These in turn affect measured loads and flows. Therefore, those items need to be compensated in the compressor model if you expect predicted loads and flows to be consistent with measured data.
Theoretical P-V Card Actual P-V Card

What Performance Do You Really Need.doc Page 5 of 28
www.ACIServicesInc.com Phone: (740) 435-0240 Fax: (740) 435-0260
125 Steubenville Ave. Cambridge, Ohio 43725
Full Unit Information Complete Unit Geometry – Required Item
Item(s) Driver ratings, compressor frame stroke, frame and cylinder ratings, weights and limits used for rod load and pin reversal calculations, cylinder bore and rod diameters, connecting rod length, cylinder volumetric clearances (base clearances per end, actual clearances with unloading devices per end, volumes of all volume bottles), and valve information for each type of valve.
Reason(s) Necessary information if additional load/flow devices are to be added later to the unit or if new types of valves are later used. Required information to create automation routines to effectively and safely control the unit.
Response If data is not provided, then buyer should consider an alternate packager/OEM. A full unit information report should include a layout of the unit as sold and installed. Furthermore, there should be clear listings of:
• Driver information and rating, • Frame rating, • Length of connecting rods, • Cylinder bore sizes, • Individual cylinder staging, • Initial, fixed volumetric base clearances for
each end (i.e. clearances that do not reflect added fixed volumes from valves and/or unloading devices),
• Actual base clearances used (i.e. clearances that do reflect added fixed volumes from valves and/or unloading devices),
• Description of how tandem cylinders are setup, • Cylinder pressure ratings, • Piston and Tail Rod diameters, • Clear limits used for rod loads (gas and/or inertia), • Clear limits for pin non-reversals, • Weights used per throw for net rod load determination, • Weights per throw used for pin reversal determinations, • Clear temperature limits per cylinder, • Clear low volumetric efficiency limits, • Valve information:
o Quantity, o Size (i.e. nominal diameters), o Effectiveness (flow areas, lift areas, resistance factors, etc.).
While much of this information may be found in the supplied OEM modeling file, some of it may not be clearly identifiable to the end-user – often items that involve weights and valves are obfuscated and thus are difficult to find in some of the OEM software.

What Performance Do You Really Need.doc Page 6 of 28
www.ACIServicesInc.com Phone: (740) 435-0240 Fax: (740) 435-0260
125 Steubenville Ave. Cambridge, Ohio 43725
Sample
Unit
Arrangement
Diagrams
Access to the correct unit information is critical to others who may need to accurately model units. The most common reasons for modeling a unit are:
• Unit Automation, • Converting OEM models for use with in-house and/or third-party software, such as:
o Performance: eRCM™, HTS™, RCS Excalibur™, RecipWin™/Recipak-PC™, etc. o Fleet Monitoring Software: Enalysis™, HPMax™, RECON™, MAO™, and others. o Piping Software: Stoner™, WinFlow™, etc.
If a new unit cannot be properly modeled in other software used by the end-user, then the ability to fully utilize that unit may suffer. Or even worse, the unit may be allowed to operate at unsafe conditions.

What Performance Do You Really Need.doc Page 7 of 28
www.ACIServicesInc.com Phone: (740) 435-0240 Fax: (740) 435-0260
125 Steubenville Ave. Cambridge, Ohio 43725
Expected Pressure Drops Stage Pressure Drops – Required Item
Item(s) Expected system pressure drops (bottles, filters, separators, piping, etc.) into and out of each stage. As a minimum, these need to be specified as fixed drops and/or percent drops. Ideally, pressure drops are given as a function of expected flow rates. When a detailed acoustic study is performed, better estimates of pressure drops due to inclusion of attenuation devices are determined.
Reason(s) Used to better model unit performance, and hence improve accuracy of load and flow predictions. Also, can affect rod load and pin reversal calculations and hence the model’s ability to keep the unit safe.
Response If pressure drops are not provided, then buyer can work with their own analysts to measure some actual pressure drops through the system.
In general, whenever an acoustic study is performed, pressure drops are determined throughout the system. For compressor performance in particular, the collective pressure drops between where the inlet pressure is sensed and the inlet cylinder flange, and from the cylinder discharge flange to the where the final discharge pressure is sensed are the pressure drops required. Ideally, these pressure drops will be given as a function of flow rates. However, for simplicity, most packagers/OEMs model their units based on pressure drops given as fixed pressure drops, or as a percent of stage inlet and outlet pressures (absolute). A table of these pressure drops per stage (into and out of that stage) should be given to the end user. Furthermore, a diagram should be provided that details between what locations the estimated pressured drops apply. Note: Often, the use of orifice plates, especially on high-speed units that single-act, can contribute to significant pressure drops (especially dynamic pressure drops). In some cases, such as low compression ratios, use of orifice plates can affect unit performance by as much as 30%! This is important information to know prior to ordering a driver and/or getting emission permits. Supplied performance curves, in-house models, third-party models, and monitoring software should all reflect the appropriate pressure drops estimated via the pulsation study after appropriate attenuation devices have been selected and modeled. Stage-1 Pressure Drops (sample):
Load Step
Speed (rpm)
Suction Pressure @
Sensor (psiA)
Suction Pressure @
Flange (psiA)
Discharge Pressure @
Flange (psiA)
Discharge Pressure @
Sensor (psiA)
Flow Rate
(MMscfd) 1 1000 145 140 361 345 380.9
12 950 195 191 539 520 260.8

What Performance Do You Really Need.doc Page 8 of 28
www.ACIServicesInc.com Phone: (740) 435-0240 Fax: (740) 435-0260
125 Steubenville Ave. Cambridge, Ohio 43725
Safe Startup Maps Safe Startup Maps – Required Item
Item(s) Safe Startup Maps Reason(s) Identifies when the unit can be brought online at minimum speed, least-load load step, and
pressures experienced when closing the recycle valve. If the least-load load step cannot always be used, then the map needs to identify which load step must be selected prior to closing the recycle valve to safely start the unit. At times, the unit may only be safely started by first reducing the suction pressure so as to prevent rod loads and/or pin non-reversals.
Response If the packager/OEM cannot specify under what pressure and speed conditions it is safe to start the unit, then consider an alternate packager/OEM. Or, make sure their warranty covers all startup operating conditions.
It is important to know when a unit can be safely started. During the startup process, the inertia effect from the lower speed combined with the gas pressures experienced when closing the bypass valve to begin the compression event may lead to rod load, and/or pin non-reversal issues on certain load steps. Occasionally, the load step affected may be the least-load load step (i.e. all pockets open, all applicable ends deactivated). Most automated units are usually started in their least-load load step. This can sometimes create a serious problem. Therefore, it may be necessary to change to a different load step, or even decrease the suction pressure to an acceptable pressure prior to starting the unit.
In the above example, suction pressure should be decreased to less than 29 psig. Furthermore, where the least-load load step (#25) is not indicated (yellow regions in the table), the unit’s hardware configuration should be set to the required load step (number in the cell) prior to closing the bypass valve.

What Performance Do You Really Need.doc Page 9 of 28
www.ACIServicesInc.com Phone: (740) 435-0240 Fax: (740) 435-0260
125 Steubenville Ave. Cambridge, Ohio 43725
Rod Load and Pin Reversal Maps Full Rod Load Review – Required Item
Item(s) Review of where rod load issues exist for each load step, across all pressure combinations, and all speeds. Rod load reports should be based on using identical or similar methods used by OEM for unit warranty.
Reason(s) Identifies where unit can experience rod load issues. These change (often very quickly) with varying pressures, speeds and load steps, and even suction temperatures. Very often overlooked leaving end-users stuck with a unit that has a very limited operating map.
Response If the packager/OEM cannot identify for what combinations of pressure and speed and load steps the unit will experience rod load issues, then either consider another packager/OEM or have these determined by in-house or third-party software.
Full Pin Non-reversal Review – Required Item
Item(s) Review of where pin non-reversal issues exist for each load step, across all pressure combinations, and all speeds.
Reason(s) Identifies where unit can experience pin non-reversal issues. These change (often very quickly) with varying pressures, speeds and load steps, and even suction temperatures. Very often overlooked leaving end-users stuck with a unit that has a very limited operating map.
Response If the packager/OEM cannot identify the combinations of pressure and speed and load steps for which the unit will experience pin non-reversal (failure to lubricate crosshead pin) issues, then either consider an alternate packager/OEM or have these determined by in-house or third-party software.
An initial review covering all load steps, all speed, all throws, and all stages should be determined across the entire defined operating map of suction and discharge pressures. If any issues with rod loads or pin reversal exist, then all load steps that might contribute to those problem areas need to be reviewed in more detail. For each load step having rod load, or pin reversal issues, a detailed map of where the issues exist is required before automating the unit. Otherwise, the automation algorithms may allow the unit to operate in unsafe territory. For fixed-speed units, a single speed is sufficient. For variable speed units, a complete review of all speeds (or at least maximum, medium, and minimum speeds) is required.

What Performance Do You Really Need.doc Page 10 of 28
www.ACIServicesInc.com Phone: (740) 435-0240 Fax: (740) 435-0260
125 Steubenville Ave. Cambridge, Ohio 43725
Individual Load Step’s Rod Load Plot Details Worst Case of All Operating Speeds PS vs. PD vs. Percent of Rod Load Rating
Individual Load Step’s Pin Reversal Plot
At One Particular Speed PS vs. PD vs. Minimum Degrees of Reversal
Do Full Unit Reviews
ALL Load Steps, ALL Speeds, ALL Pressure Combinations
The adjacent plot details where the unit experiences its worst cases for Pin Non-reversals, when the unit is running between 60% and 100% of Rated Load. This one plot covers all load steps, all speeds, and all pressure combinations.
PS vs. PD vs. Minimum Degrees of Reversal

What Performance Do You Really Need.doc Page 11 of 28
www.ACIServicesInc.com Phone: (740) 435-0240 Fax: (740) 435-0260
125 Steubenville Ave. Cambridge, Ohio 43725
Individual Load Step’s Safety Plot for Rod Load
and Pin Non-reversal Issues
Plot Results are Based on a Single Load Step: Suction Pressure vs. Discharge Pressure, All
Speeds, and Various Suction Temperatures per Stage Combinations.
Red Areas: Always Unsafe, and Why
Green Areas: Always Safe
Yellow Areas: Some Areas are Unsafe, and Why

What Performance Do You Really Need.doc Page 12 of 28
www.ACIServicesInc.com Phone: (740) 435-0240 Fax: (740) 435-0260
125 Steubenville Ave. Cambridge, Ohio 43725
Highest Expected Discharge Temperature and Discharge Pressure Maps Discharge Temperature and Pressure Maps – Required Item
Item(s) Highest Expected Discharge Temperature and Discharge Pressure Maps per stage, at least for average and maximum suction temperatures.
Reason(s) Used to verify coolers are sufficient to cool the volumes of gas being discharged from the expected discharge temperatures to the required aftercooler temperatures, and to avoid potentially adverse operating conditions.
Response If packager/OEM cannot provide these maps, then they need to provide runs reflecting operations at conditions where highest discharge temperatures and highest interstage discharge pressures are expected. These select runs need to include information required to verify interstage coolers and aftercoolers performance.
To verify that the supplied cooler(s) is(are) sized properly, a full review of possible discharge temperatures across the entire operating map is required. Tables should be created for each stage and should reflect the highest discharge temperatures possible considering all safe load steps (across all speeds), and should be done at least for the minimum and maximum gas suction temperatures per stage. To properly review coolers, it is also necessary to know the flow rates associated with each of the expected maximum discharge temperatures. Discharge Temperature (°F) Maps: Stage Table View 3D View
Stage-1
Max=276° F, Min=105° F

What Performance Do You Really Need.doc Page 13 of 28
www.ACIServicesInc.com Phone: (740) 435-0240 Fax: (740) 435-0260
125 Steubenville Ave. Cambridge, Ohio 43725
Stage-2
Max=307° F, Min=292° F
Sometimes, especially for systems with under-sized coolers, sidestreams in/out, or refrigeration processes between stages, it is necessary to determine the maximum discharge pressure per stage. If required, tables and plots similar to the ones above should be generated for discharge pressures per stage.

What Performance Do You Really Need.doc Page 14 of 28
www.ACIServicesInc.com Phone: (740) 435-0240 Fax: (740) 435-0260
125 Steubenville Ave. Cambridge, Ohio 43725
Sidestream Reviews Sidestream Review – Required Item if Sidestreams are Present
Item(s) Review methods used to model units with sidestreams (fixed flow rate method or fixed pressure method).
Reason(s) Varies based on purpose of sidestreams. Required to predict unit flow, unit load, composite gas composition, etc.
Response If the packager/OEM cannot identify loads, flow rates, and gas thermodynamics for sidestreams involved, then it may be critical that these are accurately determined by in-house or third-party software.
OEM software packages allow for inclusion of sidestreams into and out of the gas system between compressor stages. Sidestreams may come from a process, go to fuel engines, result from dropouts of heavier gases, etc. In any case, the interstage from which the sidestream emanates can normally be modeled in one of two ways: interstage pressure fluctuates or interstage pressure is held fairly constant. Case I: Static Flow Rates / Varying Pressures:
For sidestreams out, a static flow rate is typically specified.
For sidestreams in, a static flow rate is typically specified, along with the gas temperature and a gas analysis of the sidestream.
These types of models assume that the sidestream volumes per stage are constant and the sidestream pressures fluctuate as needed to maintain the indicated static flow rates. Most OEM software can effectively model these types of sidestreams.
Case II: Static Ratios / Varying Flow Rates / Varying Pressures:
Sidestream flow rates are varied so as to maintain a constant ratio of compressed gas with sidestream gas. This is often done by precisely specifying the ratios of the gases, or indicating that the sidestream gas is a fixed percent (mole weight) of the total gas to be compressed on each stage. Sidestream gas temperatures and gas analyses are specified per each stream in.
Case III: Varying Flow Rates / Static Pressures: If the pressures to the interstages are being held fairly constant via sidestream sources (in or out), the end-user needs to clarify this to the packager/OEM. Thus, in this situation, the flow rates of the sidestreams vary while the pressures stay relatively constant. End-users need to consult with their packager/OEM to see if these types of sidestreams are effectively modeled.

What Performance Do You Really Need.doc Page 15 of 28
www.ACIServicesInc.com Phone: (740) 435-0240 Fax: (740) 435-0260
125 Steubenville Ave. Cambridge, Ohio 43725
For simple and complex systems, individual performance points are useful in any of the above cases. However, full performance (curves, tables, plots, etc.) over a unit’s entire operating range can be very misleading if the wrong case is modeled. In general, full performance can readily be completed for Cases I and II. Case III can present problems as final required loads and flows are further dependent upon dynamic sidestream flows required to maintain constant interstage pressures. End-users should specify exactly what types of plots, curves, tables, etc. they desire. In many cases, the end-user may have to create their own reports based on using the OEM software to generate multiple point performance runs. Customized software can be ideal for these more complex sidestream applications.
Formation of Liquids In general, liquids should never form inside the compressor. However, depending upon the thermodynamic properties of the fluid being compressed, this can happen. In general, the OEM/packager can review the range of pressures and temperatures for which the gas is exposed to make sure that liquids do not form within the cylinder. By reviewing the pressures and temperatures experienced as the gas migrates through the compression process, the software can determine when, and how much, liquid is formed from the gas as dropout. For exotic gases, much care needs to be taken to make sure that the thermodynamic model used in the compressor performance software can properly model that gas across the pressure and temperature envelopes. If not, then a high-end thermodynamic model for gas properties may be required. Operations near critical areas (such as the triple point or phase transitions) need to be carefully designed and meticulously implemented.
Also, prodigious care should be taken to ensure that the thermodynamic model being used is valid for each gas mixture being reviewed. Otherwise, any performance results may be completely baseless.
High CO2 Natural Gas

What Performance Do You Really Need.doc Page 16 of 28
www.ACIServicesInc.com Phone: (740) 435-0240 Fax: (740) 435-0260
125 Steubenville Ave. Cambridge, Ohio 43725
Unit Robustness Map Unit Robustness Map – Required for Automated Operations: Recommended for Manual Operations
Item(s) Unit Robustness Map across all pressure combinations indicates relative ease for automating the unit.
Reason(s) Used by automation groups to identify how difficult and time-consuming the process of automating this unit will be. Identifies how sensitive the unit’s safety is to changes in speed, temperatures and load step. It can also serve to identify how difficult it can be to keep the unit safe while in manual operation.
Response If the packager/OEM cannot create these maps, then have these determined by in-house or third-party software.
These maps review all load steps, across all speed ranges, across various combinations of suction gas temperatures per stage, for all combinations of suction and discharge pressures permitted for this unit. As such, these maps can take hours to generate (often from 1 million to 150 million performance points are calculated to render these types of maps). However, the resulting plot can help the end-user evaluate how effectively the unit can be used in certain areas of the operating map, as well as assessing the complexity of automating the unit. Areas of bright green (always safe) and bright red (always unsafe) are regions for which relatively straightforward PLC algorithms can safely control the unit. Areas of darker green and orange indicate the need for more complex controls. In general, the more bands of color, the more complex the unit will be to safely automate – darker bands indicate that some of the normally valid and safe load steps will become unsafe simply due to changes in speed or suction temperatures (number in cell indicates the maximum number of load steps that can possibly be used).

What Performance Do You Really Need.doc Page 17 of 28
www.ACIServicesInc.com Phone: (740) 435-0240 Fax: (740) 435-0260
125 Steubenville Ave. Cambridge, Ohio 43725
Performance Curves Performance Curves – Highly Recommended
Item(s) Suction Pressure vs. Load Suction Pressure vs. Flow Discharge Pressure vs. Load Discharge Pressure vs. Flow Suction Pressure vs. Discharge Pressure, per load step. Sets of above curves from maximum speed to minimum speed in decrements of no
more than 50 RPM (for high speed) and 20 RPM for low speed. Reason(s) Used by operators and/or simple control panels to safely control the unit across its defined
operating map. Curves help to identify where safety issues exist that render certain load steps unsafe for use at current operating conditions.
Response If curves are not provided, then buyer can often create them with their own software, or via third-party software. However, curves may not exactly match OEM’s performance predictions and cutoff for safety. If the OEM curves cannot be tuned to real-world measured data, then their importance is diminished, and third-party performance curves that can be tuned are favored.
End-users should not allow packagers/OEMs to go skimpy on curves. This can be done by making sure all generated curves are based on at least fifty (50) performance points per load step curve. Sometimes the supplier only uses five (5) to ten (10) points per curve. Use of a low number of points can lead not only to jagged plots, but more importantly can lead to unsafe areas being shown as safe, or safe areas being shown as unsafe. An exception would be if the unit does not have a lot of cutoffs due to rod loads and/or pin non-reversals, then the use of at least twenty (20) points per curve is usually OK. For units utilizing a variable speed driver, each set of curves should be generated at various speeds from maximum speed down to minimum speed in decrements of no more than 50 RPM (for high-speed) and 20 RPM for low-speed units. Failure to cover speed ranges can lead to situations where rod loads and/or pin non-reversal issues are not properly disclosed. Curves that look good at rated speed may be seriously clipped due to pin non-reversal at minimum speeds. Curves that look good at minimum speeds may be seriously clipped due to rod load issues at maximum speeds. There are also cases where curves that look good at rated speeds and minimum speeds may be seriously clipped at in-between speeds due to rod loads and/or pin non-reversal issues. End-users need to specify which types of curves the supplier is required to deliver.
What Performance Do You Really Need.doc Page 18 of 28
www.ACIServicesInc.com Phone: (740) 435-0240 Fax: (740) 435-0260
125 Steubenville Ave. Cambridge, Ohio 43725
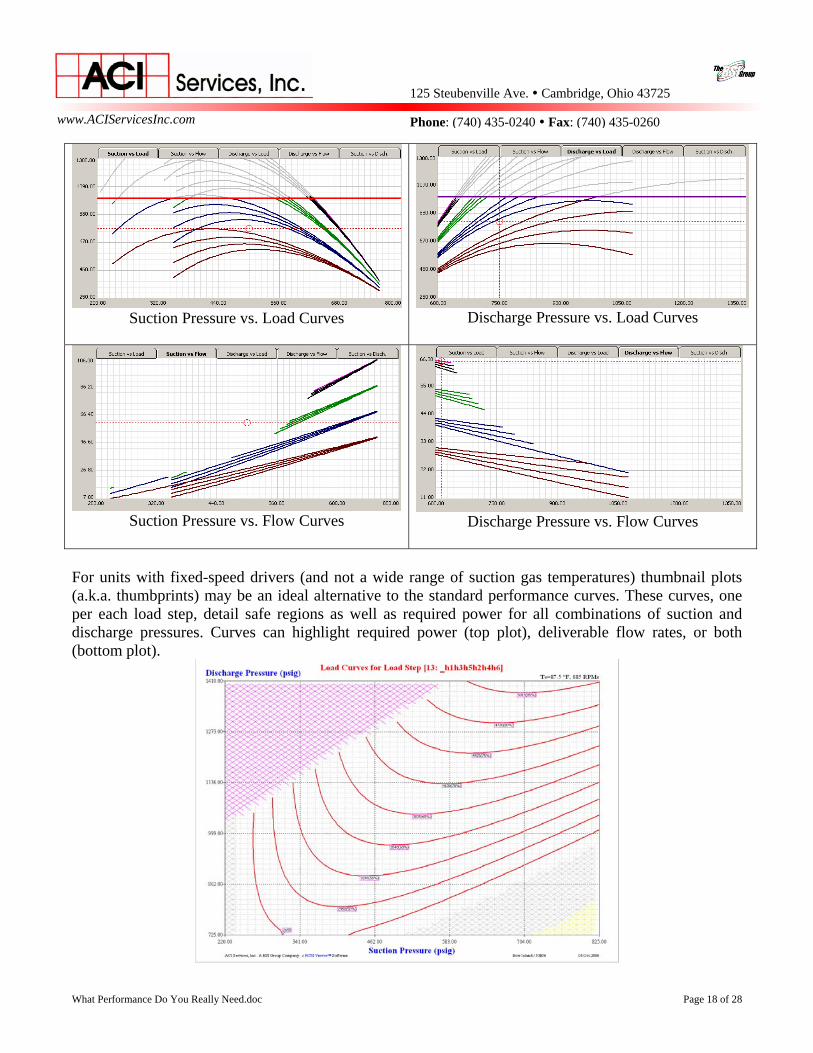
Suction Pressure vs. Load Curves Discharge Pressure vs. Load Curves
Suction Pressure vs. Flow Curves
Discharge Pressure vs. Flow Curves
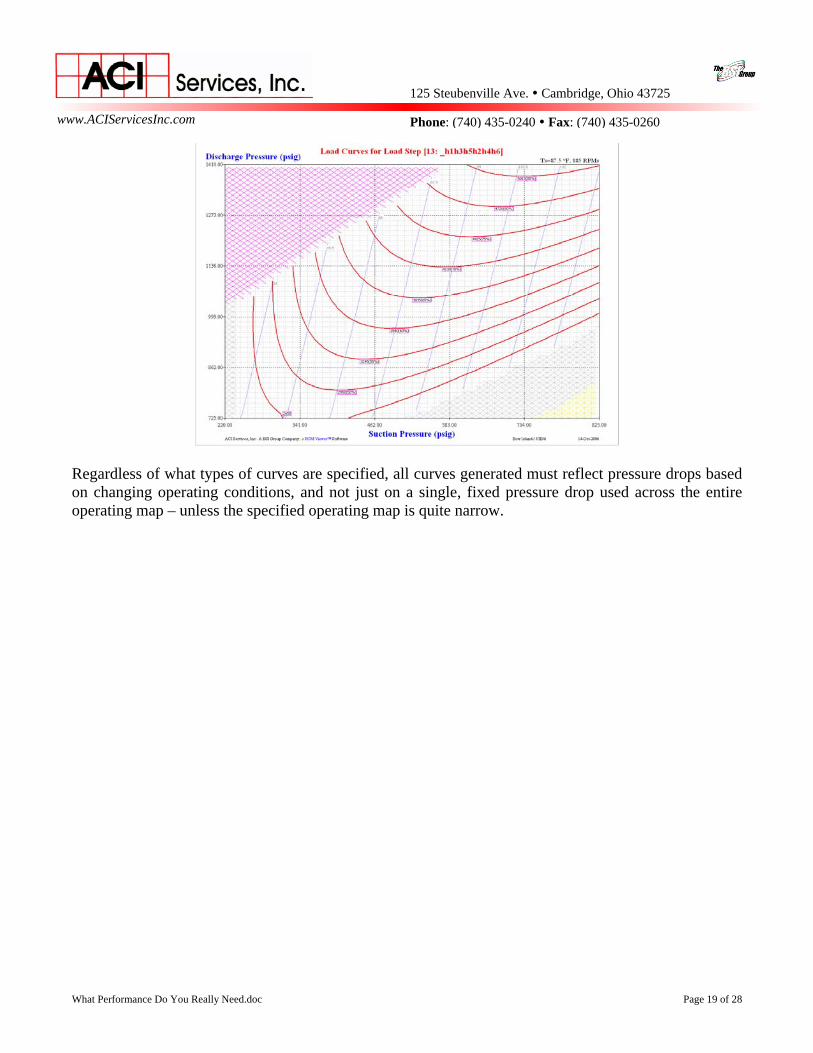
For units with fixed-speed drivers (and not a wide range of suction gas temperatures) thumbnail plots (a.k.a. thumbprints) may be an ideal alternative to the standard performance curves. These curves, one per each load step, detail safe regions as well as required power for all combinations of suction and discharge pressures. Curves can highlight required power (top plot), deliverable flow rates, or both (bottom plot).
What Performance Do You Really Need.doc Page 19 of 28
www.ACIServicesInc.com Phone: (740) 435-0240 Fax: (740) 435-0260
125 Steubenville Ave. Cambridge, Ohio 43725
Regardless of what types of curves are specified, all curves generated must reflect pressure drops based on changing operating conditions, and not just on a single, fixed pressure drop used across the entire operating map – unless the specified operating map is quite narrow.

What Performance Do You Really Need.doc Page 20 of 28
www.ACIServicesInc.com Phone: (740) 435-0240 Fax: (740) 435-0260
125 Steubenville Ave. Cambridge, Ohio 43725
Flow Maps Flow Maps – Suggested Item
Item(s) Flow Maps from minimum to maximum desired flows, in user-specified increments. Reason(s) Used by Gas Control/Dispatch to quickly identify when specific units can be used to
achieve company’s flow requirements. Response If the packager/OEM cannot create these maps, then these can often be created by in-
house or third-party software. Flow Maps, from the unit’s minimum achievable flow rate to its maximum achievable flow rate in user-specified increments, are ideal for Gas Control/Dispatch. These plots allow for a quick lookup of where the compressor can effectively flow a certain amount of gas. Gas Control/Dispatch rarely are concerned with particulars such as unit speed and load step, but rather they are more concerned with the volume of gas moving through the system based upon available inlet and discharge pressures. In the adjacent example, suction pressure (x-axis) is plotted against discharge pressure (y-axis). The green areas indicate where the unit can achieve the desired flow rate of 30 MMscfd, white areas are where it is unsafe to run the unit, yellow areas are where it cannot flow the desired flow rate, and red areas indicate that the unit cannot be turned down enough to meet the desired flow rate. A series of these plots can then be generated for 20, 25, 30, 35, 40, 45 and 50 MMscfd to cover the range of flow rates possible with this unit. Now, Gas Control can just reference these plots to quickly decide if this unit can be used to help achieve specific flow rates. Alternatively, some users may prefer Flow versus Discharge Pressure plots of specific Suction Pressures. While this type of plot is not quite as complete or informative as Flow Maps, it can be significantly more compact as it details ranges in suction pressure, discharge pressure, and flow all in one graph.
30 MMscfd

What Performance Do You Really Need.doc Page 21 of 28
www.ACIServicesInc.com Phone: (740) 435-0240 Fax: (740) 435-0260
125 Steubenville Ave. Cambridge, Ohio 43725
Unit Isentropic Efficiency Map Isentropic Efficiency Map – Suggested Item
Item(s) Unit Isentropic Efficiency Map (at least at rated speed) across all pressure combinations. Reason(s) Identifies efficiency of compressor. If the data from an acoustic study and the resulting
corrections to required unit loading due to attenuation devices are included, then the map gives the efficiency of the system from header to header. Note: use of certain attenuation devices, such as orifice plates, can sometimes significantly reduce system efficiency even if the compressors themselves are quite efficient.
Response If an isentropic efficiency map is not provided, then packager/OEM should at least identify the unit and overall system efficiencies at the design and guarantee points.
While there are different ways to measure the effectiveness of a compressor, one common method is the use of Isentropic Efficiency. This method gives a percent of effectiveness by taking the amount of theoretical power that should be required to compress the gas and dividing it by the amount of power a unit eventually needs to compress the gas. Part of the total power losses is related to the compressor (gas passageways, valves, frictional losses, etc.) and part is related to the acoustic dampening systems (bottles, orifice plates, choke tubes, etc.). (Readers may want to review a few GMC papers available at www.GMRC.org for more details on differences on compressor –specific methods versus system-specific methods.) The supplier should make it clear whether the supplied map is just for the compressor, or for the entire system. In general, the entire system map is best as it details the actual situation. However, if the pulsation dampening system is very restrictive to gas flow, the resulting isentropic efficiency map may look as if the compressor is not very efficient. The best situation is to generate both models. A significant difference between them indicates a very costly (in terms of power and reduced flows) acoustic dampening system. For high-speed units needing a lot of single-acting compression, this is often the price paid to utilize a wide range of unloading capabilities (often the case for units used for injection and withdrawal services).

What Performance Do You Really Need.doc Page 22 of 28
www.ACIServicesInc.com Phone: (740) 435-0240 Fax: (740) 435-0260
125 Steubenville Ave. Cambridge, Ohio 43725
PS vs. PD vs. Unit Isentropic Efficiency (%)
Isentropic Efficiency = GasCompresstoRequiredPowerActual
GasCompresstoRequiredPowerlTheoretica
A similar graph that details the amount of required load per unit of flow (often referred to as BHP/MM) can highlight areas where the unit is less efficient. Since these plots are based on how much power is required to compress each unit of flow, they are often used in part for dollar-based decisions since many end-users have historic data available for estimating how much they spend per horsepower used.

What Performance Do You Really Need.doc Page 23 of 28
www.ACIServicesInc.com Phone: (740) 435-0240 Fax: (740) 435-0260
125 Steubenville Ave. Cambridge, Ohio 43725
Compression Ratio Maps Compression Ratio Maps – Suggested Item
Item(s) Provide Compression Ratio Maps across all pressure combinations per stage. Report should generate maximum (and if requested, minimum) compression ratios.
Reason(s) Used to help balance compression ratios across stages, and sometimes used to maintain safety related to rod load issues. Also, higher ratios usually lead to higher discharge temperatures.
Response If the packager/OEM cannot create these maps, then have these determined by in-house or third-party software.
Ratios of compression per stage may be required for controlling rod loads, controlling temperatures, or balancing unloading across stages. Tables of data should be created for each stage, and should reflect the highest and lowest ratios possible considering all safe load steps (across all speeds). Compression Ratio Maps: Stage Table View Ranges
Stage-1
Max = 4.0
Min = 1.8
Average = 2.1
Stage-2
Max = 4.4
Min = 1.0
Average = 2.1

What Performance Do You Really Need.doc Page 24 of 28
www.ACIServicesInc.com Phone: (740) 435-0240 Fax: (740) 435-0260
125 Steubenville Ave. Cambridge, Ohio 43725
Load Step Curvature Reviews
Load Step Curvature – Suggested Item Item(s) Load Step Curvature Review is used to identify which load steps (and where) are quite
steep in nature, and thus small changes in pressure can have significant changes in load and flow. Also, steep load step curves tend to be more difficult to tune and automate.
Reason(s) Identifies units that have unreasonably steep load curves, which in turn create problems with operations and tuning. Note: Units with steep load curves are often not sized correctly.
Response If the packager/OEM cannot create these maps, then have these determined by in-house or third-party software.
Often, when reviewing performance based on just simple performance points, the end-user may not notice how fast load and flow can change based on small changes in pressure. A review of the steepness of the proposed load curves can quickly identify this type of issue. Often, steep load curves may indicate improper sizing of cylinders. In the adjacent plot, green identifies areas of relative flatness, while yellow identify areas of normal curvature to be expected, and orange areas reflect where the curves are becoming a bit too steep. Red areas are unsafe areas for this load step. Large areas of green and yellow are ideal. Some areas of orange are to be expected, but these areas should only represent a small portion of the overall safe operating map. Units with steep load step curves can prove difficult to automate and tune. This is due to the inherent nature of those load steps generating large changes in load and flow for relatively small changes in pressure.

What Performance Do You Really Need.doc Page 25 of 28
www.ACIServicesInc.com Phone: (740) 435-0240 Fax: (740) 435-0260
125 Steubenville Ave. Cambridge, Ohio 43725
Full Acoustic Review Full Review of Unit Acoustics Across Entire Operating Map – Suggested Item
Item(s) Acoustic Report. Detailed acoustics reports of performance at design and guarantee points, review of thousands of potential operating points with identification of areas in the operating map where vibration and acoustic issues may still be present even with attenuation devices in place. Provide data in a useable format (for use in OEM/third-party compressor modeling software) for tuning load, flow and pressure drops across entire operating map.
Reason(s) Often, acoustic reviews are performed centered around the design and guarantee points. However, the attenuation devices specified by this review may not fully dampen all pulsations within API guidelines, especially the pulsations that affect loads and flows. Thus, unforeseen shaking forces may be experienced at certain combinations of pressure, speed and load step. Furthermore, initial software/PLC predictions of load and flow may not adequately reflect load and flow accurately enough for safe unit operations.
Response If the company performing the acoustic review (and thus specifying attenuation devices to add to the system to prevent dangerous levels of vibration) cannot perform a review across the entire map, then:
1. Accept report as-is and accept possible consequences, or 2. Include additional points in the original specification to at least potentially
identify some problem areas, and to learn more about what may happen within the specified operating map. or
3. Specify a company that is capable of performing a full acoustic review. These reports vary a lot and can be quite voluminous. In regards to performance, the end-user needs to review areas in the report that indicate how static and dynamic pressure drops affect both the required power and the subsequent flow rates. Failing to peruse these areas may lead to compressor installations with insufficient driver power.

What Performance Do You Really Need.doc Page 26 of 28
www.ACIServicesInc.com Phone: (740) 435-0240 Fax: (740) 435-0260
125 Steubenville Ave. Cambridge, Ohio 43725
Original Compressor Performance
Compressor Performance with Dynamic Effects
Included
Original Curves Overlaid in Red to Highlight Potential
Differences.
The following sources have a plethora of recent information about the effects from pulsations on reciprocating compressors:
• Integrating Compressor Performance with the Effects of Pressure Pulsation across a Unit’s Entire Operating Map, GMC-2007 Paper (ACI/Ariel/Beta Machinery)
• ARCT & GMRC Pulsation Control Project Update, GMC-2007 Paper (SwRI) • An Investigation of the Application of Finite Amplitude Wave Tuning Technology for Controlling
Reciprocating Compressor Pulsations, GMC-2007 Paper (ACI/Optimum Power) • Evaluation of Pulsation Levels at Reciprocating Compressor Installations, GMC-2007 Paper
(SwRI) • “Advanced Pulsation Control Devices Ready for Field Tests”, GM Journal, 2nd Quarter, May
2007 • “GMRC Advanced Reciprocating Compressor Technology (ARCT)”, CompressorTechTwo, June
& July 2007, (SwRI)

What Performance Do You Really Need.doc Page 27 of 28
www.ACIServicesInc.com Phone: (740) 435-0240 Fax: (740) 435-0260
125 Steubenville Ave. Cambridge, Ohio 43725
Implementation of Compressor Performance While requiring a full review of unit potential before purchase can quickly identify the strengths and shortcomings of that unit when compressing within a specified operating map, many end-users also need the ability to implement similar-to-OEM performance modeling in PLCs (programmable logic controller). This is required so that the PLC can safely control the compressor while optimizing it for load, flow, or fuel usage. The failure to model a unit similar to how the OEM would model that unit can not only lead to warranty disputes, but also to operations at potentially unsafe operating conditions. The main safety-related items are: high pressures, high temperatures, rod loads, and pin non-reversals. Of these, standard real-time sensors can readily identify high pressures and high temperatures. There are devices currently available for measuring dynamic, internal gas pressures and thus inferring real-time rod load forces and crosshead pin forces. However, these devices are not prevalent in the gas compression industry at this time. Therefore, it becomes very important that each compressor OEM properly disclose exactly how they warrant their equipment in regards to determining rod load and crosshead pin forces: what equations are used, what pressures (if any) are used, what weights (if any) are used, what other OEM-specific criteria are implemented, etc. In short, for these types of safety items, end-users not only need to know required weights and limits, but how those items are used in determining if the unit can be safely operated at a specific operating point, at a specific speed, and at a specific load step configuration. Note: While a simple pressure differential can be useful in keeping reciprocating compressors out of rod loads, this method is usually insufficient for high-speed units. Most high-speed OEMs base rod load and pin reversal calculations on internal gas pressures, which vary based on speed due to the pressure drops associated with valve velocities and gas passageways. Furthermore, regardless of whether the OEM uses inertia forces for rod load calculations, all high-speed OEMs use inertia for pin non-reversal calculations. Inertia forces are a function of reciprocating weights and rotation speed. Thus, simple pressure differentials fail to cover safety issues related to pin non-reversals.

What Performance Do You Really Need.doc Page 28 of 28
www.ACIServicesInc.com Phone: (740) 435-0240 Fax: (740) 435-0260
125 Steubenville Ave. Cambridge, Ohio 43725
Building upon the Solid Cornerstone of Compressor Performance From the beginning of large scale reciprocating compressors, there has been a need to predict unit performance and operational safety. Some of the industry’s fundamental research and development used extensively as the thermodynamic basis for many compressor performance models were developed and written by William “Bill” Hartwick. Two key papers are Efficiency Characteristics of Reciprocating Compressors (December 1968, ASME technical paper 68-WA/DGP-3), and Power Requirements and Associated Effects of Reciprocating Compressor Cylinder Ends Deactivated by Internal Bypassing (April 1975, ASME technical paper 75-DGP-9). Together, these papers set many standards for effectively predicting reciprocating compressor performance. Bill’s thermodynamic talents were paralleled, referenced and expanded upon by others, such as Ed Miller (thermodynamics, software development, and automation) and Derek Woollatt (thermodynamics, valve dynamics, and hardware innovation).
Bill Hartwick Cooper
Ed Miller ACI Services
Derek Woollatt Dresser-Rand
Once formal mathematical models based on the actual physics of gas compression were developed, computer software models naturally evolved. Hartwick’s paper On-Site Computer Predicted Compressor Performance (March 1982, ASME technical paper 82-DGP-26) covers an actual implementation of computer-aided compressor performance for optimizing and safely controlling compressors. Performance software continued to mature and thus provided engineers with the abilities to review unit performance with better proficiency, and across a broader spectrum, which in turn allowed engineers to more completely review and evaluate how hardware changes subsequently affected unit performance and safety. History tells us that compressor performance started with hand-calculated point performance, advanced to software-calculated point performance, then advanced to software-generated performance curves, and now has evolved to allow engineers and end-users to render 3-D plots, complex tabled-data, animated compressor performance plots and more. Nevertheless, whether doing a few points by slide rule, or a few million points by computer, the thermodynamic-based equations have not changed a lot in the last fifty years, thanks to the well-defined and flexible mathematical models developed by individuals such as Hartwick, Miller, and Woollatt.
![Reciprocating Compressor M II SERIES...Reciprocating Compressor [Single Stage, Open Type] M II SERIES * Some optional items are included in this photo. High Performance Derived from](https://static.fdocuments.us/doc/165x107/5f71d371bec994147c3b2337/reciprocating-compressor-m-ii-series-reciprocating-compressor-single-stage.jpg)