Specialty Crop Report - 2020
24
2020 Specialty Crop Report saskatchewan.ca/crops
Transcript of Specialty Crop Report - 2020

2020 Specialty Crop Report
saskatchewan.ca/crops

1
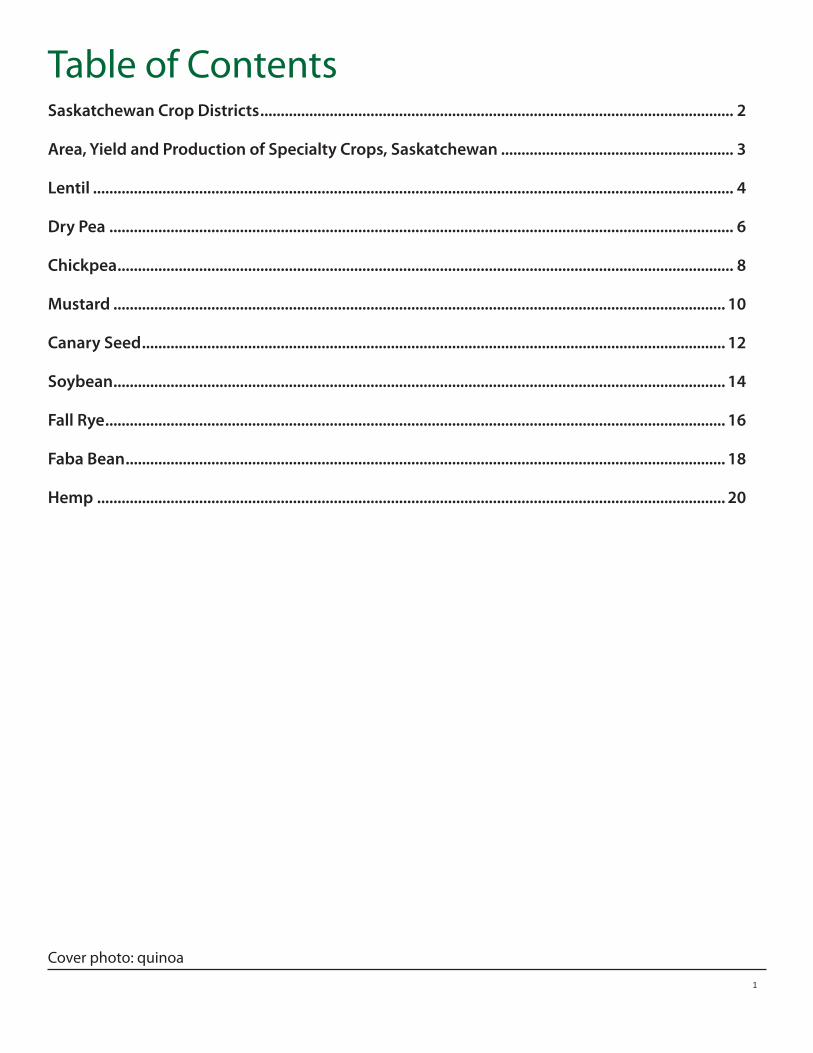
Table of ContentsSaskatchewan Crop Districts .................................................................................................................... 2
Area, Yield and Production of Specialty Crops, Saskatchewan ......................................................... 3
Lentil ............................................................................................................................................................. 4
Dry Pea ......................................................................................................................................................... 6
Chickpea ....................................................................................................................................................... 8
Mustard ...................................................................................................................................................... 10
Canary Seed ............................................................................................................................................... 12
Soybean ...................................................................................................................................................... 14
Fall Rye ........................................................................................................................................................ 16
Faba Bean ................................................................................................................................................... 18
Hemp .......................................................................................................................................................... 20
Cover photo: quinoa

2
Saskatchewan Crop Districts

3
2020 2019
Crop
Area
Yield
Production '000
tonnes
Area
Yield
Production '000
tonnesSeeded
'000 acresHarvested'000 acres
Seeded ‘000 acres
Harvested'000 acres
Oriental Mustard 14.0 13.3 1,028 6.2 54.7 49.0 994 22.1
Yellow Mustard 100.8 98.8 759 34.0 98.2 94.8 700 30.1
Brown Mustard 57.4 56.7 844 21.7 139.1 137.0 869 54.0
Total Mustard 172.2 168.8 808 61.8 292.0 280.8 834 106.2
Large Green Lentils 906.2 899.0 1,347 549.4 906.9 855.9 1,245 483.3
Small Green Lentils 255.5 255.2 1,556 180.1 362.4 348.5 1,468 232.0
Red Lentils 2,581.2 2,575.0 1,486 1,736.2 2,063.6 2,040.3 1,361 1,259.4
Other Lentils 64.3 64.2 1,082 31.5 54.8 54.5 1,010 25.0
Total Lentils 3,807.2 3,793.4 1,451 2,497.2 3,387.7 3,299.2 1,570 2,209.8
Green Peas 484.8 480.4 2,389 520.6 433 405.9 2,220 408.5
Yellow Peas 1,733.3 1,725.8 2,377 1,860.4 1,781.3 1,775.2 2,238 1,801.3
Other Peas 103.6 99.6 2,140 96.7 120.6 116.6 1,950 103.0
Total Peas 2,321.7 2,305.8 2,369 2,477.6 2,334.9 2,297.7 2,220 2,313.1
Desi Chickpeas 28.3 28.3 1,729 22.2 16.3 16.0 1,970 14.3
Kabuli Chickpeas 222.6 221.1 1,538 154.2 306.5 300.4 1,494 203.6
Non-specified chickpeas
1.4 1.4 1,102 0.7 9.0 9.0 1,651 6.7
Total Chickpeas 252.3 250.8 1,558 177.2 331.8 325.4 1,522 224.6
Hairless Canary Seed 86.3 86.3 1,308 51.2 64.9 60.0 1,103 30.1
Regular Canary Seed 180.8 180.1 1,288 105.2 171.9 166.5 1,175 88.7
Total Canary Seed 267.1 266.4 1,294 156.4 263.8 258.0 1,307 153.0
Soybeans 126.7 126.3 1,201 68.8 150.0 139.2 1,698 107.2
Triticale 54.3 23.5 1,520 16.2 67.7 38.1 2,008 34.7
Fall Rye 119.1 114.5 2,297 119.3 102.6 83.0 2,638 99.3
Sunflower seed 7.6 7.6 1,211 4.2 - - 1,211 -
Fababeans 55.9 55.9 2,820 71.5 50.0 47.3 2,880 61.8
Hemp 14.6 14.6 960 6.4 42.0 973 n.a.
Dry Beans 19.1 18.1 2,217 18.2 11.9 8.8 2,330 9.3
Coriander 5.9 - - - 8.9 - - n.a.
Camelina 8.1 - - - 2.5 - - n.a.
Borage 0.4 - - - 0.5 - - n.a.
Caraway 2.4 - - - 8.0 - - n.a.
Buckwheat 8.6 8.6 718 2.8 6.4 4.6 - n.a.
Fenugreek 4.0 - - 4.4 - - n.a.
Quinoa 9.0 - - - 1.3 - 1,005 -Source: Statistics Canada, Saskatchewan Agriculture
Area, Yield and Production of Specialty Crops, Saskatchewan

4
Saskatchewan has been the main producer of lentil in Western Canada followed by smaller amounts sown in Alberta. The seeded area was higher in 2020 than the previous year and production was also higher. Higher than usual movement of lentil took place earlier in 2020 as growers acted upon strong lentil demand and did not wait to unload supplies from their bins. The movement was due in part to increased demand from India. Lentil exports moved rapidly through much of the year but slowed in the fall. It is anticipated that the movement may pick up again into 2021. Canadian carryover supplies are expected to be at their lowest level in some time. Reports from India show that there is anticipated increases in seeded pulses in their Kharif and Rabi planting seasons which would dampen import demand from India in 2021-22; however, the reduced import duties on lentils going into Turkey may help pick up the slack as large quantities of lentils have also moved into that market. This is a gateway of lentil movement into markets in the Middle East. The quality of Canadian lentils in 2020 was also very high, placing them in high demand.
2011 2012 2013 2014 2015 2016 2017 2018 2019 2020Seeded Area (thousand acres)
Saskatchewan 2,460.0 2,420.0 2,620.0 3,010.0 3,750.0 5,105.0 3,920.0 3,345.8 3,387.7 3,807.2Manitoba 2.0Alberta 97.8 85.0 100.0 110.0 285.0 463.5 485.0 420.2 387.8 422.9Prairie Provinces 2,557.8 2,505.0 2,720.0 3,120.0 4,035.0 5,568.5 4,405.0 3,768.0 3,775.5 4,230.1
Production (thousand tonnes)Saskatchewan 1,497.5 1,469.8 2,151.4 1,902.6 2,364.1 2,742.0 2,294.1 1,991.8 2,209.8 2,497.2Manitoba 0.7Alberta 76.0 68.1 110.3 84.4 176.4 451.8 264.4 199.6 167.6 370.6Prairie Provinces 1,573.5 1,537.9 2,261.7 1,987.0 2,540.5 3,193.8 2,558.5 2,192.1 2,377.4 2,867.8
Yields (pounds per acre) Saskatchewan 1,384 1,354 1,824 1,446 1,392 1,202 1,297 1,337 1,570 1,451Manitoba - - - - - - - 800 - -Alberta 1,715 1,807 2,558 1,724 1,375 2,175 1,207 1,048 988 1,949Prairie Provinces 1,397 1,369 1,850 1,456 1,390 1,283 1,287 1,304 1,427 1,628
Average Price in Saskatchewan ($/tonne) 11/12 12/13 13/14 14/15 15/16 16/17 17/18 18/19 19/20 20/21
$/tonne 474 454 453 631 894 714 486 405 521 -Canadian Exports (thousand tonnes)
11/12 12/13 13/14 14/15 15/16 16/17 17/18 18/19 19/20 20/21'000 tonnes 1,147.7 1,638.2 1,752.7 2,179.3 2,144.5 2,455.0 1,538.0 2,033.3 2,860.7 -
Source: Statistics Canada
Saskatchewan 2020 Saskatchewan (2015-19) average*
Crop
AreaYieldlb./ac
Production'000 tonnes
AreaYieldlb./ac
Production'000 tonnes
Seeded'000 acres
Harvested'000 acres
Seeded'000 acres
Harvested'000 acres
Large Green Lentils 906.2 899.0 1,347 549.4 941.7 918.7 1,166 482.7Small Green Lentils 255.5 255.2 1,556 180.1 347.9 337.2 1,353 206.5Red Lentils 2,581.2 2,575.0 1,487 1,736.2 2,544.6 2,539.8 1,352 1,544.2Other Lentils 64.3 64.2 1,080 31.5 57.5 55.8 1022.5 25.0Total Lentils 3,807.2 3,793.4 1,451 2,497.2 3,901.7 3,851.5 1,360 2,320.4
Source: Statistics Canada*2015-2019 totals do not add due to revisions to the total, but not the individual components.
Lentil

5
Lentil Supply and Disposition, Canada
Aug 1Stocks
'000 tonnes
HarvestedArea
'000 acres
Production ImportsTotal
Supply
Use July 31Stocks Stocks/
Use
Exports Domestic Seed F.W.D.*
'000 tonnes
2011/12 830.0 2,482.8 1,573.5 11.4 2,414.9 1,147.7 8.0 85.6 313.6 860.0 55%
2012/13 860.0 2,476.0 1,537.9 8.7 2,406.6 1,638.2 15.0 92.5 193.9 467.0 24%
2013/14 467.0 2,695.0 2,261.7 9.4 2,738.1 1,752.7 15.0 106.1 78.3 786.0 40%
2014/15 786.0 3,008.0 1,987.0 13.4 2,786.4 2,179.3 14.0 137.3 92.8 363.0 15%
2015/16 363.0 4,028.0 2,540.5 16.3 2,919.8 2,144.5 15.0 199.4 487.5 73.4 3%
2016/17 73.4 5,488.0 3,193.8 98.0 3,365.2 2,455.0 20.0 149.9 425.3 315.0 10%
2017/18 315.0 4,383.0 2,558.5 34.7 2,908.2 1,538.0 20.0 128.1 349.4 872.7 43%
2018/19 872.7 3,705.2 2,192.1 50.6 3,115.4 2,033.2 20.0 128.5 78.1 855.6 38%
2019/20 855.6 3,678.3 2,382.0 89.6 3,327.2 2,860.6 20.0 143.9 93.7 209.0 7%
2020/21 209.0 4,212.6 2,867.8 82.1 3,158.9 2,900.0 20.0 143.9 85.0 10.0 0%*Feed, waste, and dockage
Source: Statistics Canada
Lentil
Canadian Lentil ExportsTop 20 Destinations by Crop Year2018-19 2019-20
tonnes tonnesWorld 2,033,286 World 2,860,700
1 India 551,664 India 907,185
2United Arab Emirates 206,154 Turkey 418,675
3 Bangladesh 169,170United Arab Emirates 266,211
4 Turkey 126,859 Bangladesh 250,2555 Pakistan 114,542 Colombia 109,8846 Colombia 91,446 Pakistan 83,8517 Sri Lanka 84,528 Egypt 71,3788 Egypt 84,353 Sri Lanka 69,9479 Mexico 73,841 Morocco 63,91310 United States 72,873 Algeria 63,67511 Algeria 61,159 United States 60,91512 Nepal 48,937 Peru 57,186
13 Peru 39,904Syrian Arab Republic 46,282
14 Morocco 31,152 Nepal 32,18215 Italy 24,575 Mexico 32,04816 Ecuador 23,853 Sudan 31,56717 Chile 17,856 Chile 30,61518 Sudan 17,537 Ecuador 29,50219 Spain 16,945 Italy 27,259
20Syrian Arab Republic 15,194 China (PRC) 23,115
Source: Statistics Canada
34,480
15,285
197,421
337,320
172,026
236,176
498,207
231,48796,046
286,558 32,039
2,607151,436
256,256
516,630
93,919
1,371
18,890
15,775
9,732
1A
1B
2A
2B3AN
3AS
3BN
3BS4A
4B
5A
5B
6A
6B
7A
7B
8A
8B
9A
9B
2020 SCIC Acres SeededIncludes, Pedigreed and Organic Acres
As reported on Seeded Acreage ReportsMinimum of 2 customers and 400 acres required per CD
August 11, 2020CDRM
2020 Acre Maps2020 ALL Lentil Acres = 3,203,661AllLentils52_53_54
≤35,000≤200,000≤340,000≤516,630

6
Dry pea seeded area dropped ever so slightly in 2020; however, better growing conditions saw a slight increase in production. Exports of peas from Canada are expected to increase slightly in 2020/21 because of increased demand from China. Rumours that China is re-establishing its hog production operations and needing more feed sparked the increased movement of peas to that country. Movement of peas has been quite strong and this may put some upward pressure on prices which could slow the movement of peas into China. Bangladesh is the second major buyer of Canadian peas and hopefully that market will pick up any slack that might arise from reductions in China. The other important factor to note is that pulse fractionating companies are now coming on line, increasing domestic demand for peas which may put upward pressure on prices for Canadian peas. It is not expected that India will remove its barrier to pea imports into that country.
2011 2012 2013 2014 2015 2016 2017 2018 2019 2020
Seeded Area (thousand acres)
Saskatchewan 1,700.0 2,600.0 2,250.0 2,600.0 2,135.0 2,160.0 2,165.0 1,935.3 2,334.9 2,321.7
Manitoba 30.0 55.0 60.0 65.0 70.0 163.2 65.0 85.0 125.6 175.2
Alberta 706.7 1,075.0 1,040.0 1,355.0 1,515.0 1,909.5 1,800.0 1,511.4 1,800.2 1,650.1
Prairie Provinces 2,436.7 3,730.0 3,350.0 4,020.0 3,720.0 4,232.7 4,030.0 3,531.7 4,260.7 4,147.0
Production (thousand tonnes)
Saskatchewan 1,671.1 2,068.4 2,571.8 2,256.2 1,778.5 2,346.1 1,973.8 1,780.7 2,313.1 2,477.6
Manitoba 25.3 64.0 67.7 60.0 78.2 164.2 80.3 104.8 163.9 246.2
Alberta 805.6 1,208.4 1,321.3 1,475.1 1,314.5 2,271.2 1,991.5 1,608.4 1,685.9 1,799.2
Prairie Provinces 2,502.0 3,340.8 3,960.8 3,791.3 3,171.2 4,781.5 4,045.6 3,493.9 4,162.9 4,523.0
Yields (bushels per acre)
Saskatchewan 36.4 30.0 42.5 32.5 30.9 40.5 33.8 34.5 37.0 39.5
Manitoba 34.4 42.7 41.4 34.9 42.9 38.2 46.8 47.0 49.4 52.5
Alberta 42.6 41.9 47.1 40.6 32.6 46.1 40.9 39.9 35.5 41.5
Prairie Provinces 38.2 33.7 43.9 35.3 31.9 42.9 37.2 37.1 36.7 40.8
Average Price in Saskatchewan ($/tonne)
11/12 12/13 13/14 14/15 15/16 16/17 17/18 18/19 19/20 20/21
$/tonne 314 316 266 261 361 316 275 260 258 -
Canadian Exports (thousand tonnes)
11/12 12/13 13/14 14/15 15/16 16/17 17/18 18/19 19/20 20/21
'000 tonnes 2,095.7 2,649.6 2,778.5 3,082.0 2,646.4 3,943.6 3,085.3 3,270.3 3,780.8 -Source: Statistics Canada
Saskatchewan 2020 Saskatchewan (2015-19) average
Crop
Area
Yieldbu/ac
Production'000
tonnes
Area
Yieldbu/ac
Production'000
tonnesSeeded
'000 acresHarvested'000 acres
Seeded'000 acres
Harvested'000 acres
Green Peas 484.8 480.4 39.8 520.6 390.2 380.1 36.5 362.5
Yellow Peas 1,733.3 1,725.8 39.6 1,860.4 1,690.1 1,674.0 35.5 1,624.7
Other Peas 103.6 99.6 35.7 96.7 65.7 62.6 23.7 51.3
Total Peas 2,321.7 2,305.8 39.5 2,477.7 2,146.0 2,116.7 35.3 2,038.5
Dry Pea

7Dry Pea
Canadian Dry Peas ExportsTop 20 Destinations by Crop Year2018-19 2019-20
tonnes tonnesWorld 3,270,313 World 3,780,829
1 China (PRC) 1,795,832 China (PRC) 2,362,2302 Bangladesh 605,989 Bangladesh 579,2963 United States 244,749 Nepal 152,1084 India 217,180 India 114,0455 Nepal 72,633 United States 112,8796 Cuba 55,250 Cuba 83,0007 Belgium 40,830 Colombia 67,038
8 Philippines 33,157United Arab Emirates 66,965
9 Colombia 29,894 Philippines 36,37810 Yemen 16,487 Pakistan 24,110
11United Arab Emirates 16,179 Peru 16,413
12 Taiwan 13,910 Taiwan 12,35613 Indonesia 10,864 Brazil 11,72014 Brazil 9,591 Morocco 9,54115 Peru 8,823 Egypt 8,32916 Morocco 8,050 Japan 8,26717 Pakistan 6,943 Algeria 8,03418 Saudi Arabia 6,441 Indonesia 7,92619 Japan 6,131 Yemen 7,36620 Algeria 5,792 Sri Lanka 6,910Source: Statistics Canada
Dry Pea Supply and Disposition, Canada
Aug 1Stocks
'000 tonnes
HarvestedArea
'000 acres
Production ImportsTotal
Supply
Use July 31Stocks Stocks/
Use
Exports Domestic Seed F.W.D.*
'000 tonnes
2011/12 535.0 2,407.0 2,502.0 11.8 3,048.8 2,095.7 27.7 253.8 406.6 265.0 10%
2012/13 265.0 3,645.0 3,340.8 16.1 3,621.9 2,649.6 27.7 226.2 544.4 174.0 5%
2013/14 174.0 3,315.0 3,960.8 25.1 4,159.9 2,780.5 30.0 271.1 749.3 329.0 9%
2014/15 329.0 3,968.0 3,810.1 30.8 4,169.9 3,082.0 25.0 250.4 128.5 684.0 20%
2015/16 684.0 3,692.0 3,200.7 15.4 3,900.1 2,646.5 30.0 287.1 762.3 174.2 5%
2016/17 174.2 4,144.0 4,835.9 31.5 5,041.6 3,943.8 40.0 278.5 478.9 300.4 6%
2017/18 300.4 4,058.0 4,112.2 11.5 4,424.1 3,085.3 40.0 245.1 405.5 648.2 17%
2018/19 648.2 3,536.5 3,580.7 61.6 4,290.5 3,270.3 40.0 293.4 374.5 312.3 8%
2019/20 312.3 4,227.7 4,236.5 81.7 4,630.5 3,780.8 45.0 286.6 284.9 233.2 5%
2020/21 233.2 4,147.0 4,523.0 85.0 4,912.5 3,800.0 46.0 290.0 280.0 496.5 11%*Feed, waste, and dockage
Source: Statistics Canada, Saskatchewan Agriculture
126,376
49,863
61,672
68,561
25,189
71,728
96,107
61,92238,620
129,468 81,678
102,435
187,869121,816
83,133
193,592
49,839
86,983
114,894
67,321
1A
1B
2A
2B3AN
3AS
3BN
3BS4A
4B
5A
5B
6A
6B
7A
7B
8A
8B
9A
9B
2020 SCIC Acres SeededIncludes, Pedigreed and Organic Acres
As reported on Seeded Acreage ReportsMinimum of 2 customers and 400 acres required per CD
August 11, 2020CDRM
2020 FieldPea Acres =1,819,066FieldPeas1
≤50,000≤90,000≤130,000≤193,592

8
The years 2017, 2018 and 2019 saw huge increases of chickpea production worldwide and supply buildup was rather large. Canadian chickpea acres fell in 2020 in response to the buildup of supply, so that the return of reasonable prices might come back into play. However, supplies did not decrease sufficiently to increase prices as decent yields were realized during 2020.
Canada lost some of its market share to other jurisdictions when Russia shipped large quantities of chickpeas into one of Canada’s traditional markets, Pakistan. The pet food industry also took less chickpea for their processing plants for 2020. The United States and Canada are still holding high quantities of chickpea that may be difficult to export.
2011 2012 2013 2014 2015 2016 2017 2018 2019 2020
Seeded Area (thousand acres)
Saskatchewan 105.0 180.0 180.0 170.0 115.0 143.0 160.0 368.6 331.8 252.3
Manitoba - - - - - - - - - -
Alberta 12.5 20.0 - - - - - 73.4 60.1 45.5
Prairie Provinces 117.5 200.0 180.0 170.0 115.0 143.0 160.0 442.0 391.9 297.8
Production (thousand tonnes)
Saskatchewan 75.2 145.2 169.4 123.0 83.5 75.2 95.6 276.5 224.6 177.2
Manitoba - - - - - - - - - -
Alberta 10.4 16.2 - - - - - 34.6 27.0 37.2
Prairie Provinces 85.6 161.4 169.4 123.0 83.5 75.2 95.6 311.1 251.6 214.4
Yields (pounds per acre)
Saskatchewan 1,610 1,798 2,098 1,664 1,600 1,658 1,317 1,689 1,522 1,558
Manitoba - - - - - - - - -
Alberta 1,840 1,775 - - - - - 1,040 998 1,817
Prairie Provinces 1,635 1,795 2,098 1,664 1,600 1,658 1,317 1,579 1,441 1,597
Average Price in Saskatchewan ($/tonne)
11/12 12/13 13/14 14/15 15/16 16/17 17/18 18/19 19/20 20/21
$/tonne 750 623 537 430 815 1,000 1,088 1,300 - -
Canadian Exports (thousand tonnes)
11/12 12/13 13/14 14/15 15/16 16/17 17/18 18/19 19/20 20/21
'000 tonnes 36.6 68.5 46.4 76.5 149.6 105.1 113.0 146.8 104.6 -Source: Statistics Canada; Saskatchewan Agriculture
Chickpea
Saskatchewan 2020 Saskatchewan (2015-19) average
Crop
Area
Yieldlb./ac
Production'000 tonnes
Area
Yieldlb./ac
Production'000
tonnesSeeded
'000 acresHarvested'000 acres
Seeded'000 acres
Harvested'000 acres
Desi Chickpeas & Non-specified 29.7 29.7 1,704 23.0 19.4 18.7 1,650 14.0
Kabuli Chickpeas 222.6 221.1 1,538 154.2 204.3 193.6 1,520 133.5
Total Chickpeas 252.3 250.8 1,558 177.2 223.7 212.3 1,557 147.5

9Chickpea
Canadian Chickpea ExportsTop 20 Destinations by Crop Year2018-19 2019-20
tonnes tonnesWorld 146,821 World 104,587
1 Pakistan 50,461 Pakistan 32,2732 United States 21,074 United States 28,108
3 India 12,516Syrian Arab Republic 9,930
4United Arab Emirates 10,020 United Kingdom 5,240
5 Portugal 7,532 Lebanon 3,3536 Egypt 6,187 Italy 2,9057 United Kingdom 3,865 Egypt 2,473
8Syrian Arab Republic 3,496 Portugal 2,453
9 Sri Lanka 3,454 India 2,16310 Lebanon 3,447 Israel 1,616
11 Jordan 2,933United Arab Emirates 1,562
12 Turkey 2,707 Peru 1,29013 Colombia 2,203 Korea (Rep. of ) 1,277
14 Israel 2,116Trinidad & Tobago 1,095
15 Italy 1,857 Colombia 1,05416 Morocco 1,332 Japan 847
17Trinidad & Tobago 1,301 Belgium 720
18 Belgium 1,186 Nepal 72019 Poland 1,051 Jordan 68520 Japan 1,043 Netherlands 595Source: Statistics Canada
Chickpea Supply and Disposition, Canada
Aug 1Stocks
'000 tonnes
HarvestedArea
'000 acres
Production ImportsTotal
Supply
Use July 31Stocks Stocks/
Use
Exports Domestic Seed F.W.D.*
'000 tonnes
2011/12 22.0 115.5 85.6 8.7 116.3 36.6 30.0 12.7 26.0 11.0 10%
2012/13 11.0 198.0 161.4 8.9 181.3 68.5 24.8 13.0 21.0 54.0 42%
2013/14 54.0 178.0 169.4 8.5 231.9 46.4 25.0 11.0 31.5 118.0 104%
2014/15 118.0 163.0 123.0 13.0 254.0 76.5 25.0 7.0 30.0 115.5 83%
2015/16 115.5 115.0 83.5 20.0 219.0 149.6 20.0 6.5 10.0 32.9 18%
2016/17 32.9 100.0 75.2 30.0 138.1 105.1 10.0 7.3 5.0 10.7 8%
2017/18 10.7 160.0 95.6 35.0 141.3 113.0 5.0 7.5 5.0 10.8 8%
2018/19 10.8 434.8 311.3 51.2 373.3 146.8 25.0 24.4 79.5 97.6 35%
2019/20 97.6 385.0 251.5 47.8 396.9 104.5 25.0 18.9 80.0 168.5 74%
2020/21 168.5 295.9 214.4 45.7 428.6 110.0 28.0 18.0 76.0 196.6 85%*Feed, waste, and dockage
Source: Statistics Canada; Agriculture & AgriFood Canada and StatPublishing
1,965
8,426
13,860
31,581
58,564
15,482
13,0818,236
11,824
11,320
1A
1B
2A
2B3AN
3AS
3BN
3BS4A
4B
5A
5B
6A
6B
7A
7B
8A
8B
9A
9B
2020 SCIC Acres SeededIncludes, Pedigreed and Organic Acres
As reported on Seeded Acreage ReportsMinimum of 2 customers and 400 acres required per CD
August 11, 2020CDRM
2020 Acre Maps2020 Chickpeas ALL Acres = 175,054All_Chickps38_55_56
≤2,000≤16,000≤3,2000≤58,564

10
The 2020 growing season had its challenges for mustard producers in the province. Flea beetles and cutworms feeding on newly emerged mustard crops were early-season pests that were dealt with. As the growing season progressed, dry conditions in the mustard growing region of the province put stress on crops. Fortunately, mustard is tolerant to hot and dry conditions, compared to other oilseed crops. Producers in the mustard growing region of the province enjoyed excellent harvest conditions compared to the previous few harvests. Based on the final Crop Report, 89 per cent of mustard was to be number one grade.
Mustard acreage in Saskatchewan was down 41 per cent from 2019 to 172,200 acres for 2020. The five-year average total mustard acreage for Saskatchewan is 317,500 acres, putting the 2020 acreage at a 46 per cent decrease to the five-year average. The 2020 growing season saw average yields of 808 lbs./ac, a three per cent drop from 2019 and a five per cent drop from the five-year average. With fewer acres but relatively stable yields, total production in Saskatchewan was down from the previous year by 44,000 tonnes or 42 per cent.
In 2020, Saskatchewan accounted for 68 per cent of all of Canada’s seeded mustard acres, with seeded acres in Alberta making up the remainder. Of the mustard acres in Saskatchewan, 59 per cent was yellow, 33 per cent brown and eight per cent oriental.
Top export markets for the 2020 mustard crop are anticipated to be the United States, Belgium, Switzerland and Japan, which is very similar to previous years.
2011 2012 2013 2014 2015 2016 2017 2018 2019 2020Seeded Area (thousand acres)
Saskatchewan 265.0 240.0 270.0 365.0 255.0 375.0 290.0 375.5 292.0 172.2Manitoba - - - - - - - 4.9 1.8 -Alberta 63.0 95.0 95.0 135.0 90.0 135.0 95.0 122.1 104.4 80.0Prairie Provinces 328.0 335.0 365.0 500.0 345.0 510.0 385.0 502.5 398.2 252.2
Production (thousand tonnes)Saskatchewan 103.2 82.7 117.3 138.6 91.5 162.3 94.5 134.7 106.2 61.8Manitoba - - - - - - - 2.2 0.8 -Alberta 26.8 35.9 37.2 59.4 31.9 73.3 27.1 36.7 27.6 36.5Prairie Provinces 130.0 118.6 154.5 198.0 123.4 235.6 121.6 173.6 134.6 98.3
Yields (pounds per acre) Saskatchewan 892 760 965 873 841 1,022 730 815 834 808Manitoba - - - - - - - 993 874 -Alberta 949 850 892 985 800 1,224 642 686 609 1,009Prairie Provinces 903 785 947 904 830 1,078 709 785 776 872
Average Price in Saskatchewan ($/tonne) 13/14 14/15 15/16 16/17 17/18 18/19 19/20 20/21
$/tonne 654 665 775 696 939 985 707 950 - -Canadian Exports (thousand tonnes)
13/14 14/15 15/16 16/17 17/18 18/19 19/20 20/21'000 tonnes 115.2 119.8 137.9 126.0 112.9 123.7 111.9 121.1 - -Source: Statistics Canada; Saskatchewan Agriculture
Mustard
Saskatchewan 2020 Saskatchewan (2014-19) average
Crop
Area
Yieldlb./ac
Production'000
tonnes
Area
Yieldlb./ac
Production'000
tonnesSeeded
'000 acresHarvested'000 acres
Seeded'000 acres
Harvested'000 acres
Oriental Mustard 14.0 13.3 1,024.0 6.2 59.7 58.7 786 32.4
Yellow Mustard 100.8 98.8 758 34.0 151.6 143.7 744 49.9
Brown Mustard 57.4 56.7 843 21.7 80.6 77.7 784 32.4
Non-specified Mustard - - - - - - - -
Total Mustard 172.2 168.8 808 61.8 317.5 304.0 848 117.8

11Mustard
Canadian Mustard ExportsTop 20 Destinations by Crop Year2018-19 2019-20
tonnes tonnesWorld 121,129 World 112,537
1 United States 64,645 United States 63,6082 Belgium 12,708 Belgium 16,3413 Switzerland 6,539 Switzerland 7,3604 France 6,482 Japan 4,3285 Japan 5,361 Senegal 3,0776 Netherlands 3,570 France 2,1277 Germany 3,112 Germany 2,0778 Senegal 2,352 Thailand 1,5559 Korea (Rep. of ) 1,896 Netherlands 1,31510 Brazil 1,536 Brazil 1,25911 Bolivia 1,437 Korea (Rep. of ) 92612 Algeria 1,074 Morocco 92013 Australia 1,071 Bolivia 86114 China (PRC) 1,062 Australia 84715 Greece 981 United Kingdom 65316 United Kingdom 975 China (PRC) 61717 Thailand 958 Chile 47418 Morocco 765 Guatemala 43819 Swaziland 742 Algeria 36020 Peru 679 Peru 337Source: Statistics Canada
Mustard Supply and Disposition, Canada
Aug 1Stocks
'000 tonnes
HarvestedArea
'000 acres
Production ImportsTotal
Supply
Use July 31Stocks
Stocks/Use
Exports Domestic Seed F.W.D.*
'000 tonnes
2011/12 116.0 317.5 130.0 0.5 246.5 115.2 24.1 1.5 22.7 83.0 51%
2012/13 83.0 333.0 118.6 1.3 202.9 119.8 24.0 1.7 21.4 36.0 22%
2013/14 36.0 360.0 154.5 1.8 192.3 137.9 20.0 2.0 20.0 12.4 7%
2014/15 12.4 483.0 198.0 1.0 211.4 126.0 21.0 1.7 19.4 43.3 26%
2015/16 43.3 328.0 123.4 2.0 168.7 112.9 23.0 2.5 10.0 20.3 14%
2016/17 20.3 482.0 235.6 1.5 257.4 123.7 25.0 2.4 15.0 91.3 55%
2017/18 91.3 378.0 121.6 6.0 218.9 111.9 27.5 2.5 11.2 65.8 43%
2018/19 65.8 487.3 173.6 8.4 247.8 121.1 30.0 1.8 22.4 72.5 41%
2019/20 72.5 382.4 134.6 6.8 213.9 112.6 30.0 1.2 21.2 48.9 30%
2020/21 48.9 252.2 98.83 7.8 155.5 100.0 25.6 2.0 18.0 9.9 7%*Feed, waste, and dockage
Source: Statistics Canada; Agriculture & AgriFood Canada and StatPublishing
2,571
2,857
5,757
876
3,707
25,313
16,814
28,107
15,750
27,9661,258
2,5984,867
4,21722,051
1,898
730
1A
1B
2A
2B3AN
3AS
3BN
3BS4A
4B
5A
5B
6A
6B
7A
7B
8A
8B
9A
9B
2020 SCIC Acres SeededIncludes, Pedigreed and Organic Acres
As reported on Seeded Acreage ReportsMinimum of 2 customers and 400 acres required per CD
August 11, 2020CDRM
2020 Acre Maps2020 Mustard ALL Acres = 167,601MustardAll27_28_30
≤3,000≤6,000≤17,000≤28,107

12
Canary seed grows well on heavier soils that are able to hold moisture, but it is sensitive to dry conditions. Though the 2020 growing season was hot and dry, the crop produced above average yields.
Yields were up from 2019 and somewhat above the five-year average provincially. Yields varied considerably by region. Regular canary seed made up more than 68 per cent of harvested acres, but yielded only two per cent less than the hairless canary seed. Typically, hairless canary seed varieties yield considerably less than regular canary seed varieties and it is not clear why in 2020 hairless varieties slightly out yielded regular ones. The hairless type, when dehulled, is now approved for human consumption in Canada and the United States.
Seeded area was about one per cent higher in 2020 than in 2019, at 267,100 acres; overall production is estimated to be 156,400 tonnes. Saskatchewan produces nearly 100 per cent of all canary seed in Canada.
Exports in 2020-21 are expected to be very similar to 2019-20. Mexico, Belgium and Indonesia were the top export markets for canary seed, with strong markets in the United States and South American countries.
Carry-out stocks have been estimated as low for several years, which is normally an indicator that prices may increase. Fall 2020 prices were stronger than in recent years.
2011 2012 2013 2014 2015 2016 2017 2018 2019 2020Seeded Area (thousand acres)
Saskatchewan 275.0 335.0 210.0 286.0 325.0 260.0 255.0 248.0 263.8 267.1Manitoba - - - - - - - - 25.3 -Alberta - - - - - - - - 1.8 -Prairie Provinces 275.0 335.0 210.0 286.0 325.0 260.0 255.0 248.0 290.9 267.1
Production (thousand tonnes)Saskatchewan 128.6 149.7 131.0 134.9 148.6 140.3 145.0 145.6 153.0 156.4Manitoba - - - - - - - - 21.1 -Alberta - - - - - - - - 0.9 -Prairie Provinces 128.6 149.7 131.0 134.9 148.6 140.3 145.0 145.6 175.0 156.4
Yields (pounds per acre) Saskatchewan 1,050 1,015 1,375 1,081 1,040 1,322 1,255 1,300 1,307 1,294 Manitoba - - - - - - - - 1,928 -Alberta - - - - - - - - 1,050 -Prairie Provinces 1,050 1,015 1,375 1,081 1,040 1,322 1,255 1,300 1,359 1,294
Average Price in Saskatchewan ($/tonne) 11/12 12/13 13/14 14/15 15/16 16/17 17/18 18/19 19/20 20/21
$/tonne 592 584 519 524 593 482 538 493 - -Canadian Exports (thousand tonnes)
11/12 12/13 13/14 14/15 15/16 16/17 17/18 18/19 19/20 20/21'000 tonnes 126.4 136.2 163.9 164.4 146.2 152.7 147.3 155.7 161.4 -Source: Statistics Canada; Saskatchewan Agriculture
Canary seed
Saskatchewan 2020 Saskatchewan (2015-19) average
Crop
Area
Yieldlb./ac
Production'000
tonnes
Area
Yieldlb./ac
Production'000
tonnesSeeded
'000 acresHarvested'000 acres
Seeded'000 acres
Harvested'000 acres
Hairless Canary seed 86.3 86.3 1,308 51.2 115.0 111.0 1,086 42.7
Regular Canary seed 180.8 180.1 1,288 105.2 216.2 208.4 1,288 98.0
Total Canary seed 267.1 266.4 1,294 156.4 331.2 319.4 1,217 140.7

13Canary Seed
Canadian Canary seed ExportsTop 20 Destinations by Crop Year2018-19 2019-20
tonnes tonnesWorld 155,733 World 161,372
1 Mexico 33,386 Mexico 35,6812 Brazil 17,924 Belgium 20,0863 Belgium 16,808 Indonesia 10,3114 Spain 11,727 Spain 10,1785 Colombia 9,326 United States 8,4536 United States 7,565 Colombia 8,0407 Indonesia 5,549 Brazil 7,3548 Turkey 5,223 Turkey 6,1499 Italy 5,028 Italy 5,59610 Egypt 4,430 Egypt 5,47411 Algeria 4,041 Algeria 5,22512 Portugal 3,663 Morocco 4,53613 Chile 2,538 China (PRC) 3,54114 Peru 2,208 Tunisia 3,36215 China (PRC) 2,145 Portugal 3,085
16United Arab Emirates 1,982 Chile 2,419
17 Morocco 1,937 Peru 2,40418 Tunisia 1,585 Australia 2,07819 Ecuador 1,408 Greece 1,666
20 Germany 1,268United Arab Emirates 1,466
Source: Statistics Canada
Canary Seed Supply and Disposition, Canada
Aug 1Stocks
'000 tonnes
HarvestedArea
'000 acres
Production ImportsTotal
Supply
Use July 31Stocks
Stocks/Use
Exports Domestic Seed F.W.D.*
'000 tonnes
2011/12 30.0 270.0 128.6 - 158.6 126.4 4.0 6.2 5.0 17.0 12%
2012/13 17.0 325.0 149.7 0.1 166.8 136.2 1.5 4.5 1.6 23.0 16%
2013/14 23.0 210.0 131.0 - 154.0 163.9 1.5 3.7 - - 0%
2014/15** - 275.0 134.9 - 134.9 164.4 1.5 4.4 - - 0%
2015/16 - 315.0 148.6 - 148.6 146.2 1.5 2.8 - - 0%
2016/17 - 234.0 140.3 - 140.3 152.7 1.5 4.1 - - 0%
2017/18 - 255.0 145.0 - 145.0 147.3 1.5 3.9 - - 0%
2018/19 16.2 268.4 157.6 - 173.8 155.7 1.5 3.3 2.6 10.7 7%
2019/20 10.7 283.9 175.0 - 185.7 161.4 1.5 4.7 3 15.1 9%
2020/21 15.1 267.1 156.4 - 175.7 160.0 2.5 4.5 1 7.7 5%*Feed, waste, and dockage
** Statistics Canada does not have the required information from the Field Crop surveys to be able to complete the S&D table
Source: Statistics Canada; Agriculture & AgriFood Canada and StatPublishing
13,182
5,29829,582
44,416
966
1,576
12,066
1,200
595
4,2864,605
12,129
5,9054,846
63,066
4,907
20,358
4,981
1,060
1A
1B
2A
2B3AN
3AS
3BN
3BS4A
4B
5A
5B
6A
6B
7A
7B
8A
8B
9A
9B
2020 SCIC Acres SeededIncludes, Pedigreed and Organic Acres
As reported on Seeded Acreage ReportsMinimum of 2 customers and 400 acres required per CD
August 11, 2020CDRM
2020 Canary Seed Acres = 235,024Canary15
≤1,600≤6,000≤30,000≤63,066

14
Canadian soybean markets are largely dependent on what happens in other major soybean-producing countries. In Canada, Saskatchewan is the smallest producer of soybean because we are relatively new to producing it and varieties need a few adjustments before consistent production marks can be met.
Earlier in the year, political tensions and the Covid-19 pandemic led to the expectation that soybean markets may be poor. As the year progressed, things changed and China started buying huge quantities of soybean while American forecasts for high production showed that they had overestimated their production levels for the 2020 growing season. Because of all these changes, Canadian soybean exports have benefited by increasing from 2019 levels and also saw an increase in domestic use. Canadian stocks-to-use ratios are quite low which should bode well for next year; however, Brazil, Argentina, Paraguay and the United States are the major exporting countries and produce much larger quantities than Canada.
Soybean
2013 2014 2015 2016 2017 2018 2019 2020Seeded Area (thousand acres)
Saskatchewan 170.0 270.0 270.0 240.0 850.0 407.5 150.0 126.7Manitoba 1,050.0 1,300.0 1,410.0 1,645.4 2,290.0 1,890.0 1,469.5 1,149.6Alberta - - - - - 18.3 7.0 2.5Prairie Provinces 1,220.0 1,570.0 1,680.0 1,885.4 3,140.0 2,315.8 1,626.5 1,278.8
Production (thousand tonnes)Saskatchewan 118.4 163.3 179.6 202.5 479.0 231.8 107.2 70.0Manitoba 1,068.2 1,107.7 1,390.7 1,769.0 2,245.3 1,731.6 1,122.3 1,174.4Alberta - - - - - 11.6 4.9 -Prairie Provinces 1,186.6 1,271.0 1,570.3 1,971.5 2,724.3 1,975.0 1,234.4 1,174.4
Yields (bushels per acre) Saskatchewan 27.2 23.1 24.9 32.3 20.8 21.0 28.3 20.0Manitoba 37.6 31.6 36.4 41.0 36.1 34.0 29.2 37.3Alberta - - - - - 25.0 27.6 -Prairie Provinces 36.2 30.1 34.6 39.9 32.0 31.7 29.1 33.9
Average Price in Saskatchewan ($/tonne) 13/14 14/15 15/16 16/17 17/18 18/19 19/20 20/21
$/tonne 444 363 392 418 399 395 365 -Canadian Exports (thousand tonnes)
13/14 14/15 15/16 16/17 17/18 18/19 19/20 20/21'000 tonnes 3,413.5 3,723.6 4,101.8 4,440.6 4,908.1 5,241.1 3,898.3 -Source: Statistics Canada; Source: Statistics Canada and Saskatchewan Agriculture

15
Canadian Soybean ExportsTop 20 Destinations by Crop Year2018-19 2019-20
tonnes tonnesWorld 5,241,113 World 3,898,262
1 China (PRC) 3,157,322Iran (Islamic Rep. of ) 780,466
2 Japan 395,566 Italy 350,3413 Bangladesh 325,536 Japan 321,393
4Iran (Islamic Rep. of ) 201,559 Belgium 314,764
5 Italy 188,428 Bangladesh 310,4146 Viet-Nam 168,762 Indonesia 251,1087 Belgium 133,902 Netherlands 228,5848 United States 117,215 Germany 181,4989 Indonesia 78,296 China (PRC) 173,40610 Malaysia 56,123 United States 153,96211 Norway 53,995 Viet-Nam 119,09712 Taiwan 47,842 Spain 107,89913 Cuba 42,443 France 90,51014 Netherlands 41,163 Malaysia 71,73015 Thailand 39,896 Portugal 70,38516 Ireland 37,465 Algeria 69,69017 Spain 34,964 Taiwan 55,92018 Hong Kong 23,537 Norway 53,67219 Nepal 19,199 Thailand 42,04320 Singapore 17,976 Ireland 28,988Source: Statistics Canada
Soybean
Soybean Supply and Disposition, Canada
Aug 1Stocks
'000 tonnes
HarvestedArea
'000 acres
Production ImportsTotal
Supply
Use July 31Stocks
Stocks/Use
Exports Domestic Seed F.W.D.*
'000 tonnes
2012/13 231.3 4,188.5 5,086.4 257.6 5,575.3 3,331.6 1,540.7 186.3 359.2 157.5 3%
2013/14 157.5 4,608.7 5,355.9 343.1 5,856.5 3,427.3 1,524.6 232.5 434.8 237.3 4%
2014/15 237.3 5,576.5 6,044.8 331.2 6,613.3 3,804.4 1,780.1 230.2 341.0 457.6 7%
2015/16 457.6 5,516.5 6,456.3 319.0 7,232.9 4,190.6 1,916.4 231.2 515.1 379.6 6%
2016/17 379.6 5,514.7 6,596.5 482.4 7,458.5 4,419.8 1,922.8 300.9 460.0 355.0 5%
2017/18 355.0 7,252.0 7,716.6 534.5 8,606.1 4,928.6 1,969.3 261.3 795.6 651.3 8%
2018/19 651.3 6,275.5 7,416.6 1,131.0 9,198.9 5,639.8 2,058.4 237.9 563.0 699.8 8%
2019/20 699.8 5,610.4 6,145.0 242.3 7,087.1 3,576.2 1,741.6 213.3 835.0 721.0 11%
2020/21 721.0 5,044.0 6,358.5 300.0 7,379.5 4,000.0 1,900.0 212.0 760.0 507.5 7%*Feed, waste, and dockage
Source: Statistics Canada and the Saskatchewan Agriculture
53,293
7,68412,105
9,847
604
490
7,500
9134,270
1,710
1,310
1A
1B
2A
2B3AN
3AS
3BN
3BS4A
4B
5A
5B
6A
6B
7A
7B
8A
8B
9A
9B
2020 SCIC Acres SeededIncludes, Pedigreed and Organic Acres
As reported on Seeded Acreage ReportsMinimum of 2 customers and 400 acres required per CD
August 11, 2020CDRM
2020 Acre Maps2020 Soybeans Acres = 100,623Soybean64_280
≤4,270≤12,500≤53,293

16
Fall RyePoor harvest conditions in fall 2019 delayed seeding of fall rye in some areas. Most of the province in spring 2020 had adequate sub-soil moisture early on, benefitting winter-seeded crops. Overall yields were fairly good.
Fall rye is a winter cereal crop that can make use of moisture from winter and early spring precipitation. During the spring thaw, the crop begins to actively grow and build yield potential. Fall rye is protected from dry conditions in late July and August due to earlier maturity than spring-seeded crops; however, limited crop development in the fall can delay harvest for the following year.
Fall rye is an efficient user of nutrients and water, the crop also responds well to management. The introduction of hybrid fall rye led to the need for increased management. The hybrids considerably out-perform open-pollinated varieties.
Yields were two per cent below the five-year provincial average. Fall rye production averaged 41 bu./ac, a respectable yield but well below 2016 and 2017 with record yields of 50 bu./ac.
The seeded area was 31 per cent greater in 2020 than the five-year average, with 119,000 acres planted. There appears to be renewed interest in fall rye production. Overall production from the 2020 harvest is estimated to be 119,300 tonnes.
The United States is the top export market for fall rye, purchasing almost all Canadian exports.
2013 2014 2015 2016 2017 2018 2019 2020Seeded Area (thousand acres)
Saskatchewan 90.0 95.0 90.0 120.0 90.0 51.1 102.6 119.1Manitoba 70.0 55.0 70.0 113.7 75.0 42.3 85.9 85.7Alberta 30.0 30.0 35.0 62.1 25.0 29.1 43.8 80.5Prairie Provinces 190.0 180.0 195.0 295.8 190.0 122.5 232.3 285.3
Production (thousand tonnes)Saskatchewan 71.1 80.3 53.3 152.9 113.0 42.8 99.3 119.3Manitoba 86.4 66.0 78.7 139.7 132.0 68.2 130.3 138.5Alberta 36.3 30.9 33.0 59.7 33.5 29.7 26.7 106.5Prairie Provinces 193.8 177.2 165.0 352.3 278.5 140.7 256.3 364.3
Yields (bushels per acre) Saskatchewan 32.9 33.3 26.3 50.2 50.6 34.1 47.1 41.0Manitoba 48.6 47.3 47.7 52.4 69.2 63.5 61.8 65.7Alberta 47.7 40.5 43.3 45.2 52.8 52.9 55.3 58.7Prairie Provinces 41.2 38.8 37.1 50.1 58.3 48.7 54.5 53.3
Average Price in Saskatchewan ($/tonne) 13/14 14/15 15/16 16/17 17/18 18/19 19/20 20/21
$/tonne 233 230 229 160 166 218 190 -Canadian Exports (thousand tonnes)
13/14 14/15 15/16 16/17 17/18 18/19 19/20 20/21'000 tonnes 121.1 88.7 100.8 144.6 192.0 143.7 162.9 -Source: Statistics Canada

17
Canadian Rye ExportsTop 11 Destinations by Crop Year2018-19 2019-20
tonnes tonnesWorld 143,700 World 162,925
1 United States 140,325 United States 161,2862 Japan 1,322 Japan 9073 Korea (Rep. of ) 960 South Africa 3814 United Kingdom 441 Korea (Rep. of ) 2405 South Africa 340 Taiwan 426 Netherlands 93 Colombia 377 South Sudan 68 Denmark 208 Colombia 49 Kazakhstan 12
9 Lebanon 41
10 Taiwan 21
11 Denmark 20
12 China (PRC) 20Source: Statistics Canada
Fall Rye
Fall Rye Supply and Disposition, Canada
Aug 1Stocks
'000 tonnes
HarvestedArea
'000 acres
Production ImportsTotal
Supply
Use July 31Stocks
Stocks/Use
Exports Domestic Seed F.W.D.*
'000 tonnes
2012/13 24.6 295.0 336.6 0.3 361.5 192.5 45.7 8.8 68.4 46.1 15%
2013/14 46.1 215.0 222.9 0.1 269.1 121.1 41.6 9.3 52.8 44.3 20%
2014/15 44.3 218.2 217.5 0.1 261.9 88.6 42.2 10.2 78.7 42.2 19%
2015/16 42.2 233.6 225.5 0.4 268.1 100.8 44.4 14.0 57.9 51.0 23%
2016/17 51.0 345.2 436.0 0.7 487.7 144.8 48.2 12.9 117.9 163.9 51%
2017/18 163.9 248.8 341.3 1.4 506.6 194.2 57.3 11.9 119.0 124.2 32%
2018/19** 124.2 195.4 236.4 2.1 362.7 146.2 19.2 14.9 133.3 49.1 16%
2019/20 49.1 253.5 333.4 3.0 385.5 165.2 19.1 20.7 140.4 40.1 12%
2020/21 40.1 378.0 487.8 2.1 530.0 190.0 50.0 21.7 104.0 164.3 45%*Feed, waste, and dockage
** includes both fall and spring rye; fall rye makes up 96 per cent of production
Source: Statistics Canada, Saskatchewan Agriculture
3,680
3,143
1,545
2,420
3,216
2,203
3,788
426
2,700
20,6832,374
1,0117,246
2,5801,489
1,155
1,459
628
2,200
1,264
1A
1B
2A
2B3AN
3AS
3BN
3BS4A
4B
5A
5B
6A
6B
7A
7B
8A
8B
9A
9B
2020 SCIC Acres SeededIncludes, Pedigreed and Organic Acres
As reported on Seeded Acreage ReportsMinimum of 2 customers and 400 acres required per CD
August 11, 2020CDRM
2020 Fall Rye Acres = 65,210FallRye7
≤1,600≤4,000≤8,000≤20,683

18
2013 2014 2015 2016 2017 2018 2019 2020Seeded Area (thousand acres)
Saskatchewan 60.0 37.0 50.0 55.9Manitoba 7.1 7.6Alberta 75.0 80.0 45.0 35.0 34.7 35.0 32.5Prairie Provinces - 75.0 80.0 45.0 95.0 71.7 92.1 96.0
Production (thousand tonnes)Saskatchewan 54.4 40.3 61.8 71.5Manitoba 6.3 7.8Alberta 107.5 81.6 54.4 45.4 43.4 38.5 41.0Prairie Provinces - 107.5 81.6 54.4 99.8 83.7 106.6 120.3
Yields (hundredweight per acre) Saskatchewan 20.3 25.7 28.8 28.2Manitoba 19.7 22.7Alberta 31.6 23.4 29.3 29.4 28.8 26.9 31.2Prairie Provinces 31.6 23.4 29.3 23.7 27.2 27.4 28.7
Average Price in Saskatchewan ($/tonne) 13/14 14/15 15/16 16/17 17/18 18/19 19/20 20/21
$/tonne - - - - 269 224 -Canadian Exports (thousand tonnes)
13/14 14/15 15/16 16/17 17/18 18/19 19/20 20/21'000 tonnes 9.5 23.6 25.1 13.3 27.1 39.4 29.9Source: Statistics Canada; Saskatchewan Agriculture
Faba BeanFaba bean seeded area and production remained fairly constant over the past four years in Western Canada because of lower production in competing countries like Australia and parts of Europe. In 2020; however, production in the leading producer of faba bean, Australia, increased as well as in some of the Baltic countries. This will put pressure on Canadian faba bean exports and markets may be difficult to find.
Interest in new low vicine/convicine varieties in Canada may generate a new opportunity for faba beans from Canada in the ingredients market. Plant-based proteins are increasingly in demand and faba beans have some of the highest protein levels among pulses. Purity may be an issue in high-producing areas because of the danger of contamination from cross-pollination with high vicine/convicine varieties.

19
Canadian Broad Bean ExportsTop 12 Destinations by Crop Year2018-19 2019-20
tonnes tonnesWorld 39,405 World 29,874
1 Egypt 24,556 Egypt 18,0052 United States 11,158 United States 8,005
3United Arab Emirates 1,389 India 1,599
4 Denmark 641 Korea (Rep. of ) 8125 Lebanon 581 Turkey 5946 India 422 Morocco 3917 Jordan 203 Kuwait 128 Israel 188 Japan 1179 Japan 139 Israel 7510 China (PRC) 75 Italy 4411 Netherlands 28 Norway 4012 Qatar 25 Belgium 38
Source: Statistics Canada
Faba Bean
877
2,168
1,229
4,9832,078
2,711
2,587
19,013
17,903
7,294
7,434
1A
1B
2A
2B3AN
3AS
3BN
3BS4A
4B
5A
5B
6A
6B
7A
7B
8A
8B
9A
9B
2020 SCIC Acres SeededIncludes, Pedigreed and Organic Acres
As reported on Seeded Acreage ReportsMinimum of 2 customers and 400 acres required per CD
August 11, 2020CDRM
2020 Acre Maps2020 Fababean Acres = 68,700Fababeans24
≤1,300≤3,000≤7,500≤19,013

20
Hemp
2013 2014 2015 2016 2017 2018 2019 2020
Seeded Area (thousand acres)
Saskatchewan - - - - - 19.1 42.0 14.6
Manitoba - - - - - 11.3 11.5 12.4
Alberta - - - - - 6.1 34.6 22.7
Prairie Provinces - - - - - 36.5 88.1 49.7
Production (thousand tonnes)
Saskatchewan - - - - - - - 6.4
Manitoba - - - - - - - 4.2
Alberta - - - - - - - 15.3
Prairie Provinces - - - - - - - 25.9
Yields (pounds per acre)
Saskatchewan - - - - - - 973 960
Manitoba - - - - - - 764 754
Alberta - - - - - - 856 1 525
Prairie Provinces - - - - - - 900 1,167
Average Price in Saskatchewan ($/tonne)
13/14 14/15 15/16 16/17 17/18 18/19 19/20 20/21$/tonne - - - - - - - -
Canadian Exports (thousand tonnes)
13/14 14/15 15/16 16/17 17/18 18/19 19/20 20/21'000 tonnes 2.6 11.6 23.1 18.0 5.6 4.2 5.9 -Source: Statistics Canada
Due to its recent legalization for Cannabidiol (CBD), hemp has become a crop of interest among producers. A couple of years ago, hemp became extremely popular, with large seeded areas reported throughout much of Canada, especially Western Canada. Much of the hemp produced was going into the food, oil and fibre markets.
Because of this rapid boom in production, combined with a very young market and an immature hemp-processing industry, it has led to a high-risk and volatile production and marketing environment for producers. This is further complicated when other hemp producing jurisdictions export large quantities of hemp into Canada at low prices.
Agronomics and processing hemp for CBD is new and requires further development to see this market increase and flourish. Saskatchewan is a leader in agricultural innovation and there are companies opening in the province to help see this development progress. Too many pseudo-processors for CBD are saturating this market with poor quality and in some cases, almost useless CBD in the marketplace. Buyers need to be vigilant in knowing exactly what they want when purchasing these products.

480
453
721
2,263
655
627
8593,030
1A
1B
2A
2B3AN
3AS
3BN
3BS4A
4B
5A
5B
6A
6B
7A
7B
8A
8B
9A
9B
2020 SCIC Acres SeededIncludes, Pedigreed and Organic Acres
As reported on Seeded Acreage ReportsMinimum of 2 customers and 400 acres required per CD
August 11, 2020CDRM
2020 Acre Maps2020 Hemp Grain Acres = 10,070HempGrain71
≤480≤721≤859≤3,030
Canadian Hemp ExportsTop 20 Destinations by Crop Year2018-19 2019-20
tonnes tonnesWorld 5,561 World 4,220
1 United States 3,870 United States 3,3692 United Kingdom 458 Korea Republic 233
3 Korea Republic 456 Australia 1674 Netherlands 317 Netherlands 1495 Italy 156 United Kingdom 726 New Zealand 54 Estonia 527 Italy 40 New Zealand 488 Algeria 37 Japan 449 South Africa 32 South Africa 4210 Japan 20 Italy 4011 Costa Rica 16 Belgium 3912 Poland 12 Ireland 37Source: Statistics Canada