
Specialization dynamics Stephen Reddingreddings/pubpapers/SpecDynJIE2002.pdf · Specialization...
36
Journal of International Economics 58 (2002) 299–334 www.elsevier.com / locate / econbase Specialization dynamics * Stephen Redding Department of Economics, London School of Economics and CEPR, Houghton Street, London WC2A 2AE, UK Received 22 September 1999; received in revised form 27 September 2001; accepted 28 October 2001 Abstract This paper proposes a new empirical framework for analyzing specialization dynamics. A country’s pattern of specialization is viewed as a distribution across sectors, and statistical techniques for analyzing the evolution of this entire distribution are employed. The empirical framework is implemented using data on 20 industries in seven OECD countries since 1970. We find substantial mobility in patterns of specialization. Over time horizons of 5 years, this is largely explained by forces common across countries, including world prices and common changes in technical efficiency. Over longer time horizons, country-specific changes in factor endowments become more important. There is no evidence of an increase in countries’ overall degree of specialization. 2002 Elsevier Science B.V. All rights reserved. Keywords: Distribution dynamics; Factor endowments; International trade; Neoclassical model JEL classification: F11; F14; C14 1. Introduction Theoretical models of trade and growth emphasize that patterns of specialization are dynamic and evolve endogenously over time. This contrasts with much of the existing empirical trade literature, which is concerned with production and trade at a point in time. This paper proposes a new empirical framework for analyzing *Tel.: 144-20-7955-7483; fax: 144-20-7831-1840. E-mail addresses: [email protected] (S. Redding), http: / / econ.lse.ac.uk / |sredding / (S. Redd- ing). 0022-1996 / 02 / $ – see front matter 2002 Elsevier Science B.V. All rights reserved. PII: S0022-1996(01)00169-6
Transcript of Specialization dynamics Stephen Reddingreddings/pubpapers/SpecDynJIE2002.pdf · Specialization...

Journal of International Economics 58 (2002) 299–334www.elsevier.com/ locate/econbase
Specialization dynamics
*Stephen ReddingDepartment of Economics, London School of Economics and CEPR, Houghton Street,
London WC2A 2AE, UK
Received 22 September 1999; received in revised form 27 September 2001; accepted 28 October 2001
Abstract
This paper proposes a new empirical framework for analyzing specialization dynamics. Acountry’s pattern of specialization is viewed as a distribution across sectors, and statisticaltechniques for analyzing the evolution of this entire distribution are employed. Theempirical framework is implemented using data on 20 industries in seven OECD countriessince 1970. We find substantial mobility in patterns of specialization. Over time horizons of5 years, this is largely explained by forces common across countries, including world pricesand common changes in technical efficiency. Over longer time horizons, country-specificchanges in factor endowments become more important. There is no evidence of an increasein countries’ overall degree of specialization. 2002 Elsevier Science B.V. All rights reserved.
Keywords: Distribution dynamics; Factor endowments; International trade; Neoclassical model
JEL classification: F11; F14; C14
1. Introduction
Theoretical models of trade and growth emphasize that patterns of specializationare dynamic and evolve endogenously over time. This contrasts with much of theexisting empirical trade literature, which is concerned with production and trade ata point in time. This paper proposes a new empirical framework for analyzing
*Tel.: 144-20-7955-7483; fax:144-20-7831-1840.E-mail addresses: [email protected] (S. Redding), http: / /econ.lse.ac.uk/|sredding/ (S. Redd-
ing).
0022-1996/02/$ – see front matter 2002 Elsevier Science B.V. All rights reserved.PI I : S0022-1996( 01 )00169-6

300 S. Redding / Journal of International Economics 58 (2002) 299–334
specialization dynamics. The analysis begins with a measure of a country’s extentof specialization in an individual industry derived directly from neoclassical tradetheory: the share of the industry in that country’s GDP. A country’s pattern ofspecialization at any one point in time is characterized by the distribution of sharesof GDP across industries. The dynamics of a country’s pattern of specializationcorrespond to the evolution of thisentire cross-section distribution over time. Thefocus on a country’s distribution of GDP shares across industries means that thepaper is concerned with production structure within countries. We employ astatistical model of distribution dynamics that has been widely used in thecross-country growth literature and is explicitly suited to analyzing the evolutionof entire distributions. The empirical framework is implemented using data on 20
1industries in seven OECD countries since 1970.Using these techniques, it becomes possible to analyze a variety of issues
relating to specialization dynamics that are suggested by the theoretical literatureon trade and growth. One set of issues relates to the evolution of theexternalshape of the distribution of GDP shares and concerns changes in countries’ overalldegree of specialization—the extent to which production activity is concentrated ina few industries. For example, more rapid technological progress in the industriesin which a country specializes and the accumulation of factors used intensively inthese industries will result in increased specialization over time. This will bereflected in a polarization of the distribution of GDP shares towards extremevalues, as countries increasingly specialize in one set of industries and reducespecialization in others. In the extreme, a bimodal or ‘‘twin-peaked’’ distributionwill emerge.
A second set of issues relates to how a country’s extent of specialization inindividual industries changes over time and is concerned withintra-distributiondynamics. A number of theoretical models of trade and growth identify reasonswhy initial patterns of specialization may either be locked-in (persistence) orreversed (mobility) over time. Whether patterns of specialization exhibit per-sistence or mobility therefore becomes an empirical question which can beaddressed by analyzing the movement of industries within a country’s distributionof GDP shares. Suppose an industry lies in the lower tail of the distribution ofGDP shares. What is the probability over a given period of time that the industrywill remain there? What is the probability that it will transit to the upper tail of thedistribution of GDP shares and become a sector in which the country specializes?Where in the distribution is the greatest degree of mobility observed?
A third set of issues concerns the economic determinants of changes in adistribution’s external shape and of industries’ movements within the distributionof GDP shares. A structural econometric equation linking GDP shares, relative
1Rather than focusing on production structure within countries, one could also use the sametechniques to analyze the evolution of the distribution of production activity across countries within anindustry. This is closely related to the concept of localization in the empirical economic geographyliterature (see, for example, Overman et al., 2001).

S. Redding / Journal of International Economics 58 (2002) 299–334 301
prices, technology levels, and factor endowments is derived from neoclassicaltrade theory. This econometric relationship is used to decompose observedchanges in patterns of specialization into two components: (a) country-specificchanges in factor endowments and (b) forces which are either common acrosscountries but specific to individual industries (e.g. changes in industry prices onworld markets, pervasive changes in technical efficiency in individual industries)or common across both countries and industries (e.g. shared changes in technicalefficiency across all manufacturing industries, common changes in factor endow-ments across all countries). The same model of distribution dynamics may be usedto analyze how patterns of specialization—the entire distribution of GDP shares—would have evolved if only country-specific changes in factor endowments hadoccurred or if only common forces across countries had operated.
Our main findings are as follows. First, there is substantial mobility in patternsof specialization. In the United States, the probability of an industry transiting outof its initial quintile of the distribution of GDP shares after 5 years varies from0.39 towards the centre of the distribution to around 0.20 in the upper and lowertails. The highest levels of mobility are found in Japan and Sweden; Canada, theUnited Kingdom, and United States have intermediate levels; Denmark andFinland display the least.
Second, we find no evidence of an increase in the extent to which countries’production is concentrated in a few industries. Indeed, in Finland and Denmark,there is an increase in the number of industries located at intermediate values forshares of GDP, suggesting a decrease in specialization in these countries. Third,estimation of the structural econometric equation derived from neoclassical theoryreveals factor endowments to be an important determinant of patterns ofspecialization. Over time horizons of 5 years, country-specific changes in factorendowments are found to be less quantitatively important in explaining theobserved mobility in specialization patterns than forces which are common acrosscountries. Exceptions are Japan and Finland, where changes in factor endowmentsexplain the majority of the observed mobility even over 5-year periods. In Japan,this is related to a combination of rapid physical capital accumulation and skillacquisition; in Finland, skill acquisition plays a central role.
Over longer time horizons of 10 years and above, common cross-country effectsremain influential, but country-specific changes in factor endowments becomerelatively more important. In the literature on international trade and wageinequality, there is considerable debate concerning the speed at which ‘‘the
2Heckscher–Ohlin clock ticks’’. In another context, our findings suggest that ittakes time for gradual changes in countries’ relative factor abundance to manifestthemselves in substantial changes in production structure.
The paper is organized as follows. Section 2 reviews the relationship to theexisting literature. Section 3 derives a measure of a country’s extent of specializa-
2See, for example, the discussion in Leamer (1998).
302 S. Redding / Journal of International Economics 58 (2002) 299–334
tion in individual industries directly from neoclassical trade theory and obtains astructural econometric equation linking this measure to factor endowments,relative prices, and technology. Section 4 introduces a model of distributiondynamics which, given this measure, may be used to analyze the dynamics of acountry’s pattern of specialization. Section 5 undertakes a preliminary analysis ofthe data. Section 6 presents the results of the econometric estimation. Section 7concludes.
2. Relation to existing literature
The paper is related to three main bodies of existing work. First, the theoreticalliterature on trade and growth provides motivation. One strand of this literatureemphasizes the role of endogenous technological change. In the absence ofinternational knowledge spillovers, models of endogenous investments in R&D orsector-specific learning by doing predict that initial patterns of specialization willbecome locked-in over time (e.g. Krugman, 1987; Lucas, 1988; Grossman andHelpman, 1991, Chapter 7; Redding, 1999a). However, both international knowl-edge spillovers and cross-country differences in the productivity of R&D/rates oflearning by doing provide reasons why initial patterns of specialization may bereversed over time (e.g. Grossman and Helpman, 1991).
Another strand of theoretical research emphasizes the role of factor accumula-tion (including Findlay, 1970; Deardorff, 1974; Davis and Reeve, 1997). Again,initial patterns of specialization may be reinforced or weakened over time. Thepoint is made particularly clearly in the 23 23 2 Heckscher–Ohlin model, wherethis depends simply upon whether the initially capital-abundant or capital-scarecountry experiences the more rapid rate of increase in its endowment of capitalrelative to labour. If the former, then not only will initial patterns of specializationbecome locked-in, but countries’ overall degree of specialization will rise overtime.
Second, the paper relates to the empirical literature that estimates the relation-ship between factor endowments and the international location of production.Harrigan (1995) and Bernstein and Weinstein (1998) regress output levels onfactor endowments in a specification derived directly from then-good, m-factorHeckscher–Ohlin model. Factor endowments are found to have a statisticallysignificant and quantitatively important effect on levels of production, althoughwithin-sample predictions errors are typically large, particularly using regional
3data.
3See Hanson and Slaughter (1999) and Gandal et al. (2000) for analyses of the generalizedRybczynski Theorem using US State and Israeli data. Another literature considers the relationshipbetween factor endowments and international trade in factor services. See, for example, Leamer (1984),Bowen et al. (1987), Trefler (1995), and Davis et al. (1997).

S. Redding / Journal of International Economics 58 (2002) 299–334 303
Harrigan (1997) estimates the neoclassical model of production and finds thatlevels of technology as well as factor endowments are important determinants ofpatterns of specialization. Harrigan and Zakrajsek (2000) estimate the model for abroad sample of developed and developing countries and find that factor
4endowments are a major influence on specialization. With the exception ofHarrigan (1997), each of these papers is concerned with a static relationshipbetween factor endowments and production patterns at a point in time. Harrigan(1997) also considers a dynamic specification where a regression of GDP shareson factor endowments, technology levels, and controls for relative prices isaugmented with a lagged dependent variable. This specification allows for partialadjustment, and the coefficient on the lagged dependent variable is found to behighly statistically significant. However, there is no analysis of the implications forintra-distribution dynamics or the evolution of the external shape of the dis-tribution of GDP shares.
Third, a small number of papers have explicitly considered changing patterns oftrade and production. One older branch of research has addressed these issueswithin the context of then 3m Heckscher–Ohlin model. This includes Balassa(1979), Stern and Maskus (1981), Bowen (1983), and Maskus (1983). While thefirst two studies consider cross-country regressions of RCA and net exports onfactor endowments, the last two analyze cross-industry regressions of net exports
5on factor endowments for a single country (the United States). The relativeavailability of skilled and unskilled labour is typically found to be an importantdeterminant of patterns of comparative advantage, and US-based studies find thatby the 1970s the Leontief Paradox no longer held.
An alternative branch of research has adopted a more descriptive approach lessdirectly linked to theory. Kim (1995) and Amiti (1999) analyze a production-based measure of specialization (the ‘‘location quotient’’) that is directly analo-
6gous to trade-based measures of Revealed Comparative Advantage (RCA). Bothpapers examine changes in countries’ overall degree of specialization usingsummary statistics such as the coefficient of variation or Gini coefficient. Whileinformative, these are not generally sufficient statistics for a distribution’s externalshape and yield no information concerning intra-distribution dynamics.
Proudman and Redding (1998, 2000) use aRCA-based measure of specializa-tion to analyze both persistence versus mobility and changes in countries’ overalldegree of specialization. A model of distribution dynamics is used to analyze the
4See Nickell et al. (2001) for a neoclassical analysis of OECD countries’ specialization innon-manufacturing industries.
5See Feenstra and Rose (2000) for an analysis of the dynamic predictions of the product lifecyclehypothesis for cross-country export patterns.
6Revealed Comparative Advantage (RCA) is defined as a country’s share of world exports in sectorjdivided by that country’s share of world exports of all goods. The ‘‘location quotient’’ is thus acountry’s share of world production in sectorj divided by the country’s share of world production of allgoods.

304 S. Redding / Journal of International Economics 58 (2002) 299–334
evolution of the entire distribution. However, the measure of specialization used isad hoc and cannot easily be related to general equilibrium trade theory. For thesereasons, it is not possible to link changes in specialization patterns to structural
7economic determinants.
3. Neoclassical theory and economic determinants
In this section, we use neoclassical trade theory to derive a theory-consistentmeasure of specialization and to relate that measure to underlying structuraleconomic determinants (see Dixit and Norman, 1980, for a wider exposition).Time is indexed byt, countries byc [ h1, . . . ,Cj, final goods by j [ h1, . . . ,nj,and factors of production byi [ h1, . . . ,mj. Each country is endowed with anexogenous vectorv of factors of production, and production is assumed to occurct
under conditions of perfect competition and constant returns to scale. We allow fordifferences in factor endowments across countriesc and technology differencesacross both countriesc and industriesj.
General equilibrium in production may be represented using the revenuefunction r ( p ,v ). Under the assumption that this function is twice continuouslyc ct ct
differentiable, the vector of the economy’s profit-maximizing net outputs8y ( p ,v ) is equal to the gradient ofr ( p ,v ) with respect top . The analysisc ct ct c ct ct ct
allows for Hicks-neutral and factor-augmenting technology differences. Our mainspecification considers Hicks-neutral technology differences across countries,industries, and time. In this case, the production technology takes the formy 5u F (v ), whereu parameterizes technology in industryj of countryc atcjt cjt j cjt cjt
time t. The revenue function is given byr ( p ,v )5 r(u p ,v ), whereu is anc ct ct ct ct ct ct9n 3 n diagonal matrix of the technology parametersu . Changes in technology incjt
industry j of countryc have analogous effects on revenue to changes in industryjprices.
We follow Harrigan (1997) and Kohli (1991) in assuming a translog revenuefunction. This flexible functional form provides an arbitrarily close local approxi-
10mation to the true underlying revenue function,
7For related work, again using ad hoc and atheoretic measures of specialization such as RCA or thelocation quotient, see Brasili et al. (1999), Hinloopen and van Marrewijk (1998), and Stolpe (1994).
8Formally, a sufficient condition for the revenue function to be twice continuously differentiable isthat there are at least as many factors as goods:m $ n. With n .m, production levels may beindeterminant, although this will depend on technology differences, trade costs, and whether or notthere is joint production. The potential existence of production indeterminacy is really an empiricalissue. In the presence of production indeterminacy, the specification below including factor endow-ments and controls for relative prices and technology will be relatively unsuccessful in explainingcountries’ patterns of production.
9See Dixit and Norman (1980, pp. 137–139).10To save notation, country–time subscripts are suppressed except where important.

S. Redding / Journal of International Economics 58 (2002) 299–334 305
1]ln r(up,v)5a 1O a ln u p 1 OO a ln(u p ) ln(u p )00 0j j j jz j j z z2
zj j
1]1O b ln v 1 OO b ln v ln v 1OO g ln(u p )(ln v ), (1)0i i ih i h ji j j i2
i i h j i
wherej,z [ h1, . . . ,nj index goods andi,h [ h1, . . . ,mj index factors. Symmetry ofcross effects implies:a 5a , b 5b for all j, z, i, andh. Linear homogeneityjz zj ih hi
of degree 1 inv and p requires:o a 5 1, o b 5 1, o a 50, o b 5 0,j 0j i 0i j zj i ih
o g 50. Differentiating the revenue function with respect to eachp , we obtaini ji j
the following equation for the share of industryj in country c’s GDP at timet:
p y (u p ,v )cjt cjt ct ct ct]]]]]s 5 5a 1O a ln p 1O a ln u 1O g ln v . (2)cjt 0j jz czt jz czt ji citr(u p ,v ) z zct ct ct i
This equation provides the theory-consistent measure of specialization in anindustry (the share of the industry in the country’s GDP) that will be used with themodel of distribution dynamics introduced below. It also relates the specializationmeasure to underlying economic determinants: relative prices, technology, andfactor endowments. The translog specification implies coefficients on thesevariables that are constant across countries and over time. This is true even withoutfactor price equalization. Indeed, with cross-country differences in technology,factor price equalization will typically not be observed. The effect of cross-countrydifferences in relative prices and technology on patterns of production is directlycontrolled for by the presence of the second and third terms on the right-hand sideof Eq. (2). The analysis so far makes no assumptions about whether countries arelarge or small and allows for both tradeable and non-tradeable goods. If countriesare small and all goods are tradeable, the vector of relative prices will bedetermined exogenously on world markets. With either large countries or non-tradeable goods, relative prices will be endogenous and will depend in part onfactor endowments. Other things equal and on average across industries in a givencountry, the relative price of a non-traded good will be lower the more intensivelyit uses the country’s relatively abundant factors of production.
If all goods are freely traded, relative prices will be the same across countries( p 5 p for all c), and the second term on the right-hand side of Eq. (2) can beczt zt
captured by a full set of time dummies for each industryj. In practice, there maybe country-specific barriers to trade and some goods may be non-tradeable, and wewish to allow for both possibilities. We therefore follow Harrigan (1997) inmodelling non-traded goods prices as being drawn from an estimable probabilitydistribution, consisting of a country–industry effect, industry-time dummies, andan independently distributed stochastic error.
The specification in (2) is more general than those typically considered in theempirical trade literature, and allows for cross-country differences in technology,

306 S. Redding / Journal of International Economics 58 (2002) 299–334
the magnitude of which may vary across industries as is consistent with empirical11evidence. In principle, the Hicks-neutral technology differences,u , can becjt
measured using data on factor inputs and output together with results from theliterature on Total Factor Productivity (TFP) measurement (see, for example,Caves et al., 1982; Harrigan, 1997). However, compatible data on factor inputsand outputs are not available at the level of the highly disaggregated manufactur-ing industries considered in this paper. We therefore also model country–industry
12technology differences as being drawn from an estimable probability distribution.From (2), our main estimation equation becomes
s 5h 1 f 1O g ln v 1v , (3)cjt cj jt ji cit cjti
where the country–industry effect,h , controls for any permanent country–cj
industry–specific barriers to trade and/or any permanent country–industry differ-ences in technology. The industry–year dummies,f , capture common changes injt
relative prices across countries in individual industries, common and potentiallyindustry-specific changes in technology, and common changes in factor endow-ments across all countries.
Eq. (3) may be estimated separately for each industry using a panel of dataacross countries and over time. Observed changes in countries’ patterns ofspecialization are explained by a combination of country-specific changes in factorendowments,v , and forces which are common across countries and potentiallyct
industry-specific,f . If one country accumulates a given factor of production overjt
time, this will result in changes in industrial structure. On average, industries usingthis factor of production the most intensively will experience the greatest increasesin output, while those using the factor of production least intensively willexperience the smallest increases in output. This will have implications for boththe location of individual industries within the distribution of GDP shares and forthe external shape of this distribution. If the factor of production accumulated isused most intensively in the industries where the country is initially specialized,we will observe persistence in initial patterns of specialization over time and anincrease in the country’s overall degree of specialization. These specializationdynamics correspond to movements between long-run equilibria. The model ofdistribution dynamics may also be applied to the predicted values for shares of
PGDP from Eq. (3). We denote these bys :cjt
P ˆˆ ˆs 5h 1 f 1O g ln v , (4)cjt cj jt ji citi
11See, for example, Harrigan (1997, 1999), and Griffith et al. (2000).12An alternative would be to aggregate up to a higher level of industrial disaggregation. However,
this would entail losing a wide range of interesting specialization dynamics.

S. Redding / Journal of International Economics 58 (2002) 299–334 307
where a hat above a parameter denotes an estimated value. Comparing the resultsof the distribution dynamics analysis with those using actual shares of GDPreveals the extent to which the model is able to explain observed changes inspecialization patterns—both changes in external shape and movements of
13individual industries within the distribution of GDP shares.Eq. (3) may also be used to decompose observed changes in specialization into
the component explained by common cross-country effects and the componentexplained by factor endowments. Predicted values may be constructed holdingfactor endowments constant at their beginning of sample values,v , and onlyc0
Iallowing the industry–year effects,f , to change over time. We denote these bysjt cjt
(industry–year predictions). Similarly, predicted values may be constructedholding the industry–year effects constant at their beginning of sample values,f ,j0
and only allowing factor endowments,v , to change over time. We denote thesectEby s (endowment predictions). Applying the model of distribution dynamics tocjt
I Es and s reveals the extent to which common cross-country effects andcjt cjt
country-specific changes in factor endowments, respectively, can explain observedspecialization dynamics.
The error in Eq. (3) includes stochastic determinants of relative prices andtechnology not captured by a country–industry effect and industry-time dummies.If these are uncorrelated with factor endowments, estimation of Eq. (3) will yieldunbiased and consistent values of the structural parametersg . These correspondji
to the Rybczynski derivatives of Heckscher–Ohlin theory: thedirect generalequilibrium effects of changes in factor endowments on the shares of sectors inGDP, holding constant relative prices and technology. More generally, theestimated coefficients on factor endowments will also capture the effects ofstochastic determinants of relative prices and technology correlated with factorendowments (to the extent that these are not controlled for by the country–industry effect and industry–time dummies). If countries are large or goodsnon-tradeable, changes in factor endowments will affect relative goods prices,giving rise to a correlation between endowments and relative prices. In the absenceof factor price equalization, relative factor abundance may influence the directionof technological change. Entrepreneurs may endogenously choose innovativeeffort in response to factor intensities and relative factor prices, inducing a
14correlation between endowments and technology.In each case, the correlation is capturing anindirect effect of factor endowments
on output levels—in the first case through relative prices and in the second throughtechnology levels. In the distribution dynamics analysis, we are not concerned withthe structural estimation of Rybczynski derivatives. Rather, we seek to examinehow much of the observed changes in patterns of specialization can be statistically
13For a related analysis of conditioning in distribution dynamics models of growth, see Quah (1996b,1997).
14See Acemoglu (1998) for an analysis of directed technological change and wage inequality.

308 S. Redding / Journal of International Economics 58 (2002) 299–334
explained by country-specific changes in factor endowments and by considerationsthat are common across countries. For this purpose, it does not matter whether thecoefficient on factor endowments is capturing a direct Rybczynski effect or anindirect effect through relative prices and technology. The analysis simplyexamines how patterns of specialization are predicted to evolve based on factorendowments on the one hand and considerations that are common across countriesand potentially industry-specific on the other hand.
The industry–time dummies impact on patterns of specialization because theirvalue typically varies across industries. Changes in relative prices will, forexample, lead some industries to expand and others to contract, resulting in bothintra-distribution dynamics and changes in external shape. Although the industry–time dummies in Eq. (3) take the same value for all countries, their effect onpatterns of specialization will be different in different countries. This is becausethe effect on patterns of specialization depends on the correlation betweencommon changes in industry size on the one hand and a country’sinitial pattern ofspecialization on the other. For example, suppose that all countries experience asystematic increase over time in the GDP share of Chemicals and a systematicdecrease in the GDP share of Iron and Steel. For those countries that initiallyspecialize in Chemicals and where Iron and Steel is initially a small share of GDP,this common change in industrial structure will result in an increased degree ofspecialization and a polarization of GDP shares towards extreme values. For thosecountries that initially specialize in Iron and Steel and where Chemicals is initiallya small share of GDP, a decrease in the extent of specialization and mobility withinthe distribution of GDP shares will be observed.
The evolution of countries’ patterns of specialization will also vary substantiallydepending upon their precise paths of factor accumulation and the correlationbetween factor accumulation and the factor intensities of industries where theyinitially specialize. For these reasons, the model of distribution dynamics intro-duced in the next section is estimated country by country.
4. Empirical modelling of specialization dynamics
Denote a countryc’s extent of specialization in industryj at time t by s . Acjt
country’s pattern of specialization at a point in time is characterized by thecumulative distribution function ofs across industriesj, F (s). Corresponding tocjt ct
F , we may define a probability measure,l ,ct ct
l ((2`,s]) 5F (s), ;s [R , (5)ct ct
where, in the empirical application below,s is the share of an industry in acjt
country’s GDP andl is the probability density function for shares of GDP acrossct
industriesj in country c at time t.

S. Redding / Journal of International Economics 58 (2002) 299–334 309
The dynamics of a country’s pattern of specialization correspond to theevolution of the entire cross-section distribution ofs over time. We employ astatistical model of distribution dynamics that has been widely used in thecross-country growth literature. Following Quah (1993, 1996a,b) the evolution ofthe cross-section distribution is modelled using a stochastic difference equation:
*l 5P (l ,u ), integert, (6)ct c c(t21) t
*wherehu : integertj is a sequence of disturbances to the entire distribution andPt c
is an operator that maps disturbances and probability measures into probabilitymeasures. For simplicity, we begin by assuming that this stochastic difference
*equation is–first order and that the operatorP is time invariant. Absorbing thec
*disturbanceu into the definition of the operatorP , we obtaint c
* * *l 5P (l ) 5P (P (l ))c(t1t ) c c(t1t21) c c c(t1t22)
: (7)t*5 (P ) l .c ct
If the space of possible values fors is divided into a number of discrete cells*k [ h1, . . . ,Kj, P becomes a matrix of transition probabilities:c
*l 5P ? l , (8)c(t11) c ct
wherel is now aK 31 vector of probabilities that an industry is located in actkl *given grid cell at timet. An elementp of the K 3K matrix P denotes thec c
probability that an industry beginning in cellk moves to celll, and may beestimated by counting the number of transitions out of and into each cell. Thematrix of transition probabilities yields information on both the degree and patternof mobility throughout the entire distribution ofs. High values of transitionprobabilities along the diagonal indicate persistence, while larger off-diagonal
15terms imply greater mobility.Taking the limitt →` in Eq. (7), one obtains the implied ergodic or stationary
distribution of s. This is the long-run distribution towards which patterns ofspecialization are evolving, and corresponds to the eigenvector associated with thelargest eigenvalue of the transition probability matrix. It provides information onthe evolution of the external shape of the GDP shares distribution.
The degree of mobility in patterns of specialization may be summarized usingindices of mobility. These formally evaluate the degree of mobility throughout theentire distribution of GDP shares and facilitate direct cross-country comparisons of
15Rather than dividing the space of possible values for shares of GDP into a number of discrete cells,one may continue to treats as a continuous variable and estimate the stochastic kernel corresponding to
*P (see, for example, Quah, 1996b). In the present application, there are too few industries to estimatec
stochastic kernels for each country. The working paper version of this paper reported stochastic kernelsestimated from pooling observations across countries (see Redding, 1999b).

310 S. Redding / Journal of International Economics 58 (2002) 299–334
1mobility. The first of these indices (M , following Shorrocks, 1978; Quah, 1996c)evaluates the trace, tr, of the transition probability matrix. This index thus directlycaptures the relative magnitude of diagonal and off-diagonal terms, and can beshown to equal the inverse of the harmonic mean of expected durations of
2remaining in a given grid cell. The second (M , following Shorrocks, 1978;Geweke et al., 1986) evaluates the determinant, det, of the transition probability
16matrix
*K 2 tr[P ]c1 2]]] *M 5 , M 5 12 udet(P )u. (9)c c cK 2 1
Conventional hypothesis testing on the estimated transition probabilities ispossible using results from Anderson and Goodman (1957). Under the null
kl klhypothesisp 5 q , the transition probabilities for each statek have an asymptotic2
x distribution:K kl kl 2 T21( p 2 q )k 2 k k¯ ¯]]]]O N ? | x (K 2 1), N ;O N (t), (10)klql51 t50
kl klwhere p are the estimated transition probabilities,q are the probabilities ofktransition under the (known) null, andN (t) denotes the number of industries in
cell k at time t. This test statistic holds for each statek 5 1, . . . ,K. Since thetransition probabilities are independently distributed across states, we may sum
2over states, and the resulting test statistic is asymptotically distributedx (K(K 2
1)).A key advantage of the statistical techniques used in this paper is that they
facilitate an analysis of the evolution of the entire distribution of GDP shares. Itbecomes possible to explicitly address issues such as persistence versus mobilityand changes in the overall degree of specialization. The implementation of thetechniques raises a variety of issues of econometric specification, including thelength of the transition period, the number of grid cells, and the stability of the
*operatorP over time. In the empirical analysis below, we present a series of testsc
that demonstrate the robustness of the results across different econometricspecifications.
5. Preliminary data analysis
We consider patterns of specialization across 20 manufacturing industries inseven OECD countries during 1970–90. Industry-level data on current pricevalue-added are taken from the OECD’s Structural Analysis Industrial (STAN)
16For further discussion of these indices and the circumstances under which they yield transitiverankings of transition probability matrices, see Shorrocks (1978), Geweke et al. (1986), and Quah(1996c).

S. Redding / Journal of International Economics 58 (2002) 299–334 311
17database, while current price GDP data come from the Penn World Tables 5.6.Endowments of five factors of production are considered: durable goods capital,other capital, arable land, skilled labour, and unskilled labour. The data on bothcategories of capital goods are from the Penn World Tables 5.6, while the sourceof information on hectares of arable land is the United Nations Food andAgricultural Organization (FAO).
Skilled and unskilled labour are measured using the proportion of non-pro-duction and production workers in total manufacturing employment from theUnited Nations General Industrial Statistics Database (UNISD). Multiplying theseproportions by the economy’s total population, we obtain endowments of skilledand unskilled labour. The use of information on non-production/productionworkers to measure skills follows a large number of authors including Berman et
18al. (1998) and Feenstra and Hanson (1999). The UNISD data are collected in aconsistent way across countries by a single organization. A key advantage over theinformation on educational attainment in Barro and Lee (1993) is that the data areavailable annually. The country–industry effect will control for any time-invarianterrors of measurement in the factor endowments data. The choice of countriesreflects the availability of the UNISD data. Our sample includes Canada,Denmark, Finland, Japan, Sweden, the United Kingdom, and the United States; agroup of countries among which one would expect to observe substantialdifferences in both patterns of specialization and factor endowments.
Table 1 reports the percentage share of total manufacturing value-added in GDPand the share of each industry’s value-added in total manufacturing for all sevencountries in 1970 and 1990. Manufacturing’s share of GDP declines in allcountries during the sample period, although the rate of decline varies substantiallyacross countries: from a decline of 30.6% between 1970 and 1990 in the UnitedKingdom to 10.1% in Denmark. Table 1 also reveals marked changes in therelative importance of individual sectors within manufacturing. Some sectorsaccount for a declining share of manufacturing value-added in all countries (e.g.Textiles and Ferrous metals), while others constitute a rising share of manufactur-ing value-added in all countries (e.g. Drugs and Radio/TV). Again, the rate ofdecline or increase varies noticeably across countries: for example, in Radio/TV,the rate of increase varies from 19.8% between 1970 and 1990 in the UnitedKingdom to 62.5% in Japan and 297.6% in Finland. There are also examples ofsectors which account for rising shares of manufacturing value-added in somecountries and declining shares in others: for example, the share of the Computingsector displays a rapid increase in all countries except Canada and Sweden whereit declines by 37.3% and 52.8%, respectively, between 1970 and 1990.
17See Appendix A for further details concerning the data used and an industrial classification.18There is a high time-series correlation between these occupation-based measures of skills and those
based on educational attainment: see, for example, Machin and Van Reenen (1998). See Nickell andBell (1996) for further discussion of educational attainment-based measures of skills.

312 S. Redding / Journal of International Economics 58 (2002) 299–334
Table 1Share of manufacturing in GDP and share of industries in total manufacturing in 1970 and 1990 (%)
Industry Year Can Den Fin Jap Swe UK USA
Food 1970 14.86 20.96 13.26 10.57 8.13 13.32 12.331990 14.55 20.54 11.76 10.16 10.18 13.36 10.72
Textiles 1970 8.35 8.89 9.94 7.26 6.17 10.32 7.931990 5.43 4.64 3.87 4.65 2.16 6.24 4.99
Wood 1970 5.78 5.96 9.94 3.55 8.12 2.63 4.341990 6.47 5.60 8.81 2.71 7.66 3.05 4.58
Paper 1970 13.98 11.40 22.46 5.84 14.91 8.45 9.121990 15.81 10.88 20.89 7.39 15.20 11.07 11.56
Chemicals 1970 4.99 4.82 5.08 7.85 4.40 8.07 6.931990 6.31 5.20 5.87 5.60 4.73 8.28 8.62
Drugs 1970 1.02 1.08 0.55 2.08 0.81 1.52 1.371990 1.97 3.68 0.94 2.29 2.12 3.14 2.82
Petroleum 1970 1.34 1.26 2.13 1.22 1.18 1.14 1.471990 1.43 1.19 2.60 0.59 2.50 2.03 2.01
Rubber 1970 2.59 2.76 2.29 3.03 2.71 2.90 2.271990 3.23 3.46 1.83 3.92 2.43 4.42 3.74
Minerals 1970 3.54 7.45 4.22 4.21 3.99 3.51 3.231990 3.19 4.43 4.86 3.61 3.18 3.72 2.41
Ferrous 1970 5.17 1.27 3.19 9.05 7.26 6.31 5.301990 2.98 0.96 3.07 5.84 3.20 3.18 2.67
Non-ferrous 1970 3.80 0.54 1.27 2.26 2.19 1.68 2.061990 3.07 0.32 1.31 1.97 1.45 1.09 1.47
Metals 1970 6.70 7.22 4.51 5.99 9.69 6.57 7.311990 5.54 8.72 6.71 5.90 10.39 5.84 6.73
Office equip. 1970 1.53 0.49 0.13 1.18 1.23 0.79 1.301990 0.96 0.73 1.49 3.26 0.58 2.22 1.87
Non-electrical 1970 6.76 10.70 10.03 9.52 11.63 10.38 10.281990 6.47 14.08 11.30 9.86 13.11 9.48 9.26
Radio, TV 1970 2.63 1.93 0.84 5.57 2.89 3.68 2.671990 3.71 2.41 3.34 9.05 3.52 4.41 5.56
Electrical 1970 3.57 4.78 3.37 5.28 3.97 4.05 4.711990 2.92 3.23 3.65 6.94 3.24 4.28 3.64
Shipbuilding 1970 0.65 3.38 3.38 2.32 1.94 1.78 0.781990 0.52 3.25 2.40 0.60 0.95 1.00 0.67
Motor vehicles 1970 7.27 0.97 1.06 7.83 4.60 5.91 6.521990 9.34 1.18 1.94 8.64 8.19 5.74 4.47
Professional 1970 1.85 1.14 0.44 1.66 0.87 1.87 3.821990 1.66 2.66 1.31 1.82 2.44 1.42 5.06
Other 1970 1.00 1.58 0.94 3.06 0.61 1.08 1.661990 0.89 2.55 0.83 4.67 0.68 1.09 1.96
Total 1970 19.31 17.39 22.43 36.71 22.73 29.46 24.671990 14.71 15.63 19.38 28.51 18.58 20.45 18.87
Notes: see Appendix A for a list of industry names in full and International Standard IndustrialClassification (ISIC) Codes. Data sources: OECD STAN database and Penn World Tables 5.6.

S. Redding / Journal of International Economics 58 (2002) 299–334 313
Table 2 presents information on the evolution of factor endowments. Theeconometric specification presented above incorporates a country–industry effectand industry–time dummies. In the fixed effects estimation below, the endow-ments’ coefficients are identified from country-specific variation in factor endow-ments over time. Table 2 shows that paths of factor accumulation do indeed differsubstantially across countries during the sample period. For example, capitalaccumulation is particularly rapid in Japan. The evolution of numbers of non-production and production workers reflects both changes in skill composition andpopulation growth. Increases in the number of non-production workers are largestin Finland, Japan, and the United States. Numbers of production workers fell in
19most European countries, but rose in Canada and the United States.
6. Econometric estimation
Having informally examined changes in specialization and factor endowments,this section moves on to econometric estimation. We begin by estimating thestructural equation (3) from neoclassical trade theory linking the share of a sectorin a country’s GDP to underlying economic determinants. The model of dis-tribution dynamics introduced above is then used to analyze the actual evolution ofpatterns of specialization and their predicted evolution based on changing factorendowments and forces that are common across countries.
6.1. Estimating the neoclassical model
Appendix B presents the results of estimating Eq. (3) for each industry using apanel of data across countries and over time. Estimation is by within groups (fixedeffects), and therefore explicitly allows the country–industry effect,h , to becj
correlated with countries’ factor endowments. Factor endowments are found to bea statistically significant and quantitatively important determinant of patterns ofspecialization. Of the 100 coefficients on factor endowments, approximatelyone-half are statistically significant at the 10% level.
The pattern of estimated coefficients across industries accords with economicpriors. In the Paper and Wood industries, where factor endowments might beexpected to be particularly important for specialization, we find that four and threeof the estimated coefficients on the five endowments are statistically significant atthe 10% level. Endowments of non-production workers and durable capital have anegative and statistically significant effect on the Wood industry’s share of GDP,
19For changes in relative factor endowments to have an important effect on patterns of specialization,we require there to be differences in factor intensity across sectors. The working paper version of thispaper (Redding, 1999b) provided evidence of substantial differences in factor intensity at the level oftwo and three-digit manufacturing industries.

314S.
Redding
/Journal
ofInternational
Econom
ics58 (2002) 299–334
Table 2Factor endowments
Endowment Year Can Den Fin Jap Swe UK US
Non-production 1970 6158 1213 913 43 236 2162 14 414 53 5341990 6755 1634 1519 65 880 2626 18 861 77 790D1990–70 9.70% 34.78% 66.39% 52.37% 21.47% 30.86% 45.31%
Production 1970 15 166 3716 3693 61 109 5881 41 218 151 5181990 19 767 3507 3467 57 657 5933 38 550 172 582D1990–70 30.34% 25.64% 26.12% 25.65% 0.88% 26.47% 13.90%
Durable 1970 28 849 11 959 12 389 170 549 19 169 145 042 580 639capital 1990 115 521 26 844 29 560 810 732 65 246 285 313 1 471 855
D1990–70 300.43% 124.46% 138.61% 375.36% 240.38% 96.71% 153.49%
Other 1970 171 493 34 038 36 004 454 174 59 071 155 875 1 449 569capital 1990 450 760 68 012 87 741 2 043 958 110 147 315 346 2 794 390
D1990–70 162.84% 99.81% 143.70% 350.04% 86.46% 102.31% 92.77%
Arable 1970 43 610 2661 2667 4910 3053 7116 188 7351990 45 820 2561 2544 4121 2845 6607 185 742D1990–70 5.07% 23.76% 24.61% 216.07% 26.81% 27.15% 21.59%
Notes: number of non-production and production workers in thousands; durable and other capital in thousands of 1985 dollars; arable land area in thousands ofhectares.D1990–70 is the percentage growth in the endowment over the 21-year sample period. Data Sources: Penn World Tables 5.6, United Nations GeneralIndustrial Statistics Database (UNISD), and United Nations FAO.

S. Redding / Journal of International Economics 58 (2002) 299–334 315
while the effect of endowments of other capital is positive and statisticallysignificant. The two industries where factor endowments are least successful inexplaining specialization patterns are Non-metallic Minerals and Shipbuilding. Thefirst most likely reflects the omission of information on endowments of naturalresources (some of which will be captured in the fixed effect), while it is plausiblethat the second is explained by the extensiveness of government intervention in theShipbuilding industry.
In Fig. 1, we display the estimated industry–year effects. These are normalizedso that the 1970 value for each industry is 100, and correspond to the averagetime-path in the share of that industry in GDP across all seven countries. Thefigure demonstrates the role of the industry–year effects in generating systematicchanges in patterns of specialization. There is a secular rise over time in the shareof one group of industries in GDP (e.g. Chemicals and Drugs) and a seculardecline in the share of a second group (e.g. Food and Textiles). The implied shareof a third group of industries (e.g. Electrical and Rubber) remains broadly constant.
6.2. Specialization dynamics
Estimation of the model of distribution dynamics enables an analysis ofintra-distribution dynamics, the evolution of the external shape of the distributionof GDP shares, and their economic determinants. We begin with the evolution ofactual shares of sectors in GDP,s . Eq. (8) is estimated by dividing the space ofcjt
possible values fors into five discrete grid cells and estimating transition20probabilities over 5-year periods. The boundaries between grid cells are chosen
such that industry–year observations are divided roughly equally between thecells, and each cell corresponds to approximately one quintile of the distribution ofGDP shares across industries and time.
Table 3 presents estimation results for the United States. Panel (A) of the tableis concerned with the evolution of actual shares of sectors in GDP, and itsinterpretation is as follows. The numbers in parentheses in the first column are thetotal number of industry–year observations in a particular grid cell over the sampleperiod, while the first row of numbers denotes the upper endpoint of thecorresponding grid cell. Thereafter, each row reports the estimated probability ofpassing from one state into another. For example, the second row of numberspresents (reading across from the second to the sixth column) the probability ofremaining in the lowest state and then the probability of moving into thelower-intermediate, intermediate, higher-intermediate, and highest state succes-sively. The final two rows of the upper panel of the table give the initial
20All estimation is undertaken using Danny Quah’s TSRF econometrics package, which can bedownloaded from http: / /econ.lse.ac.uk/staff /dquah/ tsrf.html. Responsibility for any results, opinionsand errors is the author’s alone.

316 S. Redding / Journal of International Economics 58 (2002) 299–334
Fig
.1.
Indu
stry
–ye
aref
fect
s,fix
edef
fect
ses
timat
ion,
1970
510
0.

S. Redding / Journal of International Economics 58 (2002) 299–334 317
Table 3Transition probabilities, United States, shares of GDP, 5-year transitions, 1971:76–1985:90
Upper endpoint (% GDP)
(A) Actual, scjt
Number (0.410) (0.690) (1.050) (1.660) (.1.660)(61) 0.79 0.21 0.00 0.00 0.00(59) 0.22 0.61 0.17 0.00 0.00(53) 0.02 0.17 0.74 0.08 0.00(63) 0.00 0.06 0.25 0.67 0.02(64) 0.00 0.00 0.00 0.20 0.80
Initial 0.250 0.150 0.100 0.200 0.300Ergodic 0.351 0.317 0.264 0.063 0.005
¯(B) Normalized, s / scjt ct
Number (0.407) (0.676) (1.047) (1.567) (.1.567)(61) 0.70 0.28 0.02 0.00 0.00(59) 0.19 0.64 0.17 0.00 0.00(61) 0.02 0.10 0.74 0.15 0.00(58) 0.00 0.05 0.10 0.74 0.10(61) 0.00 0.00 0.00 0.16 0.84
Initial 0.250 0.150 0.200 0.200 0.200Ergodic 0.154 0.222 0.245 0.233 0.147
P(C) Fitted, scjt
Number (0.410) (0.690) (1.050) (1.660) (.1.660)(60) 0.80 0.20 0.00 0.00 0.00(56) 0.21 0.68 0.11 0.00 0.00(58) 0.00 0.19 0.78 0.03 0.00(65) 0.00 0.00 0.26 0.71 0.03(61) 0.00 0.00 0.00 0.20 0.80
Initial 0.200 0.150 0.150 0.300 0.200Ergodic 0.394 0.367 0.208 0.027 0.004
E(D) Endowment, scjt
Number (0.410) (0.690) (1.050) (1.660) (.1.660)(50) 0.98 0.02 0.00 0.00 0.00(71) 0.14 0.86 0.00 0.00 0.00(55) 0.00 0.25 0.65 0.09 0.00(64) 0.00 0.00 0.31 0.69 0.00(60) 0.00 0.00 0.00 0.00 1.00
Initial 0.200 0.150 0.150 0.300 0.200Ergodic 0.000 0.000 0.000 0.000 1.000
I(E) Ind–year, scjt
Number (0.410) (0.690) (1.050) (1.660) (.1.660)(62) 0.90 0.10 0.00 0.00 0.00(53) 0.08 0.68 0.25 0.00 0.00(41) 0.00 0.17 0.71 0.12 0.00(59) 0.00 0.00 0.20 0.61 0.19(85) 0.00 0.00 0.00 0.11 0.89
Initial 0.200 0.150 0.150 0.300 0.200Ergodic 0.139 0.179 0.257 0.154 0.271
¯Notes:s ; (1 /n)o s . Initial is the distribution of industries across grid cells in 1970. Ergodic isct j cjt
the stationary distribution implied by the estimated transition probability matrix.

318 S. Redding / Journal of International Economics 58 (2002) 299–334
distribution of industries across grid cells in 1970 and the ergodic distributionimplied by the estimated transition probability matrix.
We find evidence of substantial mobility in patterns of specialization. In theUnited States, the estimated probability of moving out of a quintile of thedistribution after 5 years ranges from 0.39 to 0.20. Mobility is smallest at theextremes of the distribution of GDP shares—in the lower and upper quintiles—andgreatest in the centre. A comparison of the initial and ergodic distributionsprovides evidence of the general decline in the size of manufacturing industriesduring the sample period. The ergodic distribution reveals evidence of a polariza-tion of GDP shares towards the bottom three quintiles of the distribution.
The estimated transition probabilities in Panel (A) of Table 3 capture twoeffects. First, the general decline in the size of manufacturing will tend to inducethe average industry to move from a higher to a lower grid cell. Second, individualmanufacturing industries will move between grid cells because they experiencedifferent rates of growth and decline, resulting in changes in theirrelative positionwithin the distribution of GDP shares. The theoretical model of Section 3 impliesthat both phenomena are of interest and should be included in the empiricalanalysis. Manufacturing’s decline is one of the features about the evolution ofpatterns of specialization that the model seeks to explain. For example, thecontribution of changes in world relative prices (associated with the developmentof manufacturing centres in East Asia and elsewhere) and of pervasive technologi-cal change will be captured in the estimated industry–year dummies. Moreover, anumber of manufacturing industries experience increases in their share of acountry’s GDP during the sample period. This is reflected in the upward trend overtime in the industry–year effects for a number of sectors in Fig. 1.
Nonetheless, in order to demonstrate that the finding of mobility is not driven bythe decline in the average size of manufacturing sectors and that changes in therelative size of individual industries are important, we undertake the followingrobustness test. At each point in time, the share of a manufacturing industry in acountry’s GDP, s , is normalized by the average share of all manufacturingcjt
¯industries,s 5 (1 /n)o s . Transition probabilities are then re-estimated usingct j cjt
˜ ¯the normalized variable,s ; s /s . The normalization removes any country-cjt cjt ct
specific decline in the average GDP share of manufacturing industries, and meansthat the analysis now captures specializationwithin manufacturing. The cross-
˜section mean ofs is 1 at each period in time, and a value greater than 1 denotescjt
an industry with an above average share of a country’s GDP.Panel (B) of Table 3 reports estimation results for the United States, where the
mean value ofs across industries in 1970 was 1.177. Boundaries between gridcjt
cells are again chosen such that industry–year observations are distributed roughlyequally across cells, and we are therefore again concerned with movementsbetween quintiles of the distribution. The estimated transition probabilities nowonly capture changes in therelative position of industries within the distribution ofGDP shares. Again, we find evidence of mobility in patterns of specialization. The

S. Redding / Journal of International Economics 58 (2002) 299–334 319
estimated probability of moving out of one quintile of the distribution in theUnited States varies from 0.36 to 0.16. We find no evidence of increasedspecialization within the manufacturing sector. The greater mass of the ergodicdistribution is concentrated in the middle three quintiles, and there is actually adecrease in mass in the upper and lower quintiles relative to the initial distributionin 1970.
6.3. Economic determinants of specialization dynamics
Having shown that changes in therelative size of individual manufacturingindustries are driving the empirical findings of mobility, we now consider theeconomic determinants for observed changes in patterns of specialization. Wereturn to the use of un-normalized GDP shares as implied by theory. Panels
P(C)–(E) of Table 3 present results for fitted values of shares of GDP (s , from Eq.cjt
(4)), predicted values holding industry–year effects constant at their beginning ofEsample values (the endowment predictions,s ), and predicted values holdingcjt
factor endowments constant at their beginning of sample values (the industry–yearIpredictions,s ). In each case, exactly the same boundaries between grid cells arecjt
used as for actual GDP shares. The estimated transition probabilities therefore tellus to what extent the model or the relevant component of the model can explainobserved movements of industries between quintiles of the distribution of actualGDP shares. By construction, the three sets of predicted values are equal at thebeginning of the sample period, and the initial distribution of industries across gridcells is therefore the same in panels (C)–(E).
Comparing Panel (C) with the results for actual shares of GDP in Panel (A), theestimated values of transition probabilities generally lie close together, implyingthat the model is reasonably successful at explaining observed mobility in patternsof specialization. Over 5 years with the fitted values, the estimated probability ofmoving out of one quintile of the distribution of GDP shares ranges from 0.32 to0.20. Estimated values for the diagonal elements of the transition probabilitymatrix are higher in the middle three quintiles of the distribution when using fitted,
Ps , rather than actual,s , values. This suggests a potential role for othercjt cjt
considerations in explaining mobility in the centre of the distribution, includingcountry-specific changes in technology or relative prices that are uncorrelated withfactor endowments. This is consistent with the theoretical model presented earlier.
The predicted movements of industries within the distribution of GDP sharesusing the fitted values are the result of a combination of both changes inendowments and industry–year effects. The lower two panels of Table 3 present
Eestimation results using endowment predictions,s , and industry–year predic-cjtItions,s . In principle, these may individually display either more or less mobilitycjt
than when using the fitted values. If the changes in a country’s pattern ofspecialization induced by factor endowments tend to reinforce those brought aboutby industry–year effects, predicted movements of industries within the GDP

320 S. Redding / Journal of International Economics 58 (2002) 299–334
shares distribution will be smaller when considering one of these sets of influencesthan when considering both together. In contrast, if the changes in specializationinduced by factor endowments tend to offset those brought about by industry–yeareffects, examining factor endowments (or industry–year effects) individually willpredict larger movements of industries within the GDP shares distribution.
In the case of the United States, less mobility in patterns of specialization isobserved with the endowment or industry–year predictions individually than withfitted or actual values of GDP shares. The estimated values of transitionprobabilities along the diagonal are generally larger in the bottom two panels ofthe table. This is particularly true for the endowment predictions which display theleast mobility. Therefore, over a 5-year time horizon, considerations that arecommon across countries are quantitatively more important in explaining changesin US patterns of specialization than country-specific changes in factor endow-ments.
The pattern of mobility with the endowment predictions is also of interest.These are characterized by extreme immobility in the lower and upper quintiles ofthe GDP shares distribution, combined with a level of mobility in the centre of thedistribution not dissimilar (and in fact higher in the third quintile) than found withthe industry–year predictions, fitted values, and actual shares of GDP. During thesample period, factor endowments were responsible for a polarization in patternsof specialization in the United States, reinforcing specialization in sectors whichinitially had high shares of GDP, preserving low shares of GDP in sectors thatwere initially small, and reducing the number of sectors with intermediate valuesfor shares of GDP.
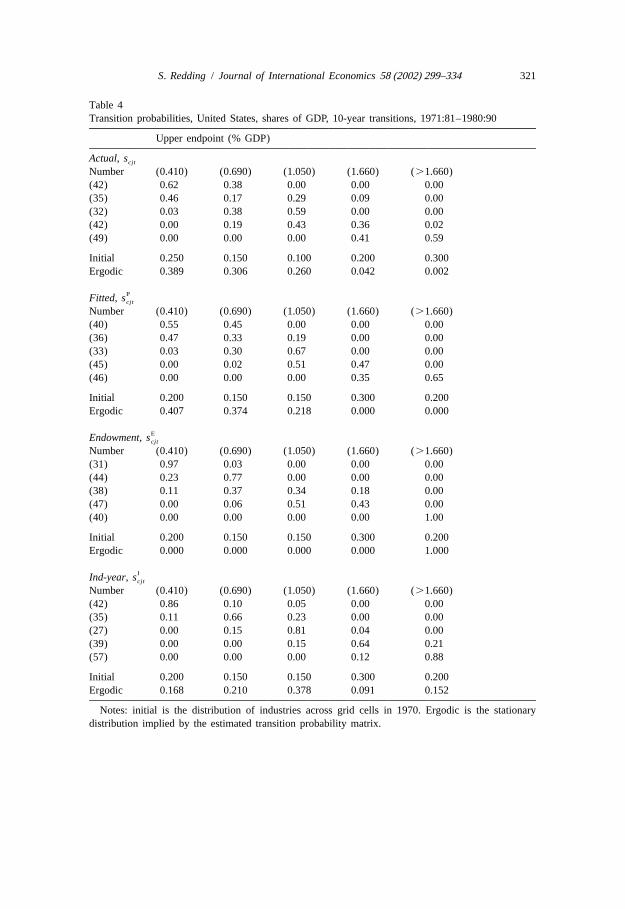
In Table 4, we examine how these results are affected by allowing transitions tooccur over a longer time horizon of 10 years. Exactly the same boundariesbetween grid cells as before are used. Over longer time horizons, more mobility inpatterns of specialization is observed. In the United States, the estimatedprobability of moving out of a quintile of the distribution after 10 years rangesfrom 0.83 to 0.38. Mobility remains greatest in the centre of the distribution andsmallest at the extremes. The relative contribution of factor endowments tochanges in patterns of specialization is now greater: the average value of thediagonal elements of the estimated transition probability matrix with the endow-ments predictions is lower than with the industry–year predictions. A similarpattern of mobility is also observed. The endowment predictions exhibit extremeimmobility in the lower and upper quintiles of the GDP shares distribution,combined with much greater mobility in the centre of the distribution.
These results are consistent with the idea that changes in relative factorabundance occur gradually and take time to manifest themselves in substantialchanges in patterns of specialization. They also confirm the role of US factorendowments in reinforcing specialization in sectors which began with high sharesof GDP and acting against specialization in sectors which began with low sharesof GDP.
S. Redding / Journal of International Economics 58 (2002) 299–334 321
Table 4Transition probabilities, United States, shares of GDP, 10-year transitions, 1971:81–1980:90
Upper endpoint (% GDP)
Actual, scjt
Number (0.410) (0.690) (1.050) (1.660) (.1.660)(42) 0.62 0.38 0.00 0.00 0.00(35) 0.46 0.17 0.29 0.09 0.00(32) 0.03 0.38 0.59 0.00 0.00(42) 0.00 0.19 0.43 0.36 0.02(49) 0.00 0.00 0.00 0.41 0.59
Initial 0.250 0.150 0.100 0.200 0.300Ergodic 0.389 0.306 0.260 0.042 0.002
PFitted, scjt
Number (0.410) (0.690) (1.050) (1.660) (.1.660)(40) 0.55 0.45 0.00 0.00 0.00(36) 0.47 0.33 0.19 0.00 0.00(33) 0.03 0.30 0.67 0.00 0.00(45) 0.00 0.02 0.51 0.47 0.00(46) 0.00 0.00 0.00 0.35 0.65
Initial 0.200 0.150 0.150 0.300 0.200Ergodic 0.407 0.374 0.218 0.000 0.000
EEndowment, scjt
Number (0.410) (0.690) (1.050) (1.660) (.1.660)(31) 0.97 0.03 0.00 0.00 0.00(44) 0.23 0.77 0.00 0.00 0.00(38) 0.11 0.37 0.34 0.18 0.00(47) 0.00 0.06 0.51 0.43 0.00(40) 0.00 0.00 0.00 0.00 1.00
Initial 0.200 0.150 0.150 0.300 0.200Ergodic 0.000 0.000 0.000 0.000 1.000
IInd-year, scjt
Number (0.410) (0.690) (1.050) (1.660) (.1.660)(42) 0.86 0.10 0.05 0.00 0.00(35) 0.11 0.66 0.23 0.00 0.00(27) 0.00 0.15 0.81 0.04 0.00(39) 0.00 0.00 0.15 0.64 0.21(57) 0.00 0.00 0.00 0.12 0.88
Initial 0.200 0.150 0.150 0.300 0.200Ergodic 0.168 0.210 0.378 0.091 0.152
Notes: initial is the distribution of industries across grid cells in 1970. Ergodic is the stationarydistribution implied by the estimated transition probability matrix.

322 S. Redding / Journal of International Economics 58 (2002) 299–334
6.4. Indices of mobility
Table 5 uses formal indices of mobility to evaluate the overall degree ofmobility in patterns of specialization. Results are reported for the United States
21and the other six countries in the sample. When estimating transition prob-abilities for the other countries, boundaries between grid cells are again chosensuch that industry–year observations are allocated roughly equally across the cells.We are therefore always concerned with movements of industries betweenquintiles of the GDP shares distribution. For a given country, the same gridboundaries are used for actual shares of GDP, fitted shares of GDP, endowmentpredictions, and industry–year predictions. The estimated transition probabilitiesagain capture the ability of the model or the relevant component of the model toexplain observed movements of industries between quintiles of the distribution ofactual GDP shares. Mobility indices are evaluated based on the results for actualshares of GDP, fitted shares of GDP, endowment predictions, and industry–yearpredictions.
Table 5 also reports the ratio of the mobility indices for the endowment andindustry–year predictions. This provides a measure of the relative importance ofthese two sets of considerations in explaining changes in patterns of specialization.Levels of mobility vary across the seven countries. With 5-year transitions, Japanand Sweden exhibit the highest levels; Canada, the United Kingdom, and UnitedStates have intermediate levels; Denmark and Finland display the least. A similarpattern is observed with 10-year transitions. Mobility remains high in Japan and islow in Denmark and Finland. Over the longer time horizon, the United Kingdomand United States display higher levels of mobility relative to the other countriesin the sample.
We saw above that the model was reasonably successful at explaining changesin US patterns of specialization. This is confirmed for the other countries in Table5, where levels of mobility using the fitted values for shares of GDP are typicallyclose to those using the actual values. The conclusions concerning the relativeimportance of factor endowments and industry–year effects in the United Statesare also confirmed using the formal indices of mobility. A similar pattern of resultsis found for the other six countries. Over 5-year periods, common cross-countryeffects are more important in explaining observed changes in patterns ofspecialization than factor endowments for the majority of countries. Over 10-yearperiods, factor endowments become relatively more important in each country inthe sample. Over the longer time horizon, factor endowments account for most ofthe observed mobility in specialization patterns in all countries except Canada andSweden.
The two countries where the relative contribution of factor endowments to
21In the interests of brevity, full estimation results for the other countries are not reported. These arecontained in an appendix available from the author on request.

S. Redding / Journal of International Economics 58 (2002) 299–334 323
Table 5Mobility indices by country
Country Variable 5-year 10-year1 2 1 2M M M Mc c c c
Canada Actual,s 0.345 0.856 0.463 0.950cjtPFitted, s 0.360 0.873 0.510 0.990cjt
EEndowment,s 0.253 0.719 0.463 0.941cjtIInd–year,s 0.338 0.874 0.465 1.000cjt
E/I ratio 75% 82% 100% 94%
Denmark Actual,s 0.273 0.748 0.388 0.891cjtPFitted, s 0.285 0.768 0.418 0.898cjt
EEndowment,s 0.213 0.645 0.365 0.900cjtIInd–year,s 0.285 0.824 0.318 0.862cjt
E/I ratio 75% 78% 115% 104%
Finland Actual,s 0.288 0.764 0.343 0.821cjtPFitted, s 0.288 0.780 0.453 0.948cjt
EEndowment,s 0.348 0.866 0.515 0.980cjtIInd–year,s 0.200 0.603 0.333 0.819cjt
E/I ratio 174% 144% 155% 120%
Japan Actual,s 0.420 0.934 0.618 1.003cjtPFitted, s 0.245 0.684 0.515 0.967cjt
EEndowment,s 0.303 0.780 0.515 0.962cjtIInd–year,s 0.213 0.639 0.293 0.784cjt
E/I ratio 142% 122% 176% 123%
Sweden Actual,s 0.440 0.939 0.498 0.965cjtPFitted, s 0.310 0.802 0.513 0.971cjt
EEndowment,s 0.200 0.600 0.325 0.809cjtIInd–year,s 0.303 0.788 0.393 0.888cjt
E/I ratio 66% 76% 83% 91%
United Kingdom Actual,s 0.345 0.841 0.563 1.004cjtPFitted, s 0.263 0.745 0.440 0.945cjt
EEndowment,s 0.175 0.550 0.290 0.769cjtIInd–year,s 0.233 0.685 0.245 0.704cjt
E/I ratio 75% 80% 118% 109%
United States Actual,s 0.348 0.847 0.668 1.020cjtPFitted, s 0.308 0.792 0.583 1.015cjt
EEndowment,s 0.205 0.647 0.373 0.960cjtIInd–year,s 0.303 0.809 0.288 0.776cjt
E/I ratio 68% 80% 130% 124%1 2* *Notes: M 5 (K 2 tr[P ]) /(K 2 1), M 5 12 udet(P )u; see main text for further discussion of thec c c c
mobility indices. E/ I ratio is the ratio of the mobility indices for the endowment and industry–yearpredictions expressed as a percentage.

324 S. Redding / Journal of International Economics 58 (2002) 299–334
changes in specialization is greatest are Japan and Finland. Even over 5-yearperiods, factor endowments explain most of the observed mobility in thesecountries’ patterns of specialization. These findings are consistent with thepreliminary data analysis in Table 2. Japan displays the highest rates ofaccumulation of durable capital and other capital, and exhibits the second highestrate of accumulation of non-production workers. Similarly, Finland has the highestrate of increase of non-production workers and the second highest rate of decreasein production workers.
6.5. Statistical significance
Table 6 examines the statistical significance of the differences between thetransition probability matrices estimated using actual shares of GDP, fitted sharesof GDP, endowment predictions, and industry–year predictions. In each case, thenull hypothesis is that the Data Generation Process (DGP) equals the matrix oftransition probabilities estimated using actual GDP shares. We test whether thematrices estimated using the fitted values, endowment predictions, and industry–year predictions are statistically significantly different from this null. In the
Table 6Statistical significance, 5-year transitions
P E ICountry Fitted,s Endowment,s Ind–year,scjt cjt cjt
( p-value) (p-value) (p-value)
Canada 0.923 0.010 0.000(Accept) (Reject) (Reject)
Denmark 0.471 0.174 0.008(Accept) (Accept) (Reject)
Finland 0.044 0.001 0.510(Reject) (Reject) (Accept)
Japan 0.000 0.006 0.000(Reject) (Reject) (Reject)
Sweden 0.491 0.000 0.000(Accept) (Reject) (Reject)
United Kingdom 0.785 0.023 0.000(Accept) (Reject) (Reject)
United States 0.999 0.000 0.000(Accept) (Reject) (Reject)
Notes: null hypothesis is that the Data Generation Process (DGP) equals the matrix of transitionprobabilities estimated using actual GDP shares. We test whether the matrices estimated using the fittedvalues, endowment predictions, and industry–year predictions are statistically significantly different
2from this null. Test statistic is distributedx (20); reported rejections are at the 5% level.

S. Redding / Journal of International Economics 58 (2002) 299–334 325
interests of brevity, the analysis is restricted to the transition probability matricesestimated over 5-year periods.
Column (2) reports the results using fitted shares of GDP, where we are unableto reject the null hypothesis at the 5% level for a majority of countries. Thisprovides further evidence of the model’s ability to explain observed mobility inpatterns of specialization. The exceptions are Finland and Japan, although only theJapanese matrix is statistically significantly different from the null at the 1% level.Thus, while factor endowments are important in accounting for changes inspecialization in Japan, there remains a potential role for country-specific changesin technology and relative prices. Columns (3) and (4) present the results usingendowment and industry–year predictions respectively. The null hypothesis isrejected at the 5% level in all countries, except for the endowments predictions inDenmark and the industry–year predictions in Finland. In almost all cases, thedistinctive predictions of factor endowments for patterns of specialization notedabove are statistically significantly different from the null that the DGP is given byactual specialization dynamics.
6.6. External shape
Table 7 examines the evolution of the external shape of the distribution of GDPshares in the other countries. For each country, we report the initial distribution ofindustries across grid cells and the ergodic distribution implied by the transitionprobability matrix estimated using actual shares of GDP and with 5-yeartransitions.
In Canada, Japan, Sweden, and the United Kingdom, the decline in the size ofmanufacturing is reflected in the polarization of the ergodic distribution towardsthe bottom two quintiles. In Finland and Denmark, the ergodic distribution showsan increase in the number of industries located at intermediate values for shares ofGDP relative to the initial distribution, providing evidence of a decrease in theoverall degree of specialization in these countries. If actual shares of GDP arenormalized by their mean across industries, we find no evidence of an increase inspecialization within manufacturing for any of the countries in the dataset. InFinland and Denmark, there is again an increase in the number of industrieslocated at intermediate values.
6.7. Robustness of results
22Finally, we undertake a series of econometric robustness tests. Our results arerobust to each of these tests. First, the space of values for shares of GDP wasdivided into four grid cells rather than five and transition probability matrices were
22Further details of the robustness tests are contained in an appendix available from the author onrequest.

326 S. Redding / Journal of International Economics 58 (2002) 299–334
Table 7Evolution of the external shape of the distribution of actual shares of GDP,s , 5-year transitionscjt
Cell 1 Cell 2 Cell 3 Cell 4 Cell 5
CanadaInitial 0.150 0.200 0.200 0.150 0.300Ergodic 0.302 0.388 0.215 0.077 0.017
DenmarkInitial 0.250 0.200 0.100 0.150 0.300Ergodic 0.125 0.112 0.440 0.216 0.108
FinlandInitial 0.300 0.100 0.200 0.150 0.250Ergodic 0.179 0.295 0.308 0.183 0.037
JapanInitial 0.150 0.250 0.100 0.200 0.300Ergodic 0.431 0.322 0.138 0.076 0.033
SwedenInitial 0.250 0.100 0.200 0.200 0.250Ergodic 0.314 0.415 0.151 0.063 0.056
United KingdomInitial 0.150 0.250 0.150 0.200 0.250Ergodic 0.596 0.294 0.077 0.027 0.006
United StatesInitial 0.250 0.150 0.100 0.200 0.300Ergodic 0.351 0.317 0.264 0.063 0.005
Notes: initial is the distribution of industries across grid cells in 1970 and ergodic is the stationarydistribution implied by the transition probability matrices estimated for actual shares of GDP,s .cjt
re-estimated over 5-year and 10-year time periods. We again find evidence ofsubstantial mobility in patterns of specialization. Transition probabilities estimatedusing the fitted values for shares of GDP are close to those estimated using theactual values. The relative importance of factor endowments in explaining changesin patterns of specialization is greater over longer time horizons, and there is noevidence of an increase in countries’ overall degree of specialization over time.
Second, we return to the case of five grid cells and examine the robustness ofthe results to estimating transition probabilities over 3-year and 8-year timeperiods rather than over periods of 5 and 10 years. Again, a very similar pattern ofresults is observed with factor endowments becoming more important as explana-tions for mobility over longer time horizons. Third, we examine the stability of theestimated transition probability matrices over time. Transition probabilities arere-estimated excluding the last 5 years of the sample period and compared withthose estimated for the full sample (this ensures a minimum of over 30observations in each grid cell). We test the null hypothesis that the transitionprobabilities estimated for the full sample are the result of a Data Generation

S. Redding / Journal of International Economics 58 (2002) 299–334 327
Process (DGP) given by the matrix estimated excluding the last 5 years. For eachof the countries in the sample, we are unable to reject the null hypothesis atconventional levels of statistical significance.
Fourth, we examine the sensitivity of the results to the inclusion of individualindustries. Each industry was sequentially excluded from the sample and transitionprobability matrices were re-estimated. There is little variation in the estimatedtransition probabilities across the 20 sets of estimation results. The sample mean ofeach element of the transition probability matrix lies close to the value estimatedfor the full sample above. The sample standard deviation of each element of thematrix across the 20 sets of estimation results is an order of magnitude smallerthan the estimated transition probabilities.
7. Conclusions
Much of the existing empirical trade literature is concerned with the staticpredictions of international trade theory for cross-section patterns of specializationat a point in time. This contrasts with the theoretical literature on trade and growth,which emphasizes that comparative advantage is dynamic and evolves endoge-nously over time. This paper proposes an empirical framework for analyzing thedynamics of specialization; the framework is implemented using disaggregateddata on 20 manufacturing industries in seven OECD countries during 1970–90.
The analysis begins with a measure of a country’s extent of specialization in anindustry derived directly from neoclassical trade theory: the share of the industryin that country’s GDP. A country’s pattern of specialization at a point in time ischaracterized by the distribution of this measure across industries, while thedynamics of specialization correspond to the evolution of this entire distributionover time. We employ a model of distribution dynamics from the cross-countrygrowth literature that is explicitly suited to an analysis of the evolution of entiredistributions. Transition probability matrices are estimated for each of the sevencountries in our sample: Canada, Denmark, Finland, Japan, Sweden, UnitedKingdom, and United States. There is evidence of substantial mobility in patternsof specialization, with Japan typically displaying the highest levels of mobility,and Denmark and Finland displaying the least.
Over 5-year time periods, considerations which are common across countries,including changes in prices on world markets and common changes in technicalefficiency, explain most of the observed mobility in patterns of specialization forthe majority of countries. A notable exception is Japan. Even over 5-year timeperiods, the substantial changes in Japan’s pattern of specialization are largelyexplained by the rapid accumulation of physical and human capital. Over longertime horizons of 10 years, common cross-country effects remain substantial butcountry-specific changes in factor endowments become relatively more important.In the literature on international trade and wage inequality, there is considerable

328 S. Redding / Journal of International Economics 58 (2002) 299–334
debate concerning the speed at which ‘‘the Heckscher–Ohlin clock ticks.’’ Thisfinding suggests that it takes a number of years for gradual changes in relativefactor abundance to manifest themselves in substantial changes in patterns ofspecialization.
We find no evidence of an increase in the extent to which countries’ productionis concentrated in a few industries. Indeed, in Finland and Denmark, there is anincrease in the number of industries located at intermediate values for shares ofGDP, suggesting a decrease in specialization in these countries. The results wereshown to be robust to the number of grid cells chosen, the exact length of thetransition periods considered, and to the exclusion of individual industries. We findno evidence of a statistically significant change in the estimated transitionprobability matrices over time.
Taken together, our results show how statistical models of distribution dynamicsmay be used to shed light on a variety of issues relating to specializationdynamics, bringing empirical work closer to the focus on dynamic comparativeadvantage evident in theoretical research on trade and growth.
Acknowledgements
This paper was produced as part of the Globalisation Programme of the ESRCfunded Centre for Economic Performance, London School of Economics, and is arevised version of CEPR Discussion Paper 2287. I am especially grateful to JamesHarrigan, two anonymous referees, and Jonathan Temple for extremely helpfulcomments and suggestions. I am also grateful to Richard Baldwin, Simon Evenett,Rachel Griffith, Gordon Hanson, Wolfgang Keller, Peter Neary, Stephen Nickell,Victor Norman, Henry Overman, James Proudman, Danny Quah, Tony Venables,Alan Winters, participants in seminars at the London School of Economics, theCEPR European Research Workshop in International Trade (ERWIT), the Purdueconference on Empirical Investigations in International Trade (EIIT), the TilburgConference on Dynamics, Economic Growth, and International trade (DEGIT),and the World Bank for helpful comments. I would like to thank Sandra Bulli,Paco Requena-Silvente, Martin Stewart, and Mercedes Vera-Martin for researchassistance. I am grateful to John Van Reenen for supplying the production/non-production workers data. Any opinions, results, and errors are the responsibility ofthe author alone.
Appendix A. Data appendix
OECD Structural Analysis Industrial (STAN) database: data on current pricevalue-added (US dollars) for 20 manufacturing industries (International Standard

S. Redding / Journal of International Economics 58 (2002) 299–334 329
Industrial Classification (ISIC)), 1970–90.Penn World Tables 5.6: data on currentprice GDP per capita (US dollars), population (thousands), non-residential capitalstock (1985 US dollars), and Producer durables (% of non-residential capital stock,1985 US dollars), 1970–90.United Nations General Industrial Statistics Database(UNISD): data on the proportion of non-production and production workers intotal manufacturing, 1970–90. See Berman et al. (1998) and Machin and VanReenen (1998) for further discussion of the data.FAO Arable Land Data: data onhectares of arable land (thousands) from the United Nations Food and AgriculturalOrganization (FAOSTAT), 1970–90.Country Coverage: Canada, Denmark,Finland, Japan, Sweden, United Kingdom, and United States.Industrial Com-position (ISIC Code): 1, Food, Drink and Tobacco (3100); 2, Textiles, Footwearand Leather (3200); 3, Wood, Cork and Furniture (3300); 4, Paper, Print andPublishing (3400); 5, Chemicals excl. Drugs (3512); 6, Drugs and Medicines(3522); 7, Petroleum Refineries and Products (3534); 8, Rubber and PlasticProducts (3556); 9, Non-metallic Minerals (3600); 10, Ferrous Metals (3710); 11,Non-ferrous Metals (3720); 12, Metal Products (3810); 13, Office and ComputingEquipment (3825); 14, Non-electrical Machinery (3829); 15, Radio, TV andCommunication (3832); 16, Other Electrical Machinery (3839); 17, Shipbuildingand Repairing (3841); 18, Motor Vehicles (3843); 19, Professional Goods (3850);20, Other Manufacturing (3900).
Appendix B. Estimating the neoclassical model
Industry Industry Industry
1. Food 5. Chemicals 9. Mineralsnprod 20.244 nprod 20.371 nprod 20.130
(0.310) (0.537) (0.143)prod 2.008 prod 1.599 prod 0.024
(0.653) (0.921) (0.222)dkap 20.264 dkap 20.655 dkap 20.103
(0.173) (0.236) (0.088)okap 20.743 okap 20.677 okap 20.005
(0.210) (0.279) (0.104)arable 20.257 arable 20.570 arable 0.001
(1.057) (1.337) (0.371)2 2 2R 0.927 R 0.926 R 0.927

330 S. Redding / Journal of International Economics 58 (2002) 299–334
Industry Industry Industry
2. Textiles 6. Drugs 10. Ferrousnprod 20.265 nprod 21.596 nprod 20.039
(0.084) (0.420) (0.196)prod 20.664 prod 20.020 prod 1.538
(0.190) (0.814) (0.349)dkap 0.043 dkap 20.057 dkap 20.303
(0.055) (0.273) (0.115)okap 20.279 okap 20.100 okap 20.181
(0.067) (0.255) (0.138)arable 0.458 arable 21.421 arable 21.838
(0.313) (1.366) (0.623)2 2 2R 0.962 R 0.891 R 0.935
3. Wood 7. Petroleum 11. Non-Ferrousnprod 20.692 nprod 20.281 nprod 0.123
(0.161) (0.405) (0.153)prod 20.341 prod 1.677 prod 0.131
(0.303) (0.748) (0.252)dkap 20.199 dkap 20.183 dkap 20.230
(0.121) (0.245) (0.093)okap 0.320 okap 20.689 okap 0.587
(0.148) (0.245) (0.109)arable 20.462 arable 23.653 arable 20.511
(0.439) (1.241) (0.305)2 2 2R 0.964 R 0.806 R 0.922
4. Paper 8. Rubber 12. Metalsnprod 20.666 nprod 21.625 nprod 20.148
(0.383) (0.497) (0.076)prod 21.823 prod 20.411 prod 20.092
(0.789) (0.847) (0.208)dkap 1.223 dkap 0.456 dkap 0.121
(0.244) (0.325) (0.053)okap 20.763 okap 20.519 okap 0.061
(0.278) (0.368) (0.077)arable 21.833 arable 23.873 arable 20.805
(1.139) (1.617) (0.270)2 2 2R 0.940 R 0.948 R 0.987

S. Redding / Journal of International Economics 58 (2002) 299–334 331
Industry Industry
13. Office Equip. 17. Shipbuildingnprod 0.203 nprod 0.064
(0.400) (0.111)prod 3.506 prod 0.098
(0.849) (0.253)dkap 20.998 dkap 20.072
(0.310) (0.077)okap 0.336 okap 0.015
(0.269) (0.097)arable 24.441 arable 0.258
(1.529) (0.398)
2 2R 0.965 R 0.961
14. Non-electrical 18. Motor Vehiclesnprod 20.585 nprod 0.883
(0.199) (0.223)prod 20.142 prod 2.346
(0.492) (0.610)dkap 0.387 dkap 20.181
(0.141) (0.182)okap 20.689 okap 20.681
(0.115) (0.172)arable 21.333 arable 0.657
(0.928) (0.917)
2 2R 0.683 R 0.895
15. Radio, TV 19. Professionalnprod 0.174 nprod 20.194
(0.140) (0.322)prod 0.385 prod 1.417
(0.281) (0.619)dkap 0.276 dkap 0.675
(0.081) (0.204)okap 20.620 okap 20.993
(0.083) (0.196)arable 21.870 arable 21.307
(0.494) (0.946)
2 2R 0.942 R 0.943

332 S. Redding / Journal of International Economics 58 (2002) 299–334
Industry Industry
16. Electrical 20. Othernprod 1.022 nprod 20.609
(0.293) (0.300)prod 0.919 prod 20.016
(0.576) (0.641)dkap 20.185 dkap 20.302
(0.206) (0.213)okap 0.860 okap 20.031
(0.246) (0.195)arable 0.209 arable 1.594
(0.913) (1.105)2 2R 0.940 R 0.924
Notes: dependent variable is the percentage share of sector in GDP. Independentvariables are as follows: nprod is log number of non-production workers(thousands); prod is log number of production workers (thousands); dkap is logstock of durable capital (thousands of 1985 US dollars); okap is log stock of othercapital (thousands of 1985 US dollars); arable is log arable land (thousands ofhectares). See Appendix A for a list of industry names in full and InternationalStandard Industrial Classification (ISIC) codes. Sample size is 147 observationsper industry; time-period is 1970–90. Standard errors are Huber–White heteros-cedasticity robust. All industry regressions include a full set of year dummies andcountry fixed effects.
References
Acemoglu, D., 1998. Why do new technologies complement skills? Directed technical change and wageinequality. Quarterly Journal of Economics 113 (4), 1055–1089.
Amiti, M., 1999. Specialisation patterns in Europe. Weltwirtschaftliches Archiv 134 (4), 573–593.Anderson, T., Goodman, L., 1957. Statistical inference about Markov chains. Annual of Mathematical
Statistics 28, 89–110.Balassa, B., 1979. The changing pattern of comparative advantage in manufactured goods. Review of
Economics and Statistics 61 (2), 259–266.Barro, R., Lee, J., 1993. International comparisons of educational attainment. Journal of Monetary
Economics 32 (3), 363–394.Berman, E., Bound, J., Machin, S., 1998. Implications of skill-biased technological change: internation-
al evidence. Quarterly Journal of Economics November, 1245–1279.Bernstein, J., Weinstein, D., 1998. Do endowments predict the location of production? Evidence from
national and international data. NBER Working Paper 6815.Bowen, H., 1983. Changes in the international distribution of resources and their impact on US
comparative advantage. Review of Economics and Statistics 65, 402–414.
S. Redding / Journal of International Economics 58 (2002) 299–334 333
Bowen, H., Leamer, E., Sveikauskas, L., 1987. Multicountry, multifactor tests of the factor abundancetheory. American Economic Review 77, 791–809.
Brasili, A., Epifani, P., Helg, R., 1999. On the dynamics of trade patterns. Paper presented at TilburgConference on Dynamics, Growth and International Trade. University of Bocconi, mimeo.
Caves, D., Christensen, L., Diewert, E., 1982. The economic theory of index numbers and themeasurement of input, output, and productivity. Econometrica 50, 1393–1414.
Davis, D., Reeve, T., 1997. Human capital, unemployment, and relative wages in a global economy.NBER Working Paper 6133.
Davis, D., Weinstein, D., Bradford, S., Shimpo, K., 1997. Using international and Japanese regionaldata to determine when the factor abundance theory of trade works. American Economic Review 87(3), 421–446.
Deardorff, A., 1974. Factor proportions and comparative advantage in the long-run: comment. Journalof Political Economy 82 (4), 829–833.
Dixit, A., Norman, V., 1980. The Theory of International Trade. Cambridge University Press,Cambridge, UK.
Feenstra, R., Hanson, G., 1999. The impact of outsourcing and high-technology capital on wages:estimates for the United States, 1979–1990. Quarterly Journal of Economics August, 907–940.
Feenstra, R., Rose, A., 2000. Putting things in order: trade dynamics and product cycles. Review ofEconomics and Statistics 82 (3), 369–382.
Findlay, R., 1970. Factor proportions and comparative advantage in the long run. Journal of PoliticalEconomy 78 (1), 27–34.
Gandal, N., Hanson, G., Slaughter, M., 2000. Technology, trade, and adjustment to immigration inIsrael. NBER Working Paper 7962.
Geweke, J., Marshall, R., Zarkin, G., 1986. Mobility indices in continuous time Markov chains.Econometrica 54, 1407–1423.
Griffith, R., Redding, S., Van Reenen, J., 2000. Mapping the two faces of R&D: productivity growth ina panel of OECD manufacturing industries. CEPR Discussion Paper 2457.
Grossman, G., Helpman, E., 1991. Innovation and Growth in the Global Economy. MIT Press,Cambridge, MA.
Hanson, H., Slaughter, M., 1999. The Rybczynski Theorem, factor-price equalisation, and immigration:evidence from US states. NBER Working Paper 7074.
Harrigan, J., 1995. Factor endowments and the international location of production: econometricevidence for the OECD, 1970–85. Journal of International Economics 39, 123–141.
Harrigan, J., 1997. Technology, factor supplies, and international specialisation: estimating theneoclassical model. American Economic Review 87 (4), 475–494.
Harrigan, J., 1999. Estimation of cross-country differences in industry production functions. Journal ofInternational Economics 47 (2), 267–293.
Harrigan, J., Zakrajsek, E., 2000. Factor supplies and specialisation in the world economy. NBERWorking Paper 7848.
Hinloopen, J., van Marrewijk, C., 1998. On the empirical distribution of revealed comparativeadvantage 1: shape and time. Paper presented at the CEPR European Research Workshop inInternational Trade. Erasmus University, mimeo.
Kim, S., 1995. Expansion of markets and the geographic distribution of economic activities: the tendsin U.S. regional manufacturing structure, 1860–1987. Quarterly Journal of Economics 110 (4),881–908.
Kohli, U., 1991. Technology, Duality and Foreign Trade. University of Michigan Press, Ann Arbor.Krugman, P., 1987. The narrow moving band, the Dutch Disease and the competitive consequences of
Mrs Thatcher: notes on trade in the presence of scale economies. Journal of DevelopmentEconomics 27, 41–55.
Leamer, E., 1984. Sources of Comparative Advantage: Theories and Evidence. MIT Press.Leamer, E., 1998. In search of Stolper–Samuelson linkages between international trade and lower
wages. In: Collins, S. (Ed.), Imports, Exports, and the American Worker. Brookings InstitutionPress, Washington, DC, Chapter 4.

334 S. Redding / Journal of International Economics 58 (2002) 299–334
Lucas, R., 1988. On the mechanics of economic development. Journal of Monetary Economics 22,3–22.
Machin, S., Van Reenen, J., 1998. Technology and changes in skill structure: evidence from sevenOECD countries. Quarterly Journal of Economics November, 1215–1244.
Maskus, K., 1983. Evidence on shifts in the determinants of the structure of US manufacturing foreigntrade, 1958–76. Review of Economics and Statistics 65, 415–422.
Nickell, S., Bell, B., 1996. Changes in the distribution of wages and unemployment in OECD countries.American Economic Review 86 (2), 302–308.
Nickell, S., Redding, S., Swaffield, J., 2000. Educational attainment, labour market institutions, and thestructure of production. CEPR Discussion Paper, 3068.
Overman, H., Redding, S., Venables, A., 2001. The economic geography of trade, production, andincome: a survey of empirics. In: Harrigan, J. (Ed.), Handbook of International Trade. BasilBlackwell, Oxford, forthcoming.
Proudman, J., Redding, S., 1998. Persistence and mobility in international trade. In: Proudman, J.,Redding, S. (Eds.), Openness and Growth. Bank of England, London, Chapter 2.
Proudman, J., Redding, S., 2000. Evolving patterns of international trade. Review of InternationalEconomics 8 (3), 373–396.
Quah, D., 1993. Empirical cross-section dynamics in economic growth. European Economic Review37, 426–434.
Quah, D., 1996a. Twin peaks: growth and convergence in models of distribution dynamics. EconomicJournal 106, 1045–1055.
Quah, D., 1996b. Convergence empirics across economies with (some) capital mobility. Journal ofEconomic Growth 1, 95–124.
Quah, D., 1996c. Aggregate and regional disaggregate fluctuations. Empirical Economics 21, 137–159.Quah, D., 1997. Empirics for economic growth and distribution: polarization, stratification, and
convergence clubs. Journal of Economic Growth 2 (1), 27–59.Redding, S., 1999a. Dynamic comparative advantage and the welfare effects of trade. Oxford Economic
Papers 51, 15–39.Redding, S., 1999b. The dynamics of international specialization. CEPR Discussion Paper 2287.Shorrocks, A., 1978. The measurement of mobility. Econometrica 46, 1013–1024.Stern, R., Maskus, K., 1981. Determinants of US foreign trade, 1958–76. Journal of International
Economics 11 (2), 207–224.Stolpe, M., 1994. Technology and empirical dynamics of specialization in open economies. Kiel
Working Paper 637. Kiel Institute of World Economics, Germany.Trefler, D., 1995. The case of the missing trade and other mysteries. American Economic Review 85
(5), 1029–1046.


![INDIAN INSTITUTE OF TECHNOLOGY BOMBAY Aerospace Engineering (AE) [Department of Aerospace Engineering] Specialization : Aerodynamics (AE1) Dynamics and Control (AE2) ...](https://static.fdocuments.us/doc/165x107/5afd3acb7f8b9a944d8d24af/indian-institute-of-technology-bombay-aerospace-engineering-ae-department-of.jpg)


