
SPECIAL POLICY TOPIC · Laura Malaguzzi Valeri * T he aim of this survey is to describe how...
27
SPECIAL ARTICLES Comparison of Electricity Deregulation Around the World and Implications for Ireland by Laura Malaguzzi Valeri Does it Pay to Go Public? Public-Private Wage Differences among Recent Graduates in Ireland by Philip J. O’Connell and Helen Russell Labour Market Adjustment in the Irish Regions, 1988-2005 by Brendan M. Walsh
Transcript of SPECIAL POLICY TOPIC · Laura Malaguzzi Valeri * T he aim of this survey is to describe how...

SPECIAL ARTICLES
Comparison of Electricity Deregulation Around the World and Implications for Ireland
by
Laura Malaguzzi Valeri
Does it Pay to Go Public? Public-Private Wage Differences among Recent Graduates in
Ireland
by
Philip J. O’Connell and Helen Russell
Labour Market Adjustment in the Irish Regions, 1988-2005
by
Brendan M. Walsh

38 * Comments to [email protected]
COMPARISON OF ELECTRICITY DEREGULATION AROUND THE WORLD AND IMPLICATIONS FOR IRELAND
Laura Malaguzzi Valeri*
The aim of this survey is to describe how electricity deregulation has taken place in select countries around the world and note potential implications for Ireland. I start with a brief introduction of the electricity industry, highlighting the characteristics that make it a unique sector. I then provide information on the generation and supply sectors for each country considered in this survey and describe how deregulation took place there. Finally, I summarise the findings of studies that analysed the effects of deregulation in these countries. While this overview does not purport to be comprehensive, it highlights a few of the issues that have developed in electricity deregulation.
1. Introduction
Firms are regulated for a variety of reasons. The firm might be a monopolist in a sector where it would be inefficient to have more than one firm. Firms might belong to a sector that is considered crucial for security, or there could be the desire to protect one sector by regulating a competitor. Both state-owned and private firms can be subject to regulation.
Regulated firms tend to be less efficient because the constraints that are imposed by the regulator create a wedge between the true cost of resources and the cost faced by the regulated firms. Deregulation aims to remove such constraints, encouraging a more efficient allocation of resources, with the hope that the greater

39
efficiency will be passed on to consumers under the form of lower prices.
The next section gives a brief overview of the main characteristics of the electricity market. Section 3 introduces deregulation practices in the US, Spain, UK, Norway, Sweden, Denmark and New Zealand. Section 4 describes the regulatory environment in Ireland and how it is likely to change in the next few years. Section 5 concludes the paper. The electricity industry can be described as the combination of physical functions, such as generation, system operation, transmission, distribution, and trading functions; retailing to final customers and wholesale power procurement. Electricity is produced at generating plants, flows through regional level transmission systems at high voltage and then local distribution lines at lower voltage to finally be supplied to end consumers, be they households or businesses. The system operator has the important task of maintaining the balance between consumption and generation of electricity. Trading functions allow consumers to buy from electricity providers, usually utilities that take care of the metering, billing and payment collection. Utilities in turn need to acquire electricity for their customers. This can be done either through bilateral agreements, with utilities signing contracts directly with the generators, or through a centralised wholesale market. The final cost of electricity to consumers is, therefore, the sum of the cost of producing and distributing it. Steiner (2001) reports that for the UK, a fairly representative country, the cost of electricity to end-users can be broken down as follows:
2. The Electricity
Industry
Generation 65 per cent Transmission and distribution 30 per cent Supply 5 per cent.
Some of these functions are considered to be natural monopolies and are, therefore, unlikely to be open to competition. System operation needs to be centrally controlled in order to be efficient, and it is inefficient to double transmission and distribution lines (the network through which electricity flows at the regional and local level respectively). However, generation supply to final customers and wholesale power procurement are areas where competition could be beneficial by promoting lower prices and a more efficient allocation of resources.
The electricity industry is unique because of the need to have demand and supply match each other perfectly at each period in time. If supply is smaller than demand there will be ‘brown-outs’ or rolling blackouts, i.e. some consumers will have to be taken off the system in order to allow the others to continue enjoying access to electricity, so the imbalance is solved by rationing. It is somewhat easier to deal with the case where supply is greater than demand because generators will simply be cut off of the system. There are also transmission constraints to account for: if the amount of electricity exceeds the maximum allowed to go on the transmission or distribution lines, the lines will physically melt down, leading to a

40
black out on the whole system. The complexity of the system is enhanced by the fact that electricity takes the path of least resistance and cannot be channelled economically; therefore trying to have electricity flow in the direction suggested by economic contracts is generally not feasible.
In order to describe how a wholesale market works, I will briefly introduce a few technologies that companies can use to generate electricity: nuclear power, coal-fired generation, gas-fired generation, and pumped hydroelectric storage. Nuclear power plants have huge set-up costs, but then the cost of producing a marginal Kilowatt of electricity is very low. Gas plants on the other hand are relatively cheap to build, but then produce each Kilowatt for a higher cost than nuclear plants. Coal plants tend to be somewhere in the middle. Pumped hydroelectric storage is generally used to smooth peaks of demand. When demand is high, usually during the daytime, water is allowed to flow through the hydroelectric generation plant to produce electricity. At night, when demand and price for electricity are low, water is pumped back up to the upper reservoir. The main advantage of pumped storage is that it can produce electricity at very short notice and, therefore, can be used if there are unexpected failings of other generation plants. The disadvantage is that it needs more electricity to run than it produces.
The system operator needs to match supply of electricity to the demand in each period in time at the lowest possible price. Typically demand changes substantially over a 24-hour period. It is much lower at night and higher over the day and it also changes according to the time of the year. In Northern Europe the highest demand tends to be in the winter, when demand for heating is large. In order for total generation to be efficient, the system operator will want the plants with the lowest marginal cost of production to operate for as long as possible. Therefore nuclear or coal-fired generation will be set up as baseload generation producing a constant amount of generation year-round. When demand grows and baseload capacity is fully used, midload generation will begin, most likely fuelled by gas plants. In the case of extreme peaks of demand that happen as rarely as once or twice a year, the system operator will have to add peak plants to the generation mix. Peak plants typically operate at a very high marginal cost and might be oil-fired or pumped hydroelectric plants.
The potential for market power arising in electricity markets is high for several reasons:
1. the capital costs needed to enter the market are high and it takes a few years to build a new generator, hence new entry in generation is difficult and slow;
2. there are constraints on transmission, so new generation capacity does not automatically lead to more competition;
3. there is high concentration of generation ownership within constrained import areas;
4. electricity is very costly to store; 5. price elasticity of demand for electricity is low, especially in
the short run.

41
Prior to deregulation firms were regulated and there was vertical
integration of all the functions. A single company, often owned by the state, controlled generation, transmission, distribution and supply. This allowed for easier co-ordination between generation and transmission, so there was always sufficient transmission to accommodate all the electricity generated.
In the survey of deregulation that follows, I should note that transmission and distribution remain monopolies in all countries and are regulated as such. It is widely accepted that transmission and distribution should be able to accommodate entry in both retail and generation in order for deregulation to be effective. The easiest way to achieve this is for transmission and distribution to be independent entities, but often they remain part of larger vertically integrated companies, albeit with heightened oversight on the part of the regulators.1 The focus of this overview is however on generation, wholesale and retail procurement of electricity. Table 1 in the Appendix gives a summary history of electricity deregulation for all the countries that are part of this survey.
Competition on the generation side implies entry of new competitors, which should promote the most efficient use of resources. Typically with state-owned regulated generators there was overcapacity in generation, the cost of which ended up being paid by the end consumers.
With competition, a customer’s retail service cost is unbundled between a delivery component that includes transmission costs and a competitive component that includes the price of generation and some retail service cost. The local distribution company continues to provide the regulated component and it must also continue to provide the competitive part if customers do not want to take advantage of the services offered by alternative providers. Local distribution companies are subject to price regulation on the competitive part of the service and the regulated rate is usually set for a time frame of 5 to 10 years. With the increases in fuel costs that took place since 1998, the regulated firms were by law forced to offer a price that could not be matched profitably by any other company. Not surprisingly, few residential and small commercial customers switched to alternative providers, which decreased the interest in competition from the supply side as well.2
Other useful overviews of the electricity industry and its deregulatory process can be found in IEA (2005), Wolak (2004) and Hunt (2002).
1Even though transmission and distribution have not been deregulated, in many cases they have been subject to changes in regulation, but this is not the focus of this study. 2In England and Wales after April 2002 rates were not regulated for the incumbent and about 50 per cent of residential customers had switched electricity provider by 2005 (OFGEM Customer Experience Survey, March 2005).

42
The following examples of deregulation are chosen on the basis of several criteria: either they are examples of successful deregulation (as in the PJM and Texas systems in the US, or the Norwegian and Swedish deregulation),3 or they are chosen for the country’s similarity (in at least one dimension) to Ireland. This is the case for New Zealand, whose population is similar in size to that of Ireland, or Denmark, which has an electricity generation mix that is similar to the Irish one. The UK is included because of its geographic proximity to Ireland and because it was a pioneer in electricity deregulation. Finally, Spain is interesting because it is preparing for a single electricity market with Portugal that should be finalised by 2007. Tables 2 and 3 in the Appendix give a summary of the main characteristics of the countries surveyed here and show how they compare to Ireland with respect to population size, generation capacity, consumption of electricity per capita, and fuel mix in electricity generation.
3. Country Cases
US
While the US is very large, with almost 300 million inhabitants in 2005, the electricity system is divided into many smaller areas. Prior to recent efforts to deregulate and reorganise the market, the industry was split into almost 150 areas, each controlled by a separate system operator. In part this is due to historical reasons. The electricity industry began locally and federal legislation in the 1930s actually encouraged it to stay fragmented. A big difference between Europe and the US depends on the fact that in the US electricity generation typically started as a private enterprise, whereas in Europe the electricity sector has traditionally been a state-owned and regulated business.
Jurisdiction over the industry is divided between Federal and State governments in a way that was decided in 1935. Metering and retailing to final customers are overviewed by the States. The federal body that overviews energy regulation, the Federal Energy Regulatory Commission (FERC), only regulates electricity systems that interconnect across state lines. For example, it has no authority on the Texas electricity system, because the system is totally within the State of Texas. While FERC can set out general guidelines, the single States decide if those guidelines are put into law. Trading arrangements and the transmission business model are mostly
3 Defining success in deregulation is not straightforward. The primary concern is generally the price of electricity to end consumers. When it is lower than it would have been without deregulation, deregulation is defined to be successful. However some analysts point out that this is a somewhat short-sighted view of the issue. A successful deregulation should also imply a secure supply over time, therefore, including sufficient incentives for the adequate maintenance of current infrastructure and for the investment in further generation and transmission capacity if required. The effects of deregulation on investment become apparent after a much longer time horizon, making it difficult to give a comprehensive evaluation of the effects of deregulation when it has taken place less than a decade prior to the study, as is the case in the papers cited in this survey.

43
federal issues, but in practice FERC has insufficient authority to impose changes.
Comprehensive electricity reform started seriously in the US in the mid-1990s and progressively took place at all levels of the electricity industry: generation, transmission, and retail. In 1996 the Federal Energy Regulatory Commission (FERC) adopted rules specifying that transmission-owning utilities had to make their transmission lines available to other users and report both the availability and the cost of transmission service on their lines. FERC order 2000 issued in 1999 contained a new set of regulations facilitating the ‘voluntary’ creation of large Regional Transmission Organisations (RTO) in order to guarantee that vertically integrated firms did not discriminate against independent generators and energy traders. By mid-2005 over 50 per cent of total capacity generation in the US operated within an RTO or an Independent System Operator (ISO) (Joskow, 2005).
In this overview I will focus on 2 distinct electricity systems within the US: the Pennsylvania, New Jersey and Maryland (PJM) system, which is typically pointed to as an example of successful deregulation, and the Texas system, where deregulation has taken place more recently.
TEXAS
Texas had about 22 million people in 2004 and Table 2 in the Appendix shows that in 2003 it generated about GWh 380,000 of electricity, which is equivalent to a per capita annual consumption of 17 MWh. Texas derives almost 40 per cent of total generation from coal and 50 per cent from natural gas.4 It also has a small but growing amount of renewable energy, mostly wind.5
In 1999 the Texas legislature voted to deregulate the system. At this point new generating firms were allowed to connect to the grid. The electricity system was divided into 10 control centres that were merged into one in 2001, controlled by the Electricity Reliability Council of Texas (ERCOT). In 2002 retail deregulation was fully implemented and all customers were allowed the choice to switch to different providers. By 2005 almost a fourth of residential customers had switched, as had 29 per cent of small non-residential customers and 72 per cent of large non-residential customers.
In Texas most of the transactions occur through bilateral agreements and only about 2 to 5 per cent of electricity is traded on the spot market, which takes the form of a day-ahead multi-unit, uniform price auction. Firms submit supply schedules a day ahead. The day-ahead supply and demand schedules can differ from the actual generation and consumption for a variety of reasons such as weather unpredictability or plant outages. The balancing demand can, therefore, be either positive (for example, in the case of a plant
42004 figures from the Energy Information Administration (EIA) of the US Department of Energy. 5In 2003 the electricity generation capacity from renewable resources was about 1,200MW, slated to increase to 2,000MW by 2009.

44
outage) or negative (for example, in the case of a particularly mild winter day). Bidders offer to increase or decrease their production with respect to the day-ahead schedule. They submit hourly increase and decrease schedules that may be changed up to 1 hour prior to the operating hour. ERCOT clears the balancing market four times each hour by setting the hourly aggregate bid equal to the 15 minute inelastic demand. A generator called to increase production is paid the market-clearing price, while a generator called to decrease production has to pay the market the clearing price for the amount it is not producing. A generating firm that is decreasing production reduces output and purchases power from ERCOT to satisfy its existing contract obligations.
In 2003 the market share of the three largest generators was about 50 per cent and the three largest retailers accounted for 70 per cent of the industrial sector and 57 per cent of the residential and commercial sector. See Table 4 of the Appendix for a comparison with the other countries in this survey.
Hortaçsu and Puller (2005) analyse the Texas electricity market. They point out that in a well-functioning market generators should try to predict their residual demand and bid accordingly, therefore, bidding as oligopolists and not competitive firms. This will maintain the right incentives for new firms to enter the market if there are profits to be made. In their empirical investigation they find that large firms’ bids are very close to the profit maximising ones. The major source of inefficiency in the spot market comes from the smaller firms, which tend to put in bids that are too high and are, therefore, dispatched less frequently than they efficiently should. However, it appears that over time these inefficiencies tend to become smaller. There are two basic explanations for the initial inefficiency. First of all the relative amount of generation that is traded on the spot market is small: 2 to 5 per cent of total generation. Second, the cost of investing in sophisticated trading technology and know-how is fairly high for small firms. The combination of these two factors makes it unlikely that small firms will bid efficiently at the initial stages of a new market. One aspect of the Texas market that is interesting to note is that although the ERCOT area is definitely a single market, it is still subject to transmission constraints about a quarter of the time.
PJM SYSTEM (PENNSYLVANIA, NEW JERSEY, MARYLAND, DELAWARE)
The PJM system initially was limited to Pennsylvania, New Jersey, Maryland and Delaware. In 1997 the PJM became an independent organisation and initiated a bid-based market for electricity. It became larger over time and by 2005 it included Pennsylvania, New Jersey, Maryland, Delaware, Washington D.C., West Virginia, Virginia, parts of Ohio and small areas in Kentucky, Tennessee,

45
North Carolina, Michigan, Illinois and Indiana. Pennsylvania generates about 40 per cent from nuclear sources.6
Note that in most of the US, including the States covered by the PJM system, summers are the periods of peak demand, because of the use of electricity for air conditioning. Tables 1 and 2 of the Appendix show that the PJM market in 1999 consisted of about 57,000 Megawatts (MW) of capacity. Nuclear energy provided baseload generation, accounting for 25 per cent of capacity, but about 45 per cent of generation.
The initial wholesale electricity market organised by PJM was a day-ahead market with a single price. Bilateral agreements are allowed, but need to be reported to the market operator to ensure the reliability of the system. The system operator oversees a day-ahead spot market that accounted for about 26 per cent of electricity demanded in 2004. Generators participate in a sealed-bid uniform price auction to decide which generators will be dispatched. In the PJM States, generating firms were not forced to divest and the largest firms in the system stayed vertically integrated owning both generation and supply. In fact, vertically integrated firms self supply an estimated 50 per cent of total consumption (Mansur, 2003).
Nodal pricing, with about 2,000 nodes,7 was adopted in 1998 after a short experiment with zonal pricing. In 1999 an additional market for capacity payment was developed as was one for financial transmission rights (FTR), which allow generators to hedge against the risk of different prices at different nodes of the market.8 In 2001 an extra market for ancillary service went live. Ancillary services include operating reserves, which are reserves that the system operator can call on at a very short notice if there are real-time imbalances in the electricity system.
PJM also operates a market for installed capacity. Generation owners can register their available capacity with PJM and receive a capacity credit that can then be traded on the market. All retailers have to contract for an amount of installed capacity equal to the peak load of their customer base, plus reserves. They can either rely on bilateral contracts or acquire the capacity through the market for capacity credit.
The regulations on the retail sector are state-specific. Here I will describe the retail environment for the State of Pennsylvania. Pennsylvania had about 12 million inhabitants in 2004. During the initial period of deregulation, incumbent firms were faced with a
62004 figures from the Energy Information Administration (EIA) of the US Department of Energy. 7 As the system grew, so did the amount of nodes. In 2004 there were about 7,000 nodes (IEA, 2005). Note, however, that only nodes where there is congestion will have a different price from the system price. 8 Owners of transmission grids can request FTRs that can then be traded either bilaterally or through PJM. An FTR allows its holder to claim rights for the flow of a specific volume in a specific direction between node A and node B. The holder of an FTR will receive a revenue equal to the difference in the price of electricity between the two nodes or will have to pay if the price difference is negative.

46
freeze of the retail rate for end users. In Pennsylvania, the largest 3 retail firms accounted for about 70 per cent of total electricity supplied to industrial users and 57 per cent to residential and commercial users in 2002. Since 2002 the retail market in Pennsylvania has opened further. Currently, there are about 40 retailers, half of which serve all customers while the remaining half only serve commercial and industrial customers. Prices decreased in PJM, although it has been argued that they would have decreased anyway during this time period.
Deregulation of the US electricity sector and the PJM system in particular have attracted the attention of many scholars. Here I will summarise the findings of a few papers that studied the effects of deregulation in the US. Synapse Energy Economics (2004) shows that the cost of power purchased in PJM’s wholesale market was lower than it would have been under continued cost-of-service regulation. Wholesale market prices fell between 2000 and 2004, after controlling for the increase in fuel cost during the same period.
Bushnell and Wolfram (2005) found that divested generating plants and those subject to high incentives increased their efficiency more than those that were not subject to high-powered incentives. Markiewicz, Rose and Wolfram (2004) confirm the findings and determine that operating costs fell more in States that were restructuring than in those that were not. Specifically, they assess that the decrease in costs was largely driven by a decrease in labour costs post deregulation.
Creti and Fabra (2004) report that the PJM market for installed capacity is particularly vulnerable to abuse of market power. Electricity generators can delist their capacity from the PJM market if they wish to sell it in a neighbouring system. The PJM Market Monitoring Unit found that between January and April 2001 the price of capacity in the PJM was higher than in neighbouring systems and yet capacity was withheld from PJM. Together with the fact that there was a small shortage in the capacity market at the same time, this is taken as evidence that there was abuse of market power. Market power remains a concern both because of the inelasticity of demand and the high concentration in the PJM capacity markets.
The deregulated regime offers lower prices per KWh, but the regulated regime did offer higher security to the consumer with regard to prices. Particularly, if the marginal generating capacity that clears the market under high demand conditions is fuelled by natural gas, the all-in market price of wholesale electricity will vary with the natural gas prices, making it very sensitive to the price of one fuel source. Under the cost-of-service regulation, natural gas price would have influenced total wholesale cost only in proportion to the fraction of generation accounted by plants that were fired by natural gas.
SPAIN
Spain has a population of about 40 million people. In 2003 electricity consumed was about GWh 260,000 with more than 30 per cent of that produced by coal-fired plants. Table 3 in the

47
Appendix shows that nuclear power is the second largest source of electricity generation with a share of about 20 per cent. Hydro and gas have a market share of about 15 per cent each.
In January 1998, following the 1997 Electricity Act, the Spanish government liberalised the market for electricity generation and introduced a spot market for electricity. It also opened the retail side to competition. Red Electrica de España (REE) became the system operator with the obligation of granting access to transmission and distribution to all generators who required it unless there was no capacity available. Following deregulation, utility operators are allowed a maximum share of 10 per cent in REE, which became a publicly quoted company in 1999 (Red Electrica de España, 2005).9 Generators and retailers can be owned by the same agents, although legally they have to be separate entities. As a result, Spain’s major electricity companies are active on both sides of the electricity spot market, selling electricity as generators and buying it from the spot market as retailers. Endesa, Iberdrola and Union Fenosa are the only companies with more than a 10 per cent share in electricity generation. In 2004 Endesa had about a 40 per cent share of the generation market, followed by Iberdrola with about 30 per cent and Union Fenosa with 12 per cent.
The Ministry of Industry, Tourism and Commerce is the main authority in electricity regulation and it decides the access tariffs. However, the CNE (Comisión Nacional de Energia) has a growing oversight on regulatory matters, including guaranteeing the transparency of market mechanisms.
Retail competition was achieved fully by January 2003, ahead of the EU deadline of 2007. Iberdrola and Endesa continue to be very large on the retail side, serving more than 70 per cent of the market between them (Comisión Nacional de Energia, 2005). Suppliers, distributors and qualified customers (with a high enough yearly consumption) are eligible to purchase directly from the wholesale pool.
Generators have to sell the electricity they produce on a unified spot market. Each generating firm can bid up to 25 price-quantity pairs in the day ahead market. The supply function has to be non-decreasing. Demand functions (by large consumers or suppliers) can also include up to 25 price-quantity pairs. Once the bids are received the Market Operator constructs a merit order dispatch and the bidders are paid the marginal bid (SMP: system marginal price). Then the System Operator (SO) evaluates if the markets clear and determines congestion points, reallocating the production so as to cover demand. The plants that are called to produce to alleviate congestion are paid their bid. The SO also runs several markets where production units compete to provide ancillary services when needed. Afterwards participants can adjust their positions in either direction in a sequence of six intra-day markets. All units are bought and sold at the highest accepted bid.
9 This will be reduced to 3 per cent by 2008 at the latest.

48
Generating firms were allowed to recover their stranded costs following deregulation through the ‘Competition Transition Costs’ (CTC) to be paid over a 10-year period until 2007. CTCs are computed as a decreasing function of market prices and they, therefore, reduce firms’ incentives to increase prices on the spot market. It is still unclear if the EU will deem these payments anti-competitive or not. Generating companies that supply electricity through the spot market are eligible for additional capacity payments, that are set by the Ministry of Industry, Tourism and Commerce.
In July 2005 a unified electricity market (Mibel: Mercado Iberico de Electricidad) encompassing Portugal and Spain was officially set to go live although the go-live date progressively slid to July 2006. In preparation for the single market, the amount of interconnection between Portugal and Spain is being increased and by 2007 it should reach about 10 per cent of Portuguese installed capacity and about 4 per cent of Spanish installed capacity.
Kühn and Machado (2004) point out that although electricity generation in Spain was more concentrated than in the UK at the time of deregulation (Iberdrola and Endesa controlled approximately 75 per cent of generation) there were no major concerns about excessive pricing. The authors suggest that in part this might derive from the fact that the same agents own generators and suppliers, although the two are legally separated. In their work Kühn and Machado show that firms that are going to be net demanders have an incentive to provide more generation on the spot market in order to lower the wholesale price of electricity. This leads to prices that might be higher or lower than the perfectly competitive wholesale prices. As a result it will not be apparent from average price-cost margins in the industry whether abuse of market power is taking place on the spot market. This also underlines the fact that prices that are lower than perfectly competitive ones are just as likely as high prices to be a signal that the allocation of resources is inefficient.
Crampes and Fabra (2005) suggest that the approximately 35 per cent reduction in electricity rates (in real terms) that took place after the 1997 deregulation is not due to the deregulation process itself. In fact they show that the use of CTCs was equivalent to imposing a price cap. The authors also argue that the regulated tariffs for consumers who decide not to switch is relatively low now, so consumers who participate in the deregulated market can always go back to the regulated tariffs if the price in the deregulated market increases too much. This limits the incentives for potential new entrants to invest in the electricity retail market.
NEW ZEALAND
New Zealand has about 4 million inhabitants, although its electricity consumption is higher than other countries its size. This is mostly due to a large industrial sector, which was responsible for about 45 per cent of total electricity consumption in 2004. The large amount of hydroelectric generation in New Zealand has helped to keep the price of electricity historically low, which has encouraged the

49
expansion of its industrial sector. Since New Zealand relies heavily on hydroelectric production, with 58 per cent of its generation deriving from hydro in 2003 (and most of it run-of-river),10 its fuel mix for electricity generation varies substantially from year-to-year depending on the amount of precipitation.
In 1987 the Ministry of Energy transformed the electricity operation into a state-owned company: the Electricity Corporation of New Zealand (ECNZ). Deregulation started with the Electricity Act of 1992, which created an overseeing body that was self-appointed by the industry (Market Surveillance Committee: NZMSC). In 1994 the government created a stand-alone corporation in charge of the national transmission grid, Transpower. In 1996 the wholesale electricity market officially opened with the launch of a state-owned generation company: Contact Energy (CE). CE operated in direct competition with the state-owned ECNZ. In 1998 corporate separation between transmission and generation was instituted. Transmission was not subject to price regulation, but its prices and profits had to be publicly disclosed. Finally, in 1999 CE was privatised and the generation assets of the ECNZ were split to create three state-owned companies: Meridian Energy, Genesis Power and Mighty River Power.
The generation sector is however still fairly concentrated: the three largest companies (two of which are state-owned) made up 75 per cent of total generation in 2004 (see Table 4 in Appendix). Up to 2004, participation in the spot market was voluntary. About 70 per cent of total generation was exchanged on the spot market in 2003, with the rest traded through bilateral agreements between generators and retailers. However, following the 2004 reform, all generation must be exchanged on the spot market. Both generators and purchasers bid on the spot market.
The electricity system relies on nodal pricing, which takes account of transmission constraints. There are about 250 separate nodes in New Zealand. There are no capacity payments in the New Zealand system.
Two years of low precipitation occurred since liberalisation and the price of electricity rose to very high levels in June to September 2001 and again in June to September 2003. In 2005, a year of higher precipitations, 64 per cent of total electricity generation was fuelled by hydro sources. In the same year, as internal gas production decreased, there was a shift away from gas and towards coal for electricity generation, with coal going from 8 per cent of total generation in 2003 to almost 10 per cent in 2005.11 Wind is becoming more important over time. In 2005 it made up about 1.1 per cent of total electricity generation. There have been no studies to assess if the high prices in 2001 and 2003 were caused or exacerbated by the abuse of market power. However, the reaction of the government was to eliminate the self-appointed NZMSC and
10 See Table 3 in the Appendix. 11 Source: Ministry of Economic Development (2005). Years end on March 31.

50
institute a new regulatory body, the Electricity Commission that started operating in September 2003. Moreover, participation in the pool became compulsory.
In 2004 there were about 10 retailers competing in at least one area of New Zealand, most of them vertically integrated with generators. Contact Energy, Genesis, Meridian, Mighty River and TrustPower are the largest generators and players in the retail market.
The World Energy Council (2001) reports that wholesale prices have decreased substantially since the 1997 deregulation, although it is not clear what were the main drivers of the price change.
UK
The UK has about 60 million inhabitants. Its electricity system has been historically divided into three areas: England and Wales, Scotland and Northern Ireland. In 2003, the main fuel used in electricity generation in the UK was gas that held a 37 per cent share of all generation. It was followed by coal with 35 per cent and nuclear generation with 22 per cent of total generation. Total electricity generation was close to GWh 400,000. In 2004 the largest three generating companies accounted for about 40 per cent of the electricity load. This is a significant reduction of concentration from the duopoly situation that was in place when the Pool started in 1990.
Deregulation in England and Wales officially started with the Electricity Act of 1989 that took effect in 1990. The main driver of the regulatory change was the desire to privatise the industry, which was completely state-owned prior to 1989. The Act established the Office of Electricity Regulation (OFFER), an independent body with the mission of promoting competition and regulating the transmission and distribution network. However, OFFER had limited power and most of the pool operations were subcontracted to the National Grid Company (NGC), which was owned by a group of generation and distribution companies. The Electricity Act also deregulated generation, forcing incumbents to divest some of their generating capacity. State-owned generation assets were allocated to National Power, Power Gen and Nuclear Electric. The first two were subsequently privatised, but Nuclear Electric could not be profitably sold on the market because of uncertainty over the costs of decommissioning its ageing nuclear plants. Bilateral agreements were not allowed in the system, so all generation had to go through the pool. Although a few large consumers were allowed to bid on the spot market, mostly electricity demand was exogenously forecasted by NGC as being completely inelastic to price.
The Pool also allowed for capacity payments that were awarded to every unit of generating capacity available during a period in time. The amount of capacity payments was calculated as a function of the amount of reserves available. As the amount of reserves decreased the capacity payments increased. This was the case even if small reserve margins were caused by generators withholding capacity, which allowed for extensive gaming of the system by the

51
generating companies. These market design defects were not corrected because the power to do so lay with the Pool Executive Committee (PEC) that was made of market participants. PEC members had voting weights based on their size, so any option that went against the interests of the larger participants, such as a change in the capacity payment regime, was blocked.
The problems with the electricity wholesale market prompted a review of the system that led to the implementation of the New Electricity Trading Agreements (NETA) in March 2001. One of the positive changes with NETA was to increase the power of the agency overseeing the market. OFGEM, the new combined gas and electricity regulator, has a much stronger ability to intervene and correct market design flaws. The new trading arrangements are based on voluntary bilateral trades between generators, suppliers, traders and customers. If generators end up offering less than they contracted for, they are paid a smaller price than the one they contracted in order to account for the increased costs incurred by the system operator to maintain the system in balance. Likewise, if customers end up requiring more than they contracted for, they will have to pay a larger price than the contracted for price. This causes NETA to set two different prices, so that in practice there is no unique market-clearing price. Consequently, generators will always have an incentive to bid less capacity than they can provide, since the penalties are much lower and likewise consumers will have incentives to bid more than they expect to consume.
Hunt (2002) explains that NETA has included provisions that violate the law of one price because they drive a wedge between buying price and the selling price to the pool. In 2005 Scotland also adopted NETA, which is now referred to as BETTA for the whole Wales-England-Scotland system.
In the meantime retail deregulation was also taking place. With the initial Electricity Act, all customers who had a maximum demand greater than 1 MW were allowed to choose their supplier. In 1994 the limit was lowered to 100 kW and it was eliminated altogether in 1998. Despite this the amount of customers switching suppliers or renegotiating their contract was not very high at the beginning. In April 2002 all regulation of retail prices was eliminated for incumbents and new entrants alike and by March 2005 an estimated 48 per cent of all customers had switched supplier at least once since deregulation.12 The three largest retailers supplied 65 per cent of the electricity required by large industrial customers in 2004 and 59 to 66 per cent of electricity consumed by households and commercial customers.
After deregulation there was a decrease in the wholesale price of electricity of about 40 per cent. Fabra and Toro (2003) suggest that both market design (the change in the trading arrangements implemented through NETA) and market structure (the change in market structure caused by the forced and voluntary divestitures) caused the decrease in prices. They derive this conclusion from the
12 OFGEM Customer Experience Survey, March 2005.

52
fact that NETA’s go-live date is a statistically significant date in the price regression they build. The regression they estimate has the price of electricity on the left hand side and a series of possible explanatory variables, including regulatory reform dates represented by dummy variables, on the right hand side.
Evans and Green (2005) on the other hand, argue that the change in market design was not driving the price decrease. The authors set out to determine the causes of the price reduction and in particular if it was due to the implementation of NETA. They set up a simulation model that allows them to analyse counterfactual situations, such as maintaining the single price Pool market, but changing the capacity payment setup. Their conclusion is that the lower prices were the result of additional capacity that was built in the system and of the forced and voluntary divestitures that major generators engaged in and not directly of the change in trading arrangements. In fact Evans and Green claim that the impact of NETA on electricity prices was mainly driven by NETA’s abolition of capacity payments that had become very large prior to the reform. However, they point out that it should have been possible to eliminate capacity payments without moving away from the Pool system. Furthermore, Evans and Green suggest that the anticipation of the new NETA trading arrangements probably caused a break-down of the existing collusive behaviour, which also led to lower prices in the wholesale market.
NORDIC COUNTRIES
The Nordic electricity system includes Norway (4.6 million people) Sweden (9 million), Finland (5.2 million) and Denmark (5.4 million). Deregulation started in Norway in 1991 with the Energy Act, which eliminated the monopoly of local, vertically integrated utilities that had exclusive delivery rights. It also introduced competition in the generation and retail segments. Transmission and distribution remain regulated by the Norwegian Water Resources and Energy Directorate (NVE).
The largest state-owned firm was split to form Statkraft, a generation firm, and Statnett, which serves both as a transmission company and the grid operator. In 1996 Sweden and Norway created the Nord Pool, a joint power exchange. In 1999 the system was enlarged to include Finland and Western Denmark, and when Eastern Denmark joined in 2000, the Nordic electricity system became fully integrated.
Electricity generation in Norway is mainly provided by hydroelectric plants, which accounted for 99 per cent of generation in 2003. Sweden generated 40 per cent of its electricity from hydroelectric plants and 50 per cent from nuclear power in 2003. Finland relied on coal-fuelled generation for 32 per cent of its electricity in 2003 and on nuclear power for 27 per cent. It had substantially lower shares of hydroelectric power generation than the other Scandinavian countries, about 11 per cent of total generation. Denmark has virtually no nuclear and hydro generation.

53
Its main fuel source is coal, which generated about 55 per cent of total electricity in 2003, followed by gas with 21 per cent.13
Naturally, transmission constraints arise between the different areas in the Nordic system. Von der Fehr et al. (2005) estimate that between 1997 and 2003 the price has been the same across all areas of the Nord Pool system about 60 per cent of the time.
The rules for retail deregulation strongly influence the degree to which consumers will take advantage of retail liberalisation, and this is especially true for residential and small commercial customers. In Sweden and Norway the default for consumers who did not actively choose their supplier was to go to a variable-price contract, which allowed retailers to increase the price with a few weeks’ notice. In Norway consumers who switched suppliers incurred no cost, whereas until November 1999, Swedes who wanted to switch were responsible for the cost of installing real-time meters. This led to limited renegotiations of contracts in Sweden prior to 1999, but after this condition was lifted, the number of residential customers who switched providers or renegotiated their contract with their current provider significantly increased, reaching about 30 per cent in 2004. In Finland and Denmark most of the consumers have fixed-price contracts, which led to fewer of them changing their contractual agreements. Other factors increased the incentive of Swedish and Norwegian households to switch, especially the fact that heating in those countries is typically electric, making electricity costs a significant share of total household expenses.
In Denmark the power industry was historically owned by municipal non-profit companies in urban areas and by consumer co-operatives in rural areas. The electricity network is divided into the western area that includes Jutland and Funan and the eastern area that covers the rest of the country. Since the early 1980s no electricity-only plant has been given planning permission and all power plants have been combined heat and power plants (CHP). In 1995 the government issued a ban against electric heating.
Deregulation of the electricity sector in Denmark took place with the Electricity Supply Act that came into effect in January 2000. It imposed vertical separation between generators, transmission and distribution owners and suppliers. It also allowed all electricity producing companies to buy access to transmission and distribution lines. Power companies had merged over time, going from twelve companies in the early 1990s to two by 2001 (IEA, 2002b). Transmission and distribution companies were regulated by an income-cap with benchmarking starting in 2000. However, this type of regulation had not had the desired effect of lowering transmission costs. In fact they had increased by 8 per cent since it had been imposed (Danish Government, 2002). Therefore, in 2004 this was replaced by a price cap and networks essentially went back into public ownership. Full retail deregulation took place in January 2003.
13All figures come from the IEA. See Table 3 in the Appendix.

54
The cost of transmission, metering and subscription fees accounted for about 45 per cent of the cost of electricity in the average Danish household in 2002, net of taxes. In 2001 about 40 per cent of total electricity consumption in Denmark was provided by decentralised CHP production and renewable energy, which has to be purchased by electricity providers at a regulated price that is substantially higher than the market price for electricity.
Denmark has 5,200MW of interconnection with Sweden, Norway and Germany. This is about 50 per cent of its total installed capacity, a very high proportion. Since most of Denmark’s generation is based on thermal plants, it helps to make the whole Nordic electricity system more secure.
NORD POOL
Buyers and sellers in Nordic countries can trade electricity either by trading on Elspot, the spot market operated by Nord Pool, or by signing bilateral agreements with one another. Elspot is a centralised, non-mandatory, day-ahead market for physical deliveries. The fraction of energy traded in the day-ahead market has increased from about 15 per cent in 1995 to 43 per cent in 2004.14 Whether they have signed bilateral contracts or sold through the Elspot market, generators must submit their production plans to the grid operator Statnett. To manage inevitable deviations from the day-ahead plan, Statnett operates a real-time market, the Regulation Market, and uses it to settle any real-time imbalances. In the Elspot market, a trading day is divided into 24 hours. Both buyers and sellers submit bid schedules detailing the quantities they will buy or provide at various prices. Nord Pool determines the clearing price for each market around 1:00 p.m.
Norway uses a form of zonal pricing where the borders of the zones are allowed to vary, making the distinction between a nodal or zonal system less clearly defined. The definition of each zone changes from week to week and is publicly announced to all the players once a week. For the purposes of the Elspot market, the country is divided into at most five zones. Specifically, when Statnett expects major transmission lines to be constrained for a considerable period of time, it designates geographical zones for the day-ahead market. Intra-zonal transmission constraints expected to last for shorter periods of time are relieved using the Regulation Market.
When systems rely heavily on hydroelectric generation it is assumed that single generating companies cannot exercise market power. However, Johnsen et al. (2004) show that in the presence of transmission constraints and low elasticity of demand firms may be able to restrict quantities in areas of the market that become isolated from the larger system and, therefore, exercise market power. Hydroelectric generators might also have intertemporal incentives to withhold quantities. If they have a relatively small reservoir
14 The 1995 figure refers to the Norwegian market, whereas the 2004 information is for the whole Nord Pool area.

55
capacity with respect to the turbines, they are more likely to try to conserve water when the market price is low in anticipation of higher future prices. The Norwegian system has a storage capacity equal to about 75 per cent of its annual generation and, since a large part of the inflows are due to snow melt, inflows are relatively predictable, further reducing unexpected changes in water value.
In Sweden the retailing segment has not been profitable and several entrants have left. Apparently the costs and risks of electricity retail had been severely underestimated. Some restructuring of the industry has occurred with the main generators buying several retailers. There might be efficiency in integration even though legal separation is required in Sweden. The increased efficiency possibly derives from the lack of markets to hedge against price and quantity risks. Retail prices are higher for customers who have not switched in Sweden, possibly because they have thus signalled that they are not very price-sensitive (or, more precisely, that their transaction costs are higher than the excepted benefit from switching).
While deregulation in the Nord Pool area is considered successful, there have been instances of high electricity prices post deregulation. In the second half of 2002 inflow to hydro reservoirs was only 54 per cent of the average of the preceding 20 years. Foreseeing tighter supply, generators began restricting their output in late fall and prices climbed to three times the normal level in January 2003. High prices were passed on to consumers, and on one hand this caused consumers to have much higher electricity bills during that winter, but on the other it allowed them to react to the increased prices, significantly decreasing demand for electricity which in turn brought the spot prices down fairly quickly. This is generally taken as an example of the positive effects of a well-functioning market.
The Irish market is relatively small. The Republic of Ireland has
about 4 million people and there are about 1.8 million electricity customers. The main fuel used in electricity generation is gas, which in 2003 was responsible for 52 per cent of electricity generation; with forecasts suggesting that use of gas will increase in the next decade (Fitz Gerald et al., 2005).15
4. Ireland and its
Regulatory Environment
Deregulation started in 1999 with the Electricity Act and in 2000 the Commission for Energy Regulation (CER) was put in charge of electricity tariffs. The Electricity Act also introduced competition in both the generation and the retail sectors in the Republic of Ireland.
The Electricity Supply Board (ESB) is by far the largest player in the Irish electricity market and has a 95 per cent state ownership. The ESB has historically only been asked to ‘break even’, without controls on its cost on the part of the regulator. Prior to deregulation it was a vertically integrated company that controlled all the segments of the electricity sector, from generation, to grid
15 See Table 2 and Table 3 in the Appendix for more details.

56
ownership, to supply. After the 1999 Electricity Act some functions were separated from the main ESB business. In particular the transmission operator, while still part of ESB, has been renamed Eirgrid, and has a separate accounting system. The same is true for the distribution operator, ESB Networks, which also owns the transmission network.16 The retail sector in the Republic of Ireland has been completely liberalised since 2005. ESB still provides a majority of the consumers, although its share has been slowly decreasing over time. In 2004 it supplied about 70 per cent of all consumers. Virtually all of the customers who switched to a different supplier were industrial or commercial customers. The residential sector is still supplied by the incumbent.
The wholesale electricity market is organised mainly as a bilateral market, where generators and suppliers enter into bilateral contracts to trade electricity. Real time imbalances are managed by Eirgrid through a balancing market.
In Northern Ireland, the industry was privatised in 1992 when the generation capacity was sold to 4 different firms who received very generous long-term contracts, making the price of electricity in Northern Ireland higher than in the rest of the UK for about a decade. Transmission, distribution and retail remain vertically integrated within Northern Ireland Electricity (Fitz Gerald et al., 2005).
Currently there is limited interconnection between North and South of Ireland, although more is being planned. At the moment only 300MW of power can flow from North to South and about 100MW from South to North, mostly due to transmission limitations in the South. Northern Ireland is connected to Great Britain by the Moyle interconnector, which has a capacity of 500 MW but typically operates at up to 400MW.
The Republic of Ireland and Northern Ireland have agreed to an all-island electricity market that will be established by November 2007. Wholesale trading will take place through a spot market where all electricity generated will be exchanged. Generating companies will submit a supply schedule, specifying the quantities and the relative prices that they are willing to supply. The system operator will be agreed upon by Eirgrid and the System Operator of Northern Ireland. It will decide which generators will supply electricity in order to cover expected consumption at the minimum possible cost. There will also be capacity payments to the generators, with the intent of covering the capital and operating costs of the most efficient plant available. Distribution and supply in the all-island market will be regulated by each jurisdiction independently.
16 See CER (2005).

57
In the past couple of decades there has been widespread deregulation of the electricity sector worldwide. It has been generally accompanied by a decrease in the price of electricity. The wholesale prices appear to have decreased mainly because of efficiency gains in electricity generation (see, for example, Markiewicz et al. (2004)). Effects on final prices to consumers are less clear-cut.
5. Conclusions
The debate on deregulation has focused on two fundamental aspects of the electricity sector. On one hand there is market structure. Given the high capital costs of electricity generation, the low demand elasticity for electricity, the need to balance demand and supply exactly, there is a high potential for abuse of market power in this industry. Hence, the argument goes, any concentration in industry structure will be exploited by the firms. On the other hand, many suggest that if the market rules are set up correctly firms will have the incentive to maximise welfare. Recent studies seem to lean towards the first of these views, namely that a concentrated market structure is the main driver of high electricity prices and abuse of power in the electricity industry, while the role of market trading rules is to avoid exacerbating the existing conditions. This suggests that there should be a renewed effort on the part of the policy makers to allow for a sufficient number of competitors in both the electricity generation and the retail sectors.
While it is impossible to determine a recipe that would improve the provision of electricity in all situations, some common traits can be summarised as follows. First of all it is useful to increase the elasticity of demand of electricity. This can be achieved by allowing customers to choose their own suppliers (i.e. deregulating the retail side of the electricity market) and introducing variable rate contracts for the supply of electricity. The experiences in Spain, UK, and PJM suggest that if the incumbent’s price, as is often the case, is regulated following retail deregulation, such price should not be set too low. While low prices help the consumers in the short run, they also reduce the incentives for new entry in the medium and long run, which leads to lower competition and potentially higher prices in the long run. The experience in the Nordic countries also shows that the default rules for consumer contracts that are implemented at the time of deregulation are important. If by default customers of incumbent firms switch to variable rate contracts linked to wholesale electricity prices, they are more likely to negotiate a new contract either with the incumbent or with new entrants than if they continue to have access to fixed price contracts. Retail deregulation will not be effective unless customers have a real choice among suppliers. A real choice will not be possible unless there is deregulation of the generation side as well.
Generation deregulation can take various forms, as shown in the preceding sections. In order to have a viable generation sector, it is necessary that generators cover their costs of production. One way to achieve this is through the use of capacity payments, usually accompanied by market rules that make generators bid their marginal cost on the wholesale market. The regulator can set the price of capacity and let the market set the amount, as was done in

58
England and Wales prior to the adoption of NETA. As an alternative the regulator can set the amount of capacity needed and let the market determine the price, as in the PJM system with the so-called capacity requirements. In this case electricity retailers are forced to buy enough capacity to cover their customers’ expected peak demand. Agreements between generators and retailers will determine what price is charged.
While capacity payments improve short-term profitability and, therefore, increase the incentives to invest in future generation capacity, they might also cause inefficiencies. In the PJM system they increased the market power of a few generators. The same happened in the UK prior to NETA. In fact, the desire to limit the abuse of the capacity payment system in England and Wales was an important motivator of the change to NETA. Additionally, capacity payments might introduce distortions across borders if there is trade of electricity between countries, but one country offers capacity payments while the neighbouring country does not. This issue is particularly relevant to the Irish economy, since there will be increased interconnection with Great Britain that does not feature capacity payments. This issue has not received much attention up to now and further analysis is definitely needed.
The alternative to capacity payments is to allow firms to earn more than the marginal cost of generation for each unit of electricity they supply on the market. This is the approach taken for example in Texas. In the absence of specific regulation, we should not expect the wholesale electricity markets to be perfectly competitive. There are high investment costs in the industry, so bidding above marginal cost might be considered the norm rather than the exception in electricity generation. In Texas firms behave as oligopolists (and therefore have some market power) and yet the system appears to be fairly efficient (Hortaçsu and Puller, 2005). The downside of this approach is that the incentives for investment in future generation might not be strong enough.17
Deregulation in Ireland faces additional constraints due to the small size of the electricity market. This makes it difficult to create adequate competition by simply forcing the current incumbent to divest some of its generation capacity.18 This problem will be slightly alleviated with the single electricity market, but it still remains a concern.
17Currently there is not sufficient empirical evidence to confirm or dispute this concern. 18A new entrant will be able to fund entry in electricity generation only if its risk is not too high. Risks for a generating company are lowered if the firm has a portfolio of generating plants, so that unforeseen problems with one plant do not impact viability of the firm excessively. In Ireland total capacity is around 4,000MW, while the efficient scale for a new CCGT gas plant is about 400MW, or almost 10 per cent of total capacity. This allows for a limited number of efficient generators, although the situation somewhat improves if we consider technology based on renewable resources where plants tend to be efficient for a capacity significantly smaller than 400MW.

59
REFERENCES
BUSHNELL, J. and C. WOLFRAM, 2005. “Ownership Change, Incentives and Plant Efficiency: The Divestiture of U.S. Electric Generation Plants”, Center for the Study of Energy Markets, Paper CSEMWP-140; available at http://repositories.cdlib.org/ ucei/csem/CSEMWP-140.
CER, 2005. “Regulators’ Annual Report to the European Commission”, available at: http://www.ergeg.org/portal/page/portal/ERGEG_HOME/ERGEG_DOCS/NATIONAL_REPORTS
CHAO, H., S. OREN and R. WILSON, 2005. “Restructured Electricity Markets: A Risk Management Approach”, Stanford University, mimeo.
COMISIÓN NACIONAL DE ENERGIA, 2005. “Spanish Regulator’s Annual Report to the European Commission.
CRAMPES, C. and N. FABRA, 2005. “The Spanish Electricity Industry: plus ca change…”, Energy Journal, special issue on European Electricity Liberalisation.
CRETI, A. and N. FABRA, 2004. “Capacity Markets for Electricity”, Center for the Study of Energy Markets, CSEM WP n. 124, available at: http://www.ucei.berkeley.edu/PDF/ csemwp124.pdf
DANISH GOVERNMENT, 2002. Liberalisation of Energy Markets: the Danish Growth Strategy, Danish Energy Agency.
DOMAH, P.D. and M. POLLITT, 2001. “The Restructuring and Privatisation of Regional Electricity Companies in England and Wales: a Social Cost Benefit Analysis”, Fiscal Studies, Vol. 22, No. 1, pp. 107-146
EUROPEAN UNION, 2005. “Report on Progress in Creating the Internal Gas and Electricity Market”, Commission staff working paper.
EVANS, J. and R. GREEN, 2005. “Why Did British Electricity Prices Fall After 1998?” mimeo.
FABRA, N. and J. TORO, 2003. “The Fall in British Electricity Prices: Market Rules, Market Structure, or Both”, mimeo.
FITZ GERALD, J., M. KEENEY, N. MCCARTHY, E. O’MALLEY and S. SCOTT, 2005. Aspects of Irish Energy Policy, Policy Research Series, No. 57, Dublin: The Economic and Social Research Institute,
HORTAÇSU, A. and L. PULLER, 2005. “Testing Models of Strategic Bidding in Auctions: a Case Study of the Texas Electricity Spot Market”, mimeo.
HUNT, SALLY, 2002. Making Competition Work in Electricity, New York: John Wiley and Sons, Inc.
IEA, 2002a. Security of Supply in Electricity Markets: Evidence and Policy Issues, Paris: OECD. IEA, 2002b. Energy Policies of IEA Countries: Denmark 2002 Review, Paris: OECD. IEA, 2003. Energy Policies of IEA Countries: Ireland 2003 Review, Paris: OECD. IEA, 2005. Lessons from Liberalised Electricity Markets, Paris: OECD. JOHNSEN, T.A., S. K. VERMA and C. WOLFRAM, 2004. “Zonal Pricing and Demand-side
Responsiveness in the Norwegian Electricity Market”, University of California Energy Institute, Power WP 063.
JOSKOW, P., 2005. “Markets for Power in the United States: an Interim Assessment, MIT CEEPR Discussion Paper, WP-2005-012; available at: http://web.mit.edu/ ceepr/www/2005-012.pdf
KIESLING, L., 2001. “Getting Electricity Deregulation Right: How Other States and Nations Have Avoided California’s Mistakes”, Policy Study, No. 281.
KÜHN, K. and M.P. MACHADO, 2004. “Bilateral Market Power and Vertical Integration in the Spanish Electricity Spot Market”, CEMFI Working Paper, No. 0414.

60
MANSUR, E. T., 2003. “Vertical Integration in Restructured Electricity Markets: Measuring Market Efficiency and Firm Conduct”, Center for the Study of Energy Markets, CSEM WP n. 117, available at: http://www.ucei.berkeley.edu/PDF/csemwp117.pdf
MARKIEWICZ, K., N. ROSE and C. WOLFRAM, 2004. “Does Competition Reduce Costs? Assessing the Impact of Competition on U.S. Electric Generation Efficiency”, Cambridge, MIT CEEPR Discussion Paper WP-20004-018; available at: http://web.mit.edu/ceepr/www/2004-018.pdf.
MINISTRY OF ECONOMIC DEVELOPMENT, 2005. “Energy Data File”, January and July 2005, available at: http://www.med.govt.nz/templates/StandardSummary ____15169.aspx.
NEWBERY, D. and M. POLLITT, 1997. “The Restructuring and Privatisation of the CEGB: Was it Worth it?” Journal of Industrial Economics, Vol. 45, No. 3, pp. 269-303.
OECD, 2001. “Regulatory Reform in Spain: Regulatory Reform in the Electricity Sector”, Paris: OECD.
RED ELECTRICA DE ESPAÑA, 2005. El libro de los 20 años, Madrid. STEINER, F., 2001. “Regulation, Industry Structure and Performance in the Electricity
Supply Industry, OECD Economic Studies, No. 32. SYNAPSE ENERGY ECONOMICS, 2004. “Electricity Prices in PJM.” June, Cambridge,
MA, http://www.pjm.com/documents/downloads/reports/synapse-report-pjm-electricity-prices.pdf
VON DER FEHR, N.H., E.S. AMUNDSEN and L. BERGMAN, 2005. “The Nordic Market: Signs of Stress”, Energy Journal, special issue on European Electricity Liberalisation.
WOLAK, F., 2003. “Identification and Estimation of Cost Functions Using Observed Bid Data: An Application to Electricity Markets”, in M. Dewatripont, L.P. Hansen, and S.J. Turnovsky (eds.), Advances in Economic and Econometrics: Theory and Applications, Eight World Congress, Volume II, New York: Cambridge University Press, pp. 133-169.
WOLAK, F., 2004. “Lessons from International Experience with Electricity Market Monitoring”, mimeo.
WORLD ENERGY COUNCIL, 2001. Electricity Market Design and Creation in Asia Pacific, London: World Energy Council.

61
APPENDIX TABLES
Table 1: Summary History of Deregulation
Areas Deregulated Generation Retail Generation Bidding
Ireland Deregulated 2000 >4GWh19
2005 full Bilateral agreements
Denmark
1999, VI* allowed – although
need to be legally separated
2003 full
43% of generation traded on Nord Pool (2004)21
New Zealand 1996
1999 NZ is split into 3 generating firms 2003 New Pool arrangement
1999 full Prior to 2003, 70% traded on spot market
Norway
1991 Energy Act
1991 full
43% of generation traded on Nord Pool (2004)21
Spain 1998, VI allowed – although
need to be legally separated 1998>15GWh19 1999 >1GWh 2000 >1kV20
2003 full
96% sold on spot market
Sweden 1996 1996 full 43% of consumption traded on NordPool21
UK 1989 Electricity Act –
1990 Pool starts 2001 NETA 2005 BETTA
1990 >1MW22
1994>100kW 1998 full
Pool:10-20% generation traded on spot market NETA: separate buy and sell prices BETTA: like NETA, includes Scotland
Texas 1999 2002 Mostly bilateral contracts. 2-5% of all generation is bid on spot market, by auction
Pennsylvania 1999, VI allowed 1999>10MWh 2000 full
Spot market accounts for 15-20% of total generation
19 Annual consumption. 20 All customers that use high voltage were allowed choice of their electricity provider starting on July 1 2000. 21 2004 information for all of Nord Pool. 22 From 1990 customers with a maximum demand greater than 1MW could choose their supplier. * VI: Vertical Integration.
62
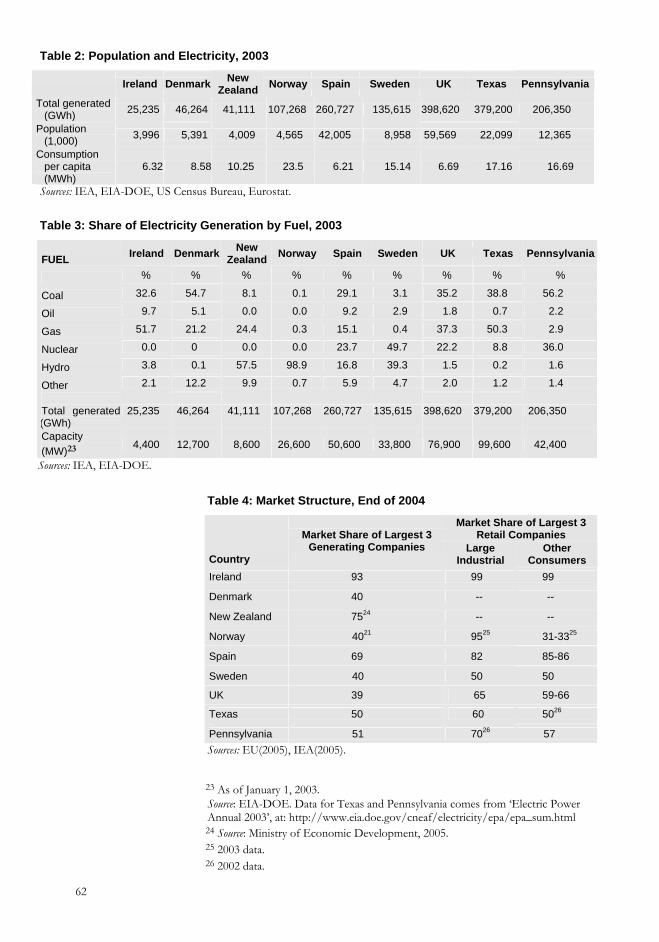
Table 2: Population and Electricity, 2003
Ireland Denmark New Zealand Norway Spain Sweden UK Texas Pennsylvania
Total generated (GWh) 25,235 46,264 41,111 107,268 260,727 135,615 398,620 379,200 206,350
Population (1,000) 3,996 5,391 4,009 4,565 42,005 8,958 59,569 22,099 12,365
Consumption per capita (MWh)
6.32 8.58 10.25 23.5 6.21 15.14 6.69 17.16 16.69
Sources: IEA, EIA-DOE, US Census Bureau, Eurostat.
Table 3: Share of Electricity Generation by Fuel, 2003
FUEL Ireland Denmark New Zealand Norway Spain Sweden UK Texas Pennsylvania
% % % % % % % % %
Coal 32.6 54.7 8.1 0.1 29.1 3.1 35.2 38.8 56.2
Oil 9.7 5.1 0.0 0.0 9.2 2.9 1.8 0.7 2.2
Gas 51.7 21.2 24.4 0.3 15.1 0.4 37.3 50.3 2.9
Nuclear 0.0 0 0.0 0.0 23.7 49.7 22.2 8.8 36.0
Hydro 3.8 0.1 57.5 98.9 16.8 39.3 1.5 0.2 1.6
Other 2.1 12.2 9.9 0.7 5.9 4.7 2.0 1.2 1.4 Total generated (GWh)
25,235 46,264 41,111 107,268 260,727 135,615 398,620 379,200 206,350
Capacity (MW)23 4,400 12,700 8,600 26,600 50,600 33,800 76,900 99,600 42,400
Sources: IEA, EIA-DOE.
Table 4: Market Structure, End of 2004
Market Share of Largest 3 Retail Companies
Country
Market Share of Largest 3 Generating Companies Large
Industrial Other
Consumers Ireland 93 99 99
Denmark 40 -- --
New Zealand 7524 -- --
Norway 4021 9525 31-3325
Spain 69 82 85-86
Sweden 40 50 50
UK 39 65 59-66
Texas 50 60 5026
Pennsylvania 51 7026 57 Sources: EU(2005), IEA(2005).
23 As of January 1, 2003. Source: EIA-DOE. Data for Texas and Pennsylvania comes from ‘Electric Power Annual 2003’, at: http://www.eia.doe.gov/cneaf/electricity/epa/epa_sum.html 24 Source: Ministry of Economic Development, 2005. 25 2003 data. 26 2002 data.

63
Table 5: System Operator Homepages Area System Operator Website
Texas ERCOT www.ercot.com
Pennsylvania PJM www.pjm.com
Spain Red Electrica de España www.ree.es
New Zealand Transpower www.transpower.co.nz
Norway Stattnet www.stattnet.no
Sweden Svenska Kraftnät www.svk.se
Great Britain National Grid www.nationalgrid.com
Northern Ireland SONI www.soni.ltd.uk
Republic of Ireland ESBNG www.eirgrid.ie