SPECIAL DEVELOPMENT FUND - Caribbean … · review of the unified special development fund resource...
66
REVIEW OF THE UNIFIED SPECIAL DEVELOPMENT FUND RESOURCE ALLOCATION SYSTEM - ii - SPECIAL DEVELOPMENT FUND A REVIEW OF THE SDF (U) RESOURCE ALLOCATION SYSTEM April 2007
Transcript of SPECIAL DEVELOPMENT FUND - Caribbean … · review of the unified special development fund resource...
REVIEW OF THE UNIFIED SPECIAL DEVELOPMENT FUND RESOURCE ALLOCATION SYSTEM
- ii -
SPECIAL DEVELOPMENT FUND
A REVIEW OF THE SDF (U)
RESOURCE ALLOCATION SYSTEM
April 2007
- iv -
ABBREVIATIONS
ADB - Asian Development Bank
AfDB - African Development Bank
BMC - Borrowing Member Country
BNTF - Basic Needs Trust Fund
CDB - Caribbean Development Bank
CPIA - Country Policy and Institutional Assessment
FSO - Fund for Special Operations
GEF - Global Environmental Facility
IDA - International Development Association
IDB - Inter-American Development Bank
IFAD - International Fund for Agricultural Development MDBs - Multi-lateral Development Banks
MDGs - Millennium Development Goals
PDA - performance-based allocation
PPI - Project Performance Index
PPMS - Project Portfolio Management System
PRES - Poverty Reduction Effectiveness Situation
SDF (U) - Special Development Fund (Unified)
TA - Technical Assistance
SYMBOLS
$ - US dollar (unless otherwise specified)
- iii -
TABLE OF CONTENTS
1. INTRODUCTION
1.0 The SDF (U) Allocation System 01
1.1 The Allocation Experience 01
1.2 Purpose of this Paper 01
2. CONCESSIONARY RESOURCE ALLOCATION
2.0 Allocation Processes 02
2.1 The Allocation Formula 02
2.2 Reallocations 03
2.3 Other MDB Allocation Formulas 04
3. POLICY AND INSTITUTIONAL PERFORMANCE
3.0 Defining “Policy-and-Institutional Performance” 06
3.1 CDB Review of the PRES 07
3.2 The PRES and the World Bank Country Policy and Institutional Assessment 07
3.3 Scoring Procedures and Rating Team 08
3.4 The Scoring Questionnaire 09
3.5 Sector Specialists, Thematic Studies and Country Performance Scores 10
3.6 Harmonisation and Cooperation with Other MDBs 11
3.7 Disclosure, Country Dialogue and Peer Input 12
3.8 The Influence of PRES on the Allocations 13
4. COUNTRY PORTFOLIO PERFORMANCE
4.1 Defining Portfolio Performance 15
4.2 The Small Portfolio Volatility Problem 15
4.3 Portfolio Performance Issues 16
5 COUNTRY NEED
5.1 Defining Country Need 19
5.2 Fragile States 19
5.3 Volatility of Allocations 20
6 SET-ASIDES
6.1 Grants 23
6.2 BNTF 23
6.3 BMC Capacity Building TA 24
7 FINDINGS AND RECOMMENDATIONS
7.1 Strengths and Weaknesses of the Present System 25
7.2 Summary of Recommendations 25
- iv -
APPENDICES
A. SDF (U) Allocations Tables
B. BNTF Allocations Tables
C. Allocation Formulae and Criteria Used by Multilateral Institutions
D. Example of a World Bank CPIA Write-Up Template
E. Comparative Table of Red Flags for Problematic Projects
F. The Global Environmental Facility Allocation System
G. Asian Development Bank Portfolio Performance Scoring System
H. World Bank/IDA Portfolio Performance Scoring System
I. Inter-American Development Bank Approach to Portfolio Performance Scoring
J. African Development Bank Portfolio Performance Scoring System
Endnotes

REVIEW OF THE UNIFIED SPECIAL DEVELOPMENT FUND RESOURCE ALLOCATION SYSTEM
- 1 -
1. INTRODUCTION
1.1 The SDF (U) Allocation System
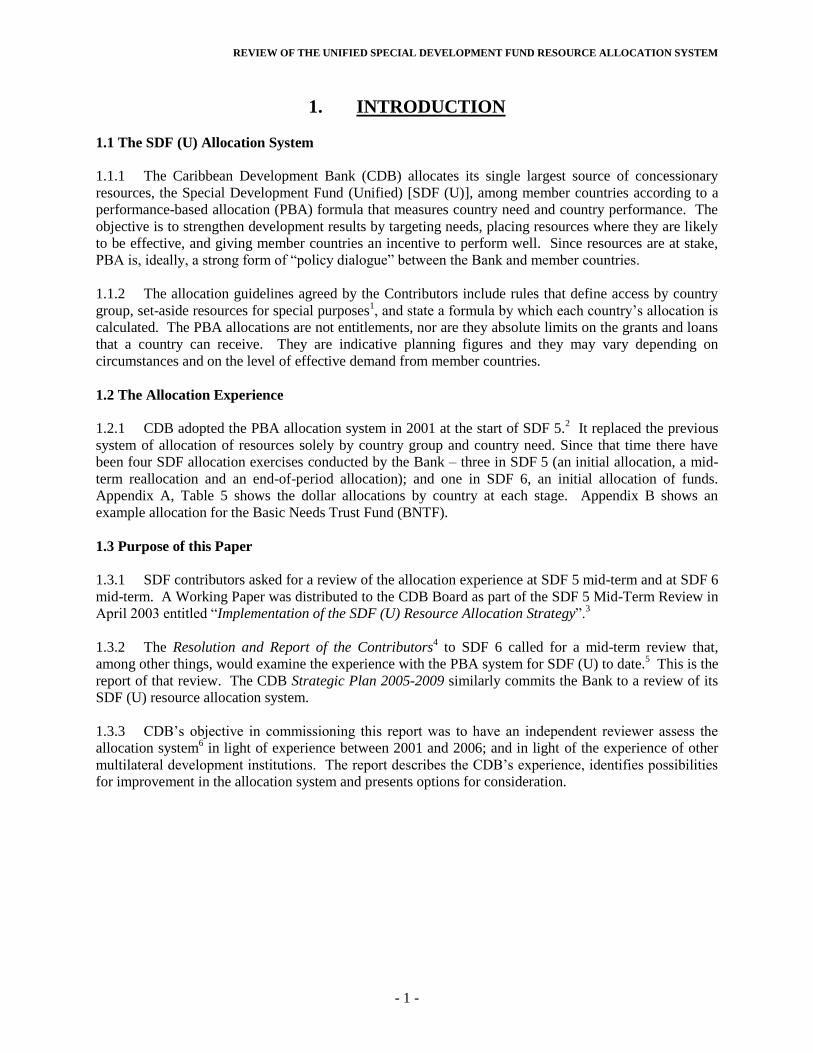
1.1.1 The Caribbean Development Bank (CDB) allocates its single largest source of concessionary
resources, the Special Development Fund (Unified) [SDF (U)], among member countries according to a
performance-based allocation (PBA) formula that measures country need and country performance. The
objective is to strengthen development results by targeting needs, placing resources where they are likely
to be effective, and giving member countries an incentive to perform well. Since resources are at stake,
PBA is, ideally, a strong form of “policy dialogue” between the Bank and member countries.
1.1.2 The allocation guidelines agreed by the Contributors include rules that define access by country
group, set-aside resources for special purposes1, and state a formula by which each country’s allocation is
calculated. The PBA allocations are not entitlements, nor are they absolute limits on the grants and loans
that a country can receive. They are indicative planning figures and they may vary depending on
circumstances and on the level of effective demand from member countries.
1.2 The Allocation Experience
1.2.1 CDB adopted the PBA allocation system in 2001 at the start of SDF 5.2 It replaced the previous
system of allocation of resources solely by country group and country need. Since that time there have
been four SDF allocation exercises conducted by the Bank – three in SDF 5 (an initial allocation, a mid-
term reallocation and an end-of-period allocation); and one in SDF 6, an initial allocation of funds.
Appendix A, Table 5 shows the dollar allocations by country at each stage. Appendix B shows an
example allocation for the Basic Needs Trust Fund (BNTF).
1.3 Purpose of this Paper
1.3.1 SDF contributors asked for a review of the allocation experience at SDF 5 mid-term and at SDF 6
mid-term. A Working Paper was distributed to the CDB Board as part of the SDF 5 Mid-Term Review in
April 2003 entitled “Implementation of the SDF (U) Resource Allocation Strategy”.3
1.3.2 The Resolution and Report of the Contributors4 to SDF 6 called for a mid-term review that,
among other things, would examine the experience with the PBA system for SDF (U) to date.5 This is the
report of that review. The CDB Strategic Plan 2005-2009 similarly commits the Bank to a review of its
SDF (U) resource allocation system.
1.3.3 CDB’s objective in commissioning this report was to have an independent reviewer assess the
allocation system6 in light of experience between 2001 and 2006; and in light of the experience of other
multilateral development institutions. The report describes the CDB’s experience, identifies possibilities
for improvement in the allocation system and presents options for consideration.
REVIEW OF THE UNIFIED SPECIAL DEVELOPMENT FUND RESOURCE ALLOCATION SYSTEM
- 2 -
2. CONCESSIONARY RESOURCE ALLOCATION
2.1 Allocation Processes
2.1.1 CDB allocates SDF (U) funds among member countries every two years, at the start and the
midpoint of each replenishment cycle, and sets aside some funds for special purposes. All borrowing
member countries (BMCs) are eligible for an SDF (U) allocation, but Group 1 countries have access only
up to the amount of their own contribution to the Fund and then only for certain purposes, such as crises
and projects that contribute to regional “public goods”.7
2.1.2 The Corporate Planning Department of the Bank calculates the country allocations, according to a
formula, with inputs from other branches of the Bank. In particular, the Country Analysis and Policy
Unit of the Economics Department has in the past provided country scores on “policy and institutional
performance”.
2.2 The Allocation Formula
2.2.1 The allocation formula of CDB’s Special Development Fund, is shown below (See Appendix C
for the formulae of other multilateral development banks). The CDB formula is multiplicative. It contains
three factors to reflect country need (population, per capita income, and vulnerability) and two factors to
reflect country performance (a policy-and-institutional performance score and a portfolio performance
score). Each member country receives an allocation in proportion to its allocation score.
Allocation score = (country need) x (country performance)
= (logPOP x GNPpc -0.9
x VUL 2.0
) x (0.7PRES+0.3PORT) 2.0
Where:
logPOP = the logarithm of population
GNPpc = gross national product per capita
VUL = country vulnerability (according to CDB’s index of member country
vulnerability)
PRES = country performance on policy and institutions (similar to the World
Bank CPIA)
PORT = performance of the country’s portfolio of CDB loans
2.2.2 Factors in the formula have two kinds of “weights”. First, the two component factors in “country
performance” (PRES and PORT) have arithmetic weights (70% and 30% respectively). Second, three
factors are raised to a power (exponent). In general, the larger the absolute value8 of the exponent the
greater the weight of this factor in the formula.
2.2.3 CDB gives greatest weight to country performance and country vulnerability. Average per-capita
income receives a lesser, but still substantial, weight. Population does not have an exponent, but rather
appears in the formula in logarithmic form. The effect of this is to change the exponential distribution of
population data into a linear form. This does not greatly affect the countries with relatively small
populations but it strongly moderates the influence of “population” for the largest member countries.
2.2.4 CDB has two main options for its allocation formula in future:
1. CDB could keep its existing allocation formula. The advantages are continuity,
experience and customisation to CDB’s own priorities (both in terms of the weights of
REVIEW OF THE UNIFIED SPECIAL DEVELOPMENT FUND RESOURCE ALLOCATION SYSTEM
- iv -
various factors and by including a “vulnerability” factor). The disadvantages include
complexity (compared with the IDB formula, for example) and some degree of lack of
harmonisation with the major multilateral development banks, particularly in regard to
their treatment of “governance” in the allocation formula. However, while maintaining
the existing type and structure, CDB could modify its allocation formula to include a
governance factor or, more sensibly, could give the existing governance cluster in the
Poverty Reduction Effectiveness Situation (PRES) greater visibility and greater weight.
The advantages are, first, that this might contribute towards giving governance more
importance in CDB’s dialogue with member countries, not a bad thing when CDB is
considering major policy-based loans; and, second, harmonisation with other Multi-
lateral Development Banks (MDBs) that follow the World Bank/International
Development Association (IDA) model would be enhanced.
2. Alternatively, CDB could change its allocation formula to be similar to the IDB formula.
The advantages are simplicity and harmonisation within the Americas region. The
disadvantages are discontinuity with CDB’s established approach, and the likelihood that,
as harmonisation proceeds, the MDBs will take the World Bank/IDA type of formula as
the standard.
Recommendation 1:
2.2.5 The World Bank/IDA, the Asian Development Bank (ADB), and the AfDB have harmonised on a
single formula (or, at least, very similar formulas). If the Inter-American Development Bank (IDB)
decides to harmonise with this group, despite the manifest advantages of its own simpler formula, then
the case for CDB to do the same would be strong. However since the World Bank/IDA intends to review
and perhaps change its allocation formula during the IDA 15 negotiations in 2007, we recommend that
CDB wait to see the result before deciding on any changes to its own formula (apart from a change in the
weight of “portfolio performance” – see recommendations number 13).
2.3 Reallocations
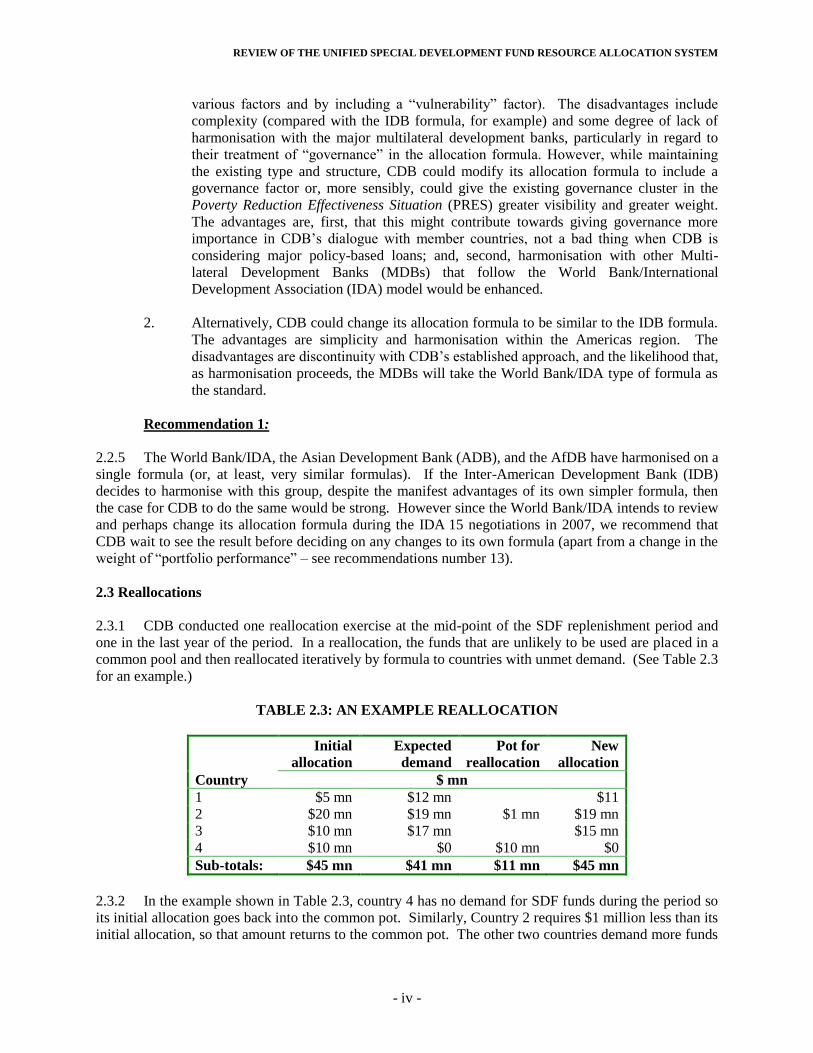
2.3.1 CDB conducted one reallocation exercise at the mid-point of the SDF replenishment period and
one in the last year of the period. In a reallocation, the funds that are unlikely to be used are placed in a
common pool and then reallocated iteratively by formula to countries with unmet demand. (See Table 2.3
for an example.)
TABLE 2.3: AN EXAMPLE REALLOCATION
Country
Initial
allocation
Expected
demand
Pot for
reallocation
New
allocation
$ mn
1 $5 mn $12 mn $11
2 $20 mn $19 mn $1 mn $19 mn
3 $10 mn $17 mn $15 mn
4 $10 mn $0 $10 mn $0
Sub-totals: $45 mn $41 mn $11 mn $45 mn
2.3.2 In the example shown in Table 2.3, country 4 has no demand for SDF funds during the period so
its initial allocation goes back into the common pot. Similarly, Country 2 requires $1 million less than its
initial allocation, so that amount returns to the common pot. The other two countries demand more funds
REVIEW OF THE UNIFIED SPECIAL DEVELOPMENT FUND RESOURCE ALLOCATION SYSTEM
- 4 -
than they were initially allocated and, in total, more funds than are available. Therefore the funds in the
common pool are reallocated by the standard allocation formula to the two countries that have effective
unmet demand. How well each does in the re-allocation depends on its need and performance scores, as
usual. The important point is that funds that are available for reallocation are reallocated by formula, not
ad hoc.
2.3.3 However, CDB has, on occasion, made ad hoc changes to allocations in the face of absorptive
capacity constraints in some countries and unmet demand for loans in other countries. This raises the
question whether a reallocation every two years is sufficiently frequent. Most multilateral development
banks, including the World Bank and the ADB reallocate their concessionary resources annually. Some
reallocate even more frequently. The International Fund for Agricultural Development (IFAD), for
example, conducts a reallocation immediately after the initial allocation to cope with the fact that it has a
large number of small members that are unlikely to borrow during a particular allocation period, and then
re-allocates annually at a minimum.
2.3.4 More frequent formula-based allocations are preferable to less frequent allocation exercises
combined with case-by-case adjustments. However there is no “correct” allocation period. If allocations
move too far out of alignment with effective demand, short of the two-year milestone, then a formula-
based reallocation is in order.
Recommendation 2:
2.3.5 We recommend that CDB reallocate its SDF (U) resources every two years at a minimum, as is
present practice, or annually if circumstances require.
2.4 Other MDB Allocation Formulas
2.4.1 The allocation formulas used by other multilateral development institutions are shown in
Appendix C Tables 2 and 3. There are two main types of formula: (1) a complex multiplicative formula
with exponent weights as exemplified by the World Bank; and (2) a simpler additive formula with
percentage-share weights, as exemplified by the IDB.
2.4.2 The CDB formula is similar to the World Bank/IDA formula, as it existed in 2001 when the CDB
adopted a formula approach. However there are some important differences. The CDB formula gives
much less weight to population than the World Bank formula does. In effect this means that the CDB
gives relatively more weight to poverty, vulnerability, the environment and country performance.9 CDB
also added a second “needs factor” (vulnerability) that is not part of the World Bank formula.
2.4.3 In a multiplicative formula one cannot change the weight of one factor, or add a factor, without
changing the relative weights of all the other factors, sometimes quite radically. The interaction between
factors is complex. Consequently, some member countries have criticised the allocation formula because
it is difficult for a government to understand what are the most important things it needs to do to improve
its allocation.
2.4.4 This complexity was magnified when the World Bank/IDA changed its formula, thereby double
counting “governance” and giving the “governance factor” a sub-exponent. That is, the current World
Bank/IDA formula has exponents on exponents. Not surprisingly, simplification is one of the main
themes of discussion at present, and World Bank management has undertaken to place simplification
options in front of the IDA Deputies during the IDA 15 replenishment negotiations.
REVIEW OF THE UNIFIED SPECIAL DEVELOPMENT FUND RESOURCE ALLOCATION SYSTEM
- iv -
“… Management proposes that the country performance rating formula be simplified and
its outcomes be made less volatile. Simplification of the formula is necessary at a time
when IDA is taking steps to be transparent about how its resources are allocated through
public disclosure of its country performance assessments. A simpler formula would
promote a clearer understanding among partner countries of which factors most
influence IDA allocations.”10
2.4.5 In contrast, the allocation formula of the IDB11
is much simpler. (Appendix C, Table 2) IDB
decides how much weight it wants to give to country need and how much to country performance. It then
divides the total money accordingly into two pots and allocates each pot of money separately. For
example, suppose IDB has $100 of Fund for Special Operations (FSO) monies to allocate. If the Bank
decides to give 60% weight to country performance then it sets aside $60 and allocates that amount
among member countries strictly according to their performance scores alone. The remainder, $40, is
allocated among the same countries but according to the “country needs criteria” alone. It is a simple
system and no econometrics is needed to understand the weight of each factor in the formula. For this
reason the IDB Board is able to understand and control the allocations whereas the World Bank/IDA
Board relies more on expert staff for guidance.
2.4.6 The African Development Bank (AfDB) has adopted a formula that is similar to the World
Bank/IDA formula, except in two aspects: (1) the “governance factor” in its allocation formula does not
have a separate exponent and is, therefore, less complex) and (2) the AfDB adds a “post-conflict
enhancement factor” to its formula rather than dealing with post-conflict countries separately, with a
separate set of performance criteria, as the World Bank does.
2.4.7 In 2005 the ADB set out to harmonise its allocation formula with the World Bank/IDA system.
However it did not like the obvious double counting of “governance”, which in the World Bank/IDA
formula appears both in the “policy and institutional performance” factor and also separately as the
“governance factor”. Therefore ADB removed the “governance cluster” from its policy and institutional
performance score and had it only as a stand-alone factor in the formula. ADB then chose exponents for
each factor in its allocation formula that, together, result in allocations that are identical to those that ADB
would obtain if it used its own data and the World Bank/IDA formula. In summary, ADB has a more
elegant, but still complex, formula that produces the same allocation results that the World Bank/IDA
formula would produce if used with ADB data.
2.4.8 IFAD is an interesting case among the small agencies because, like CDB, it took the World
Bank/IDA formula, changed the exponents to fit its own priorities (giving much more weight to relative
poverty, for example, and much less weight to population) and added a new factor that reflects its special
mandate (a policy and institutional performance score for the rural sector alone). This is similar to what
CDB has done with its formula, except that CDB added a vulnerability factor that reflects regional
conditions rather than reflecting a particular sector mandate as in the case of IFAD.
REVIEW OF THE UNIFIED SPECIAL DEVELOPMENT FUND RESOURCE ALLOCATION SYSTEM
- 6 -
3. POLICY AND INSTITUTIONAL PERFORMANCE
3.0 Defining “Policy and Institutional Performance”
3.0.1 One of the two measures of country performance in CDB’s allocation formula is called the
Poverty Reduction Effectiveness Situation. It is a measure of policy and institutional performance, based
on seventeen performance criteria. (See Appendix C, Table 4). Bank staff assigns a score to each country
on each criterion, in light of the information available and professional judgement.
3.0.2 Other multilateral development banks use similar variables12
for the same purpose.13
This is
partly because most of the allocation formulas were adopted soon after the publication of World Bank
research that indicated that development aid was effective only in the context of good policies and
institutions14
in the recipient country.15
However the adoption of this variable also reflects a reluctance to
assess country performance by results. It was thought that economic growth, for example, is affected by
too many exogenous variables to be a good measure of government performance, at least in the short
term.
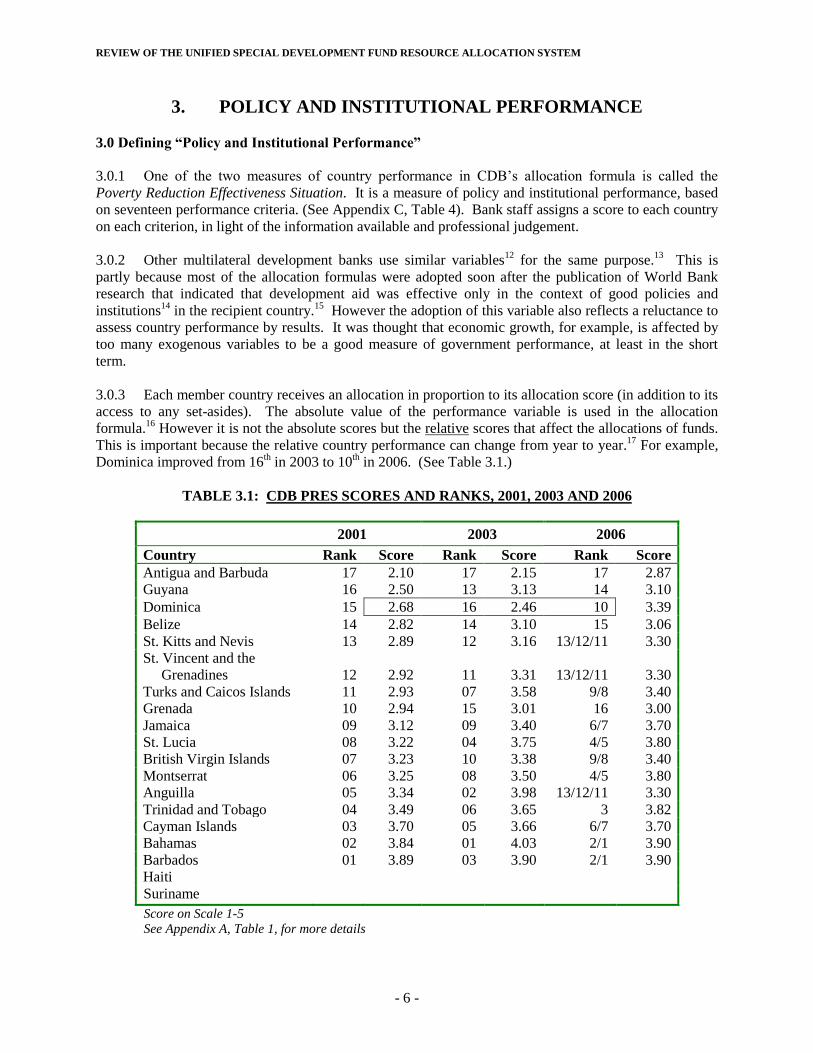
3.0.3 Each member country receives an allocation in proportion to its allocation score (in addition to its
access to any set-asides). The absolute value of the performance variable is used in the allocation
formula.16
However it is not the absolute scores but the relative scores that affect the allocations of funds.
This is important because the relative country performance can change from year to year.17
For example,
Dominica improved from 16th in 2003 to 10
th in 2006. (See Table 3.1.)
TABLE 3.1: CDB PRES SCORES AND RANKS, 2001, 2003 AND 2006
2001 2003 2006
Country Rank Score Rank Score Rank Score
Antigua and Barbuda 17 2.10 17 2.15 17 2.87
Guyana 16 2.50 13 3.13 14 3.10
Dominica 15 2.68 16 2.46 10 3.39
Belize 14 2.82 14 3.10 15 3.06
St. Kitts and Nevis 13 2.89 12 3.16 13/12/11 3.30
St. Vincent and the
Grenadines 12 2.92 11 3.31 13/12/11 3.30
Turks and Caicos Islands 11 2.93 07 3.58 9/8 3.40
Grenada 10 2.94 15 3.01 16 3.00
Jamaica 09 3.12 09 3.40 6/7 3.70
St. Lucia 08 3.22 04 3.75 4/5 3.80
British Virgin Islands 07 3.23 10 3.38 9/8 3.40
Montserrat 06 3.25 08 3.50 4/5 3.80
Anguilla 05 3.34 02 3.98 13/12/11 3.30
Trinidad and Tobago 04 3.49 06 3.65 3 3.82
Cayman Islands 03 3.70 05 3.66 6/7 3.70
Bahamas 02 3.84 01 4.03 2/1 3.90
Barbados 01 3.89 03 3.90 2/1 3.90
Haiti
Suriname
Score on Scale 1-5
See Appendix A, Table 1, for more details
REVIEW OF THE UNIFIED SPECIAL DEVELOPMENT FUND RESOURCE ALLOCATION SYSTEM
- iv -
3.1 CDB Review of the PRES
3.1.1 In 2006 CDB undertook a review of the PRES.18
The resulting Discussion Note concluded that
the process is basically sound and largely harmonised with the World Bank/IDA and other multilateral
development banks. The Note recommended two main reforms. First, the scoring process needs
improvement19
and, second, the scoring instrument needs improvement.
3.1.2 The Discussion Note describes when each score (1 to 5) is appropriate for each of the PRES
performance criteria. It also makes reference to relevant literature and data series.
3.1.3 However it does not address the matter of scored sub-criteria that has been the key development
at the World Bank during the past three years. The World Bank/IDA has developed scored sub-criteria
(typically three or four for each criterion). That is, it has broken its 16 policy and institutional
performance criteria into sub-criteria. It is the sub-criteria that are scored directly. The score on each
criterion is the average of the scores on its sub-criteria. The intent is to make the scoring more consistent
across countries by scoring at the concrete sub-criterion level rather than at the level of general criteria.
3.2 The PRES and the World Bank Country Policy and Institutional Assessment (CPIA)
3.2.1 CDB’s PRES variable is based on the World Bank/IDA CPIA variable, as it existed in 2001. At
that time there were twenty criteria in the CPIA, each equally weighted (5%). They were arranged in four
clusters. CDB took a similar approach, although it gave poverty issues greater visibility. Also, CDB
made “environmental sustainability” a fifth “cluster” of criteria, rather than being only one criterion
within the “economic management” group. This was to reflect the importance and the fragility of the
environment in the Caribbean. Environmental sustainability was given a weight of 10% and, to enable
this, the weight of “structural policies” (trade, financial sector, and business environment) was reduced
from 25% to 15%. (Appendix A, Table 3 shows a comparison between CDB criteria and World
Bank/IDA criteria in 2006).
3.2.2 Over time, both CDB and the World Bank/IDA have modified their formulas, so they are
different from five years ago. For example, the World Bank/IDA has reduced the number of criteria from
20 to 16. Describing the recent changes the World Bank/IDA staff have said:
“Measurement has improved… To begin with, the criteria underpinning the ratings
have become very explicit. Previously, they were specified only for the top and bottom
ratings (for ratings “2” and “5” to be precise) and were not very exhaustive. They now
cover all rating levels (from “1” to “6”) in detail. In addition, each question is
currently made up of two to four sub-ratings, which need to be evaluated separately.
Country teams are therefore discouraged from basing their ratings on selected areas in
which the country performs particularly well, but have to address all areas ...
Moreover, country teams have to provide written explanations that justify their ratings.
Finally, the Bank-wide reviews of the regions’ (proposed scores) have become more
thorough. The networks perform more in-depth quantitative and qualitative analysis,
often complemented by external indicators… (Performance scores) also benefit from
the advances made by other agencies in improving measurement... Despite these
measures, as with other governance indicators, CPIA is still subject to certain
measurement errors.”20
REVIEW OF THE UNIFIED SPECIAL DEVELOPMENT FUND RESOURCE ALLOCATION SYSTEM
- 8 -
3.3 Scoring Procedures and Rating Team
3.3.1 The PRES for each country is calculated as a weighted average of its criteria scores. The weights
are defined in the working paper “Allocation of the Special Development Fund Resources (Fifth Cycle),
June 2001”. The PRES score reflects the quality of the country’s current policy/institutional performance
– its actual situation not its stated intentions. Development results (such as growth rates) are taken into
account, but these are influenced by many factors beyond a government’s control. The main focus is
policies and institutions, which are within its control.
3.3.2 In the past CDB’s Country Analysis and Policy Unit of the Economics Department of the CDB
has scored the PRES. Each Country Economist makes the score for his or her assigned countries.21
Thereafter, a general meeting of all of the economists in the Unit discusses the performance scores. In
2005, functional specialists in Projects Department (environment, gender, social development) were asked
to contribute to the country performance scores in regard to criteria related to their specialties. If there
were a lack of consensus on a performance score for a particular country and criterion, the Head of the
Economics Department has made a final determination.
3.3.3 There is an alternative approach. The World Bank separates the analysis of scores (the “work-
up”) from the scoring itself. Country economists and functional (network) specialists develop suggested
scores and short supporting texts, but a Rating Team of senior managers, chaired by a senior policy
advisor to the President, decides the final scores (not the country economists). Of course this requires
senior managers’ time, which is scarce; but it would have many potential benefits both within the Bank
and in terms of the external credibility of the performance ratings. We believe that it is worth senior
manager time to consider the broad range of BMC performances in depth once a year.
Recommendation 3:
3.3.4 We recommend that CDB convene a Country Performance Rating Team once each year to
consider, revise if necessary and approve the PRES country performance ratings. The Rating Team
should comprise a small number of executive managers. One good design would be to have the Vice
President (Operations) as Chair, and, as members, the Director - Economics, the Director - Projects, and
the Director - Finance and Corporate Planning. To minimise the time burden, the size of the team should
be kept to four.
Recommendation 4:
3.3.5 The Rating Team should be supported by the country economists and by topic specialists in
Projects Department. We recommend that the input of the country economists should be coordinated by
the Chief Country Economist who should present proposed performance scores to the Rating Team for
those criteria most relevant to the economists’ expertise. The input of the functional specialists should be
coordinated, and presented, similarly by the Division Chief, Project Services Division. For each
performance criterion, country economists in Economics Department and functional specialists in Projects
Department should prepare worksheets of suggested scores on each criterion, each with a supporting text.
The rating meeting should be held in February and the background work for the scoring exercise should
be integrated with the development of CDB’s Annual Economic Review.
Recommendation 5:
3.3.6 We believe that the Bank is ready to make wider use of the performance scores in policy
dialogue. This should be selective. If, for example, the Bank selected one “country performance
REVIEW OF THE UNIFIED SPECIAL DEVELOPMENT FUND RESOURCE ALLOCATION SYSTEM
- iv -
criterion” each year for intensive review (including a cross-country comparative study of performance led
by Economics or by PRSD) it would be well prepared to present and explain country rankings on that
criterion. The Annual Economic Review would, in our opinion, be a good venue for such discussion.
3.4 The Scoring Questionnaire
3.4.1 To reduce subjectivity, CDB and the World Bank both use a “questionnaire” to help score policy-
and-institutional performance.22
For each performance criteria, the questionnaire describes the
circumstances in which it is appropriate to assign a score of 1, 2, 3, 4 or 5.23
The CDB questionnaire was
based on the World Bank questionnaire in 2000, with some relatively minor customisation.
3.4.2 In the years since two things have happened. First, the pressure to harmonise procedures across
the multilateral development banks has increased; and, second, the World Bank questionnaire has become
more sophisticated. Specifically, in the past two years the World Bank has added sub-criteria to each
main performance criterion. The sub-criteria number 46, about three per main criterion. It is these sub-
criteria that are now scored, although the questionnaire has not been fully redeveloped to reflect this. In
general the sub-criteria have equal weights and each main criterion score is a simple average of its sub-
criteria scores. In two cases the sub-criteria have different weights. Other MDBs take a similar approach
with some differences in details.24
3.4.3 CDB could continue to develop and customise its performance criteria, adding sub-criteria as the
World Bank has done and developing a more extensive questionnaire for country performance scoring, or,
alternatively, CDB could use the World Bank questionnaire. There is at least one precedent for this since
the ADB decided in 2005 to use the World Bank questionnaire in future. If CDB further develops its own
questionnaire, it requires a great deal of work, especially to develop sub-criteria and guidelines for
scoring them. Experience in the first five years of CDB’s system indicates that finding staff time to
develop the questionnaire and keep it current is not easy. Using the World Bank questionnaire would
result in substantial savings in the economist and sector specialist time that would otherwise be needed to
keep a questionnaire up to date. Using the same questionnaire would also facilitate some joint
benchmarking of country performance by CDB and the World Bank.
3.4.4 On the other hand, if CDB decided to harmonise fully with the World Bank questionnaire, it
would lose some of the nuances that are possible when one crafts a customised approach. However the
structure of CDB’s questionnaire is already very similar to the World Bank’s. Its results, in terms of
ranking country performance, are probably the same as they would be if the same scorers used the World
Bank questionnaire, or very similar.
3.4.5 Even if CDB used the World Bank questionnaire, it could keep its own priorities for country
performance. That is, CDB could use the World Bank questionnaire but assign its own weights to the
criteria therein.
3.4.6 In 2001 the full harmonisation option was not open because the World Bank/IDA scoring
exercise, and the resulting scores, were secret. Scores were not disclosed even to the IDA Deputies,
except in broad ranges (quintile groups). This has changed. With full disclosure in 2007, harmonisation
and collaboration with CDB on the questionnaire and benchmarks have become viable options.
Recommendation 6:
3.4.7 We recommend that CDB adopt the World Bank/IDA policy and institutional performance
questionnaire, while keeping its own criteria weights and applying its own judgment to generate scores.
The PRES will need minor adjustments to cope with this change in scoring instrument.
REVIEW OF THE UNIFIED SPECIAL DEVELOPMENT FUND RESOURCE ALLOCATION SYSTEM
- 10 -
Governance as a Performance Criterion
3.4.8 Governance is important to all aspects of development and particularly important in the context of
debt problems and policy-based lending. The CDB PRES contains a cluster of criteria called
“Governance/Public Sector Management”, which covers the rule of law, anti-corruption and
accountability institutions, civil service, revenue mobilisation and budgetary management; and
management and efficiency of public expenditures. (See Appendix C, Table 5 for a comparative view of
the weight of “governance” in the MDBs’ concessionary resource allocation formulas.)
3.4.9 The World Bank recently published a review of its experience with “governance” in the
concessionary resource allocation formula.25
“Governance” is one of the clusters of criteria in its
assessment of CPIA, entitled “Public Sector Management and Institutions”.
3.4.10 The World Bank cluster contains five criteria: (1) property rights and rule-based governance; (2)
quality of budgetary and financial management; (3) efficiency and equity of revenue mobilisation; (4)
quality of public administration; and (5) transparency, accountability & corruption in the public sector. In
both the CDB and the World Bank/IDA this cluster of criteria has a weight of 25% in the assessment of
country policy and institutional performance.
3.4.11 The World Bank/IDA has experimented with various ways to emphasise “governance” in its
allocation formula, without great success. In its current allocation formula, the World Bank/IDA has
combined this cluster with the “procurement efficiency indicator” from its Annual Review of Portfolio
Performance and called the combined variable “governance”. It is, clearly, mainly public sector
management rather than governance more broadly defined.26
The previous approach (a “governance
factor” used to discount allocations) was deemed too draconian and the current approach (double counting
the public sector management criteria in the allocation formula) does not seem appropriate either.
“The PBA formula has become more complex. Double counting the CPIA governance
cluster and the procurement flag from the ARPP, and introducing an exponential
multiplier in the form of the governance factor, has made the calculation and
interpretation of the country performance rating more complex. As a result, it is difficult
to say how much each component contributes to and weighs within the formula. This
complexity of the formula is especially problematic at a time when IDA is taking steps to
be transparent about how its resources are allocated through public disclosure of its
country performance assessments. Explaining how allocations change at the country
level due to changes in underlying country performance is not straightforward and this
difficulty has surfaced regularly in conversations with country teams and governments
who want to know what impact improvements in certain components or clusters of the
CPIA would have on the final country performance rating, and therefore allocation.”27
Recommendation 7:
3.4.12 CDB has selected an appropriate weight for the “governance cluster” of performance criteria in
the PRES. Nothing additional is needed to emphasise its importance.
3.5 Sector Specialists, Thematic Studies and Country Performance Scores
3.5.1 One of the key challenges in managing CDB’s concessionary resource allocation system is
finding a way to generate country performance scores for each performance criterion. To date the Bank
has relied on the professional judgment of the country economists, with some assistance from sector
specialists in 2006. One can see the rationale for the economists to do the scoring for those performance
REVIEW OF THE UNIFIED SPECIAL DEVELOPMENT FUND RESOURCE ALLOCATION SYSTEM
- iv -
criteria closest to the economists’ expertise, including the following items in the performance
questionnaire: Trade Policy, Financial sector efficiency and soundness; Factor and product markets and
prices; Revenue mobilisation and budgetary management; Management and efficiency of public
expenditures; Fiscal policy, Monetary policy and External financing policies.
3.5.2 However there are other PRES criteria that may be closer to the sector expertise to be found in the
new Project Services Division of Projects Department. These include:
- Social Analysts:
Framework for poverty reduction policy. Enhancing the human capital of the poor.
Enhancing the economic capital of the poor. Equity and social safety nets.
- Gender Specialist:
Gender, empowerment and participation
- Governance Specialists:
Rule of law. Anti-corruption and accountability institutions. Civil service
- Environmental Specialists:
Environmental laws, regulations and institutions. Environmentally damaging subsidies
and other damaging practices
3.5.3 Specialists could score these criteria in the same way as the economists presently score them.
However, progressively, they need to be supported by cross-country thematic studies to be really well
based. Perhaps only one such study could only be undertaken each year because they are expensive, but
in the long run they are very important to CDB’s expertise and credibility.
Recommendation 8:
3.5.4 (A) We recommend that responsibility for different PRES criteria be divided between Economics
Department and Project Services Division to do the work-up of possible scores for the Rating
Committee to consider. A work-up will comprise the suggested scores by country for each
criterion supported by a short comparative text.
3.5.5 (B) The scores and supporting text will involve professional judgment supported by periodic
cross-country-comparative thematic studies. We recommend that commissioning such thematic
studies should be an eligible use of SDF (U) funds.
3.6 Harmonisation and Cooperation with Other MDBs
3.6.1 The idea of benchmarking is to assess the performance scores of one or more countries in detail
so that the scorers of other countries’ performance have something against which to judge appropriate
scores. Benchmarks would improve the consistency of scoring within the CDB and, possibly, between
the CDB and other multilateral institutions that also score Caribbean countries’ performance.
3.6.2 A ‘benchmark’ BMC may be selected for each performance criterion. The benchmark country
could be different for each criterion, if appropriate, or the same for all criteria. The benchmark country is
chosen not because it is likely to receive any particular score, but rather because its performance and the
appropriate score are likely to be clear. Logistically it is generally easier to have a single benchmark
country (although the World Bank had 20 in 2006 to ensure that each region was represented in the
benchmark group).
REVIEW OF THE UNIFIED SPECIAL DEVELOPMENT FUND RESOURCE ALLOCATION SYSTEM
- 12 -
3.6.3 The World Bank/IDA relies on benchmarking to ensure consistency of performance scoring
across countries and regions. For instance in December 2006 the World Bank conducted a benchmarking
exercise in preparation for the main country performance scoring exercise in March 2007. Twenty28
countries were scored against the policy and institutional performance criteria. There were two Caribbean
countries in the benchmark group – Guyana and Grenada.
3.6.4 One can envisage the possibility of a joint benchmarking exercise involving CDB, IDB and the
World Bank/IDA. Similarly one could envisage joint benchmarking of the environmental criteria
between CDB and the Global Environmental Facility (GEF), which also operates a PBA system.
Recommendation 9:
3.6.5 We recommend that CDB explore the possibility of joint benchmarking with other multilateral
development institutions working in the Caribbean, including the IDB and the World Bank. CDB should
send an economist, one or more sector specialists and an evaluator from Evaluation and Oversight
Division (for general methodology and for the portfolio performance variable) to Washington, D.C. each
year to participate in the joint MDB “country performance benchmarking exercise”, which is generally in
November/December.
3.7 Disclosure, Country Dialogue and Peer Input
Disclosure
3.7.1 CDB has been in the forefront of MDBs in regard to disclosure of all aspects of the performance-
based concessionary resource allocation system. Country performance scores disaggregated to the level
of individual criteria have been available to the Board and to any country that wishes to ask. (See
Appendix C, Table 10 for a comparative table of disclosure practices among MDBs).
3.7.2 The World Bank has disclosed less than the CDB. For many years it disclosed only the quintile
ranks of country performance (top fifth, bottom fifth, etc.) It now discloses the performance scores of
each member country, whether IDA eligible or not, but it does not disclose the actual dollar allocations by
country.
3.7.3 Obviously full disclosure is necessary if the PRES is to be a significant part of the CDB’s policy
dialogue with member countries. In principle the PRES provides a framework for country dialogue.
Written text in support of the PRES scores would be a useful addition. It would be sensible, in most
cases, to undertake such a dialogue in conjunction with other MDBs that are also scoring the country’s
performance.
Peer Input to Country Performance Ratings
3.7.4 In the medium term, CDB should engage its BMCs in a dialogue as input to the country
performance scores. At some stage in the future it is conceivable that two or three BMCs each year
(perhaps on a rotating basis) might be invited to participate in the annual meeting of the CDB’s Country
Performance Rating Team, providing a peer perspective on country performance.
REVIEW OF THE UNIFIED SPECIAL DEVELOPMENT FUND RESOURCE ALLOCATION SYSTEM
- iv -
CDB-Country Policy Dialogue
3.7.5 A third kind of dialogue involves “triggers”. The idea is that a country would receive not a single
allocation figure but a range. Thereafter its actual allocation would be high or low in the range depending
on its short-term performance on agreed policy and institutional objectives. The World Bank and ADB
tried to implement “triggers” for some years. In principle the approach may strengthen policy dialogue;
but in practice it proved too complex and too demanding of supervision time, and was discontinued.
Recommendation 10:
3.7.6 (A) We recommend that CDB explore the possibility of an annual discussion with each BMC on
its performance ratings, perhaps jointly with other multilateral institutions that now score country
performance (including World Bank/IDA, IDB, IFAD, and GEF).
3.7.7 (B) To facilitate dialogue, we recommend that each set of scores (by country and by criterion) be
supported by a short written text29
(See Appendix D for an example of a World Bank template for
this purpose). This would involve greater disclosure than the World Bank currently undertakes,
since, at present, it discloses the scores but not the supporting text.
3.7.8 Dialogue could also be facilitated by a system that alerts CDB to projects or portfolios at risk.
The World Bank/ADB “red flag” system performs this function. (Appendix E)
3.7.9 Some multilateral institutions have found that policy dialogue is more possible, and more
productive, when it is related specifically to core aspects of the institution’s mandate. For example, the
GEF calculates a country performance index that is only partly portfolio performance (See Section 4.0
following). It contains two other variables explicitly focused on the environmental mission of the GEF.
(See Appendix F).
3.8 The Influence of PRES on the Allocations
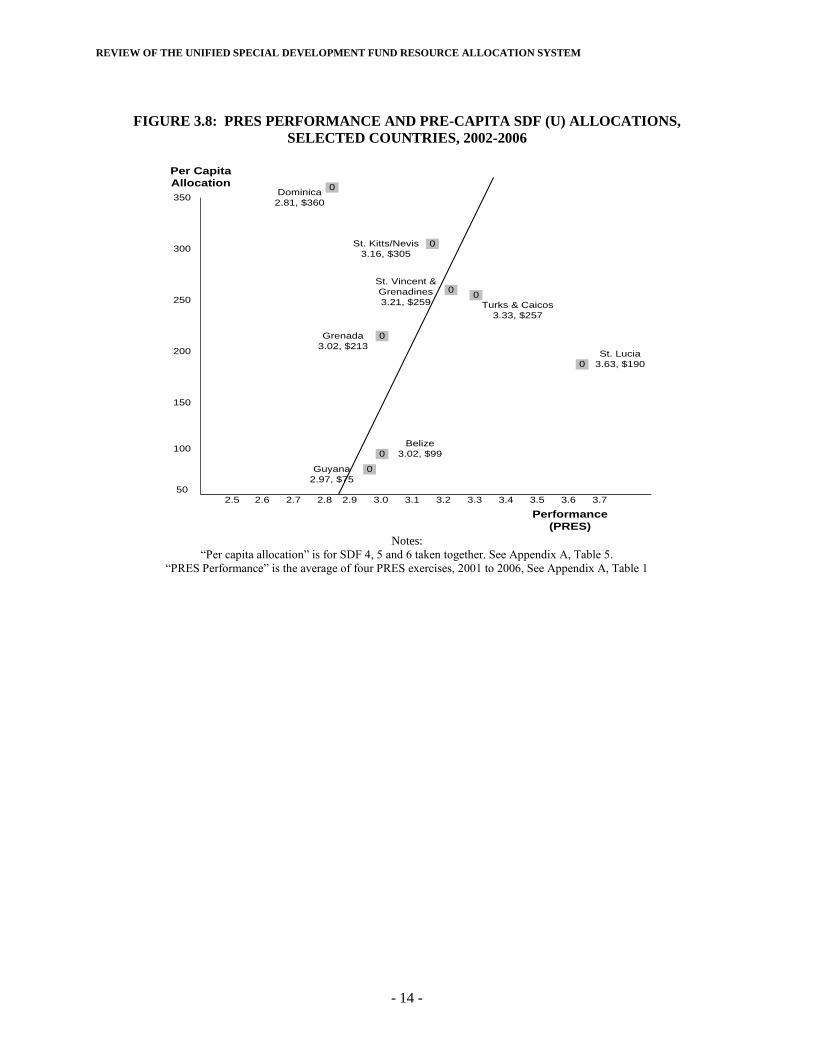
3.8.1 The PRES appears to have had a strong influence on the SDF (U) allocations. For example,
consider the performance scores30
and dollar allocations of six member countries31
, four of which are in
Group 3, one in Group 2 and one in Group 4. These countries display a strong correlation between PRES
performance and SDF (U) dollar allocations. (Figure 3.8). The correlation coefficient is approximately
0.76, which is very high. About 57% of the variability of SDF (U) dollar allocations is explained by
country performance (PRES), in these cases.32
3.8.2 However in some other cases PRES has not been so influential. Dominica, for example, has
received a greater allocation per capita than one would expect purely on the basis of its policy and
institutional performance score.33
In contrast, St. Lucia received a per-capita allocation that was less than
its PRES performance score alone might have predicted. St. Lucia’s population is more than twice
Dominica’s and its per capita income is about 25% higher. On the other hand its portfolio performance
score was better and its vulnerability index higher.
3.8.3 In summary, a country’s PRES performance is, in general, a strong influence on its SDF (U)
allocation, but there are four other factors in the allocation formula, each of which can be influential in a
particular case.
REVIEW OF THE UNIFIED SPECIAL DEVELOPMENT FUND RESOURCE ALLOCATION SYSTEM
- 14 -
FIGURE 3.8: PRES PERFORMANCE AND PRE-CAPITA SDF (U) ALLOCATIONS,
SELECTED COUNTRIES, 2002-2006
100
200
150
250
300
350
2.5 2.6 2.7 2.8 2.9 3.0 3.1 3.2 3.3 3.4 3.5 3.6 3.7
Per Capita
Allocation
Performance
(PRES)
50
0
0
0
00
0
0Dominica
2.81, $360
St. Kitts/Nevis
3.16, $305
St. Vincent &
Grenadines
3.21, $259 Turks & Caicos
3.33, $257
Grenada
3.02, $213
Belize
3.02, $99
Guyana
2.97, $75
0
St. Lucia
3.63, $190
Notes:
“Per capita allocation” is for SDF 4, 5 and 6 taken together. See Appendix A, Table 5.
“PRES Performance” is the average of four PRES exercises, 2001 to 2006, See Appendix A, Table 1
REVIEW OF THE UNIFIED SPECIAL DEVELOPMENT FUND RESOURCE ALLOCATION SYSTEM
- iv -
4. COUNTRY PORTFOLIO PERFORMANCE
4.0.1 All of the multilateral institutions that allocate concessionary resources by formula use “portfolio
performance” as one variable in the formula. It is the minor component in assessing country
performance. (“Policy and institutional performance” is the major component, in all instances.)
4.0.2 CDB gives the performance of the country’s CDB loan34
portfolio a weight of 30% and it gives
policy/institutional performance (PRES35
) a weight of 70%. These weights are similar to those of other
institutions, although both the World Bank/IDA and the ADB give portfolio performance a somewhat
smaller weight. 15%-18% in the case of ADB. (See Appendix G); and 20% in the case of ID (See
Appendix C, Table 3 and Appendix H)
4.1 Defining Portfolio Performance
4.1.1 Most MDBs use a “red flag” system to measure project performance. However they vary in the
way in which “red flags” are converted to a performance score. The World Bank uses a simple measure
of percentage of projects at risk. IDB, in contrast, does not convert raw percentages of problem/alert
projects to a 1-6 scale using an arbitrary equivalence table. Instead the IDB measures a country’s portfolio
performance as the undisbursed amount in problem or on-alert projects compared with the total amount
undisbursed from all current projects in the country (expressed as a percentage).36
(See Appendix I). The
AfDB goes a step further and includes potentially problematic projects as well. (See Appendix J.)
4.1.2 CDB keeps a Project Performance Index (PPI),37
which reports project performance scores based
on the Bank’s PPES. The project performance criteria38
are strategic relevance, poverty relevance,
efficacy, economic efficiency, institutional development impact, and sustainability.39
A country’s
portfolio performance score is the average performance score of all current investment projects.
4.1.3 This is a distinctive system that meets standards of good practice among the MDBs. The
performance index number captures a good deal of information. Its strength is that it is based on the
performance of all active investment loans, not only on the percentage of “projects at risk” as other MDBs
do. However the system needs to be up-dated and extended to cover technical assistance (TA) operations
(at least over a certain size) as well as investment operations.
4.2 The Small Portfolio Volatility Problem
4.2.1 If a country has a small CDB portfolio (say, less than three operations, including TA projects)
then its portfolio performance score might not be a good indicator of its true performance. The
performance score might be unstable, changing substantially when a new project enters or a completed
project leaves the portfolio.
4.2.2 The form of the allocation formula exacerbates this instability. CDB’s allocation formula is a
multiplicative one. Therefore the allocation outcome is equally sensitive to each and every variable in the
formula (putting aside for the moment the issue of different weights for different variables). To make the
point another way, a 25% change in “vulnerability” has the same effect on the allocation outcome as a
25% change in country performance.
4.2.3 However, as a practical matter, the values of some variables do not change much from year to
year (population, per capita income, and vulnerability, for example) and, in contrast, the values of some
variables can change a lot. Therefore it is this second set of variables (PRES and PORT) that tend to
result in changes in allocations from year to year.
REVIEW OF THE UNIFIED SPECIAL DEVELOPMENT FUND RESOURCE ALLOCATION SYSTEM
- 16 -
4.2.4 This is fine if the changes in the variable values are meaningful. Unfortunately this is sometimes
not the case. For example, PORT is quite volatile in an artificial way, and its volatility can lead to major
changes in a country’s allocation for no better reason than a single project has moved into or out of the
country’s small portfolio.
4.2.5 Consider a country with two projects current in year 1. The better project has a PPI of 7.5 and the
worse project a PPI of 2.0. Imagine that in Year 2 this country has only one project still active. If it is the
better project then the country PPI in Year 2 will be 7.5 and if it is the worse project that is still active
then the country PPI will be 2.0. Imagine further that the country’s PRES is 3.0. In the first case the
country performance factor will be (0.7*3.0 + 0.3*7.5)2 = 18.9, and in the second case the country
performance factor will be (0.7*3.0 + 0.3*2.0) = 7.29. To put it another way, this country’s allocation
could be more than twice as large in the second year if the worse project is terminated in Year 1.
4.2.6 This artificial volatility is a serious problem for CDB because several BMCs have small
portfolios of capital invest projects. In 2005, for instance, at the time the PPI was calculated for reporting
to the Board, nine BMCs had two or fewer active capital investment projects. Eight other countries each
had seven or more projects each. The PPI is an unstable measure for the first set of countries and a much
more stable measure for the second set.
Recommendation 11:
4.2.7 We recommend three things to ameliorate the small-portfolio problem in the PORT variable: (1)
CDB should extend its PPI to include all operations, including TA over a certain size and this requires
entering full information into the Portfolio Performance Management System for TA projects as well as
capital investment projects; (2) the country portfolio performance score should be averaged40
over all
project scores for the previous three years, rather than only current projects; and (3) where a country still
has such a small portfolio that CDB judges that its portfolio performance score is not a reliable measure
of its performance, we recommend that PORT be given zero weight in the calculation of these countries’
allocations (that is, country performance would be judged solely by PRES).
4.3 Portfolio Performance Issues
Capital Projects or All Operations?
4.3.1 Most institutions base their portfolio performance scores on all operations. CDB does not
presently score TA operations, so the PPI is based only on investment projects. A recent evaluation of
CDB’s TA operations found no bar to extending performance scoring to all operations.41
If this were
done then the PPI could be based on all CDB operations, which is desirable in itself and would harmonise
the CDB’s approach with other multilateral institutions.
Should “portfolio performance” be based on the PPI or on “projects at risk”?
4.3.2 All other institutions base their “portfolio performance” scores on “projects at risk” which, in
turn, is based on a system of “red flags” (See Appendix E for a comparative table). In 2002 CDB stated
its intention at some time in the future to consider a ‘projects at risk’ variable in its allocation formula for
concessionary resources. It does have such a variable in its Project Portfolio Management System
(PPMS).42
The CDB project-rating form that is completed after each supervision milestone indicates that
the project is ‘at risk’ if more than one ‘red flag’ is up.43
REVIEW OF THE UNIFIED SPECIAL DEVELOPMENT FUND RESOURCE ALLOCATION SYSTEM
- iv -
4.3.3 However CDB does not currently use “projects at risk” in its resource allocation formula. It uses
a PPI, which is the average performance score of all investment projects active at the time. Therefore
CDB is the only MDB to use all its project evaluation data (not only data for “projects at risk”) as the
basis for a ‘portfolio performance’ variable in the resource allocation formula. This should provide a
better basis for the ‘portfolio performance’ variable than projects-at-risk, because it captures information
about the quality of all active projects rather than only the small group of projects at risk. It also helps
avoid or lessen44
certain traps inherent in the at-risk calculation, notably that terminating a non-
performing project (and thereby removing it from the at-risk category) can artificially and counter-
intuitively sharply improve the country’s portfolio performance score. Also, at a practical level, CDB has
so few projects flagged as “at risk” that the measure does not distinguish much among BMCs.45
Recommendation 12:
4.3.4 We recommend that CDB continue to use the PPI (rather than the percentage of projects-at-risk)
as the basis for its “portfolio performance” variable.
The weight of portfolio performance in the allocation formula.
4.3.5 The 30% weight of “portfolio performance” in the “country performance” factor in the PBA
formula is common among multilateral institutions, although the World Bank/IDA gives it less weight
(20%).
Recommendation 13:
4.3.6 We recommend that CDB change the weight of PORT in the country performance factor in the
allocation formula to 20%. This harmonises with the World Bank/IDA and seems a reasonable weight.
When the volatility problems of the variable are remedied, CDB might wish to consider a weight of 30%
again. At the same time CDB should engage with other MDBs to agree on a consensus weight for
“portfolio performance”.
Should portfolio performance be the average of weighted project scores?
4.3.7 The IDB uses of the undisbursed amount in problem/on alert projects (rather than the simple
number of problem/on-alert projects). In effect this weights the performance scores by project size. A
very small project that goes on alert, or a project that goes on alert late in its life, will affect the country’s
portfolio performance score less than large projects and early alerts. CDB does something similar with its
project performance scores, weighting the PPI by loan approval amounts.
4.3.8 On balance the CDB approach seems better. If one weights by the undisbursed balance of the
loan, then a loan project that remains bad throughout its life will gradually influence the country PPI less
and less as its budget gets disbursed.
Recommendation 14:
4.3.9 (A) We recommend that CDB continue to weight its PPI by project size (approved budgets). This
will avoid small operations being overly influential in the country portfolio performance score,
balancing our recommendation that TA operations (which tend to be small) should be included in
the base on which country portfolio performance is calculated. At the same time, weighting by
approved budget avoids the problem encountered by the IDB that a good (or bad) project declines
in influence on the country average PPI as it gradually disburses its monies.
REVIEW OF THE UNIFIED SPECIAL DEVELOPMENT FUND RESOURCE ALLOCATION SYSTEM
- 18 -
4.3.10 (B) The focus on the current state of the portfolio (rather than a longer view) can lead to volatility
in scores.46
For instance the failure and closure of a weak project can result in an improved
country performance score without anything else happening to the portfolio. CDB should count
the score of a project terminated incomplete in calculating the country’s portfolio performance
score in that year; and should consider other ways to penalise non-completion or extremely late
completion of projects.47
Adjustment for the age of the portfolio
4.3.11 New portfolios tend to have an over-optimistic performance score because problems have not yet
had time to emerge. It is difficult to assess the performance of new borrowers [or a new government of
an established borrower, or a country that has several new loans] until sufficient time has elapsed to
expose problems.
4.3.12 Because managers in charge of projects have historically underestimated the number of ‘projects
at risk’,48
the World Bank adjusts the estimate to take into account the average ‘net disconnect’49
observed
in the past between managers’ assessments and actual outcomes.50
If the ‘net disconnect’ for a country
during the most recent World Bank fiscal year was 20% or more, or if net commitments associated with
unsatisfactory projects, as rated by the World Bank Operations Evaluation Department, represent more
than 40% of commitments for completed projects over the past five years, then this raises a red flag.
4.3.13 CDB could prepare an exploratory paper on the disconnect (if any) between early-year PPI scores
and scores on completion. If a significant disconnect is found, CDB could consider an adjustment factor
to each country’s average PPI linked to the average age of the projects in the country portfolio. This is not
a high priority but could be investigated after other reforms to the project performance variable are
complete.
The Scoring Scale
4.3.14 CDB scores portfolio performance on a scale 0-10 and other multilateral development banks
use 1-6. This has no significant implications since (1) the portfolios are different so there is no reason
why a country should receive the same or even similar portfolio scores from different institutions, even if
the scoring is on the same scale; and (2) it is relative performance that matters to the allocation so the
measurement scale is immaterial. However if CDB adopts the World Bank/IDA country performance
questionnaire it would be convenient to adopt the six-point scale at the same time, rather than have to
adjust the related scoring guidelines to a five-point scale.
Recommendation 15:
4.3.15 We recommend that CDB adopt the six-point country performance scoring scale.
REVIEW OF THE UNIFIED SPECIAL DEVELOPMENT FUND RESOURCE ALLOCATION SYSTEM
- iv -
5. COUNTRY NEED 5.1 Defining Country Need
5.1.1 The SDF (U) allocation formula contains three variables related to country need. These are
population, per capita income51
and country vulnerability. Together these variables are a reasonable
surrogate for country poverty, although individually they leave much to be desired as measures of
poverty. In general, CDB, like all other MDBs, needs better measures of poverty in its allocation
formula. IFAD has made some interesting efforts in this regard, using rural population (not total
population) and considering the addition of UN measures of the incidence of malnutrition.
5.1.2 Population and per capita income can be used to indicate relative poverty as long as the
distribution of income is the same in the two countries being compared. However, since that will seldom
or never be the case, a more direct measure of the number of poor people would be preferable – say the
number of people (or families) earning less than the poverty threshold.
Recommendation 16:
5.1.3 We recommend that CDB study three possibilities in regard to the “poverty” variables in the
allocation formula: (1) Replace the population and per capita income variables with the logarithm of the
population earning less than the poverty threshold. This would involve changing the weights of variables
in the allocation formula, since the variables themselves would change. (2) Replace only the population
variable with the population earning less than the poverty threshold. Or (3) make replacements as in (1) or
(2) with extra weight for the level of the indigent population.
Recommendation 17:
5.1.4 The third needs variable is “vulnerability” based on CDB’s Vulnerability Index (2002).52
This
index combines vulnerability to natural disasters with vulnerability to economic shocks. We recommend
that CDB continue to use this variable.
5.2 Fragile States
5.2.1 MDBs have recognised that certain “fragile” states should be treated differently in regard to
concessional resource allocation. In post-disaster, post-conflict or turn-around situations, CDB may need
to be more involved with a particular borrower than the standard resource allocation formula would
indicate. CDB’s Natural Disaster Strategy and Operational Guidelines53
were amended in February 2000
to provide further flexibility for an early response during the initial phase of recovery when dislocations
affecting the poor are greatest. However, loans granted in an emergency situation may not be fully
disbursed, and need to be returned to the fixed allocation ‘pot’ as promptly as possible. At some stage the
residual, if any, needs to be reallocated for other purposes, if it appears that not all the allocation will be
needed for disaster response.
5.2.2 As well, there may be a need for some flexibility in ‘turn-around’ situations – that is, if a country
is undertaking important and difficult reforms, the Bank may need to be supportive sooner than would be
possible if it waits for results to show themselves clearly. In the case of countries that have had poor
policies but have reformed, increased technical cooperation may be warranted as well as, or prior to,
increased lending.
REVIEW OF THE UNIFIED SPECIAL DEVELOPMENT FUND RESOURCE ALLOCATION SYSTEM
- 20 -
5.2.3 New members are in a special situation because they do not have an established track record on
‘CDB portfolio performance’, which is an important factor in the standard allocation formula. This may
not be an immediate problem if early lending volume is low and the new member’s allocation is
determined largely by a need for TA for governance and institutional strengthening, and BNTF-type
projects, as is the case with Haiti. However some method needs to be developed to incorporate new
members and special cases within the PBA system.
5.2.4 (A) A fixed country allocation for a new member is appropriate until the CDB has enough
experience to consider the country’s performance along with other borrowing members in the
normal allocation exercise.
5.2.5 (B) For special cases of new members that have serious governance problems CDB should give a
fixed allocation, as recommended above, and offer to increase that allocation according to
performance on negotiated criteria that might resemble the post-conflict allocation criteria54
used
by other multilateral development banks in similarly unique cases.
5.3 Volatility of Allocations
5.3.1 Some have criticised concessionary resource allocation systems because the allocations are
volatile. A country’s allocation may vary substantially from one period to the next. The volatility of the
allocation depends on its sensitivity to changes in the values of variables in the allocation formula.
5.3.2 In the multiplicative formula, used by the CDB and modeled on the World Bank/IDA type of
formula, volatility in any factor has the same effect on the allocation as volatility in any other factor. That
is, a 20% change in population of a country will have exactly the same effect on its allocation as a 20%
change in its per capita income or a 20% change in its country performance score. If one is multiplying
several factors together it does not matter which one increases by 20% because the number resulting from
the whole multiplication of all factors (which determines the allocation share) will be 20% larger
whichever factor actually increases.
5.3.3 However, of course, the factors in the allocation formula are not typically equally volatile. Low
volatility factors include population, per capita income, and (in the CDB formula) vulnerability. That is,
the “country needs” factors do not tend to be volatile. In contrast, the country performance factors can be
very volatile. The relative scores of a country in regard to policy-and-institutional performance, portfolio
performance or governance can change markedly from one period to the next. The most volatile factor
tends to be “portfolio performance” especially when the country has a small portfolio of CDB loans. One
good or bad loan can make a large difference to the country’s performance score.
5.3.4 In practical terms the volatility of a country’s allocation is determined by its relative scores on
each factor in the formula, and the propensity for its scores to change.55
If there is little difference among
country scores on a particular factor then this factor will make little difference to the allocation outcome.
Similarly, if the relative scores of the member countries in regard to a particular factor in the formula do
not change much over time, then this factor will contribute little to volatility. The term “relative” is
important. If eligible member countries were subject to a lot of volatility in, say, their “vulnerability”
scores, but these scores always moved up or down together, then this factor would have little influence on
the resource allocations. It is change in the relative scores that affects allocations. Therefore the type of
volatility that matters is the volatility of relative scores.
5.3.5 On average CDB scores of country policy and institutional performance, made four times
between 2001 and 2005, varied by 0.44 between the low and the high score. (Appendix A, Table 1) Eight
countries out of 17 had differences between low and high scores that were greater than 0.5. The country
REVIEW OF THE UNIFIED SPECIAL DEVELOPMENT FUND RESOURCE ALLOCATION SYSTEM
- iv -
whose scores varied the most was Dominica and the country whose scores varied the least was Barbados.
The average score across all member countries rose each time the scoring was undertaken, increasing
from 3.11 in 2001 to 3.45 in 2005. Therefore some of the apparent volatility may be a result of “grade
inflation”. The alternative explanation is that policy and institutional performance has in fact improved
significantly in the Caribbean from 2001 to 2005. Only one country received a lower score in 2005 than
in 2001, Anguilla.
5.3.6 The World Bank/IDA Deputies have identified volatility of allocations as one of two themes
(along with complexity) for discussion during the forthcoming IDA 15 negotiations.
“Another possible area for modification (of the allocation formula) to reduce
volatility relates to the portfolio performance ratings. If this would be of interest to
the Deputies, management will explore options for simplifying the formula for
discussion during the IDA15 replenishment deliberations.”56
5.3.7 The discomfort with volatility is partly fed by the related discomfort with complexity. That is,
volatility is less acceptable if it is difficult to understand the reasons for it. To some degree volatility is
inevitable in a system that distributes a fixed amount of money according to relative scores. Sometimes a
country’s allocation will go up without any absolute improvement on its part (other countries’ scores
decline) and sometimes its allocation will go down although its performance improves (other countries’
scores improve more). On the other hand, some of the opacity is the result of the World Bank’s choice of
a particularly complex allocation formula. To a lesser extent one can say the same thing about the CDB
formula.
5.3.8 The allocation system of the IDB is, in practice, less volatile. This is because it treats needs and
performance separately; and the “country needs” factors, as mentioned above, are not volatile. Countries
tend to keep their relative positions in regard to population, per capita income and vulnerability.
Therefore the pot of money allocated solely according to country needs (typically about 40% of FSO
funds) tends to be shared among member countries in much the same proportions from one period to the
next. In contrast, the 60% of FSO funds allocated according to country performance is subject to the
same high volatility as shown by the multiplicative-formula allocations (World Bank/IDA, ADB, AfDB,
and CDB). To summarise, a country’s total allocation from IDB has one volatile component and one
stable component – so, overall, it tends to be less volatile than the fully multiplicative systems. The result
is somewhat analogous to investing some money in stable bonds and some in volatile growth stocks.
A Volatility Problem?
5.3.9 Is volatility of allocations, then, a problem or not? It is a problem if the volatility of some factors
in the formula is more apparent than real. For example, a country’s score on portfolio performance may
be volatile for no better reason than the inherent lumpiness of a small portfolio or an unreasonably short
timeframe over which portfolio performance is measured. The classic problem has been a small portfolio
in which a badly performing project is terminated thereby cleaning it up and resulting in a better portfolio
performance score. This problem can be alleviated to some degree by lengthening the measured
performance period, using a “rolling” measure instead of a current snapshot of performance; and by
instituting some kind of demerit for projects terminated incomplete. If these reforms were instituted, then
“portfolio performance” would become more like “policy and institutional performance” – that is, still
volatile but largely in a meaningful way.
5.3.10 Policy and institutional performance (and the related “governance” factor in the formulas of the
World Bank/IDA, ADB and AfDB) tend to be somewhat volatile. This is because the effective range of
scores on country performance is from about 2.5 to about 4.0 on the scale 1 to 6 (World Bank/IDA) or
REVIEW OF THE UNIFIED SPECIAL DEVELOPMENT FUND RESOURCE ALLOCATION SYSTEM
- 22 -
about 2.0 to 3.5 on the scale 1 to 5 (CDB). That is, the scores are compressed within a small range.
Therefore a small change in score, say from 2.0 to 2.5, can have a large effect on the relative score, and it
is the relative score than counts. Consider a simple illustration of an allocation between two countries
that, in one allocation period, score 2.0 and 3.0 on country performance. If everything else is equal,
Agroland will have an allocation score of 4A and Upland will have an allocation score of 9A, since
country performance has an exponent of 2.0 (the score is squared). Therefore Agroland will receive an
allocation of 4/13 of the whole amount of money available for allocation. Out of $100 it will receive an
allocation of $30.77.
5.3.11 Suppose now that Agroland increases its country performance score from 2.0 to 2.5, not a major
step although a significant one. Its allocation number is now (2.5)2
= 6.25, and it will receive an
allocation of 6.25/(6.25+9)*100 = $41. Its allocation has increased by a little more than one third in
response to the minimum possible change57
in its country performance score. The question is this – is a
change in a country’s performance score from 2.0 to 2.5 important enough to justify an increase of one
third in its total allocation? Is the allocation appropriately sensitive to country performance or over-
sensitive?
5.3.12 Policy and institutional performance can change substantially in a short period, for better or for
worse, sometimes with a change of government regime. To the extent that the change is real and
permanent it is appropriate that it be reflected in the country’s dollar allocation. However if a country has
a record of erratic performance one might not want to penalise it or reward it in quite the same way as if
the deterioration or improvement were smooth and continuous. This kind of volatility of country
performance, which is a form of country risk, should be penalised, but there is no way to do this within
the existing formulas.
5.3.13 Measuring country performance over a longer period, rather than taking a current snapshot each
year, would stabilise the scores. However this would be a superficial solution. It would make country
performance look more stable than it really is.
5.3.14 This report has made recommendations (above) in regard to reducing the artificial volatility
caused by small portfolios. CDB could investigate the possibility of a more sophisticated approach to
country risk (volatility of country performance scores). It could consider whether a BMC’s allocation
should be lessened by adding a risk premium/demerit to the country performance score based upon past
volatility of performance. If this proves practical, it is an area in which CDB could lead MDB practice.
This is not a high priority but perhaps worth commissioning an exploratory paper.
REVIEW OF THE UNIFIED SPECIAL DEVELOPMENT FUND RESOURCE ALLOCATION SYSTEM
- iv -
6. SET ASIDES
6.0.1 CDB has a considerable amount in set-asides for special purposes that are untied to particular
countries. These include set asides for disasters including HIV/AIDS, for regional projects, for project
management training, for the program entitled Caribbean Technical Consulting Services, and monitoring
the Millennium Development Goals (MDGs), and for economic research.
6.0.2 There is a case for decreasing the set-asides over time, and having something closer to a single
pot of concessionary funds indicatively allocated to a particular country. However, in that case, CDB
would need a general reserve of funds to maintain reasonable flexibility, as, for example, IDB has.
6.1 Grants
6.1.1 SDF (U) funds are disbursed as loans and grants. The proportion of grants has increased over
time and exceeded 50% of new contributions to SDF 5.58
The recipient BMC benefits from a grant but
there are costs to CDB, including substantial time costs in providing and administering TA and some
costs of lost interest and capital re-flows. There may also be other costs such as potential loss of
ownership, commitment and financial discipline by the BMCs. These costs are mentioned in CDB’s
recent (2007) evaluation of its TA operations.59
Their practical implication is that many TA projects are
closed incomplete.
6.1.2 CDB has agreed with the SDF 6 contributors that grants shall not exceed 35% of approved project
budgets. As well CDB has made so-far-unsuccessful proposals to contributors for compensation similar to
that provided to other MDBs.60
“Contributors undertook a review of the issues associated with grant financing,
including the extent to which grants reduce SDF income and future re-flows and,
therefore, the contribution of internally-generated resources to future replenishments.
They noted that the share of grants, as a percentage of new contributions, had risen
sharply in recent SDF cycles. They also noted, however, SDF had traditionally
included grants, as particularly appropriate for certain types of activity, such as BNTF
and TA, and they concluded that grants continued to be important for these purposes
and for certain other purposes reflected in the special allocations referred to above.
They underscored, however, the need to maintain an appropriate balance, and agreed
that the share of grant funding allocations in the base programme level for SDF 6
should be no higher than 35%.”61
6.1.3 The important point for this paper is that, with the partial exception of the BNTF, SDF (U) grants
are not allocated among countries by formula.
6.2 BNTF
6.2.1. Among the SDF (U) grant instruments, only the BNTF is allocated by country, using the standard
SDF (U) allocation formula. The other set-asides for grants are in single pools of funds, organised by
topic (regional projects, disaster assistance, BMC capability enhancement, MDGs, etc) and any eligible
entity (country or regional or sub-regional organisation) may apply for a grant of any amount. The initial
allocation of BNTF funds is made according to the SDF (U) allocation formula. The incentive allocation
will be made by criteria to be decided.
REVIEW OF THE UNIFIED SPECIAL DEVELOPMENT FUND RESOURCE ALLOCATION SYSTEM
- 24 -
Recommendation 19:
6.2.2. CDB should continue to use the PBA formula to make an initial allocation of BNTF funds. CDB
should continue to have special criteria for allocation of the incentive portion of BNTF that relate mainly
to specific performance on BNTF projects but which may, in part, also relate to country improvement on
the general PBA performance criteria.
6.3 BMC Capacity Building TA
6.3.1. In 2006 CDB has commissioned an evaluation of its TA operations. When the recommendations
of that evaluation are available CDB should consider their implications for SDF (U) resource allocation
processes, particularly in regard to the “portfolio performance” variable in the allocation formula.
REVIEW OF THE UNIFIED SPECIAL DEVELOPMENT FUND RESOURCE ALLOCATION SYSTEM
- iv -
7. FINDINGS AND RECOMMENDATIONS 7.1 Strengths and Weaknesses of the Present System
7.1.1 CDB has successfully implemented a performance based allocation system for SDF (U) and
operated it for five years, through a whole SDF cycle. The Bank has customised the allocation formula to
its needs but, at the same time, has maintained a high degree of harmonisation with other MDBs and an
admirable degree of openness and transparency.
7.1.2 However, on the basis of experience over the past five years, CDB has opportunities to enhance
its allocation system to target it more precisely to the Bank’s poverty reduction mission, to make it even
more systematic and transparent and less subject to ad hoc changes, to make allocations more predictable
and less volatile, and to strengthen the resource allocation system as a vehicle for policy dialogue.
7.2 Summary of Recommendations
Recommendation 1:
7.2.1 The World Bank/IDA, the ADB, and the AfDB have harmonised on a single formula (or,
at least, very similar formulas). If the IDB decides to harmonise with this group, despite the manifest
advantages of its own simpler formula, then the case for CDB to do the same would be strong. However
since the World Bank/IDA intends to review and perhaps change its allocation formula during the IDA 15
negotiations in 2007, we recommend that CDB wait to see the result before deciding on any changes to its
own formula (apart from a change in the weight of “portfolio performance” – see recommendations
number 12).
Recommendation 2:
7.2.2 We recommend that CDB reallocate its SDF (U) resources every two years at a
minimum, as is present practice, or annually if circumstances require.
Recommendation 3:
7.2.3 We recommend that CDB convene a Country Performance Rating Team once each year
to consider, revise if necessary and approve the PRES country performance ratings. The Rating Team
should comprise a small number of executive managers. One good design would be to have the Vice-
President (Operations) as Chair, and, as members, the Director, Economics, the Director, Projects, and the
Director, Finance and Corporate Planning. To minimise the time burden, the size of the team should be
kept to four.
Recommendation 4:
7.2.4 The Rating Team should be supported by the country economists and by topic specialists
in Projects Department. We recommend that the input of the country economists should be coordinated
by the Chief Country Economist who should present proposed performance scores to the Rating Team for
those criteria most relevant to the economists’ expertise. The input of the functional specialists should be
coordinated, and presented, similarly by the Division Chief, Project Services Division. For each
performance criterion, country economists in Economics Department and functional specialists in Projects
Department should prepare worksheets of suggested scores on each criterion, each with a supporting text.
REVIEW OF THE UNIFIED SPECIAL DEVELOPMENT FUND RESOURCE ALLOCATION SYSTEM
- 26 -
The rating meeting should be held in February and the background work for the scoring exercise should
be integrated with the development of CDB’s Annual Economic Review.
Recommendation 5:
7.2.5 We believe that the Bank is ready to make wider use of the performance scores in policy
dialogue. This should be selective. If, for example, the Bank selected one “country performance
criterion” each year for intensive review (including a cross-country comparative study of performance led
by Economics or by PRSD) it would be well prepared to present and explain country rankings on that
criterion. The Annual Economic Review would, in our opinion, be a good venue for such discussion.
Recommendation 6:
7.2.6 We recommend that CDB adopt the World Bank/IDA policy and institutional
performance questionnaire, while keeping its own criteria weights and applying its own judgment to
generate scores. The PRES will need minor adjustments to cope with this change in scoring instrument.
Recommendation 7:
7.2.7 CDB has selected an appropriate weight for the “governance cluster” of performance
criteria in the PRES. Nothing additional is needed to emphasise its importance.
Recommendation 8:
7.2.8 (A) We recommend that responsibility for different PRES criteria be divided between
Economics Department and Project Services Division to do the work-up of possible scores for the
Rating Committee to consider. A work-up will comprise the suggested scores by country for
each criterion supported by a short comparative text.
7.2.9 (B) The scores and supporting text will involve professional judgment supported by
periodic cross-country-comparative thematic studies. We recommend that commissioning such
thematic studies should be an eligible use of SDF (U) funds.
Recommendation 9:
7.2.10 We recommend that CDB explore the possibility of joint benchmarking with other
multilateral development institutions working in the Caribbean, including the IDB and the World Bank.
CDB should send an economist, one or more sector specialists and an evaluator from Evaluation and
Oversight Division (for general methodology and for the portfolio performance variable) to Washington,
D.C. each year to participate in the joint MDB “country performance benchmarking exercise”, which is
generally in November/December.
Recommendation 10:
7.2.11 (A) We recommend that CDB explore the possibility of an annual discussion with each
BMC on its performance ratings, perhaps jointly with other multilateral institutions that now
score country performance (including World Bank/IDA, IDB, IFAD, and GEF).
7.2.12 (B) To facilitate dialogue, we recommend that each set of scores (by country and by
criterion) be supported by a short written text62
(See Appendix D for an example of a World Bank
REVIEW OF THE UNIFIED SPECIAL DEVELOPMENT FUND RESOURCE ALLOCATION SYSTEM
- iv -
template for this purpose). This would involve greater disclosure than the World Bank currently
undertakes, since, at present, it discloses the scores but not the supporting text.
Recommendation 11:
7.2.13 We recommend that three things be done to ameliorate the small-portfolio problem in the
PORT variable: (1) CDB should extend its PPI to include all operations, including TA over a certain size;
(2) the country portfolio performance score should be averaged63
over all project scores for the previous
three years, rather than only current projects; and (3) where a country still has such a small portfolio that
CDB judges that its portfolio performance score is not a reliable measure of its performance, we
recommend that PORT be given zero weight in the calculation of these countries’ allocations (that is,
country performance would be judged solely by PRES).
Recommendation 12:
7.2.14 We recommend that CDB continue to use the PPI (rather than the percentage of projects-
at-risk) as the basis for its “portfolio performance” variable.
Recommendation 13:
7.2.15 We recommend that CDB change the weight of PORT in the country performance factor
in the allocation formula to 20%. This harmonises with the World Bank/IDA and seems a reasonable
weight. When the volatility problems of the variable are remedied, CDB might wish to consider a weight
of 30% again. At the same time CDB should engage with other MDBs to agree on a consensus weight for
“portfolio performance”.
Recommendation 14:
7.2.16 (A) We recommend that CDB continue to weight its PPI by project size (approved
budgets). This will avoid small operations being overly influential in the country portfolio
performance score, balancing our recommendation that TA operations (which tend to be small)
should be included in the base on which country portfolio performance is calculated. At the same
time, weighting by approved budget avoids the problem encountered by the IDB that a good (or
bad) project declines in influence on the country average PPI as it gradually disburses its monies.
7.2.17 (B) The focus on the current state of the portfolio (rather than a longer view) can
lead to volatility in scores.64 For instance the failure and closure of a weak project can
result in an improved country performance score without anything else happening to the
portfolio. CDB should count the score of a project terminated incomplete in calculating
the country’s portfolio performance score in that year; and should consider other ways to
penalise non-completion or extremely late completion of projects.65
Recommendation 15:
7.2.18 We recommend that CDB adopt the six-point country performance scoring scale.
Recommendation 16:
7.2.19 We recommend that CDB study three possibilities in regard to the “poverty” variables in
the allocation formula: (1) Replace the population and per capita income variables with the logarithm of
REVIEW OF THE UNIFIED SPECIAL DEVELOPMENT FUND RESOURCE ALLOCATION SYSTEM
- 28 -
the population earning less than the poverty threshold. This would involve changing the weights of
variables in the allocation formula, since the variables themselves would change. (2) Replace only the
population variable with the population earning less than the poverty threshold. Or (3) make replacements
as in (1) or (2) with extra weight for the level of the indigent population.
Recommendation 17:
7.2.20 The third “needs variable” is “vulnerability” based on CDB’s Vulnerability Index
(2002).66
This index combines vulnerability to natural disasters with vulnerability to economic shocks.
We recommend that CDB continue to use this variable.
7.2.21 (A) A fixed country allocation for a new member is appropriate until the CDB has
enough experience to consider the country’s performance along with other borrowing members in
the normal allocation exercise.
7.2.22 (B) For special cases of new members that have serious governance problems CDB
should give a fixed allocation, as recommended above, and offer to increase that allocation
according to performance on negotiated criteria that might resemble the post-conflict allocation
criteria used by other multilateral development banks in similarly unique cases.
Recommendation 19:
7.2.23 CDB should continue to use the PBA formula to make an initial allocation of BNTF
funds. CDB should continue to have special criteria for allocation of the incentive portion of BNTF that
relate mainly to specific performance on BNTF projects but which may, in part, also relate to country
improvement on the general PBA performance criteria.
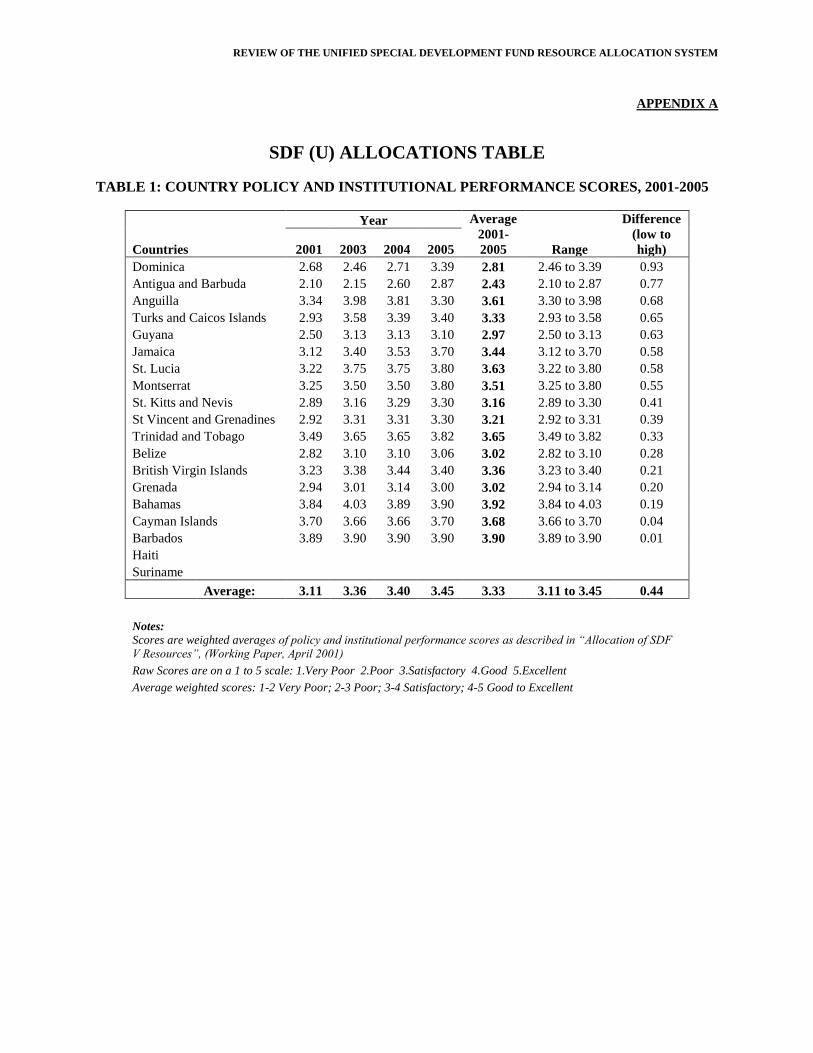
REVIEW OF THE UNIFIED SPECIAL DEVELOPMENT FUND RESOURCE ALLOCATION SYSTEM
APPENDIX A
SDF (U) ALLOCATIONS TABLE
TABLE 1: COUNTRY POLICY AND INSTITUTIONAL PERFORMANCE SCORES, 2001-2005
Countries
Year Average
2001-
2005 Range
Difference
(low to
high) 2001 2003 2004 2005
Dominica 2.68 2.46 2.71 3.39 2.81 2.46 to 3.39 0.93
Antigua and Barbuda 2.10 2.15 2.60 2.87 2.43 2.10 to 2.87 0.77
Anguilla 3.34 3.98 3.81 3.30 3.61 3.30 to 3.98 0.68
Turks and Caicos Islands 2.93 3.58 3.39 3.40 3.33 2.93 to 3.58 0.65
Guyana 2.50 3.13 3.13 3.10 2.97 2.50 to 3.13 0.63
Jamaica 3.12 3.40 3.53 3.70 3.44 3.12 to 3.70 0.58
St. Lucia 3.22 3.75 3.75 3.80 3.63 3.22 to 3.80 0.58
Montserrat 3.25 3.50 3.50 3.80 3.51 3.25 to 3.80 0.55
St. Kitts and Nevis 2.89 3.16 3.29 3.30 3.16 2.89 to 3.30 0.41
St Vincent and Grenadines 2.92 3.31 3.31 3.30 3.21 2.92 to 3.31 0.39
Trinidad and Tobago 3.49 3.65 3.65 3.82 3.65 3.49 to 3.82 0.33
Belize 2.82 3.10 3.10 3.06 3.02 2.82 to 3.10 0.28
British Virgin Islands 3.23 3.38 3.44 3.40 3.36 3.23 to 3.40 0.21
Grenada 2.94 3.01 3.14 3.00 3.02 2.94 to 3.14 0.20
Bahamas 3.84 4.03 3.89 3.90 3.92 3.84 to 4.03 0.19
Cayman Islands 3.70 3.66 3.66 3.70 3.68 3.66 to 3.70 0.04
Barbados 3.89 3.90 3.90 3.90 3.90 3.89 to 3.90 0.01
Haiti
Suriname
Average: 3.11 3.36 3.40 3.45 3.33 3.11 to 3.45 0.44
Notes:
Scores are weighted averages of policy and institutional performance scores as described in “Allocation of SDF
V Resources”, (Working Paper, April 2001)
Raw Scores are on a 1 to 5 scale: 1.Very Poor 2.Poor 3.Satisfactory 4.Good 5.Excellent
Average weighted scores: 1-2 Very Poor; 2-3 Poor; 3-4 Satisfactory; 4-5 Good to Excellent
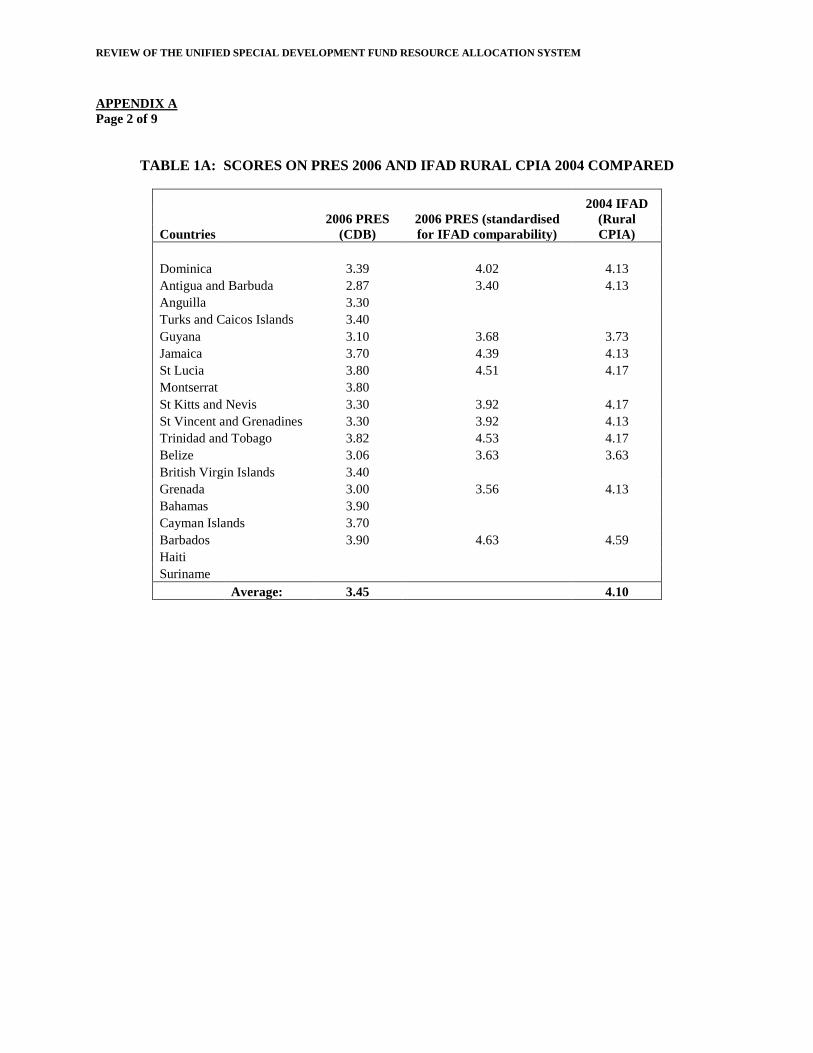
REVIEW OF THE UNIFIED SPECIAL DEVELOPMENT FUND RESOURCE ALLOCATION SYSTEM
APPENDIX A
Page 2 of 9
TABLE 1A: SCORES ON PRES 2006 AND IFAD RURAL CPIA 2004 COMPARED
Countries
2006 PRES
(CDB)
2006 PRES (standardised
for IFAD comparability)
2004 IFAD
(Rural
CPIA)
Dominica 3.39 4.02 4.13
Antigua and Barbuda 2.87 3.40 4.13
Anguilla 3.30
Turks and Caicos Islands 3.40
Guyana 3.10 3.68 3.73
Jamaica 3.70 4.39 4.13
St Lucia 3.80 4.51 4.17
Montserrat 3.80
St Kitts and Nevis 3.30 3.92 4.17
St Vincent and Grenadines 3.30 3.92 4.13
Trinidad and Tobago 3.82 4.53 4.17
Belize 3.06 3.63 3.63
British Virgin Islands 3.40
Grenada 3.00 3.56 4.13
Bahamas 3.90
Cayman Islands 3.70
Barbados 3.90 4.63 4.59
Haiti
Suriname
Average: 3.45 4.10
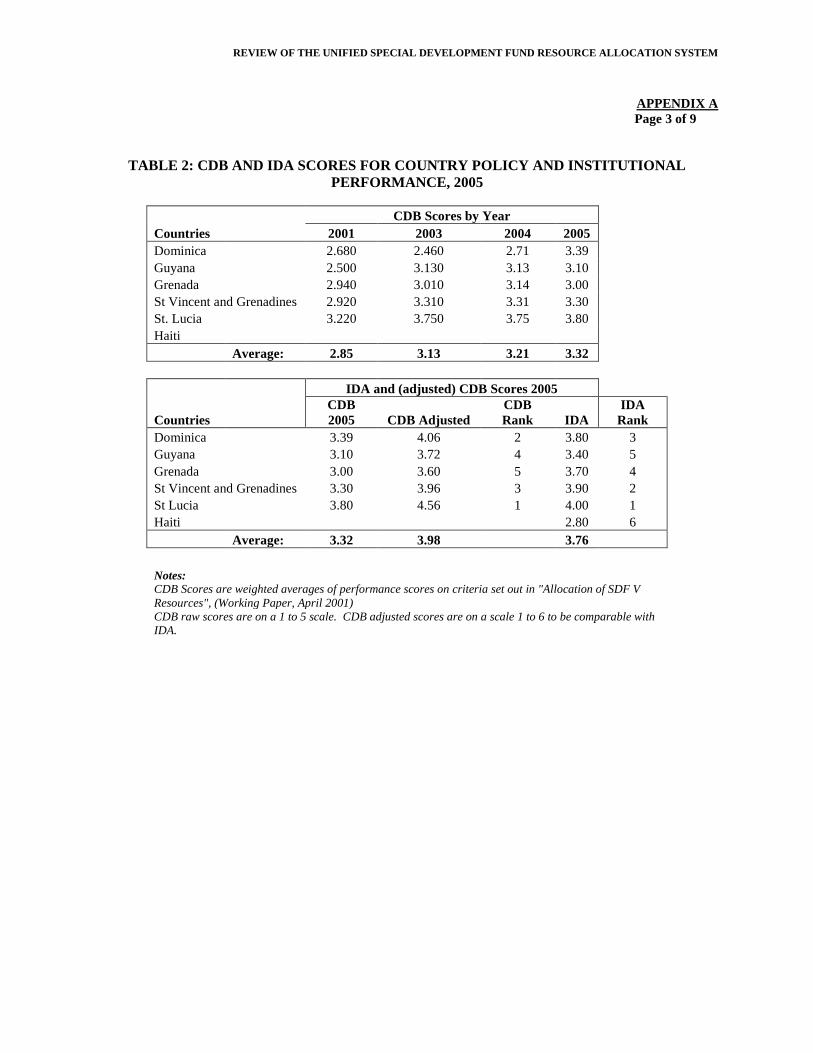
REVIEW OF THE UNIFIED SPECIAL DEVELOPMENT FUND RESOURCE ALLOCATION SYSTEM
APPENDIX A
Page 3 of 9
TABLE 2: CDB AND IDA SCORES FOR COUNTRY POLICY AND INSTITUTIONAL
PERFORMANCE, 2005
Countries
CDB Scores by Year
2001 2003 2004 2005
Dominica 2.680 2.460 2.71 3.39
Guyana 2.500 3.130 3.13 3.10
Grenada 2.940 3.010 3.14 3.00
St Vincent and Grenadines 2.920 3.310 3.31 3.30
St. Lucia 3.220 3.750 3.75 3.80
Haiti
Average: 2.85 3.13 3.21 3.32
Countries
IDA and (adjusted) CDB Scores 2005
CDB
2005 CDB Adjusted
CDB
Rank IDA
IDA
Rank
Dominica 3.39 4.06 2 3.80 3
Guyana 3.10 3.72 4 3.40 5
Grenada 3.00 3.60 5 3.70 4
St Vincent and Grenadines 3.30 3.96 3 3.90 2
St Lucia 3.80 4.56 1 4.00 1
Haiti 2.80 6
Average: 3.32 3.98 3.76
Notes:
CDB Scores are weighted averages of performance scores on criteria set out in "Allocation of SDF V
Resources", (Working Paper, April 2001)
CDB raw scores are on a 1 to 5 scale. CDB adjusted scores are on a scale 1 to 6 to be comparable with
IDA.
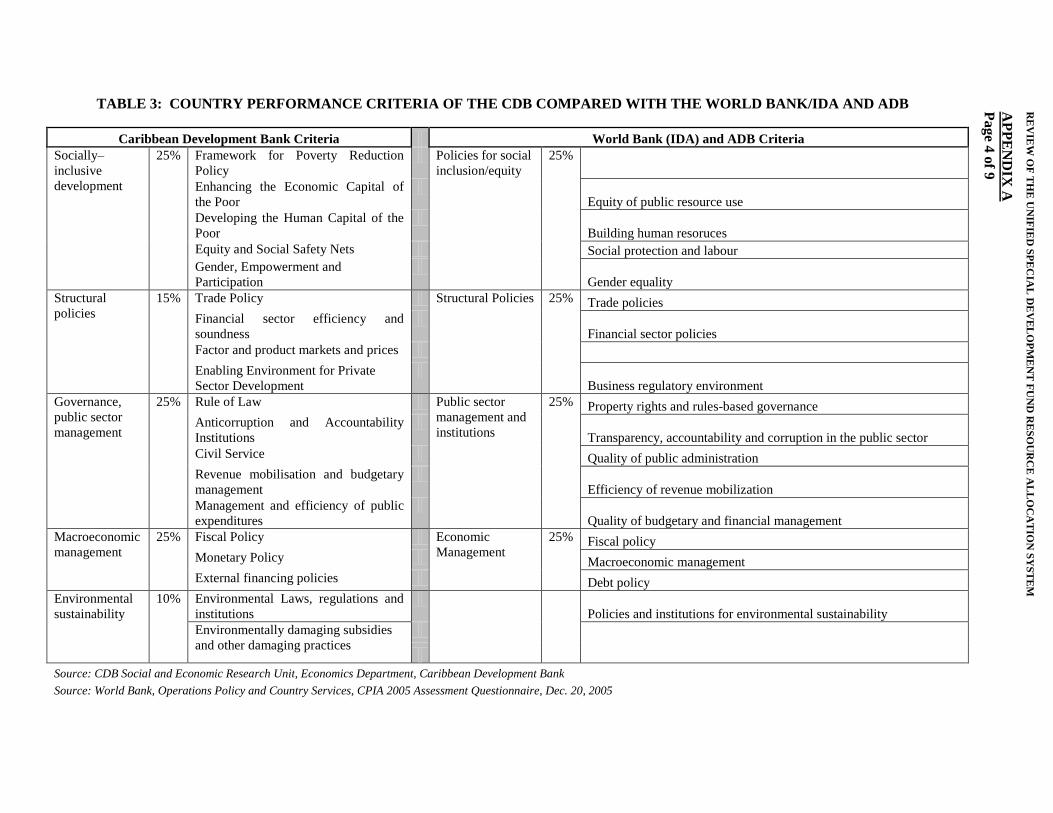
TABLE 3: COUNTRY PERFORMANCE CRITERIA OF THE CDB COMPARED WITH THE WORLD BANK/IDA AND ADB
Caribbean Development Bank Criteria World Bank (IDA) and ADB Criteria
Socially–
inclusive
development
25% Framework for Poverty Reduction
Policy
Policies for social
inclusion/equity
25%
Enhancing the Economic Capital of
the Poor
Equity of public resource use
Developing the Human Capital of the
Poor
Building human resoruces
Equity and Social Safety Nets Social protection and labour
Gender, Empowerment and
Participation
Gender equality
Structural
policies
15% Trade Policy Structural Policies 25% Trade policies
Financial sector efficiency and
soundness
Financial sector policies
Factor and product markets and prices
Enabling Environment for Private
Sector Development
Business regulatory environment
Governance,
public sector
management
25% Rule of Law Public sector
management and
institutions
25% Property rights and rules-based governance
Anticorruption and Accountability
Institutions
Transparency, accountability and corruption in the public sector
Civil Service Quality of public administration
Revenue mobilisation and budgetary
management
Efficiency of revenue mobilization
Management and efficiency of public
expenditures
Quality of budgetary and financial management
Macroeconomic
management
25% Fiscal Policy Economic
Management
25% Fiscal policy
Monetary Policy Macroeconomic management
External financing policies Debt policy
Environmental
sustainability
10% Environmental Laws, regulations and
institutions
Policies and institutions for environmental sustainability
Environmentally damaging subsidies
and other damaging practices
Source: CDB Social and Economic Research Unit, Economics Department, Caribbean Development Bank
Source: World Bank, Operations Policy and Country Services, CPIA 2005 Assessment Questionnaire, Dec. 20, 2005
RE
VIE
W O
F T
HE
UN
IFIE
D S
PE
CIA
L D
EV
EL
OP
ME
NT
FU
ND
RE
SO
UR
CE
AL
LO
CA
TIO
N S
YS
TE
M
AP
PE
ND
IX A
Pa
ge 4
of 9
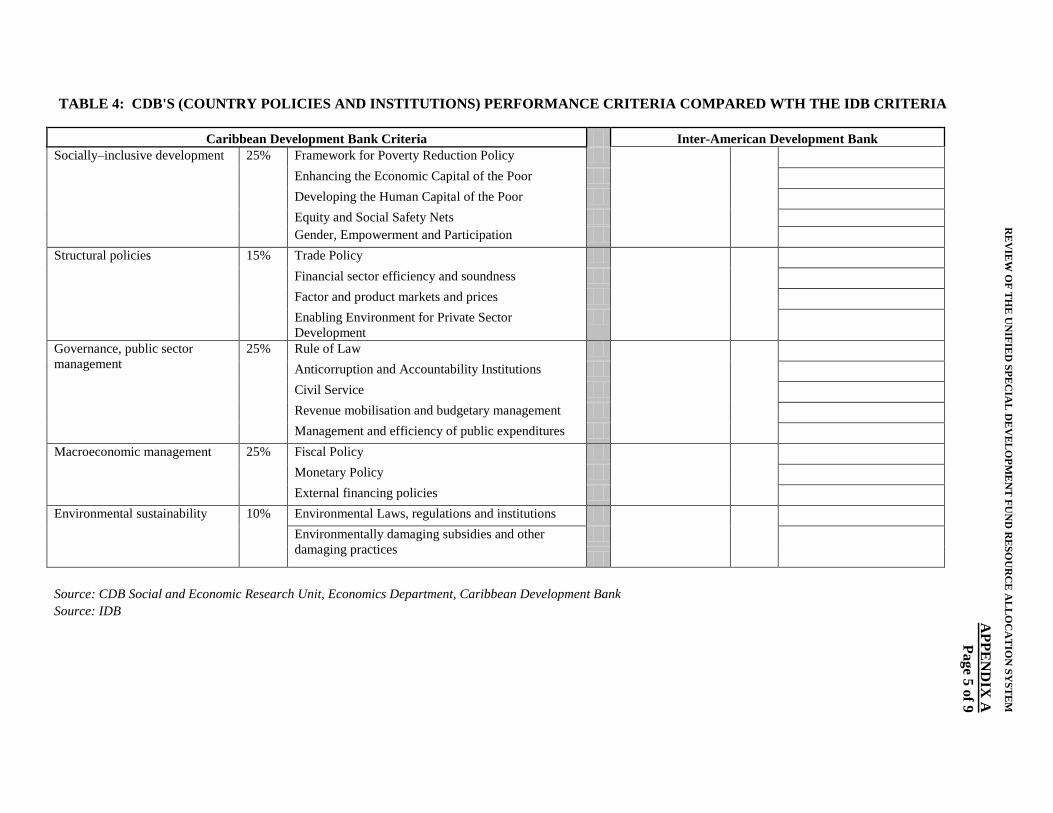
TABLE 4: CDB'S (COUNTRY POLICIES AND INSTITUTIONS) PERFORMANCE CRITERIA COMPARED WTH THE IDB CRITERIA
Caribbean Development Bank Criteria Inter-American Development Bank
Socially–inclusive development 25% Framework for Poverty Reduction Policy
Enhancing the Economic Capital of the Poor
Developing the Human Capital of the Poor
Equity and Social Safety Nets
Gender, Empowerment and Participation
Structural policies 15% Trade Policy
Financial sector efficiency and soundness
Factor and product markets and prices
Enabling Environment for Private Sector
Development
Governance, public sector
management
25% Rule of Law
Anticorruption and Accountability Institutions
Civil Service
Revenue mobilisation and budgetary management
Management and efficiency of public expenditures
Macroeconomic management 25% Fiscal Policy
Monetary Policy
External financing policies
Environmental sustainability 10% Environmental Laws, regulations and institutions
Environmentally damaging subsidies and other
damaging practices
Source: CDB Social and Economic Research Unit, Economics Department, Caribbean Development Bank
Source: IDB
RE
VIE
W O
F T
HE
UN
IFIE
D S
PE
CIA
L D
EV
EL
OP
ME
NT
FU
ND
RE
SO
UR
CE
AL
LO
CA
TIO
N S
YS
TE
M
AP
PE
ND
IX A
Pa
ge 5
of 9
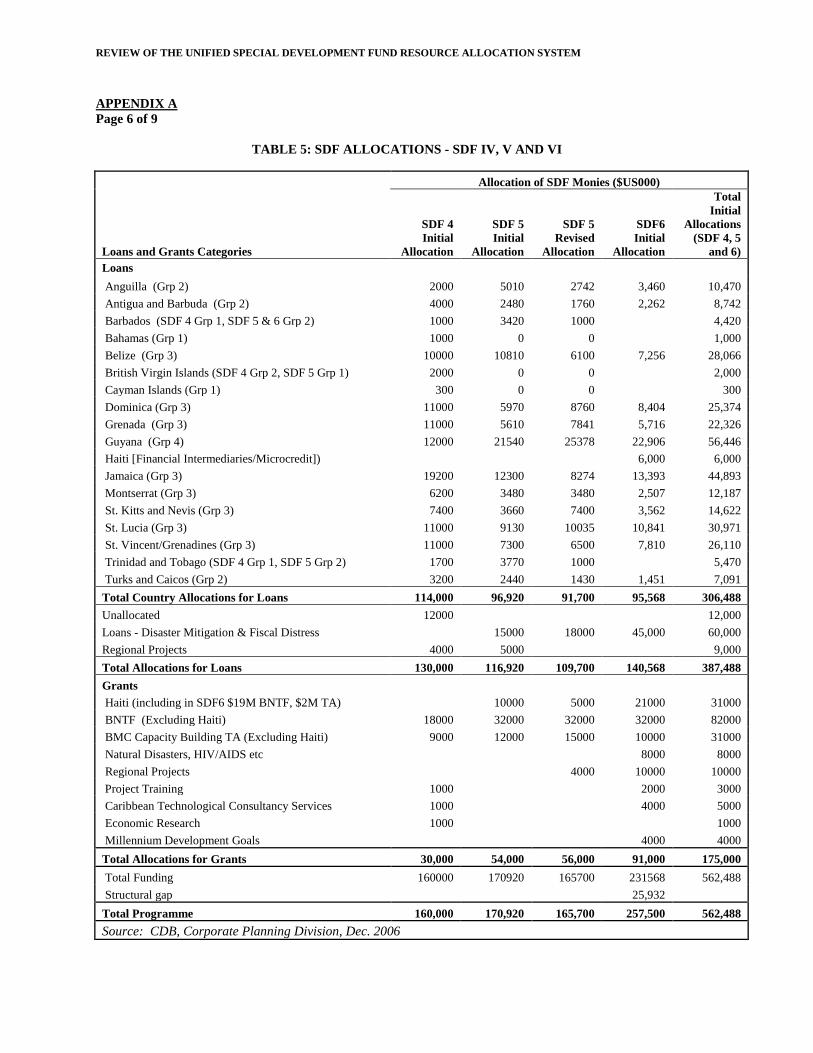
REVIEW OF THE UNIFIED SPECIAL DEVELOPMENT FUND RESOURCE ALLOCATION SYSTEM
APPENDIX A
Page 6 of 9
TABLE 5: SDF ALLOCATIONS - SDF IV, V AND VI
Loans and Grants Categories
Allocation of SDF Monies ($US000)
SDF 4
Initial
Allocation
SDF 5
Initial
Allocation
SDF 5
Revised
Allocation
SDF6
Initial
Allocation
Total
Initial
Allocations
(SDF 4, 5
and 6)
Loans
Anguilla (Grp 2) 2000 5010 2742 3,460 10,470
Antigua and Barbuda (Grp 2) 4000 2480 1760 2,262 8,742
Barbados (SDF 4 Grp 1, SDF 5 & 6 Grp 2) 1000 3420 1000 4,420
Bahamas (Grp 1) 1000 0 0 1,000
Belize (Grp 3) 10000 10810 6100 7,256 28,066
British Virgin Islands (SDF 4 Grp 2, SDF 5 Grp 1) 2000 0 0 2,000
Cayman Islands (Grp 1) 300 0 0 300
Dominica (Grp 3) 11000 5970 8760 8,404 25,374
Grenada (Grp 3) 11000 5610 7841 5,716 22,326
Guyana (Grp 4) 12000 21540 25378 22,906 56,446
Haiti [Financial Intermediaries/Microcredit]) 6,000 6,000
Jamaica (Grp 3) 19200 12300 8274 13,393 44,893
Montserrat (Grp 3) 6200 3480 3480 2,507 12,187
St. Kitts and Nevis (Grp 3) 7400 3660 7400 3,562 14,622
St. Lucia (Grp 3) 11000 9130 10035 10,841 30,971
St. Vincent/Grenadines (Grp 3) 11000 7300 6500 7,810 26,110
Trinidad and Tobago (SDF 4 Grp 1, SDF 5 Grp 2) 1700 3770 1000 5,470
Turks and Caicos (Grp 2) 3200 2440 1430 1,451 7,091
Total Country Allocations for Loans 114,000 96,920 91,700 95,568 306,488
Unallocated 12000 12,000
Loans - Disaster Mitigation & Fiscal Distress 15000 18000 45,000 60,000
Regional Projects 4000 5000 9,000
Total Allocations for Loans 130,000 116,920 109,700 140,568 387,488
Grants
Haiti (including in SDF6 $19M BNTF, $2M TA) 10000 5000 21000 31000
BNTF (Excluding Haiti) 18000 32000 32000 32000 82000
BMC Capacity Building TA (Excluding Haiti) 9000 12000 15000 10000 31000
Natural Disasters, HIV/AIDS etc 8000 8000
Regional Projects 4000 10000 10000
Project Training 1000 2000 3000
Caribbean Technological Consultancy Services 1000 4000 5000
Economic Research 1000 1000
Millennium Development Goals 4000 4000
Total Allocations for Grants 30,000 54,000 56,000 91,000 175,000
Total Funding 160000 170920 165700 231568 562,488
Structural gap 25,932
Total Programme 160,000 170,920 165,700 257,500 562,488
Source: CDB, Corporate Planning Division, Dec. 2006
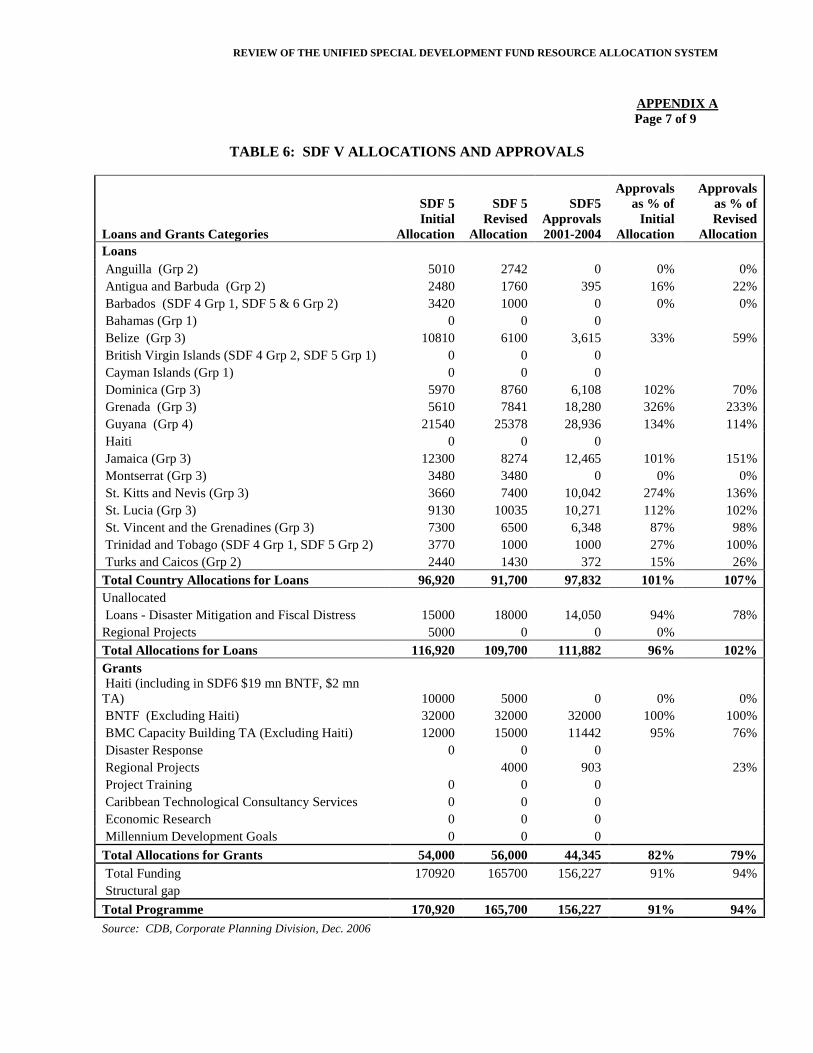
REVIEW OF THE UNIFIED SPECIAL DEVELOPMENT FUND RESOURCE ALLOCATION SYSTEM
APPENDIX A
Page 7 of 9
TABLE 6: SDF V ALLOCATIONS AND APPROVALS
Loans and Grants Categories
SDF 5
Initial
Allocation
SDF 5
Revised
Allocation
SDF5
Approvals
2001-2004
Approvals
as % of
Initial
Allocation
Approvals
as % of
Revised
Allocation
Loans
Anguilla (Grp 2) 5010 2742 0 0% 0%
Antigua and Barbuda (Grp 2) 2480 1760 395 16% 22%
Barbados (SDF 4 Grp 1, SDF 5 & 6 Grp 2) 3420 1000 0 0% 0%
Bahamas (Grp 1) 0 0 0
Belize (Grp 3) 10810 6100 3,615 33% 59%
British Virgin Islands (SDF 4 Grp 2, SDF 5 Grp 1) 0 0 0
Cayman Islands (Grp 1) 0 0 0
Dominica (Grp 3) 5970 8760 6,108 102% 70%
Grenada (Grp 3) 5610 7841 18,280 326% 233%
Guyana (Grp 4) 21540 25378 28,936 134% 114%
Haiti 0 0 0
Jamaica (Grp 3) 12300 8274 12,465 101% 151%
Montserrat (Grp 3) 3480 3480 0 0% 0%
St. Kitts and Nevis (Grp 3) 3660 7400 10,042 274% 136%
St. Lucia (Grp 3) 9130 10035 10,271 112% 102%
St. Vincent and the Grenadines (Grp 3) 7300 6500 6,348 87% 98%
Trinidad and Tobago (SDF 4 Grp 1, SDF 5 Grp 2) 3770 1000 1000 27% 100%
Turks and Caicos (Grp 2) 2440 1430 372 15% 26%
Total Country Allocations for Loans 96,920 91,700 97,832 101% 107%
Unallocated
Loans - Disaster Mitigation and Fiscal Distress 15000 18000 14,050 94% 78%
Regional Projects 5000 0 0 0%
Total Allocations for Loans 116,920 109,700 111,882 96% 102%
Grants
Haiti (including in SDF6 $19 mn BNTF, $2 mn
TA) 10000 5000 0 0% 0%
BNTF (Excluding Haiti) 32000 32000 32000 100% 100%
BMC Capacity Building TA (Excluding Haiti) 12000 15000 11442 95% 76%
Disaster Response 0 0 0
Regional Projects 4000 903 23%
Project Training 0 0 0
Caribbean Technological Consultancy Services 0 0 0
Economic Research 0 0 0
Millennium Development Goals 0 0 0
Total Allocations for Grants 54,000 56,000 44,345 82% 79%
Total Funding 170920 165700 156,227 91% 94%
Structural gap
Total Programme 170,920 165,700 156,227 91% 94%
Source: CDB, Corporate Planning Division, Dec. 2006
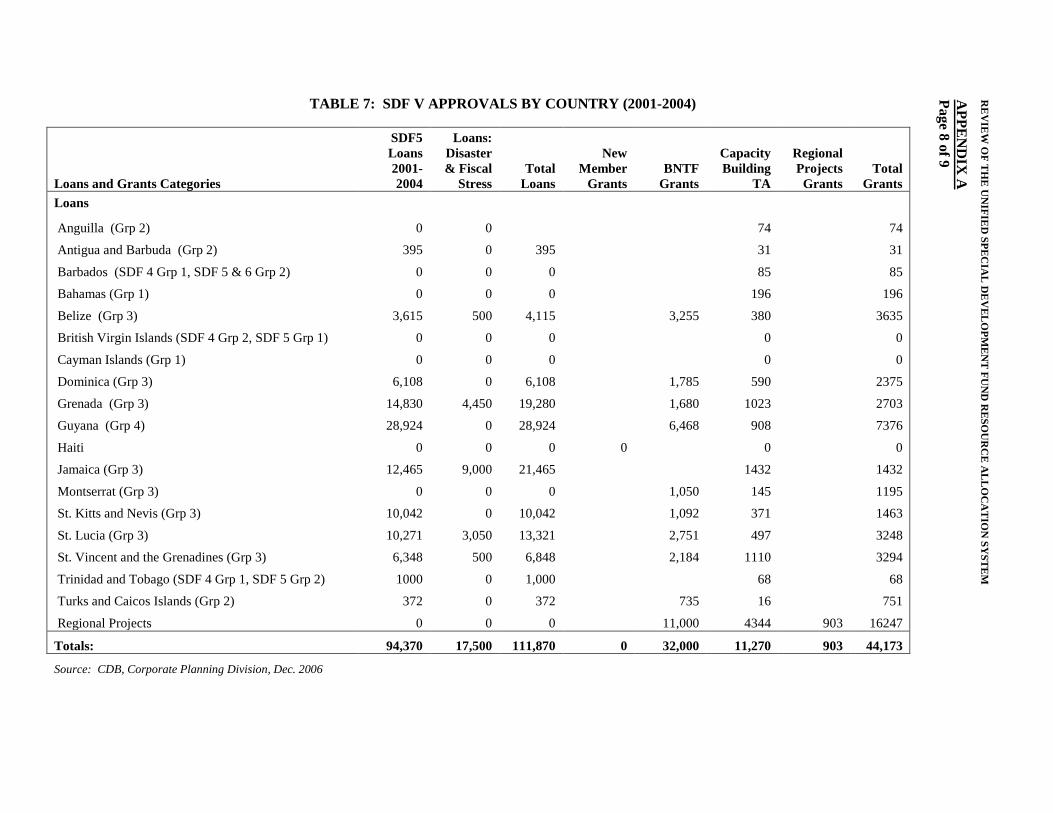
TABLE 7: SDF V APPROVALS BY COUNTRY (2001-2004)
Loans and Grants Categories
SDF5
Loans
2001-
2004
Loans:
Disaster
& Fiscal
Stress
Total
Loans
New
Member
Grants
BNTF
Grants
Capacity
Building
TA
Regional
Projects
Grants
Total
Grants
Loans
Anguilla (Grp 2) 0 0 74 74
Antigua and Barbuda (Grp 2) 395 0 395 31 31
Barbados (SDF 4 Grp 1, SDF 5 & 6 Grp 2) 0 0 0 85 85
Bahamas (Grp 1) 0 0 0 196 196
Belize (Grp 3) 3,615 500 4,115 3,255 380 3635
British Virgin Islands (SDF 4 Grp 2, SDF 5 Grp 1) 0 0 0 0 0
Cayman Islands (Grp 1) 0 0 0 0 0
Dominica (Grp 3) 6,108 0 6,108 1,785 590 2375
Grenada (Grp 3) 14,830 4,450 19,280 1,680 1023 2703
Guyana (Grp 4) 28,924 0 28,924 6,468 908 7376
Haiti 0 0 0 0 0 0
Jamaica (Grp 3) 12,465 9,000 21,465 1432 1432
Montserrat (Grp 3) 0 0 0 1,050 145 1195
St. Kitts and Nevis (Grp 3) 10,042 0 10,042 1,092 371 1463
St. Lucia (Grp 3) 10,271 3,050 13,321 2,751 497 3248
St. Vincent and the Grenadines (Grp 3) 6,348 500 6,848 2,184 1110 3294
Trinidad and Tobago (SDF 4 Grp 1, SDF 5 Grp 2) 1000 0 1,000 68 68
Turks and Caicos Islands (Grp 2) 372 0 372 735 16 751
Regional Projects 0 0 0 11,000 4344 903 16247
Totals: 94,370 17,500 111,870 0 32,000 11,270 903 44,173
Source: CDB, Corporate Planning Division, Dec. 2006
RE
VIE
W O
F T
HE
UN
IFIE
D S
PE
CIA
L D
EV
EL
OP
ME
NT
FU
ND
RE
SO
UR
CE
AL
LO
CA
TIO
N S
YS
TE
M
AP
PE
ND
IX A
Pa
ge 8
of 9
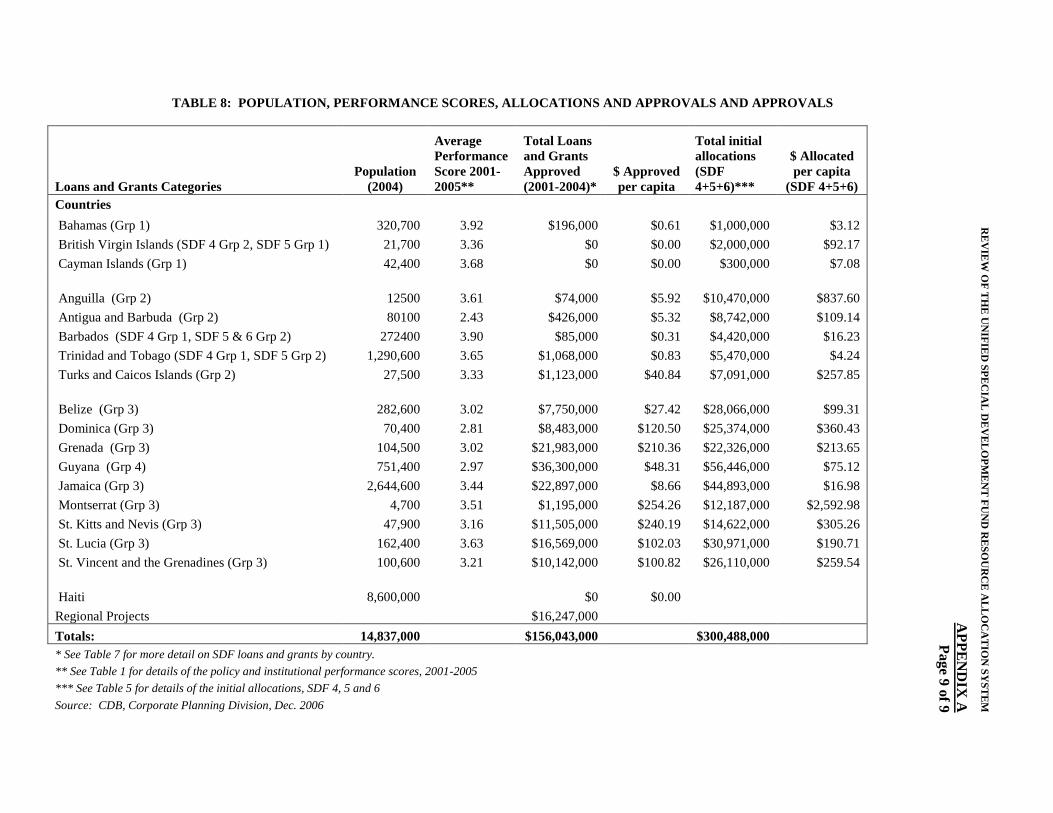
TABLE 8: POPULATION, PERFORMANCE SCORES, ALLOCATIONS AND APPROVALS AND APPROVALS
Loans and Grants Categories
Population
(2004)
Average
Performance
Score 2001-
2005**
Total Loans
and Grants
Approved
(2001-2004)*
$ Approved
per capita
Total initial
allocations
(SDF
4+5+6)***
$ Allocated
per capita
(SDF 4+5+6)
Countries
Bahamas (Grp 1) 320,700 3.92 $196,000 $0.61 $1,000,000 $3.12
British Virgin Islands (SDF 4 Grp 2, SDF 5 Grp 1) 21,700 3.36 $0 $0.00 $2,000,000 $92.17
Cayman Islands (Grp 1) 42,400 3.68 $0 $0.00 $300,000 $7.08
Anguilla (Grp 2) 12500 3.61 $74,000 $5.92 $10,470,000 $837.60
Antigua and Barbuda (Grp 2) 80100 2.43 $426,000 $5.32 $8,742,000 $109.14
Barbados (SDF 4 Grp 1, SDF 5 & 6 Grp 2) 272400 3.90 $85,000 $0.31 $4,420,000 $16.23
Trinidad and Tobago (SDF 4 Grp 1, SDF 5 Grp 2) 1,290,600 3.65 $1,068,000 $0.83 $5,470,000 $4.24
Turks and Caicos Islands (Grp 2) 27,500 3.33 $1,123,000 $40.84 $7,091,000 $257.85
Belize (Grp 3) 282,600 3.02 $7,750,000 $27.42 $28,066,000 $99.31
Dominica (Grp 3) 70,400 2.81 $8,483,000 $120.50 $25,374,000 $360.43
Grenada (Grp 3) 104,500 3.02 $21,983,000 $210.36 $22,326,000 $213.65
Guyana (Grp 4) 751,400 2.97 $36,300,000 $48.31 $56,446,000 $75.12
Jamaica (Grp 3) 2,644,600 3.44 $22,897,000 $8.66 $44,893,000 $16.98
Montserrat (Grp 3) 4,700 3.51 $1,195,000 $254.26 $12,187,000 $2,592.98
St. Kitts and Nevis (Grp 3) 47,900 3.16 $11,505,000 $240.19 $14,622,000 $305.26
St. Lucia (Grp 3) 162,400 3.63 $16,569,000 $102.03 $30,971,000 $190.71
St. Vincent and the Grenadines (Grp 3) 100,600 3.21 $10,142,000 $100.82 $26,110,000 $259.54
Haiti 8,600,000 $0 $0.00
Regional Projects $16,247,000
Totals: 14,837,000 $156,043,000 $300,488,000
* See Table 7 for more detail on SDF loans and grants by country.
** See Table 1 for details of the policy and institutional performance scores, 2001-2005
*** See Table 5 for details of the initial allocations, SDF 4, 5 and 6
Source: CDB, Corporate Planning Division, Dec. 2006
RE
VIE
W O
F T
HE
UN
IFIE
D S
PE
CIA
L D
EV
EL
OP
ME
NT
FU
ND
RE
SO
UR
CE
AL
LO
CA
TIO
N S
YS
TE
M
AP
PE
ND
IX A
Pa
ge 9
of 9
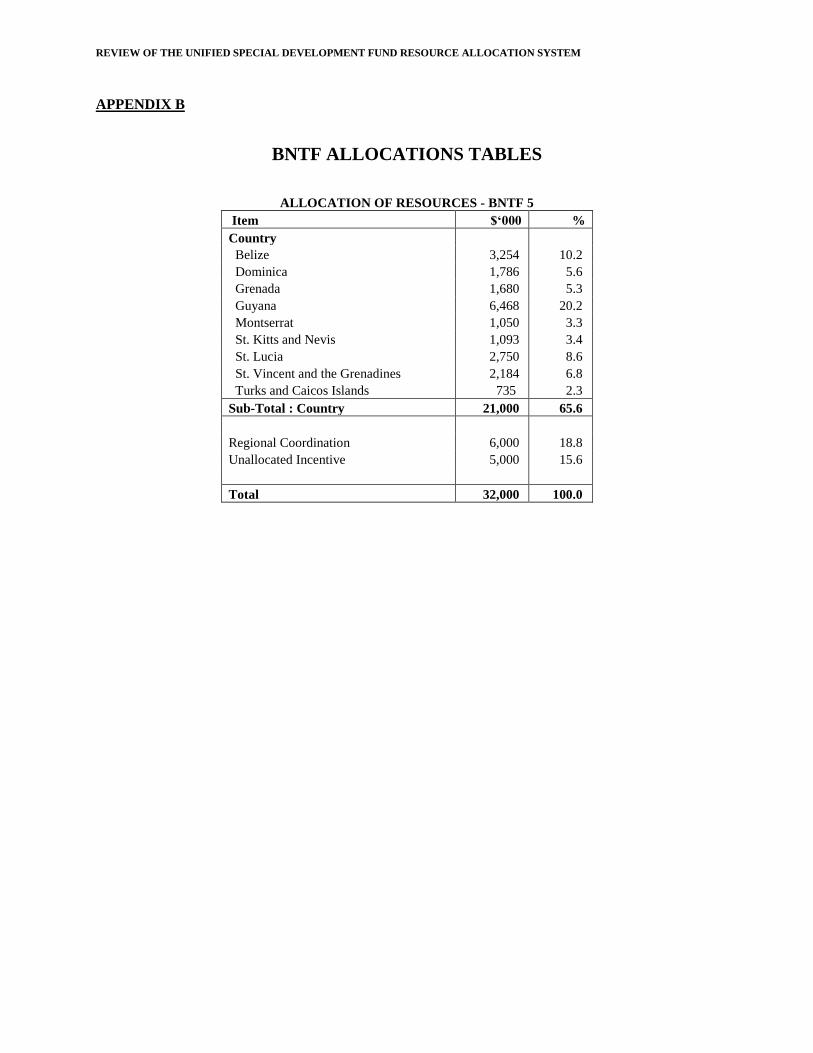
REVIEW OF THE UNIFIED SPECIAL DEVELOPMENT FUND RESOURCE ALLOCATION SYSTEM
APPENDIX B
BNTF ALLOCATIONS TABLES
ALLOCATION OF RESOURCES - BNTF 5
Item $‘000 %
Country
Belize 3,254 10.2
Dominica 1,786 5.6
Grenada 1,680 5.3
Guyana 6,468 20.2
Montserrat 1,050 3.3
St. Kitts and Nevis 1,093 3.4
St. Lucia 2,750 8.6
St. Vincent and the Grenadines 2,184 6.8
Turks and Caicos Islands 735 2.3
Sub-Total : Country 21,000 65.6
Regional Coordination 6,000 18.8
Unallocated Incentive 5,000 15.6
Total 32,000 100.0
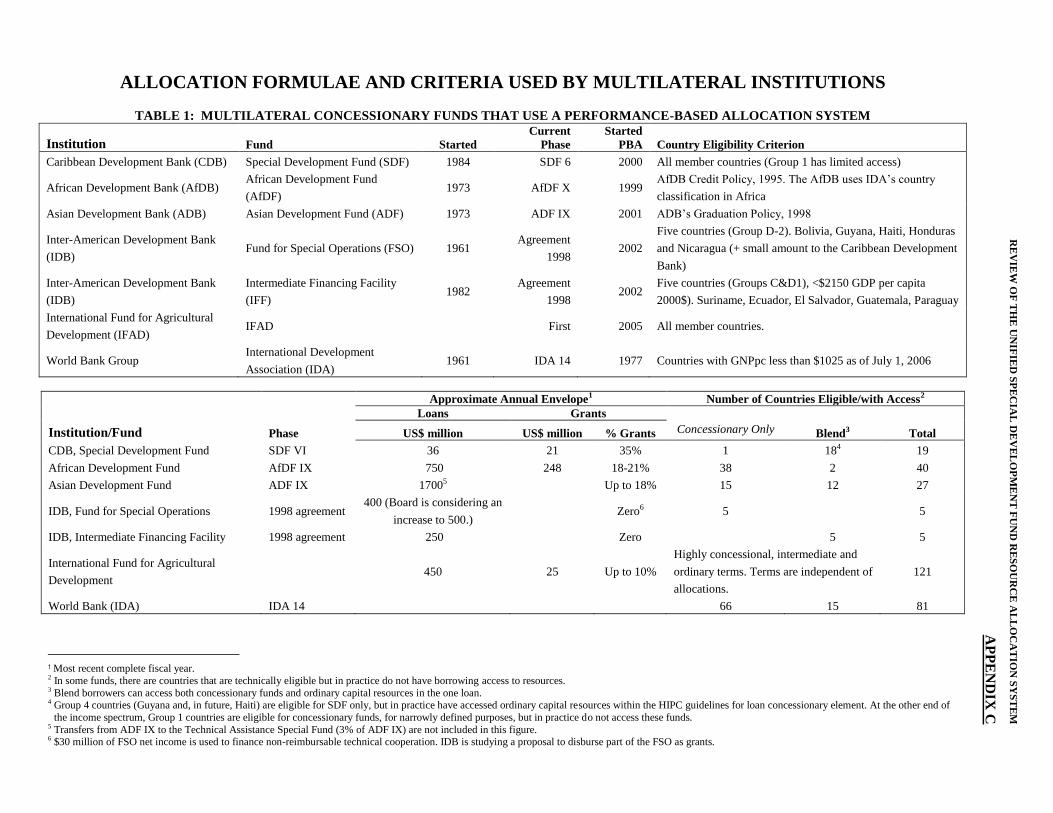
ALLOCATION FORMULAE AND CRITERIA USED BY MULTILATERAL INSTITUTIONS
TABLE 1: MULTILATERAL CONCESSIONARY FUNDS THAT USE A PERFORMANCE-BASED ALLOCATION SYSTEM
Institution Fund Started
Current
Phase
Started
PBA Country Eligibility Criterion
Caribbean Development Bank (CDB) Special Development Fund (SDF) 1984 SDF 6 2000 All member countries (Group 1 has limited access)
African Development Bank (AfDB) African Development Fund
(AfDF) 1973 AfDF X 1999
AfDB Credit Policy, 1995. The AfDB uses IDA’s country
classification in Africa
Asian Development Bank (ADB) Asian Development Fund (ADF) 1973 ADF IX 2001 ADB’s Graduation Policy, 1998
Inter-American Development Bank
(IDB) Fund for Special Operations (FSO) 1961
Agreement
1998 2002
Five countries (Group D-2). Bolivia, Guyana, Haiti, Honduras
and Nicaragua (+ small amount to the Caribbean Development
Bank)
Inter-American Development Bank
(IDB)
Intermediate Financing Facility
(IFF) 1982
Agreement
1998 2002
Five countries (Groups C&D1), <$2150 GDP per capita
2000$). Suriname, Ecuador, El Salvador, Guatemala, Paraguay
International Fund for Agricultural
Development (IFAD) IFAD First 2005 All member countries.
World Bank Group International Development
Association (IDA) 1961 IDA 14 1977 Countries with GNPpc less than $1025 as of July 1, 2006
Institution/Fund Phase
Approximate Annual Envelope1 Number of Countries Eligible/with Access2
Loans Grants
Concessionary Only Blend3 Total US$ million US$ million % Grants
CDB, Special Development Fund SDF VI 36 21 35% 1 184 19
African Development Fund AfDF IX 750 248 18-21% 38 2 40
Asian Development Fund ADF IX 17005 Up to 18% 15 12 27
IDB, Fund for Special Operations 1998 agreement 400 (Board is considering an
increase to 500.) Zero6 5 5
IDB, Intermediate Financing Facility 1998 agreement 250 Zero 5 5
International Fund for Agricultural
Development 450 25 Up to 10%
Highly concessional, intermediate and
ordinary terms. Terms are independent of
allocations.
121
World Bank (IDA) IDA 14 66 15 81
1 Most recent complete fiscal year. 2 In some funds, there are countries that are technically eligible but in practice do not have borrowing access to resources. 3 Blend borrowers can access both concessionary funds and ordinary capital resources in the one loan. 4 Group 4 countries (Guyana and, in future, Haiti) are eligible for SDF only, but in practice have accessed ordinary capital resources within the HIPC guidelines for loan concessionary element. At the other end of
the income spectrum, Group 1 countries are eligible for concessionary funds, for narrowly defined purposes, but in practice do not access these funds. 5 Transfers from ADF IX to the Technical Assistance Special Fund (3% of ADF IX) are not included in this figure. 6 $30 million of FSO net income is used to finance non-reimbursable technical cooperation. IDB is studying a proposal to disburse part of the FSO as grants.
RE
VIE
W O
F T
HE
UN
IFIE
D S
PE
CIA
L D
EV
EL
OP
ME
NT
FU
ND
RE
SO
UR
CE
AL
LO
CA
TIO
N S
YS
TE
M
AP
PE
ND
IX C
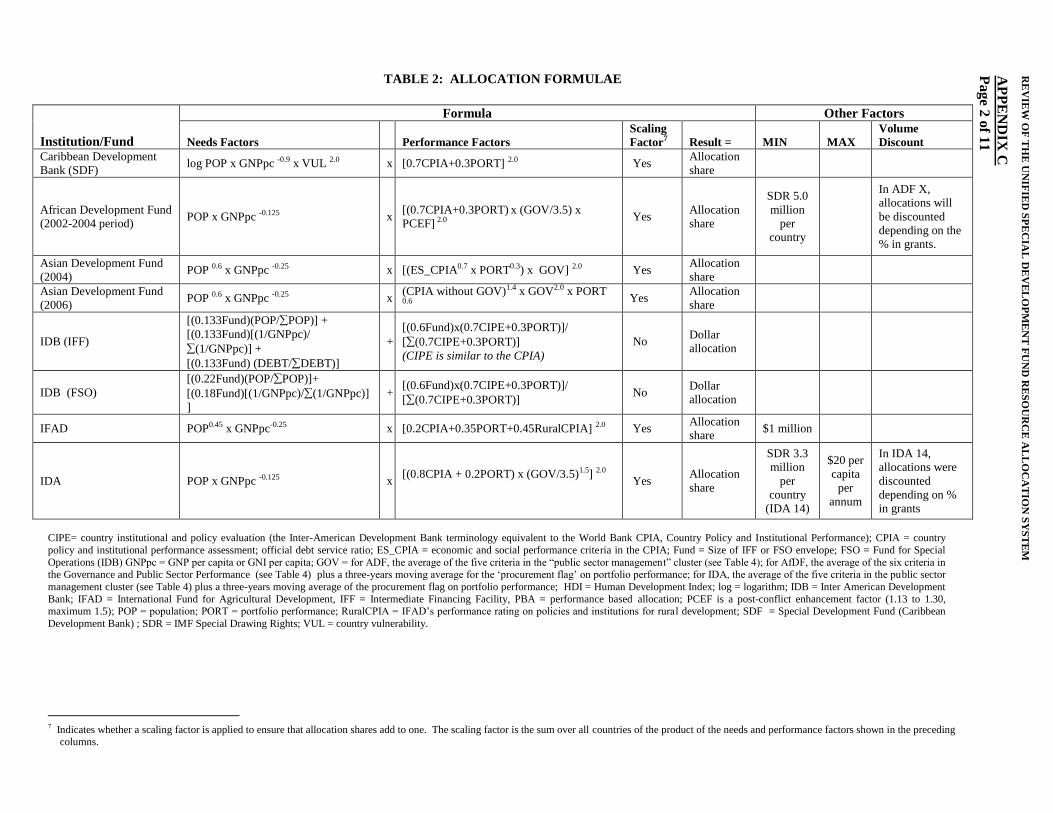
TABLE 2: ALLOCATION FORMULAE
Institution/Fund
Formula Other Factors
Needs Factors Performance Factors
Scaling
Factor7 Result = MIN MAX
Volume
Discount
Caribbean Development
Bank (SDF) log POP x GNPpc -0.9 x VUL 2.0 x [0.7CPIA+0.3PORT] 2.0 Yes
Allocation
share
African Development Fund
(2002-2004 period) POP x GNPpc -0.125 x
[(0.7CPIA+0.3PORT) x (GOV/3.5) x
PCEF] 2.0
Yes Allocation
share
SDR 5.0
million
per
country
In ADF X,
allocations will
be discounted
depending on the
% in grants.
Asian Development Fund
(2004) POP 0.6 x GNPpc -0.25 x [(ES_CPIA0.7 x PORT0.3) x GOV] 2.0 Yes
Allocation
share
Asian Development Fund
(2006) POP 0.6 x GNPpc -0.25 x
(CPIA without GOV)1.4 x GOV2.0 x PORT 0.6
Yes Allocation
share
IDB (IFF)
[(0.133Fund)(POP/POP)] +
[(0.133Fund)[(1/GNPpc)/
(1/GNPpc)] +
[(0.133Fund) (DEBT/DEBT)]
+
[(0.6Fund)x(0.7CIPE+0.3PORT)]/
[(0.7CIPE+0.3PORT)]
(CIPE is similar to the CPIA)
No Dollar
allocation
IDB (FSO)
[(0.22Fund)(POP/POP)]+
[(0.18Fund)[(1/GNPpc)/(1/GNPpc)]
]
+ [(0.6Fund)x(0.7CIPE+0.3PORT)]/
[(0.7CIPE+0.3PORT)] No
Dollar
allocation
IFAD POP0.45 x GNPpc-0.25 x [0.2CPIA+0.35PORT+0.45RuralCPIA] 2.0 Yes Allocation
share $1 million
IDA POP x GNPpc -0.125 x [(0.8CPIA + 0.2PORT) x (GOV/3.5)1.5] 2.0
Yes
Allocation
share
SDR 3.3
million
per
country
(IDA 14)
$20 per
capita
per
annum
In IDA 14,
allocations were
discounted
depending on %
in grants
CIPE= country institutional and policy evaluation (the Inter-American Development Bank terminology equivalent to the World Bank CPIA, Country Policy and Institutional Performance); CPIA = country
policy and institutional performance assessment; official debt service ratio; ES_CPIA = economic and social performance criteria in the CPIA; Fund = Size of IFF or FSO envelope; FSO = Fund for Special
Operations (IDB) GNPpc = GNP per capita or GNI per capita; GOV = for ADF, the average of the five criteria in the “public sector management” cluster (see Table 4); for AfDF, the average of the six criteria in the Governance and Public Sector Performance (see Table 4) plus a three-years moving average for the ‘procurement flag’ on portfolio performance; for IDA, the average of the five criteria in the public sector
management cluster (see Table 4) plus a three-years moving average of the procurement flag on portfolio performance; HDI = Human Development Index; log = logarithm; IDB = Inter American Development
Bank; IFAD = International Fund for Agricultural Development, IFF = Intermediate Financing Facility, PBA = performance based allocation; PCEF is a post-conflict enhancement factor (1.13 to 1.30, maximum 1.5); POP = population; PORT = portfolio performance; RuralCPIA = IFAD’s performance rating on policies and institutions for rural development; SDF = Special Development Fund (Caribbean
Development Bank) ; SDR = IMF Special Drawing Rights; VUL = country vulnerability.
7 Indicates whether a scaling factor is applied to ensure that allocation shares add to one. The scaling factor is the sum over all countries of the product of the needs and performance factors shown in the preceding
columns.
RE
VIE
W O
F T
HE
UN
IFIE
D S
PE
CIA
L D
EV
EL
OP
ME
NT
FU
ND
RE
SO
UR
CE
AL
LO
CA
TIO
N S
YS
TE
M
AP
PE
ND
IX C
Pa
ge 2
of 1
1
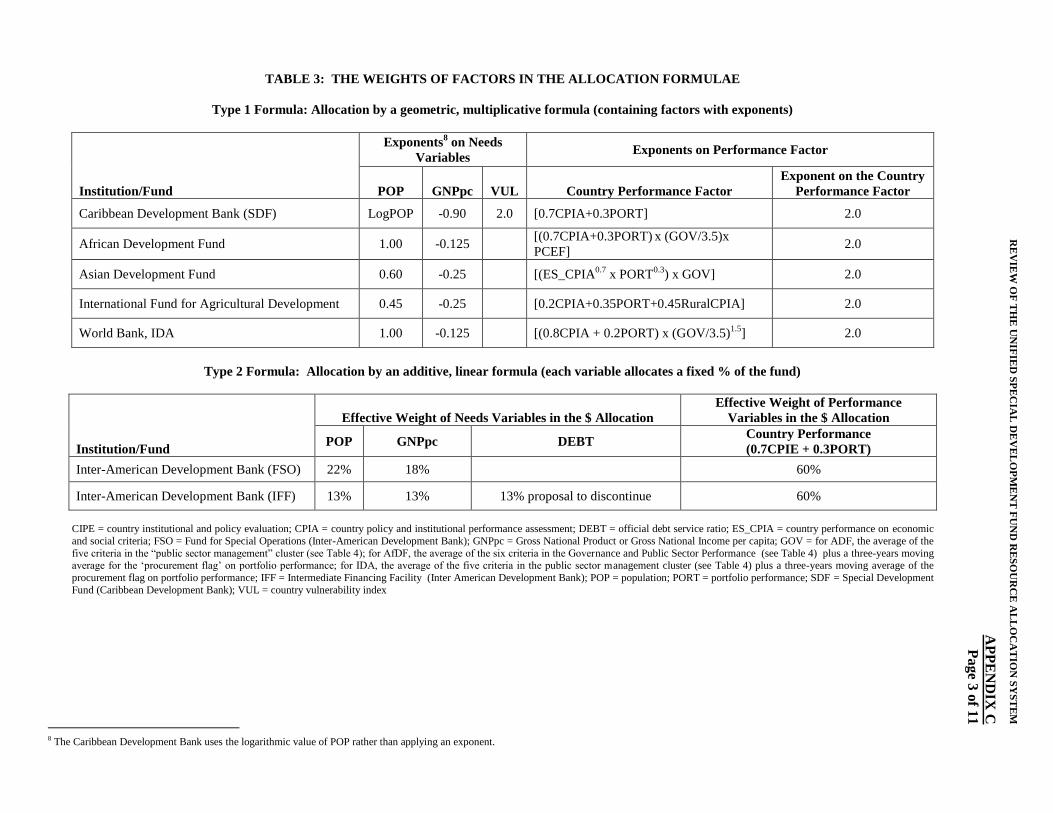
TABLE 3: THE WEIGHTS OF FACTORS IN THE ALLOCATION FORMULAE
Type 1 Formula: Allocation by a geometric, multiplicative formula (containing factors with exponents)
Institution/Fund
Exponents8 on Needs
Variables Exponents on Performance Factor
POP GNPpc VUL Country Performance Factor
Exponent on the Country
Performance Factor
Caribbean Development Bank (SDF) LogPOP -0.90 2.0 [0.7CPIA+0.3PORT] 2.0
African Development Fund 1.00 -0.125 [(0.7CPIA+0.3PORT)
x (GOV/3.5)x
PCEF] 2.0
Asian Development Fund 0.60 -0.25 [(ES_CPIA0.7
x PORT0.3
) x GOV] 2.0
International Fund for Agricultural Development 0.45 -0.25 [0.2CPIA+0.35PORT+0.45RuralCPIA] 2.0
World Bank, IDA 1.00 -0.125 [(0.8CPIA + 0.2PORT) x (GOV/3.5)1.5
] 2.0
Type 2 Formula: Allocation by an additive, linear formula (each variable allocates a fixed % of the fund)
Institution/Fund
Effective Weight of Needs Variables in the $ Allocation
Effective Weight of Performance
Variables in the $ Allocation
POP GNPpc DEBT Country Performance
(0.7CPIE + 0.3PORT)
Inter-American Development Bank (FSO) 22% 18% 60%
Inter-American Development Bank (IFF) 13% 13% 13% proposal to discontinue 60%
CIPE = country institutional and policy evaluation; CPIA = country policy and institutional performance assessment; DEBT = official debt service ratio; ES_CPIA = country performance on economic
and social criteria; FSO = Fund for Special Operations (Inter-American Development Bank); GNPpc = Gross National Product or Gross National Income per capita; GOV = for ADF, the average of the
five criteria in the “public sector management” cluster (see Table 4); for AfDF, the average of the six criteria in the Governance and Public Sector Performance (see Table 4) plus a three-years moving average for the ‘procurement flag’ on portfolio performance; for IDA, the average of the five criteria in the public sector management cluster (see Table 4) plus a three-years moving average of the
procurement flag on portfolio performance; IFF = Intermediate Financing Facility (Inter American Development Bank); POP = population; PORT = portfolio performance; SDF = Special Development
Fund (Caribbean Development Bank); VUL = country vulnerability index
8 The Caribbean Development Bank uses the logarithmic value of POP rather than applying an exponent.
RE
VIE
W O
F T
HE
UN
IFIE
D S
PE
CIA
L D
EV
EL
OP
ME
NT
FU
ND
RE
SO
UR
CE
AL
LO
CA
TIO
N S
YS
TE
M
AP
PE
ND
IX C
Pag
e 3 o
f 11
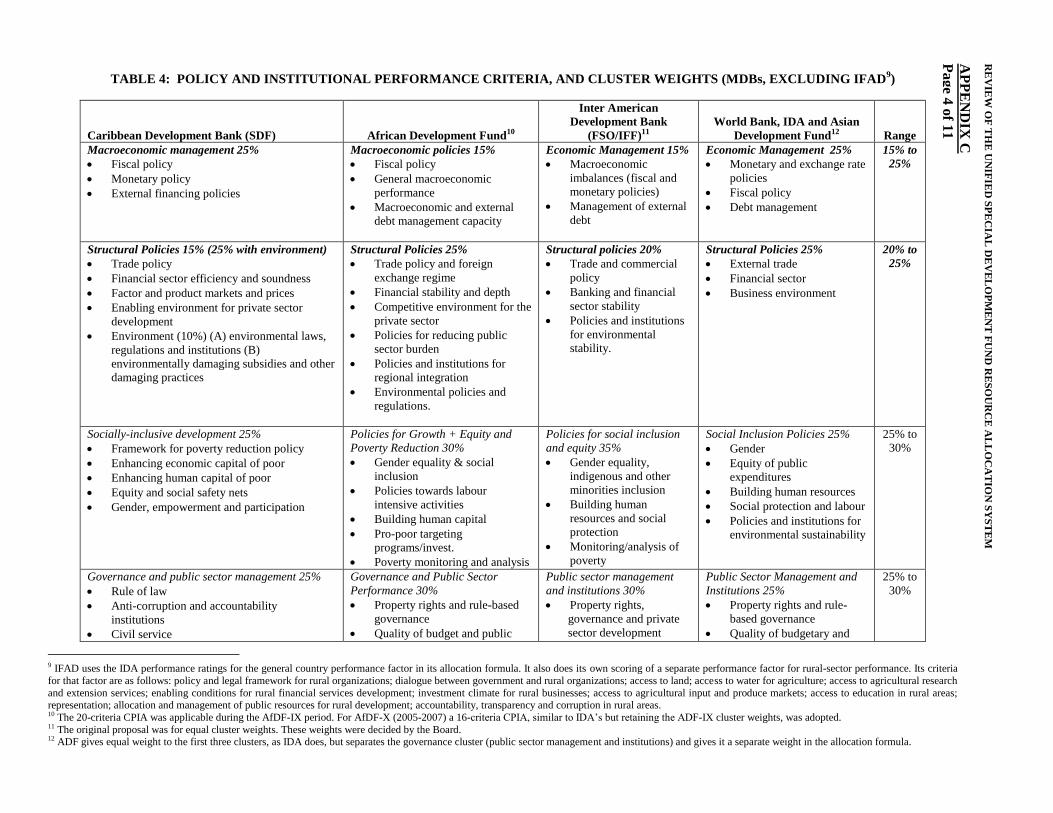
TABLE 4: POLICY AND INSTITUTIONAL PERFORMANCE CRITERIA, AND CLUSTER WEIGHTS (MDBs, EXCLUDING IFAD9)
Caribbean Development Bank (SDF) African Development Fund10
Inter American
Development Bank
(FSO/IFF)11
World Bank, IDA and Asian
Development Fund12 Range
Macroeconomic management 25%
Fiscal policy
Monetary policy
External financing policies
Macroeconomic policies 15%
Fiscal policy
General macroeconomic
performance
Macroeconomic and external
debt management capacity
Economic Management 15%
Macroeconomic
imbalances (fiscal and
monetary policies)
Management of external
debt
Economic Management 25%
Monetary and exchange rate
policies
Fiscal policy
Debt management
15% to
25%
Structural Policies 15% (25% with environment)
Trade policy
Financial sector efficiency and soundness
Factor and product markets and prices
Enabling environment for private sector
development
Environment (10%) (A) environmental laws,
regulations and institutions (B)
environmentally damaging subsidies and other
damaging practices
Structural Policies 25%
Trade policy and foreign
exchange regime
Financial stability and depth
Competitive environment for the
private sector
Policies for reducing public
sector burden
Policies and institutions for
regional integration
Environmental policies and
regulations.
Structural policies 20%
Trade and commercial
policy
Banking and financial
sector stability
Policies and institutions
for environmental
stability.
Structural Policies 25%
External trade
Financial sector
Business environment
20% to
25%
Socially-inclusive development 25%
Framework for poverty reduction policy
Enhancing economic capital of poor
Enhancing human capital of poor
Equity and social safety nets
Gender, empowerment and participation
Policies for Growth + Equity and
Poverty Reduction 30%
Gender equality & social
inclusion
Policies towards labour
intensive activities
Building human capital
Pro-poor targeting
programs/invest.
Poverty monitoring and analysis
Policies for social inclusion
and equity 35%
Gender equality,
indigenous and other
minorities inclusion
Building human
resources and social
protection
Monitoring/analysis of
poverty
Social Inclusion Policies 25%
Gender
Equity of public
expenditures
Building human resources
Social protection and labour
Policies and institutions for
environmental sustainability
25% to
30%
Governance and public sector management 25%
Rule of law
Anti-corruption and accountability
institutions
Civil service
Governance and Public Sector
Performance 30%
Property rights and rule-based
governance
Quality of budget and public
Public sector management
and institutions 30%
Property rights,
governance and private
sector development
Public Sector Management and
Institutions 25%
Property rights and rule-
based governance
Quality of budgetary and
25% to
30%
9 IFAD uses the IDA performance ratings for the general country performance factor in its allocation formula. It also does its own scoring of a separate performance factor for rural-sector performance. Its criteria
for that factor are as follows: policy and legal framework for rural organizations; dialogue between government and rural organizations; access to land; access to water for agriculture; access to agricultural research
and extension services; enabling conditions for rural financial services development; investment climate for rural businesses; access to agricultural input and produce markets; access to education in rural areas; representation; allocation and management of public resources for rural development; accountability, transparency and corruption in rural areas. 10 The 20-criteria CPIA was applicable during the AfDF-IX period. For AfDF-X (2005-2007) a 16-criteria CPIA, similar to IDA’s but retaining the ADF-IX cluster weights, was adopted. 11 The original proposal was for equal cluster weights. These weights were decided by the Board. 12 ADF gives equal weight to the first three clusters, as IDA does, but separates the governance cluster (public sector management and institutions) and gives it a separate weight in the allocation formula.
RE
VIE
W O
F T
HE
UN
IFIE
D S
PE
CIA
L D
EV
EL
OP
ME
NT
FU
ND
RE
SO
UR
CE
AL
LO
CA
TIO
N S
YS
TE
M
AP
PE
ND
IX C
Pa
ge 4
of 1
1
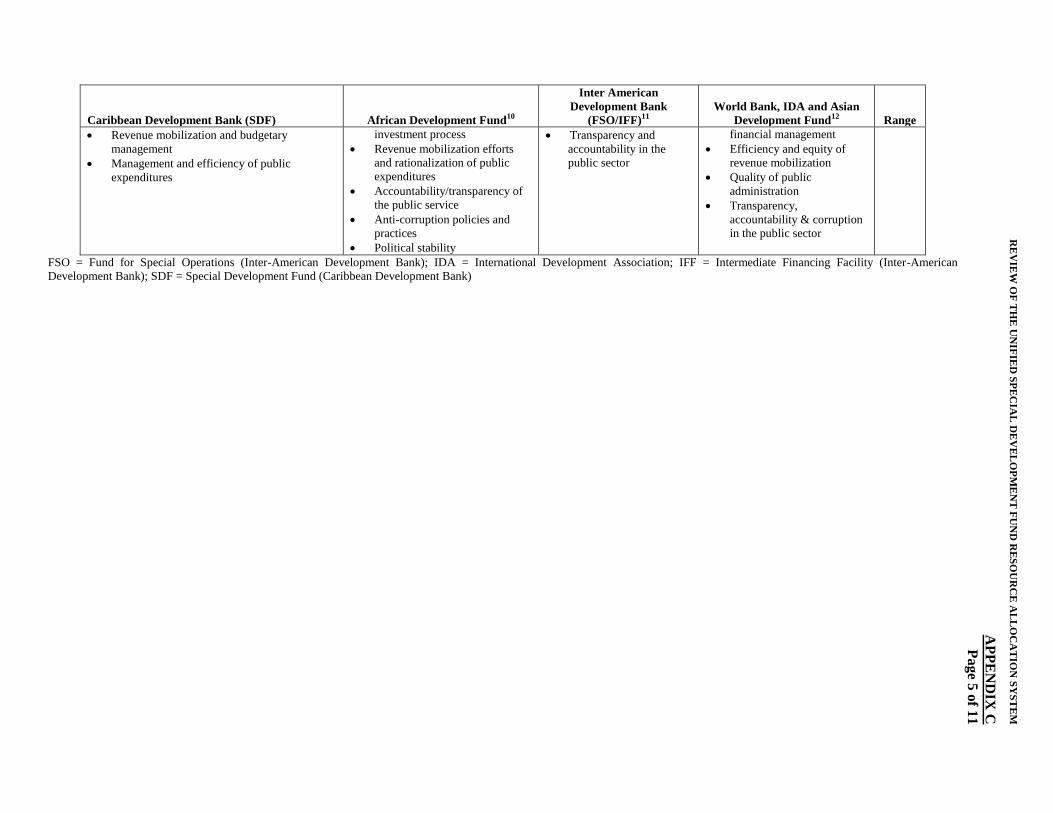
Caribbean Development Bank (SDF) African Development Fund10
Inter American
Development Bank
(FSO/IFF)11
World Bank, IDA and Asian
Development Fund12 Range
Revenue mobilization and budgetary
management
Management and efficiency of public
expenditures
investment process
Revenue mobilization efforts
and rationalization of public
expenditures
Accountability/transparency of
the public service
Anti-corruption policies and
practices
Political stability
Transparency and
accountability in the
public sector
financial management
Efficiency and equity of
revenue mobilization
Quality of public
administration
Transparency,
accountability & corruption
in the public sector
FSO = Fund for Special Operations (Inter-American Development Bank); IDA = International Development Association; IFF = Intermediate Financing Facility (Inter-American
Development Bank); SDF = Special Development Fund (Caribbean Development Bank)
RE
VIE
W O
F T
HE
UN
IFIE
D S
PE
CIA
L D
EV
EL
OP
ME
NT
FU
ND
RE
SO
UR
CE
AL
LO
CA
TIO
N S
YS
TE
M
AP
PE
ND
IX C
Pag
e 5 o
f 11
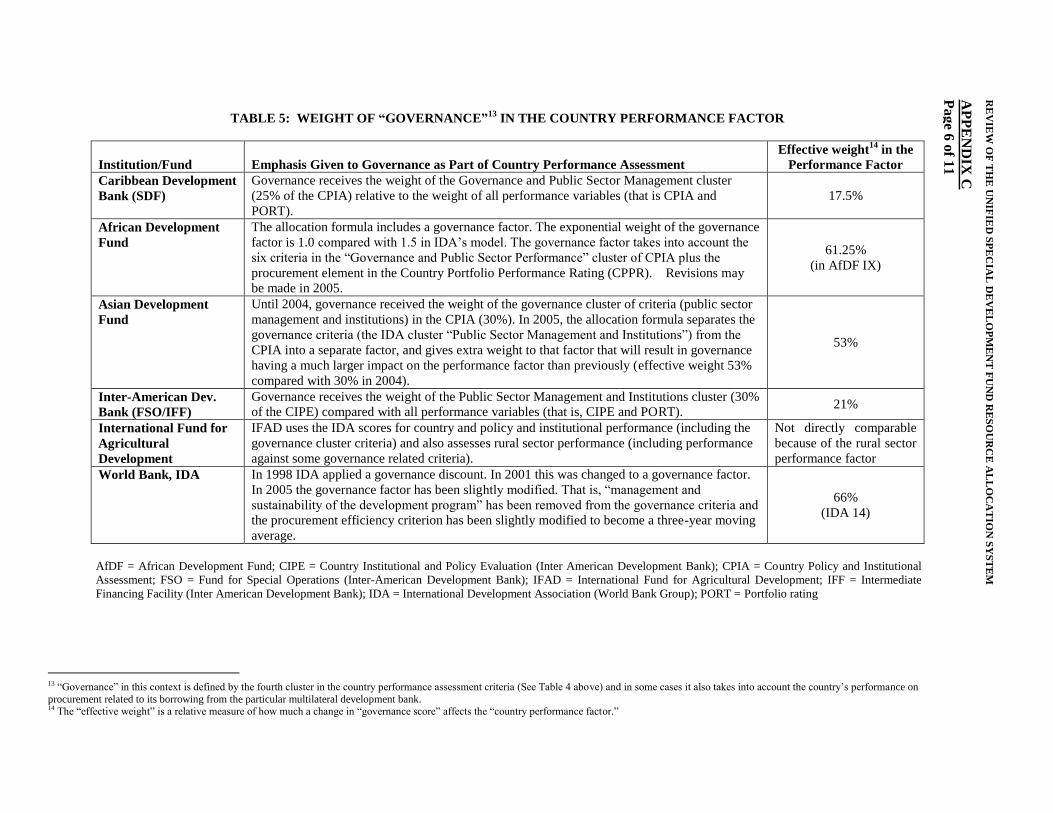
TABLE 5: WEIGHT OF “GOVERNANCE”13
IN THE COUNTRY PERFORMANCE FACTOR
Institution/Fund Emphasis Given to Governance as Part of Country Performance Assessment
Effective weight14
in the
Performance Factor
Caribbean Development
Bank (SDF)
Governance receives the weight of the Governance and Public Sector Management cluster
(25% of the CPIA) relative to the weight of all performance variables (that is CPIA and
PORT).
17.5%
African Development
Fund
The allocation formula includes a governance factor. The exponential weight of the governance
factor is 1.0 compared with 1.5 in IDA’s model. The governance factor takes into account the
six criteria in the “Governance and Public Sector Performance” cluster of CPIA plus the
procurement element in the Country Portfolio Performance Rating (CPPR). Revisions may
be made in 2005.
61.25%
(in AfDF IX)
Asian Development
Fund
Until 2004, governance received the weight of the governance cluster of criteria (public sector
management and institutions) in the CPIA (30%). In 2005, the allocation formula separates the
governance criteria (the IDA cluster “Public Sector Management and Institutions”) from the
CPIA into a separate factor, and gives extra weight to that factor that will result in governance
having a much larger impact on the performance factor than previously (effective weight 53%
compared with 30% in 2004).
53%
Inter-American Dev.
Bank (FSO/IFF)
Governance receives the weight of the Public Sector Management and Institutions cluster (30%
of the CIPE) compared with all performance variables (that is, CIPE and PORT). 21%
International Fund for
Agricultural
Development
IFAD uses the IDA scores for country and policy and institutional performance (including the
governance cluster criteria) and also assesses rural sector performance (including performance
against some governance related criteria).
Not directly comparable
because of the rural sector
performance factor
World Bank, IDA In 1998 IDA applied a governance discount. In 2001 this was changed to a governance factor.
In 2005 the governance factor has been slightly modified. That is, “management and
sustainability of the development program” has been removed from the governance criteria and
the procurement efficiency criterion has been slightly modified to become a three-year moving
average.
66%
(IDA 14)
AfDF = African Development Fund; CIPE = Country Institutional and Policy Evaluation (Inter American Development Bank); CPIA = Country Policy and Institutional
Assessment; FSO = Fund for Special Operations (Inter-American Development Bank); IFAD = International Fund for Agricultural Development; IFF = Intermediate
Financing Facility (Inter American Development Bank); IDA = International Development Association (World Bank Group); PORT = Portfolio rating
13 “Governance” in this context is defined by the fourth cluster in the country performance assessment criteria (See Table 4 above) and in some cases it also takes into account the country’s performance on
procurement related to its borrowing from the particular multilateral development bank. 14 The “effective weight” is a relative measure of how much a change in “governance score” affects the “country performance factor.”
RE
VIE
W O
F T
HE
UN
IFIE
D S
PE
CIA
L D
EV
EL
OP
ME
NT
FU
ND
RE
SO
UR
CE
AL
LO
CA
TIO
N S
YS
TE
M
AP
PE
ND
IX C
Pa
ge 6
of 1
1
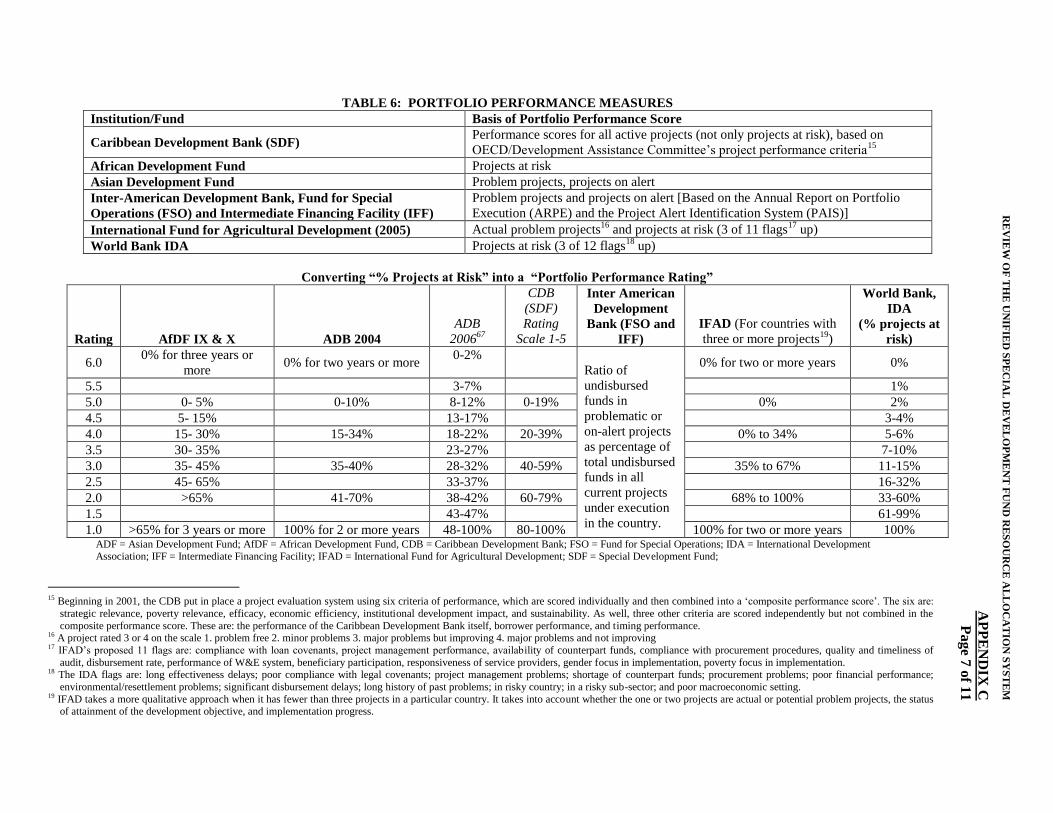
TABLE 6: PORTFOLIO PERFORMANCE MEASURES
Institution/Fund Basis of Portfolio Performance Score
Caribbean Development Bank (SDF) Performance scores for all active projects (not only projects at risk), based on
OECD/Development Assistance Committee’s project performance criteria15
African Development Fund Projects at risk
Asian Development Fund Problem projects, projects on alert
Inter-American Development Bank, Fund for Special
Operations (FSO) and Intermediate Financing Facility (IFF)
Problem projects and projects on alert [Based on the Annual Report on Portfolio
Execution (ARPE) and the Project Alert Identification System (PAIS)]
International Fund for Agricultural Development (2005) Actual problem projects16
and projects at risk (3 of 11 flags17
up)
World Bank IDA Projects at risk (3 of 12 flags18
up)
Converting “% Projects at Risk” into a “Portfolio Performance Rating”
Rating AfDF IX & X ADB 2004
ADB
200667
CDB
(SDF)
Rating
Scale 1-5
Inter American
Development
Bank (FSO and
IFF)
IFAD (For countries with
three or more projects19
)
World Bank,
IDA
(% projects at
risk)
6.0 0% for three years or
more 0% for two years or more
0-2%
Ratio of
undisbursed
funds in
problematic or
on-alert projects
as percentage of
total undisbursed
funds in all
current projects
under execution
in the country.
0% for two or more years 0%
5.5 3-7% 1%
5.0 0- 5% 0-10% 8-12% 0-19% 0% 2%
4.5 5- 15% 13-17% 3-4%
4.0 15- 30% 15-34% 18-22% 20-39% 0% to 34% 5-6%
3.5 30- 35% 23-27% 7-10%
3.0 35- 45% 35-40% 28-32% 40-59% 35% to 67% 11-15%
2.5 45- 65% 33-37% 16-32%
2.0 >65% 41-70% 38-42% 60-79% 68% to 100% 33-60%
1.5 43-47% 61-99%
1.0 >65% for 3 years or more 100% for 2 or more years 48-100% 80-100% 100% for two or more years 100% ADF = Asian Development Fund; AfDF = African Development Fund, CDB = Caribbean Development Bank; FSO = Fund for Special Operations; IDA = International Development Association; IFF = Intermediate Financing Facility; IFAD = International Fund for Agricultural Development; SDF = Special Development Fund;
15 Beginning in 2001, the CDB put in place a project evaluation system using six criteria of performance, which are scored individually and then combined into a ‘composite performance score’. The six are:
strategic relevance, poverty relevance, efficacy, economic efficiency, institutional development impact, and sustainability. As well, three other criteria are scored independently but not combined in the
composite performance score. These are: the performance of the Caribbean Development Bank itself, borrower performance, and timing performance. 16 A project rated 3 or 4 on the scale 1. problem free 2. minor problems 3. major problems but improving 4. major problems and not improving 17 IFAD’s proposed 11 flags are: compliance with loan covenants, project management performance, availability of counterpart funds, compliance with procurement procedures, quality and timeliness of
audit, disbursement rate, performance of W&E system, beneficiary participation, responsiveness of service providers, gender focus in implementation, poverty focus in implementation. 18 The IDA flags are: long effectiveness delays; poor compliance with legal covenants; project management problems; shortage of counterpart funds; procurement problems; poor financial performance;
environmental/resettlement problems; significant disbursement delays; long history of past problems; in risky country; in a risky sub-sector; and poor macroeconomic setting. 19 IFAD takes a more qualitative approach when it has fewer than three projects in a particular country. It takes into account whether the one or two projects are actual or potential problem projects, the status
of attainment of the development objective, and implementation progress.
RE
VIE
W O
F T
HE
UN
IFIE
D S
PE
CIA
L D
EV
EL
OP
ME
NT
FU
ND
RE
SO
UR
CE
AL
LO
CA
TIO
N S
YS
TE
M
AP
PE
ND
IX C
Pag
e 7 o
f 11
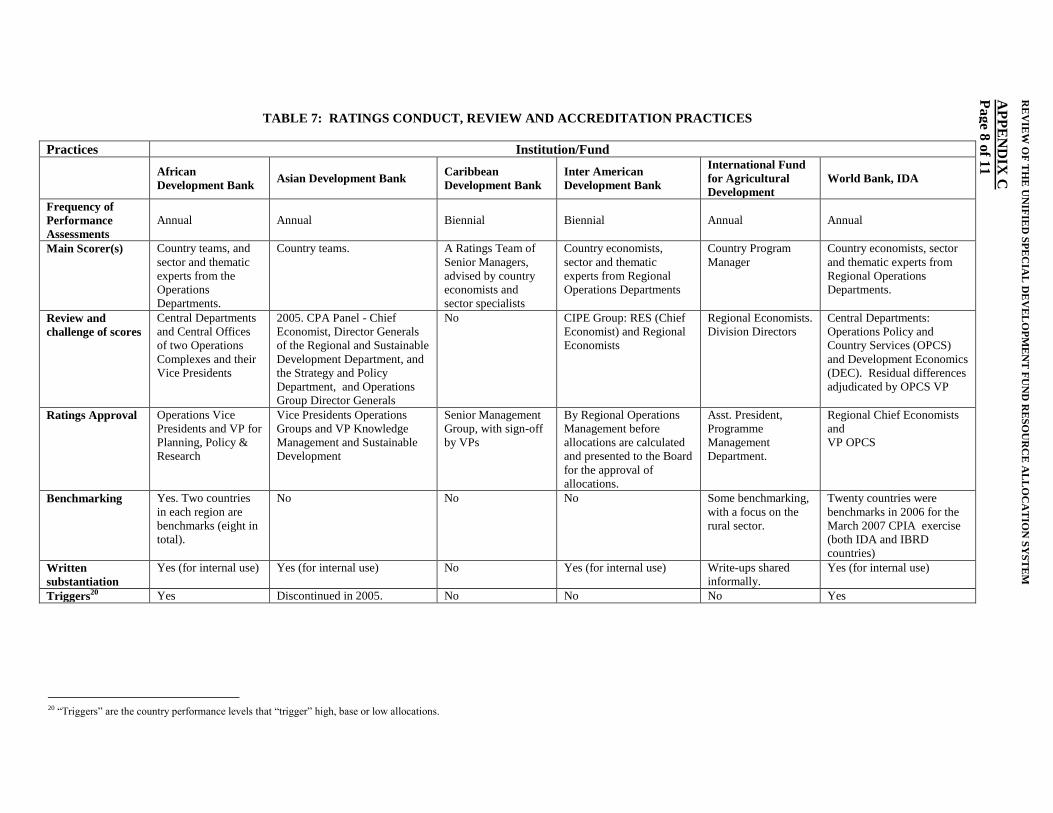
TABLE 7: RATINGS CONDUCT, REVIEW AND ACCREDITATION PRACTICES
Practices Institution/Fund
African
Development Bank Asian Development Bank
Caribbean
Development Bank
Inter American
Development Bank
International Fund
for Agricultural
Development
World Bank, IDA
Frequency of
Performance
Assessments
Annual Annual Biennial Biennial Annual Annual
Main Scorer(s) Country teams, and
sector and thematic
experts from the
Operations
Departments.
Country teams. A Ratings Team of
Senior Managers,
advised by country
economists and
sector specialists
Country economists,
sector and thematic
experts from Regional
Operations Departments
Country Program
Manager
Country economists, sector
and thematic experts from
Regional Operations
Departments.
Review and
challenge of scores
Central Departments
and Central Offices
of two Operations
Complexes and their
Vice Presidents
2005. CPA Panel - Chief
Economist, Director Generals
of the Regional and Sustainable
Development Department, and
the Strategy and Policy
Department, and Operations
Group Director Generals
No CIPE Group: RES (Chief
Economist) and Regional
Economists
Regional Economists.
Division Directors
Central Departments:
Operations Policy and
Country Services (OPCS)
and Development Economics
(DEC). Residual differences
adjudicated by OPCS VP
Ratings Approval Operations Vice
Presidents and VP for
Planning, Policy &
Research
Vice Presidents Operations
Groups and VP Knowledge
Management and Sustainable
Development
Senior Management
Group, with sign-off
by VPs
By Regional Operations
Management before
allocations are calculated
and presented to the Board
for the approval of
allocations.
Asst. President,
Programme
Management
Department.
Regional Chief Economists
and
VP OPCS
Benchmarking Yes. Two countries
in each region are
benchmarks (eight in
total).
No No No Some benchmarking,
with a focus on the
rural sector.
Twenty countries were
benchmarks in 2006 for the
March 2007 CPIA exercise
(both IDA and IBRD
countries)
Written
substantiation
Yes (for internal use) Yes (for internal use) No Yes (for internal use) Write-ups shared
informally.
Yes (for internal use)
Triggers20 Yes Discontinued in 2005. No No No Yes
20 “Triggers” are the country performance levels that “trigger” high, base or low allocations.
RE
VIE
W O
F T
HE
UN
IFIE
D S
PE
CIA
L D
EV
EL
OP
ME
NT
FU
ND
RE
SO
UR
CE
AL
LO
CA
TIO
N S
YS
TE
M
AP
PE
ND
IX C
Pa
ge 8
of 1
1

TABLE 8: ALLOCATION PARAMETERS Item
African Development
Fund Asian Development Fund
Caribbean
Development Bank
(SDF)
Inter-American
Development Bank
(FSO and IFF)
International Fund
for Agricultural
Development World Bank, IDA
Minimum
allocations
AfDF IX: SDR 5m AfDF X: To be
determined
No minimum, but not zero No minimum, zero is possible.
No minimum, but not zero
$US1 million p.a. In 2006 every country received an allocation of SDR 1.1
million in addition to its
formula-based allocation.68
Small country
preference
Minimum allocations favour smaller countries
Yes. Separate pool for Pacific countries;
formulate weight
moderates the influence of population on allocations
Yes. LogPOP used in the allocation formula
which lessens the
influence of larger populations
The performance-allocated dollars (60% of
the total Fund) are
distributed without attention to population
No Minimum allocations favour smaller countries
Separately
allocated pool of
funds for special
groups of countries
Yes, 95% of allocation for
38 AfDF only countries; 5% for two blend
countries
Yes. 4.5% of commitment
authority for Pacific developing member
countries with access to
fund.
Yes. New members
Haiti.
Two funds, different
eligible countries and levels of concessionality.
Until 2006 allocations
were made within, not across, regions. In 2007
the allocation
“competition” is worldwide.
No
Allocation caps or
ceilings
Yes, capped allocation for
one AfDF-only country: Ethiopia
Cap on countries that are
on the “graduation watch list” (only Indonesia at this
time)
Group 1 countries are
technically eligible for SDF up to the amount
of their own
contribution
No Single country
allocation limited to 5% of total available
lending resources
Capped allocations to three
blend countries: India, Pakistan, Indonesia
Set aside
(emergency and
disasters)
None from concessional AfDF resources. Some
from non-concessional
AfDB window
None. IDA 13 guidelines adopted. Softer terms post-
disaster.
$8 million (SDF 6) for natural disaster
response, (in part
available for major economic transitions,
emergencies, HIV/
AIDS) + $4 million for MDG-related projects
General reserve can be used for natural disaster
emergency lending.
No IDA13: Natural disaster grants up to $75 million per annum
IDA14: none
Set aside (priority
action areas, like
AIDS)
AfDF IX: 18-21% grants
for specified activities;
AfDF X: None
2% for HIV/AIDS on a
grant basis but within PBA
allocations.
No No IDA13: HIV AIDS grants
IDA14: none
Set aside (regional
projects)
AfDF IX: 10% for
multinational or regional projects. Increased in
AfDF X to 15%
Up to 5% of ADF
commitment authority (2005). Explicit eligibility
criteria provided.
$10 million (SDF VI) No No SDR300 million p/a (plus SDR
100 million out of participating country envelopes) (IDA 14)
Different allocation
rules for post-
conflict countries?
Yes, the country
performance rating is adjusted by a post-conflict
enhancement factor.21
ADB will adopt the IDA
13 post-conflict PBA Framework from 2005.
No N/A Under review Yes. Three years of special
consideration + four years transition.
Different allocation
rules for very
weakly performing
countries?
No Case by case consideration
but subject to an allocation
ceiling set by the PBA
formula.
No N/A No No
AfDF = African Development Fund; FSO = Fund for Special Operations (Inter-American Development Bank); IDA = International Development Association; IFF = Intermediate Financing Facility (Inter-
american Development Bank); SDR = Special Drawing Rights of IMF.
21 The post-conflict enhancement factor has an upper bound of 1.5, but actual range applied to seven eligible countries was 1.13 to 1.30 during ADF-IX cycle (2002-2004).
RE
VIE
W O
F T
HE
UN
IFIE
D S
PE
CIA
L D
EV
EL
OP
ME
NT
FU
ND
RE
SO
UR
CE
AL
LO
CA
TIO
N S
YS
TE
M
AP
PE
ND
IX C
Pa
ge 9
of 1
1
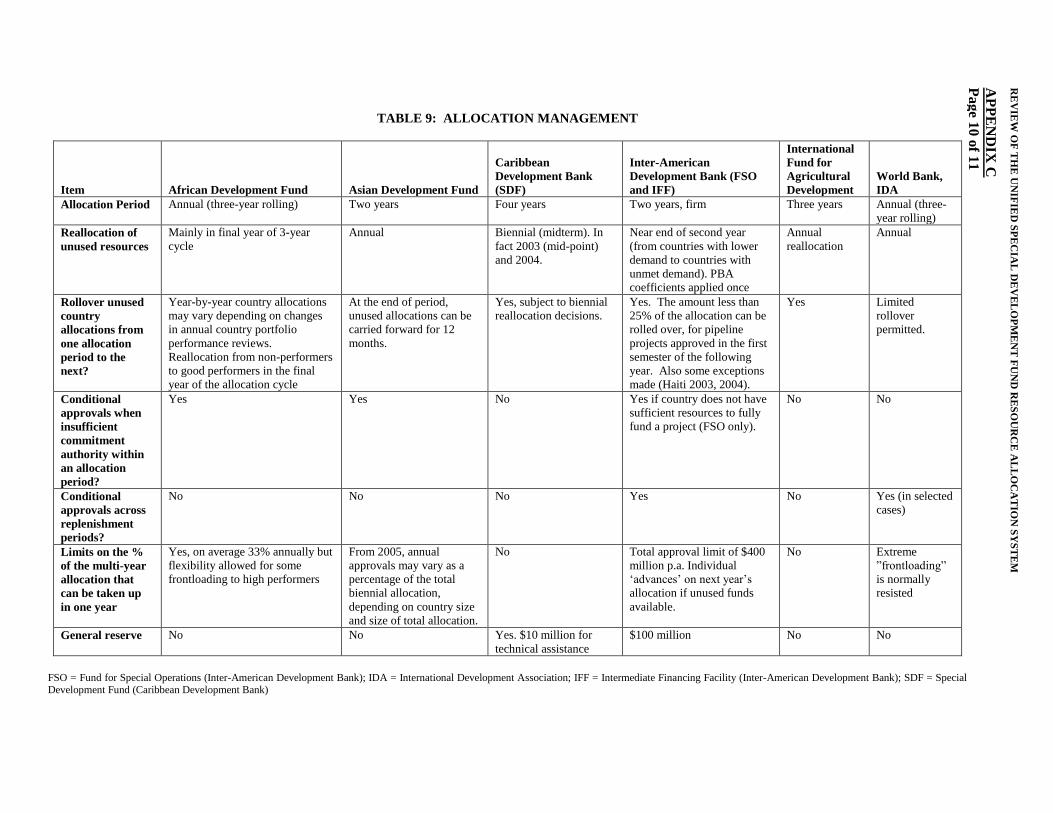
TABLE 9: ALLOCATION MANAGEMENT
Item African Development Fund Asian Development Fund
Caribbean
Development Bank
(SDF)
Inter-American
Development Bank (FSO
and IFF)
International
Fund for
Agricultural
Development
World Bank,
IDA
Allocation Period Annual (three-year rolling) Two years Four years Two years, firm Three years Annual (three-
year rolling)
Reallocation of
unused resources
Mainly in final year of 3-year
cycle
Annual Biennial (midterm). In
fact 2003 (mid-point)
and 2004.
Near end of second year
(from countries with lower
demand to countries with
unmet demand). PBA
coefficients applied once
Annual
reallocation
Annual
Rollover unused
country
allocations from
one allocation
period to the
next?
Year-by-year country allocations
may vary depending on changes
in annual country portfolio
performance reviews.
Reallocation from non-performers
to good performers in the final
year of the allocation cycle
At the end of period,
unused allocations can be
carried forward for 12
months.
Yes, subject to biennial
reallocation decisions.
Yes. The amount less than
25% of the allocation can be
rolled over, for pipeline
projects approved in the first
semester of the following
year. Also some exceptions
made (Haiti 2003, 2004).
Yes Limited
rollover
permitted.
Conditional
approvals when
insufficient
commitment
authority within
an allocation
period?
Yes Yes No Yes if country does not have
sufficient resources to fully
fund a project (FSO only).
No No
Conditional
approvals across
replenishment
periods?
No No No Yes No Yes (in selected
cases)
Limits on the %
of the multi-year
allocation that
can be taken up
in one year
Yes, on average 33% annually but
flexibility allowed for some
frontloading to high performers
From 2005, annual
approvals may vary as a
percentage of the total
biennial allocation,
depending on country size
and size of total allocation.
No Total approval limit of $400
million p.a. Individual
‘advances’ on next year’s
allocation if unused funds
available.
No Extreme
”frontloading”
is normally
resisted
General reserve No No Yes. $10 million for
technical assistance
$100 million No No
FSO = Fund for Special Operations (Inter-American Development Bank); IDA = International Development Association; IFF = Intermediate Financing Facility (Inter-American Development Bank); SDF = Special Development Fund (Caribbean Development Bank)
RE
VIE
W O
F T
HE
UN
IFIE
D S
PE
CIA
L D
EV
EL
OP
ME
NT
FU
ND
RE
SO
UR
CE
AL
LO
CA
TIO
N S
YS
TE
M
AP
PE
ND
IX C
Pa
ge 1
0 o
f 11
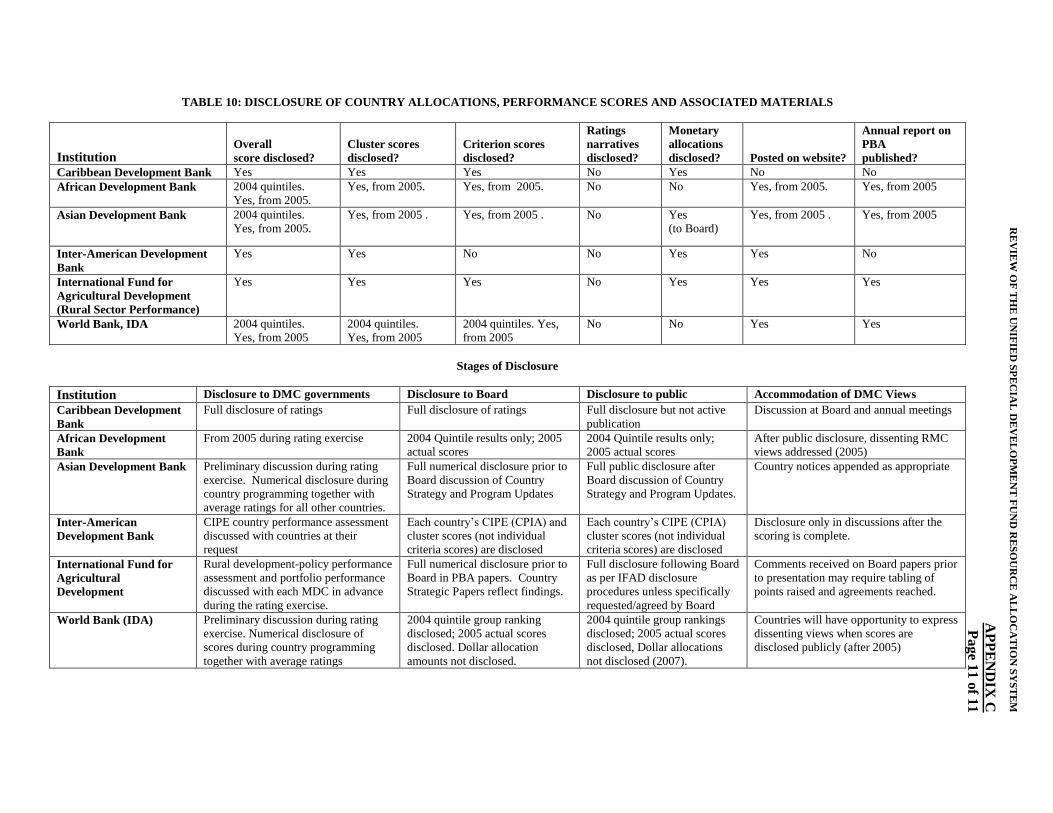
TABLE 10: DISCLOSURE OF COUNTRY ALLOCATIONS, PERFORMANCE SCORES AND ASSOCIATED MATERIALS
Institution Overall
score disclosed?
Cluster scores
disclosed?
Criterion scores
disclosed?
Ratings
narratives
disclosed?
Monetary
allocations
disclosed? Posted on website?
Annual report on
PBA
published?
Caribbean Development Bank Yes Yes Yes No Yes No No
African Development Bank 2004 quintiles.
Yes, from 2005.
Yes, from 2005. Yes, from 2005. No No Yes, from 2005. Yes, from 2005
Asian Development Bank 2004 quintiles.
Yes, from 2005.
Yes, from 2005 . Yes, from 2005 . No Yes
(to Board)
Yes, from 2005 . Yes, from 2005
Inter-American Development
Bank
Yes Yes No No Yes Yes No
International Fund for
Agricultural Development
(Rural Sector Performance)
Yes Yes Yes No Yes Yes Yes
World Bank, IDA 2004 quintiles.
Yes, from 2005
2004 quintiles.
Yes, from 2005
2004 quintiles. Yes,
from 2005
No No Yes Yes
Stages of Disclosure
Institution Disclosure to DMC governments Disclosure to Board Disclosure to public Accommodation of DMC Views
Caribbean Development
Bank
Full disclosure of ratings Full disclosure of ratings Full disclosure but not active
publication
Discussion at Board and annual meetings
African Development
Bank
From 2005 during rating exercise 2004 Quintile results only; 2005
actual scores
2004 Quintile results only;
2005 actual scores
After public disclosure, dissenting RMC
views addressed (2005)
Asian Development Bank Preliminary discussion during rating
exercise. Numerical disclosure during
country programming together with
average ratings for all other countries.
Full numerical disclosure prior to
Board discussion of Country
Strategy and Program Updates
Full public disclosure after
Board discussion of Country
Strategy and Program Updates.
Country notices appended as appropriate
Inter-American
Development Bank
CIPE country performance assessment
discussed with countries at their
request
Each country’s CIPE (CPIA) and
cluster scores (not individual
criteria scores) are disclosed
Each country’s CIPE (CPIA)
cluster scores (not individual
criteria scores) are disclosed
Disclosure only in discussions after the
scoring is complete.
International Fund for
Agricultural
Development
Rural development-policy performance
assessment and portfolio performance
discussed with each MDC in advance
during the rating exercise.
Full numerical disclosure prior to
Board in PBA papers. Country
Strategic Papers reflect findings.
Full disclosure following Board
as per IFAD disclosure
procedures unless specifically
requested/agreed by Board
Comments received on Board papers prior
to presentation may require tabling of
points raised and agreements reached.
World Bank (IDA) Preliminary discussion during rating
exercise. Numerical disclosure of
scores during country programming
together with average ratings
2004 quintile group ranking
disclosed; 2005 actual scores
disclosed. Dollar allocation
amounts not disclosed.
2004 quintile group rankings
disclosed; 2005 actual scores
disclosed, Dollar allocations
not disclosed (2007).
Countries will have opportunity to express
dissenting views when scores are
disclosed publicly (after 2005)
RE
VIE
W O
F T
HE
UN
IFIE
D S
PE
CIA
L D
EV
EL
OP
ME
NT
FU
ND
RE
SO
UR
CE
AL
LO
CA
TIO
N S
YS
TE
M
AP
PE
ND
IX C
Page 1
1 o
f 11
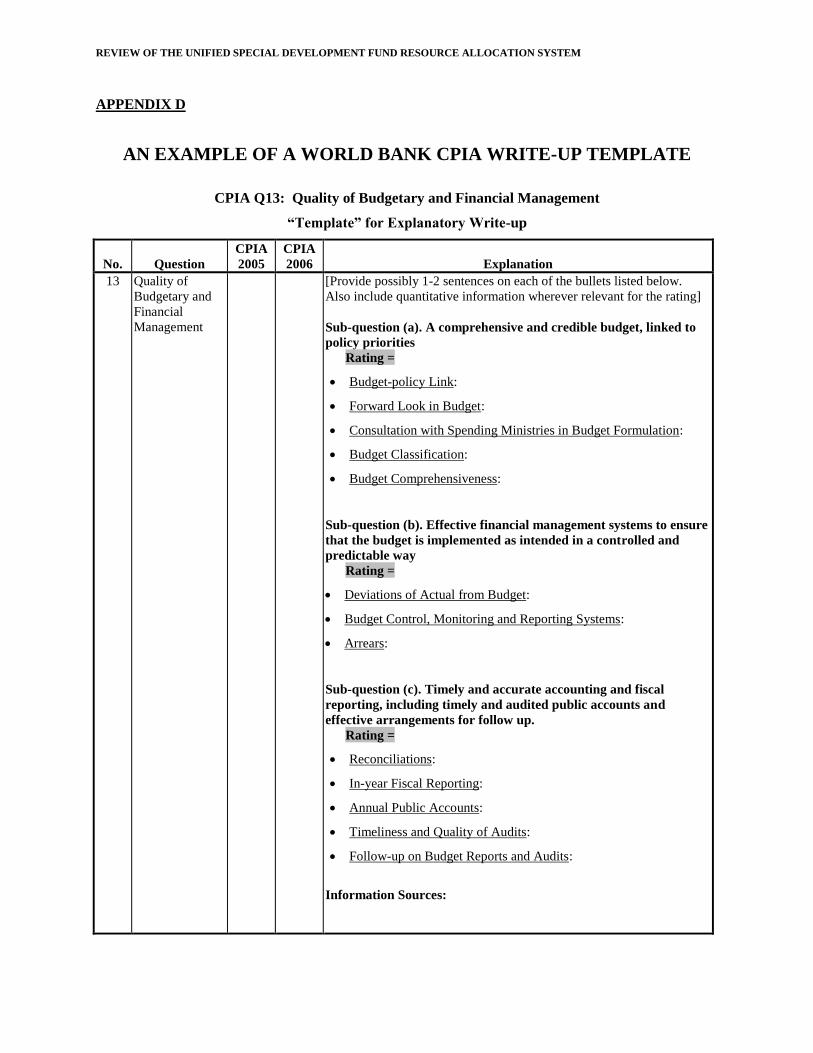
REVIEW OF THE UNIFIED SPECIAL DEVELOPMENT FUND RESOURCE ALLOCATION SYSTEM
APPENDIX D
AN EXAMPLE OF A WORLD BANK CPIA WRITE-UP TEMPLATE
CPIA Q13: Quality of Budgetary and Financial Management
“Template” for Explanatory Write-up
No. Question
CPIA
2005
CPIA
2006 Explanation
13 Quality of
Budgetary and
Financial
Management
[Provide possibly 1-2 sentences on each of the bullets listed below.
Also include quantitative information wherever relevant for the rating]
Sub-question (a). A comprehensive and credible budget, linked to
policy priorities
Rating =
Budget-policy Link:
Forward Look in Budget:
Consultation with Spending Ministries in Budget Formulation:
Budget Classification:
Budget Comprehensiveness:
Sub-question (b). Effective financial management systems to ensure
that the budget is implemented as intended in a controlled and
predictable way
Rating =
Deviations of Actual from Budget:
Budget Control, Monitoring and Reporting Systems:
Arrears:
Sub-question (c). Timely and accurate accounting and fiscal
reporting, including timely and audited public accounts and
effective arrangements for follow up.
Rating =
Reconciliations:
In-year Fiscal Reporting:
Annual Public Accounts:
Timeliness and Quality of Audits:
Follow-up on Budget Reports and Audits:
Information Sources:
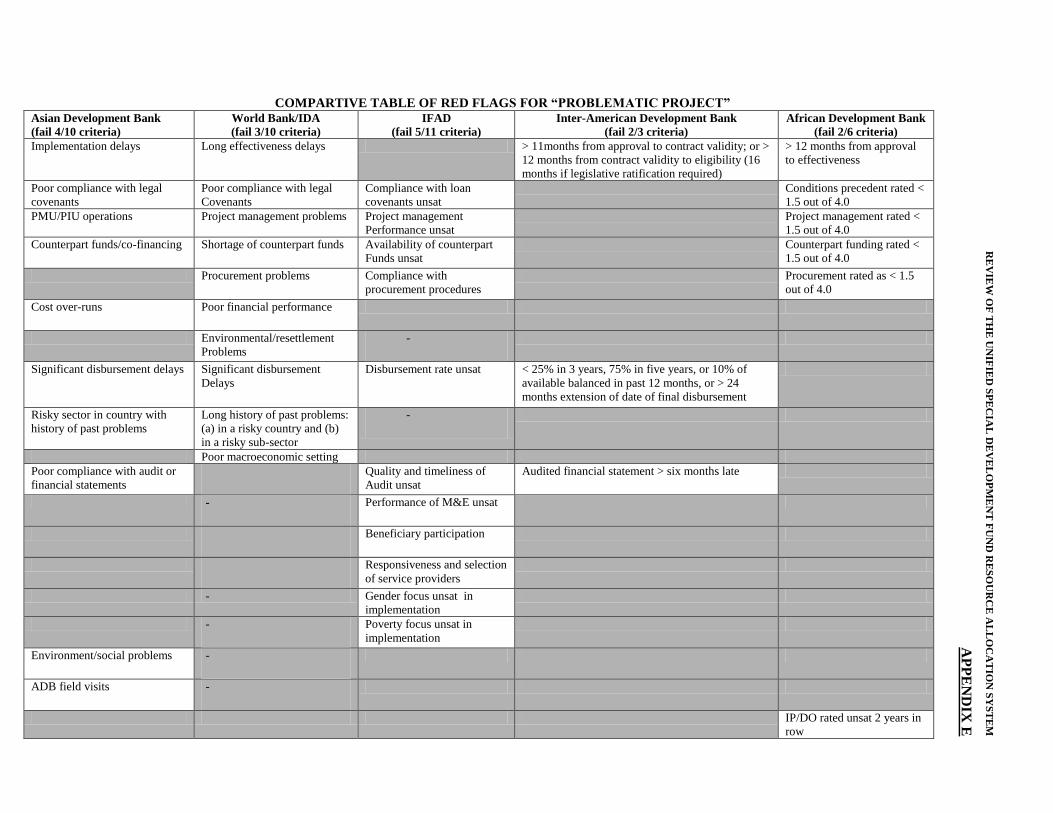
COMPARTIVE TABLE OF RED FLAGS FOR “PROBLEMATIC PROJECT”
Asian Development Bank
(fail 4/10 criteria)
World Bank/IDA
(fail 3/10 criteria)
IFAD
(fail 5/11 criteria)
Inter-American Development Bank
(fail 2/3 criteria)
African Development Bank
(fail 2/6 criteria)
Implementation delays Long effectiveness delays > 11months from approval to contract validity; or >
12 months from contract validity to eligibility (16
months if legislative ratification required)
> 12 months from approval
to effectiveness
Poor compliance with legal
covenants
Poor compliance with legal
Covenants
Compliance with loan
covenants unsat
Conditions precedent rated <
1.5 out of 4.0
PMU/PIU operations Project management problems Project management
Performance unsat
Project management rated <
1.5 out of 4.0
Counterpart funds/co-financing Shortage of counterpart funds Availability of counterpart
Funds unsat
Counterpart funding rated <
1.5 out of 4.0
Procurement problems Compliance with
procurement procedures
Procurement rated as < 1.5
out of 4.0
Cost over-runs Poor financial performance
Environmental/resettlement
Problems
-
Significant disbursement delays Significant disbursement
Delays
Disbursement rate unsat < 25% in 3 years, 75% in five years, or 10% of
available balanced in past 12 months, or > 24
months extension of date of final disbursement
Risky sector in country with
history of past problems
Long history of past problems:
(a) in a risky country and (b)
in a risky sub-sector
-
Poor macroeconomic setting
Poor compliance with audit or
financial statements
Quality and timeliness of
Audit unsat
Audited financial statement > six months late
- Performance of M&E unsat
Beneficiary participation
Responsiveness and selection
of service providers
- Gender focus unsat in
implementation
- Poverty focus unsat in
implementation
Environment/social problems -
ADB field visits -
IP/DO rated unsat 2 years in
row
RE
VIE
W O
F T
HE
UN
IFIE
D S
PE
CIA
L D
EV
EL
OP
ME
NT
FU
ND
RE
SO
UR
CE
AL
LO
CA
TIO
N S
YS
TE
M
AP
PE
ND
IX E
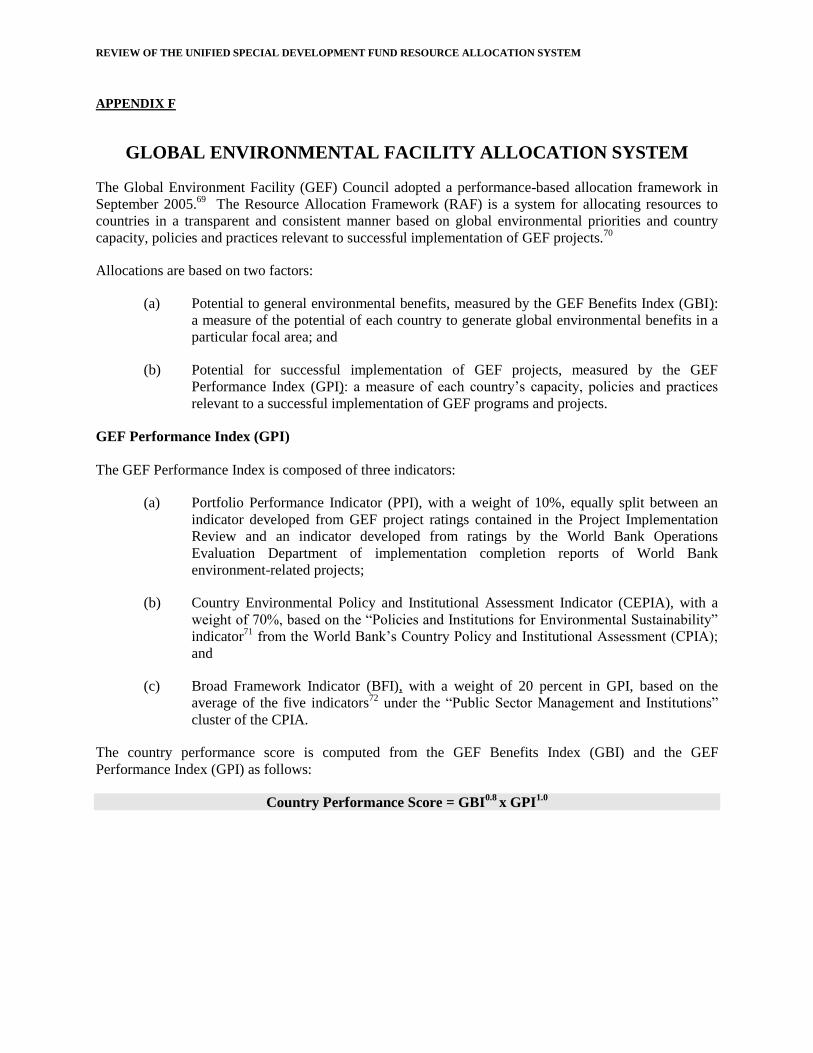
REVIEW OF THE UNIFIED SPECIAL DEVELOPMENT FUND RESOURCE ALLOCATION SYSTEM
APPENDIX F
GLOBAL ENVIRONMENTAL FACILITY ALLOCATION SYSTEM
The Global Environment Facility (GEF) Council adopted a performance-based allocation framework in
September 2005.69
The Resource Allocation Framework (RAF) is a system for allocating resources to
countries in a transparent and consistent manner based on global environmental priorities and country
capacity, policies and practices relevant to successful implementation of GEF projects.70
Allocations are based on two factors:
(a) Potential to general environmental benefits, measured by the GEF Benefits Index (GBI):
a measure of the potential of each country to generate global environmental benefits in a
particular focal area; and
(b) Potential for successful implementation of GEF projects, measured by the GEF
Performance Index (GPI): a measure of each country’s capacity, policies and practices
relevant to a successful implementation of GEF programs and projects.
GEF Performance Index (GPI)
The GEF Performance Index is composed of three indicators:
(a) Portfolio Performance Indicator (PPI), with a weight of 10%, equally split between an
indicator developed from GEF project ratings contained in the Project Implementation
Review and an indicator developed from ratings by the World Bank Operations
Evaluation Department of implementation completion reports of World Bank
environment-related projects;
(b) Country Environmental Policy and Institutional Assessment Indicator (CEPIA), with a
weight of 70%, based on the “Policies and Institutions for Environmental Sustainability”
indicator71
from the World Bank’s Country Policy and Institutional Assessment (CPIA);
and
(c) Broad Framework Indicator (BFI), with a weight of 20 percent in GPI, based on the
average of the five indicators72
under the “Public Sector Management and Institutions”
cluster of the CPIA.
The country performance score is computed from the GEF Benefits Index (GBI) and the GEF
Performance Index (GPI) as follows:
Country Performance Score = GBI0.8
x GPI1.0
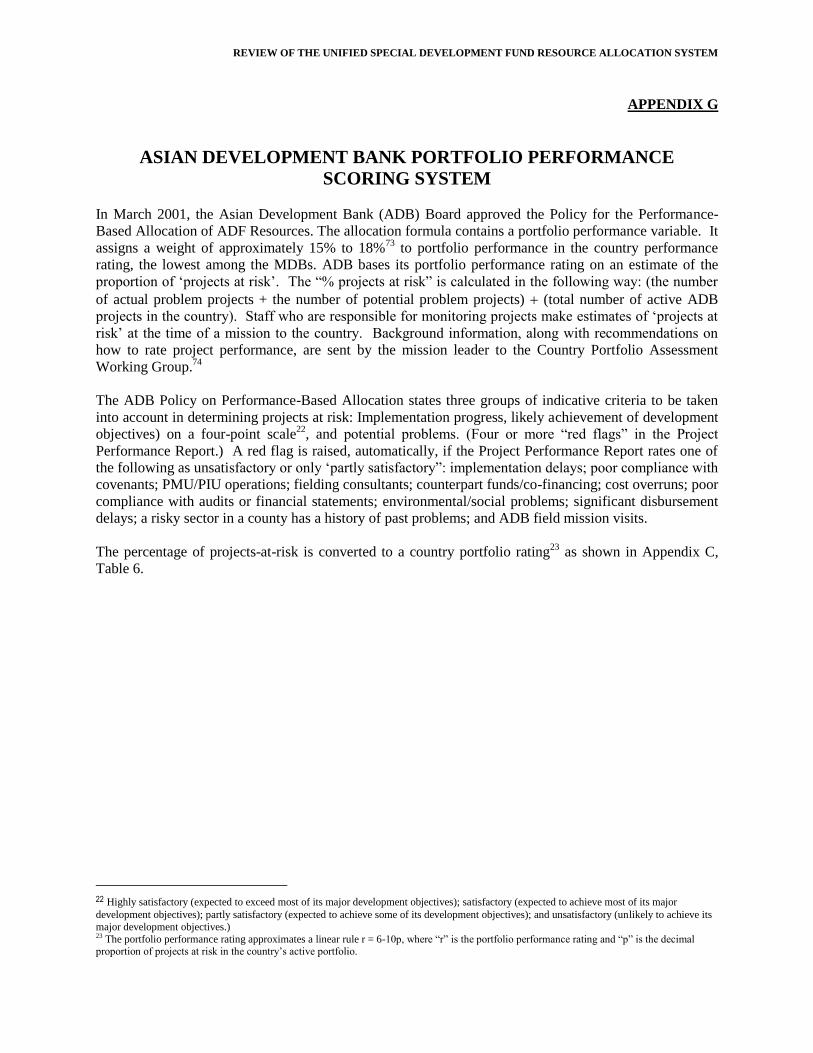
REVIEW OF THE UNIFIED SPECIAL DEVELOPMENT FUND RESOURCE ALLOCATION SYSTEM
APPENDIX G
ASIAN DEVELOPMENT BANK PORTFOLIO PERFORMANCE
SCORING SYSTEM
In March 2001, the Asian Development Bank (ADB) Board approved the Policy for the Performance-
Based Allocation of ADF Resources. The allocation formula contains a portfolio performance variable. It
assigns a weight of approximately 15% to 18%73
to portfolio performance in the country performance
rating, the lowest among the MDBs. ADB bases its portfolio performance rating on an estimate of the
proportion of ‘projects at risk’. The “% projects at risk” is calculated in the following way: (the number
of actual problem projects + the number of potential problem projects) (total number of active ADB
projects in the country). Staff who are responsible for monitoring projects make estimates of ‘projects at
risk’ at the time of a mission to the country. Background information, along with recommendations on
how to rate project performance, are sent by the mission leader to the Country Portfolio Assessment
Working Group.74
The ADB Policy on Performance-Based Allocation states three groups of indicative criteria to be taken
into account in determining projects at risk: Implementation progress, likely achievement of development
objectives) on a four-point scale22
, and potential problems. (Four or more “red flags” in the Project
Performance Report.) A red flag is raised, automatically, if the Project Performance Report rates one of
the following as unsatisfactory or only ‘partly satisfactory”: implementation delays; poor compliance with
covenants; PMU/PIU operations; fielding consultants; counterpart funds/co-financing; cost overruns; poor
compliance with audits or financial statements; environmental/social problems; significant disbursement
delays; a risky sector in a county has a history of past problems; and ADB field mission visits.
The percentage of projects-at-risk is converted to a country portfolio rating23
as shown in Appendix C,
Table 6.
22 Highly satisfactory (expected to exceed most of its major development objectives); satisfactory (expected to achieve most of its major
development objectives); partly satisfactory (expected to achieve some of its development objectives); and unsatisfactory (unlikely to achieve its
major development objectives.) 23 The portfolio performance rating approximates a linear rule r = 6-10p, where “r” is the portfolio performance rating and “p” is the decimal proportion of projects at risk in the country’s active portfolio.
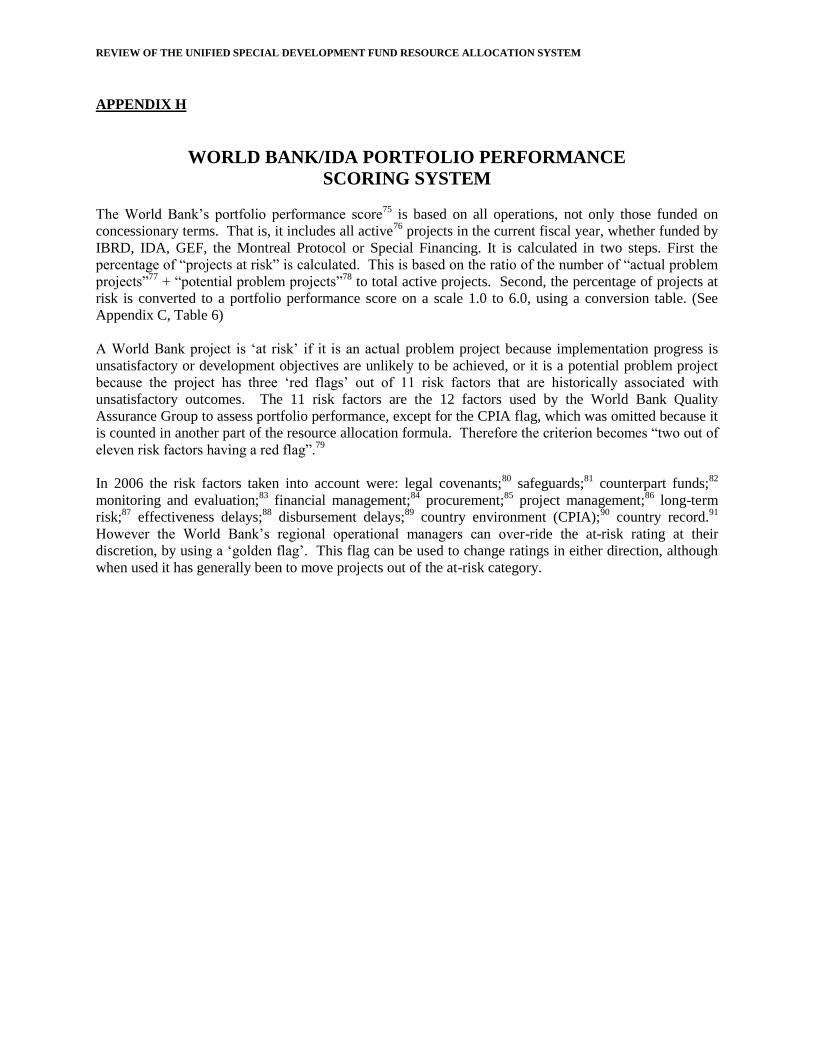
REVIEW OF THE UNIFIED SPECIAL DEVELOPMENT FUND RESOURCE ALLOCATION SYSTEM
APPENDIX H
WORLD BANK/IDA PORTFOLIO PERFORMANCE
SCORING SYSTEM
The World Bank’s portfolio performance score75
is based on all operations, not only those funded on
concessionary terms. That is, it includes all active76
projects in the current fiscal year, whether funded by
IBRD, IDA, GEF, the Montreal Protocol or Special Financing. It is calculated in two steps. First the
percentage of “projects at risk” is calculated. This is based on the ratio of the number of “actual problem
projects”77
+ “potential problem projects”78
to total active projects. Second, the percentage of projects at
risk is converted to a portfolio performance score on a scale 1.0 to 6.0, using a conversion table. (See
Appendix C, Table 6)
A World Bank project is ‘at risk’ if it is an actual problem project because implementation progress is
unsatisfactory or development objectives are unlikely to be achieved, or it is a potential problem project
because the project has three ‘red flags’ out of 11 risk factors that are historically associated with
unsatisfactory outcomes. The 11 risk factors are the 12 factors used by the World Bank Quality
Assurance Group to assess portfolio performance, except for the CPIA flag, which was omitted because it
is counted in another part of the resource allocation formula. Therefore the criterion becomes “two out of
eleven risk factors having a red flag”.79
In 2006 the risk factors taken into account were: legal covenants;80
safeguards;81
counterpart funds;82
monitoring and evaluation;83
financial management;84
procurement;85
project management;86
long-term
risk;87
effectiveness delays;88
disbursement delays;89
country environment (CPIA);90
country record.91
However the World Bank’s regional operational managers can over-ride the at-risk rating at their
discretion, by using a ‘golden flag’. This flag can be used to change ratings in either direction, although
when used it has generally been to move projects out of the at-risk category.

REVIEW OF THE UNIFIED SPECIAL DEVELOPMENT FUND RESOURCE ALLOCATION SYSTEM
APPENDIX I
INTER-AMERICAN DEVELOPMENT BANK APPROACH TO
PORTFOLIO PERFORMANCE SCORING
The Inter-American Development Bank (IDB) provides two sources of concessionary funding, the Fund
for Special Operations (FSO) and the Intermediate Financing Facility (IFF). The Fund for Special
Operations is restricted92
to the five poorest members of the Bank – Bolivia, Guyana, Haiti, Honduras and
Nicaragua. Approximately 32 million people live in these countries. In addition, a small amount has been
allocated to the Caribbean Development Bank for ‘on lending’ to the OECS countries. The Intermediate
Financing Facility was established during IDB-6 (1982). Currently, the eligible borrowers are Suriname
(among the C countries) and Ecuador, El Salvador, Guatemala and Paraguay (among the Group D1
countries). Approximately 39 million people live in these countries.
The IDB has a simple linear allocation formula that allocates 60% of its funds (FSO) entirely according to
the country performance rating. The IDB gives 30% weight to portfolio performance within the “country
performance rating” in the allocation formula, compared with policy and institutional performance (CIPE)
that receives 70% weight.
The active portfolio is defined as all projects approved by the Board of Executive Directors that had
outstanding undisbursed balances at the most recent year end, excluding the Project Preparation and
Execution Facility, export financing facilities, Mezzanine Investment Funds, MIF projects and non-
reimbursable technical cooperation.
IDB calculates a country’s portfolio performance differently from the other MDBs in two ways. First,
IDB does not convert raw percentages of problem/alert projects to a 1-6 scale using an arbitrary
equivalence table. Instead the IDB measures a country’s portfolio performance as the undisbursed amount
in problem or on-alert projects compared with the total amount undisbursed from all current projects in
the country (expressed as a percentage).93
Second, the raw scores are not used in the allocation formula
but are normalized relative to the average performance score. Since all variables in the allocation formula
are standardized in this way, it is relatively easy to understand intuitively the weights for each variable.
The other MDB’s conversion of percentage projects at risk to a 1-6 scale (or in the case of the CDB 1-5)
is a kind of partial normalization, since the policy/institutional performance variable is measured on the
same 1-6 or 1-5 scale. The current IDA effort to constrain the “volatility” of the portfolio performance
variable may be a further step towards normalization. However, the IDB method of normalization is less
arbitrary and has the advantage of being applied consistently to all of the variables in the allocation
formula, not only to the country performance variables.
In its early deliberations94
the IDB considered using “average age of a US$1.0 disbursed” as a portfolio
performance variable but decided against it.
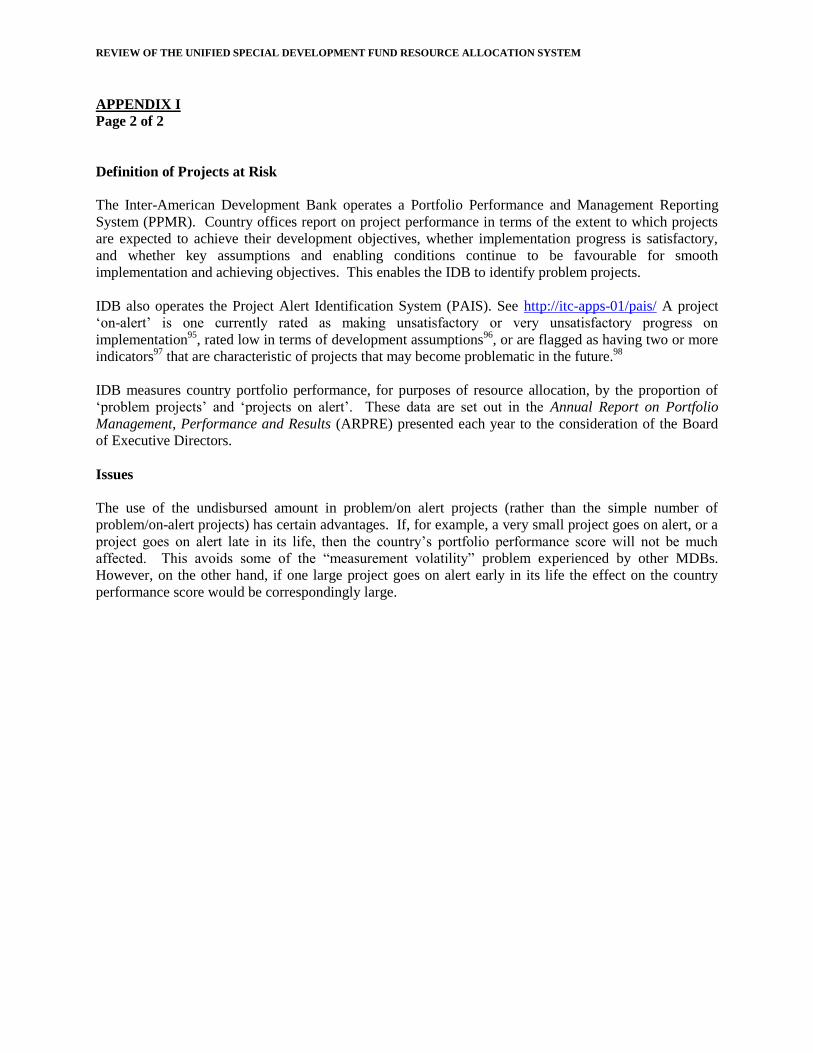
REVIEW OF THE UNIFIED SPECIAL DEVELOPMENT FUND RESOURCE ALLOCATION SYSTEM
APPENDIX I
Page 2 of 2
Definition of Projects at Risk
The Inter-American Development Bank operates a Portfolio Performance and Management Reporting
System (PPMR). Country offices report on project performance in terms of the extent to which projects
are expected to achieve their development objectives, whether implementation progress is satisfactory,
and whether key assumptions and enabling conditions continue to be favourable for smooth
implementation and achieving objectives. This enables the IDB to identify problem projects.
IDB also operates the Project Alert Identification System (PAIS). See http://itc-apps-01/pais/ A project
‘on-alert’ is one currently rated as making unsatisfactory or very unsatisfactory progress on
implementation95
, rated low in terms of development assumptions96
, or are flagged as having two or more
indicators97
that are characteristic of projects that may become problematic in the future.98
IDB measures country portfolio performance, for purposes of resource allocation, by the proportion of
‘problem projects’ and ‘projects on alert’. These data are set out in the Annual Report on Portfolio
Management, Performance and Results (ARPRE) presented each year to the consideration of the Board
of Executive Directors.
Issues
The use of the undisbursed amount in problem/on alert projects (rather than the simple number of
problem/on-alert projects) has certain advantages. If, for example, a very small project goes on alert, or a
project goes on alert late in its life, then the country’s portfolio performance score will not be much
affected. This avoids some of the “measurement volatility” problem experienced by other MDBs.
However, on the other hand, if one large project goes on alert early in its life the effect on the country
performance score would be correspondingly large.
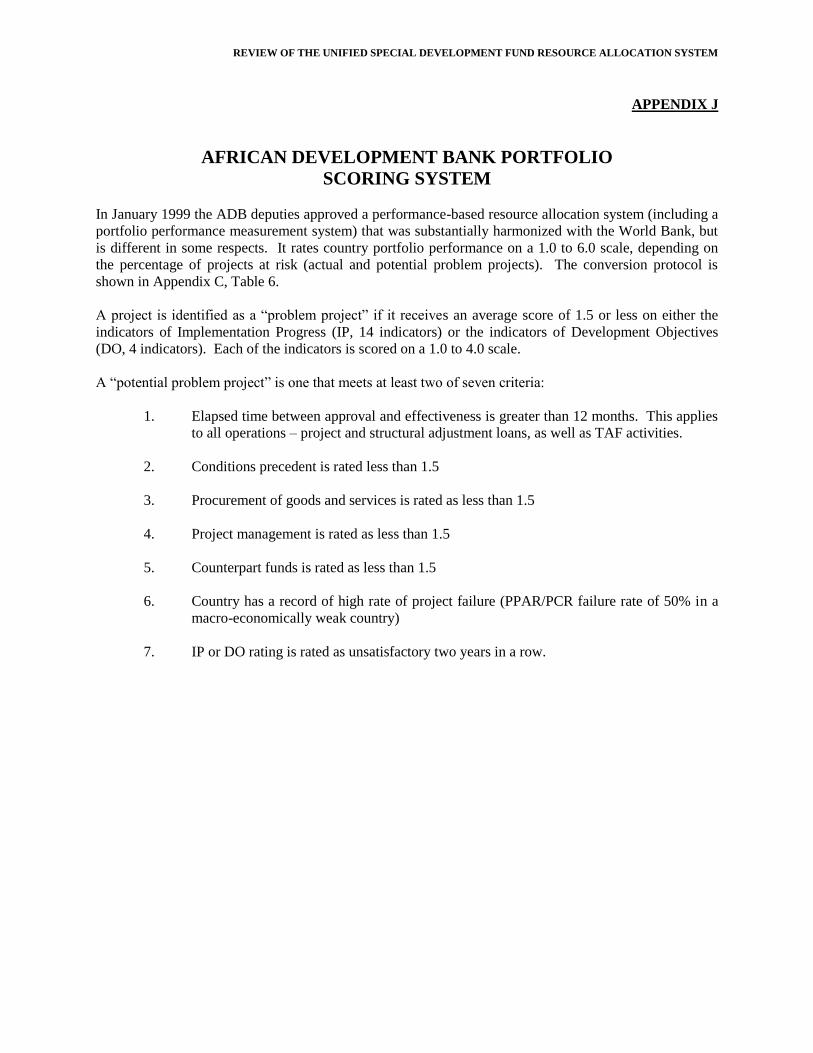
REVIEW OF THE UNIFIED SPECIAL DEVELOPMENT FUND RESOURCE ALLOCATION SYSTEM
APPENDIX J
AFRICAN DEVELOPMENT BANK PORTFOLIO
SCORING SYSTEM
In January 1999 the ADB deputies approved a performance-based resource allocation system (including a
portfolio performance measurement system) that was substantially harmonized with the World Bank, but
is different in some respects. It rates country portfolio performance on a 1.0 to 6.0 scale, depending on
the percentage of projects at risk (actual and potential problem projects). The conversion protocol is
shown in Appendix C, Table 6.
A project is identified as a “problem project” if it receives an average score of 1.5 or less on either the
indicators of Implementation Progress (IP, 14 indicators) or the indicators of Development Objectives
(DO, 4 indicators). Each of the indicators is scored on a 1.0 to 4.0 scale.
A “potential problem project” is one that meets at least two of seven criteria:
1. Elapsed time between approval and effectiveness is greater than 12 months. This applies
to all operations – project and structural adjustment loans, as well as TAF activities.
2. Conditions precedent is rated less than 1.5
3. Procurement of goods and services is rated as less than 1.5
4. Project management is rated as less than 1.5
5. Counterpart funds is rated as less than 1.5
6. Country has a record of high rate of project failure (PPAR/PCR failure rate of 50% in a
macro-economically weak country)
7. IP or DO rating is rated as unsatisfactory two years in a row.
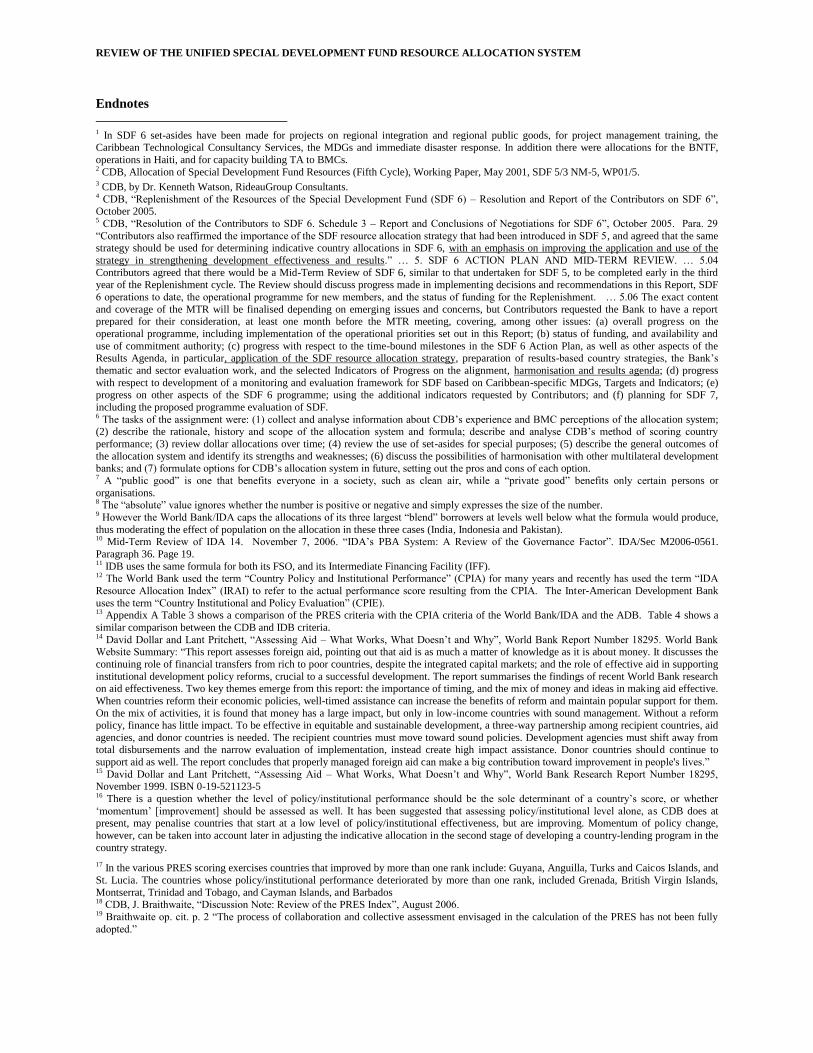
REVIEW OF THE UNIFIED SPECIAL DEVELOPMENT FUND RESOURCE ALLOCATION SYSTEM
Endnotes
1 In SDF 6 set-asides have been made for projects on regional integration and regional public goods, for project management training, the Caribbean Technological Consultancy Services, the MDGs and immediate disaster response. In addition there were allocations for the BNTF,
operations in Haiti, and for capacity building TA to BMCs. 2 CDB, Allocation of Special Development Fund Resources (Fifth Cycle), Working Paper, May 2001, SDF 5/3 NM-5, WP01/5. 3 CDB, by Dr. Kenneth Watson, RideauGroup Consultants. 4 CDB, “Replenishment of the Resources of the Special Development Fund (SDF 6) – Resolution and Report of the Contributors on SDF 6”, October 2005. 5 CDB, “Resolution of the Contributors to SDF 6. Schedule 3 – Report and Conclusions of Negotiations for SDF 6”, October 2005. Para. 29
“Contributors also reaffirmed the importance of the SDF resource allocation strategy that had been introduced in SDF 5, and agreed that the same strategy should be used for determining indicative country allocations in SDF 6, with an emphasis on improving the application and use of the
strategy in strengthening development effectiveness and results.” … 5. SDF 6 ACTION PLAN AND MID-TERM REVIEW. … 5.04
Contributors agreed that there would be a Mid-Term Review of SDF 6, similar to that undertaken for SDF 5, to be completed early in the third year of the Replenishment cycle. The Review should discuss progress made in implementing decisions and recommendations in this Report, SDF
6 operations to date, the operational programme for new members, and the status of funding for the Replenishment. … 5.06 The exact content
and coverage of the MTR will be finalised depending on emerging issues and concerns, but Contributors requested the Bank to have a report prepared for their consideration, at least one month before the MTR meeting, covering, among other issues: (a) overall progress on the
operational programme, including implementation of the operational priorities set out in this Report; (b) status of funding, and availability and
use of commitment authority; (c) progress with respect to the time-bound milestones in the SDF 6 Action Plan, as well as other aspects of the Results Agenda, in particular, application of the SDF resource allocation strategy, preparation of results-based country strategies, the Bank’s
thematic and sector evaluation work, and the selected Indicators of Progress on the alignment, harmonisation and results agenda; (d) progress
with respect to development of a monitoring and evaluation framework for SDF based on Caribbean-specific MDGs, Targets and Indicators; (e) progress on other aspects of the SDF 6 programme; using the additional indicators requested by Contributors; and (f) planning for SDF 7,
including the proposed programme evaluation of SDF. 6 The tasks of the assignment were: (1) collect and analyse information about CDB’s experience and BMC perceptions of the allocation system; (2) describe the rationale, history and scope of the allocation system and formula; describe and analyse CDB’s method of scoring country
performance; (3) review dollar allocations over time; (4) review the use of set-asides for special purposes; (5) describe the general outcomes of
the allocation system and identify its strengths and weaknesses; (6) discuss the possibilities of harmonisation with other multilateral development banks; and (7) formulate options for CDB’s allocation system in future, setting out the pros and cons of each option. 7 A “public good” is one that benefits everyone in a society, such as clean air, while a “private good” benefits only certain persons or
organisations. 8 The “absolute” value ignores whether the number is positive or negative and simply expresses the size of the number. 9 However the World Bank/IDA caps the allocations of its three largest “blend” borrowers at levels well below what the formula would produce,
thus moderating the effect of population on the allocation in these three cases (India, Indonesia and Pakistan). 10 Mid-Term Review of IDA 14. November 7, 2006. “IDA’s PBA System: A Review of the Governance Factor”. IDA/Sec M2006-0561.
Paragraph 36. Page 19. 11 IDB uses the same formula for both its FSO, and its Intermediate Financing Facility (IFF). 12 The World Bank used the term “Country Policy and Institutional Performance” (CPIA) for many years and recently has used the term “IDA
Resource Allocation Index” (IRAI) to refer to the actual performance score resulting from the CPIA. The Inter-American Development Bank
uses the term “Country Institutional and Policy Evaluation” (CPIE). 13 Appendix A Table 3 shows a comparison of the PRES criteria with the CPIA criteria of the World Bank/IDA and the ADB. Table 4 shows a
similar comparison between the CDB and IDB criteria. 14 David Dollar and Lant Pritchett, “Assessing Aid – What Works, What Doesn’t and Why”, World Bank Report Number 18295. World Bank Website Summary: “This report assesses foreign aid, pointing out that aid is as much a matter of knowledge as it is about money. It discusses the
continuing role of financial transfers from rich to poor countries, despite the integrated capital markets; and the role of effective aid in supporting
institutional development policy reforms, crucial to a successful development. The report summarises the findings of recent World Bank research on aid effectiveness. Two key themes emerge from this report: the importance of timing, and the mix of money and ideas in making aid effective.
When countries reform their economic policies, well-timed assistance can increase the benefits of reform and maintain popular support for them.
On the mix of activities, it is found that money has a large impact, but only in low-income countries with sound management. Without a reform policy, finance has little impact. To be effective in equitable and sustainable development, a three-way partnership among recipient countries, aid
agencies, and donor countries is needed. The recipient countries must move toward sound policies. Development agencies must shift away from total disbursements and the narrow evaluation of implementation, instead create high impact assistance. Donor countries should continue to
support aid as well. The report concludes that properly managed foreign aid can make a big contribution toward improvement in people's lives.” 15 David Dollar and Lant Pritchett, “Assessing Aid – What Works, What Doesn’t and Why”, World Bank Research Report Number 18295, November 1999. ISBN 0-19-521123-5 16 There is a question whether the level of policy/institutional performance should be the sole determinant of a country’s score, or whether
‘momentum’ [improvement] should be assessed as well. It has been suggested that assessing policy/institutional level alone, as CDB does at present, may penalise countries that start at a low level of policy/institutional effectiveness, but are improving. Momentum of policy change,
however, can be taken into account later in adjusting the indicative allocation in the second stage of developing a country-lending program in the
country strategy.
17 In the various PRES scoring exercises countries that improved by more than one rank include: Guyana, Anguilla, Turks and Caicos Islands, and
St. Lucia. The countries whose policy/institutional performance deteriorated by more than one rank, included Grenada, British Virgin Islands,
Montserrat, Trinidad and Tobago, and Cayman Islands, and Barbados 18 CDB, J. Braithwaite, “Discussion Note: Review of the PRES Index”, August 2006. 19 Braithwaite op. cit. p. 2 “The process of collaboration and collective assessment envisaged in the calculation of the PRES has not been fully
adopted.”
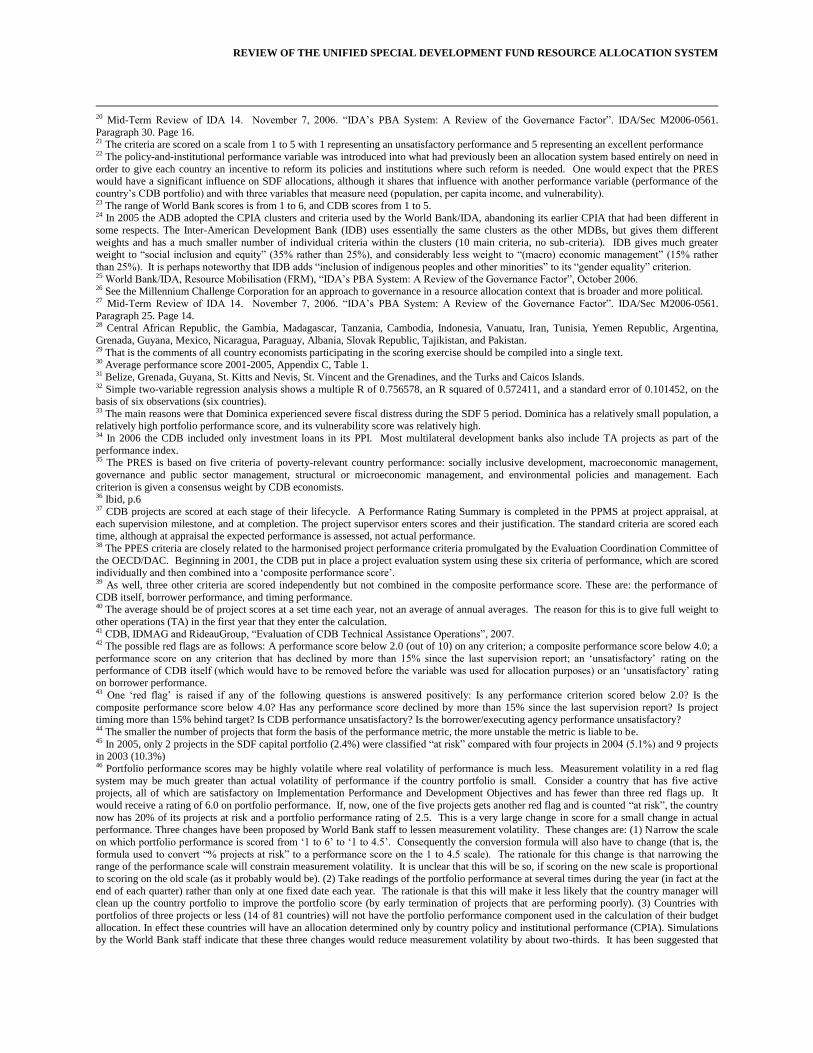
REVIEW OF THE UNIFIED SPECIAL DEVELOPMENT FUND RESOURCE ALLOCATION SYSTEM
20 Mid-Term Review of IDA 14. November 7, 2006. “IDA’s PBA System: A Review of the Governance Factor”. IDA/Sec M2006-0561.
Paragraph 30. Page 16. 21 The criteria are scored on a scale from 1 to 5 with 1 representing an unsatisfactory performance and 5 representing an excellent performance 22 The policy-and-institutional performance variable was introduced into what had previously been an allocation system based entirely on need in
order to give each country an incentive to reform its policies and institutions where such reform is needed. One would expect that the PRES would have a significant influence on SDF allocations, although it shares that influence with another performance variable (performance of the
country’s CDB portfolio) and with three variables that measure need (population, per capita income, and vulnerability). 23 The range of World Bank scores is from 1 to 6, and CDB scores from 1 to 5. 24 In 2005 the ADB adopted the CPIA clusters and criteria used by the World Bank/IDA, abandoning its earlier CPIA that had been different in
some respects. The Inter-American Development Bank (IDB) uses essentially the same clusters as the other MDBs, but gives them different
weights and has a much smaller number of individual criteria within the clusters (10 main criteria, no sub-criteria). IDB gives much greater weight to “social inclusion and equity” (35% rather than 25%), and considerably less weight to “(macro) economic management” (15% rather
than 25%). It is perhaps noteworthy that IDB adds “inclusion of indigenous peoples and other minorities” to its “gender equality” criterion. 25 World Bank/IDA, Resource Mobilisation (FRM), “IDA’s PBA System: A Review of the Governance Factor”, October 2006. 26 See the Millennium Challenge Corporation for an approach to governance in a resource allocation context that is broader and more political. 27 Mid-Term Review of IDA 14. November 7, 2006. “IDA’s PBA System: A Review of the Governance Factor”. IDA/Sec M2006-0561.
Paragraph 25. Page 14. 28 Central African Republic, the Gambia, Madagascar, Tanzania, Cambodia, Indonesia, Vanuatu, Iran, Tunisia, Yemen Republic, Argentina,
Grenada, Guyana, Mexico, Nicaragua, Paraguay, Albania, Slovak Republic, Tajikistan, and Pakistan. 29 That is the comments of all country economists participating in the scoring exercise should be compiled into a single text. 30 Average performance score 2001-2005, Appendix C, Table 1. 31 Belize, Grenada, Guyana, St. Kitts and Nevis, St. Vincent and the Grenadines, and the Turks and Caicos Islands. 32 Simple two-variable regression analysis shows a multiple R of 0.756578, an R squared of 0.572411, and a standard error of 0.101452, on the basis of six observations (six countries). 33 The main reasons were that Dominica experienced severe fiscal distress during the SDF 5 period. Dominica has a relatively small population, a relatively high portfolio performance score, and its vulnerability score was relatively high. 34 In 2006 the CDB included only investment loans in its PPI. Most multilateral development banks also include TA projects as part of the
performance index. 35 The PRES is based on five criteria of poverty-relevant country performance: socially inclusive development, macroeconomic management,
governance and public sector management, structural or microeconomic management, and environmental policies and management. Each
criterion is given a consensus weight by CDB economists. 36 Ibid, p.6 37 CDB projects are scored at each stage of their lifecycle. A Performance Rating Summary is completed in the PPMS at project appraisal, at
each supervision milestone, and at completion. The project supervisor enters scores and their justification. The standard criteria are scored each time, although at appraisal the expected performance is assessed, not actual performance. 38 The PPES criteria are closely related to the harmonised project performance criteria promulgated by the Evaluation Coordination Committee of
the OECD/DAC. Beginning in 2001, the CDB put in place a project evaluation system using these six criteria of performance, which are scored
individually and then combined into a ‘composite performance score’. 39 As well, three other criteria are scored independently but not combined in the composite performance score. These are: the performance of
CDB itself, borrower performance, and timing performance. 40 The average should be of project scores at a set time each year, not an average of annual averages. The reason for this is to give full weight to
other operations (TA) in the first year that they enter the calculation. 41 CDB, IDMAG and RideauGroup, “Evaluation of CDB Technical Assistance Operations”, 2007. 42 The possible red flags are as follows: A performance score below 2.0 (out of 10) on any criterion; a composite performance score below 4.0; a
performance score on any criterion that has declined by more than 15% since the last supervision report; an ‘unsatisfactory’ rating on the
performance of CDB itself (which would have to be removed before the variable was used for allocation purposes) or an ‘unsatisfactory’ rating on borrower performance. 43 One ‘red flag’ is raised if any of the following questions is answered positively: Is any performance criterion scored below 2.0? Is the
composite performance score below 4.0? Has any performance score declined by more than 15% since the last supervision report? Is project timing more than 15% behind target? Is CDB performance unsatisfactory? Is the borrower/executing agency performance unsatisfactory? 44 The smaller the number of projects that form the basis of the performance metric, the more unstable the metric is liable to be. 45 In 2005, only 2 projects in the SDF capital portfolio (2.4%) were classified “at risk” compared with four projects in 2004 (5.1%) and 9 projects in 2003 (10.3%) 46 Portfolio performance scores may be highly volatile where real volatility of performance is much less. Measurement volatility in a red flag
system may be much greater than actual volatility of performance if the country portfolio is small. Consider a country that has five active projects, all of which are satisfactory on Implementation Performance and Development Objectives and has fewer than three red flags up. It
would receive a rating of 6.0 on portfolio performance. If, now, one of the five projects gets another red flag and is counted “at risk”, the country
now has 20% of its projects at risk and a portfolio performance rating of 2.5. This is a very large change in score for a small change in actual performance. Three changes have been proposed by World Bank staff to lessen measurement volatility. These changes are: (1) Narrow the scale
on which portfolio performance is scored from ‘1 to 6’ to ‘1 to 4.5’. Consequently the conversion formula will also have to change (that is, the
formula used to convert “% projects at risk” to a performance score on the 1 to 4.5 scale). The rationale for this change is that narrowing the range of the performance scale will constrain measurement volatility. It is unclear that this will be so, if scoring on the new scale is proportional
to scoring on the old scale (as it probably would be). (2) Take readings of the portfolio performance at several times during the year (in fact at the
end of each quarter) rather than only at one fixed date each year. The rationale is that this will make it less likely that the country manager will clean up the country portfolio to improve the portfolio score (by early termination of projects that are performing poorly). (3) Countries with
portfolios of three projects or less (14 of 81 countries) will not have the portfolio performance component used in the calculation of their budget
allocation. In effect these countries will have an allocation determined only by country policy and institutional performance (CPIA). Simulations by the World Bank staff indicate that these three changes would reduce measurement volatility by about two-thirds. It has been suggested that
REVIEW OF THE UNIFIED SPECIAL DEVELOPMENT FUND RESOURCE ALLOCATION SYSTEM
the proposed changes will make the measurement volatility confirm more closely to the real volatility of performance, will better align the ratings
with portfolio norms46 and will better align the range of portfolio performance ratings with the range of CPIA ratings. 47 IDB considered another approach to the same issue, namely using “average age of a dollar disbursed” as a performance measure. 48 The percentage of projects at risk has improved markedly in the past five years, although the bulk of the improvement has been in potential
rather than actual problems so perhaps over-optimism is showing here. 49 “Net Disconnect” is defined as “The difference between the percentage of projects rated as satisfactory by Operations Evaluation Department
and the percentage rated by the Regions in the final Project Supervision Report as unsatisfactory for achieving the development objectives.”
World Bank, “Definitions, Classifications, and Data Sources”, p. 4. 50 The actual outcomes are measured for completed projects by Operations Evaluation Department of the World Bank a group that reports directly
to the Board. The ‘disconnect’ is measured globally and for individual countries and sectors. 51 Gross domestic product per capita. 52 CDB, J. Melville et al, “Revised Economic Vulnerability Index – 2002”, March 2006. 53 CDB, Natural Disaster Strategy and Operational Guidelines, April 1998. 54 See “Adapting IDA’s PBAs to Post-Conflict Countries”, May 2001 55 A minor qualification here is that “country performance” is the multiplicative factor in the World Band/IDA and CDB allocation formulas, but
the country performance score itself is the result of an addition of two weighted scores, one for policy-and-institutional performance and one for portfolio performance. 56 Mid-Term Review of IDA 14. November 7, 2006. “IDA’s PBA System: A Review of the Governance Factor”. IDA/Sec M2006-0561.
Paragraph 37. Page 20. 57 0.5 is the minimum possible change since the scoring scale is calibrated in 0.5 increments. 58 CDB, “Use of Grants in the Special Development Fund”, April 2005. SDF 6/1-EEN-4.Rev. 1. 59 CDB. IDMAG and RideauGroup Consultants, “Evaluation of TA Operations”, February 2007. 60 Op. Cit., paragraph 6.06 61 CDB, “Resolution of the Contributors to SDF 6. Schedule 3 – Report and Conclusions of Negotiations for SDF 6”, October 2005. Paragraph
6.06. 62 That is the comments of all country economists participating in the scoring exercise should be compiled into a single text. 63 The average should be of project scores at a set time each year, not an average of annual averages. The reason for this is to give full weight to other operations (TA) in the first year that they enter the calculation. 64 Portfolio performance scores may be highly volatile where real volatility of performance is much less. Measurement volatility in a red flag
system may be much greater than actual volatility of performance if the country portfolio is small. Consider a country that has five active projects, all of which are satisfactory on IP and DO and has fewer than three red flags up. It would receive a rating of 6.0 on portfolio
performance. If, now, one of the five projects gets another red flag and is counted “at risk”, the country now has 20% of its projects at risk and a
portfolio performance rating of 2.5. This is a very large change in score for a small change in actual performance. Three changes have been proposed by World Bank staff to lessen measurement volatility. These changes are: (1) Narrow the scale on which portfolio performance is
scored from ‘1 to 6’ to ‘1 to 4.5’. Consequently the conversion formula will also have to change (that is, the formula used to convert “% projects
at risk” to a performance score on the 1 to 4.5 scale). The rationale for this change is that narrowing the range of the performance scale will constrain measurement volatility. It is unclear that this will be so, if scoring on the new scale is proportional to scoring on the old scale (as it
probably would be). (2) Take readings of the portfolio performance at several times during the year (in fact at the end of each quarter) rather than
only at one fixed date each year. The rationale is that this will make it less likely that the country manager will clean up the country portfolio to improve the portfolio score (by early termination of projects that are performing poorly). (3) Countries with portfolios of three projects or less (14
of 81 countries) will not have the portfolio performance component used in the calculation of their budget allocation. In effect these countries will
have an allocation determined only by country policy and institutional performance (CPIA). Simulations by the World Bank staff indicate that these three changes would reduce measurement volatility by about two-thirds. It has been suggested that the proposed changes will make the
measurement volatility confirm more closely to the real volatility of performance, will better align the ratings with portfolio norms64 and will
better align the range of portfolio performance ratings with the range of CPIA ratings. 65 IDB considered another approach to the same issue, namely using “average age of a dollar disbursed” as a performance measure. 66 CDB, J. Melville et al, “Revised Economic Vulnerability Index – 2002”, March 2006. 67 This conversion scale is quoted in ADB “2005 Annual Report on ADB’s Country Performance Assessment Exercise”, March 2006. 68 The minimum allocation has been higher than the current figure. It was in 2004 SDR 3 million, for example. 69 As specified in the annex of the Joint Summary of the Chairs, Special Meeting of the GEF Council, August 30 – September 1, 2005. 70 The RAF will initially be applied to the focal areas of biodiversity and climate change. In GEF 3, these two focal areas together account for about two-thirds of the resources employed for programming in the GEF. 71 CPIA Indicator # 11. 72 CPIA Indicators # 12,13,14,15,16. 73 The weight of the portfolio performance factor in the allocation formula is expressed by its exponent which is 0.6. However the effective
weight varies, depending on the baseline situation of the country, as is always the case in a system that uses an exponential formula. 74 The Country Portfolio Assessment Working Group comprises regional department representatives, knowledge departments and central services department (COSO, which is responsible for ADB-wide portfolio management). 75 The use of a “portfolio performance” variable dates back not to the start of the World Bank/IDA allocation system but only to the mid-
1990s. During the IDA 10 negotiations, donors asked that borrowers’ portfolio performance (in their existing portfolios of IDA credits)
be taken into account in further resource allocations. Beginning in 1993, therefore, portfolio performance was given a weight of 20%
among the variables in the resource allocation formula, although, at this time, it was not a separate factor, but rather was one of the
criteria, among several, that comprised the measures of country performance. In 1995, the weighting of portfolio performance within the
country performance score was reduced to 10%, and then to 7% in 1997. When the country performance factor in the allocation
formula was redesigned in 1998, however, it was decided to have a separate portfolio performance factor outside the CPIA. Thereafter
there were two performance factors in country performance in the IDA allocation formula – portfolio performance, with a weight of
20%, and policy/institutional performance, with a weight of 80%. At the same time, the methods of measuring ‘portfolio performance’
were changed to address methodological problems. Previously the score for portfolio performance had been based on estimates of the
REVIEW OF THE UNIFIED SPECIAL DEVELOPMENT FUND RESOURCE ALLOCATION SYSTEM
proportion of ‘problem projects’ in the country portfolio. This was controversial. It was thought that project managers might be
reluctant to label a project a ‘problem’, despite growing difficulties and risks, especially if the result might be a loss of resources for their
country program. Therefore the World Bank began measuring ‘projects at risk’ in 1996, in addition to actual problem projects, and, in
1998, began using the data to help allocate IDA resources. The assessment of ‘projects at risk’ in a country is based upon the findings of
supervision missions and is updated after each mission, which generally occur about every six months. 76 Excluding all projects that had been cancelled or closed. 77 An “actual problem project” is one rated unsatisfactory on implementation progress or rated an unlikely to achieve its development objectives. 78 A “potential problem project”, although it is currently rated as satisfactory on IP and DO, has risk factors historically associated with unsatisfactory outcomes. 79 The definition of ‘red flags’ has changed over the years. For example, in response to recommendations in the FY99 Annual Review of Portfolio
Performance some ‘red flags’ were changed.79 80 Any of the critical legal covenants rated “not complied with” in the last ISR. 81 Ratings of MU, U or HU on any applicable safeguard policy in the last ISR. 82 Counterpart funding rated MU, U or HU in the last ISR. 83 Monitoring and evaluation rated MU, U or HU in the last ISR. 84 Financial management rated MU, U or HU in the last ISR. 85 Procurement rated MU, U or HU in the last ISR. 86 Project management rated MU, U or HU in the last ISR. 87 Project with IP or DO rated MU, U or HU for any 24 months cumulative during the life of the project. This flag is removed when the project
has been rated MS, S or DS for PIP and DO for the previous 24 months. 88 Elapsed time between Board approval and effectiveness of more than nine months for investment, more than six months for policy-based
lending and more than three months for emergency operations. This flag is turned off three years after Board approval.. 89 Disbursement delays of 24 months or more for investment operations. Delay is calculated based on the initial or formally revised disbursement schedule for the project. 90 Located in a country with weak economic management (CPIA rating of less than 3.0 on a scale of 1 to 6). Once flagged the CPIA must exceed 3.5 for the flag to be removed. This flag also includes countries which are in a conflict or post-conflict environment. 91 Located in a country with a net disconnect of 20% or more, or where net commitments associated with unsatisfactory projects, as rated by IEG,
represent more than 40% of commitments for completed projects over the previous five years. In cases where the sample of IEG evaluations is too small, ICR data, data on mature projects, and experience of other donors is used to arrive at a robust conclusion. This flag also captures
countries with less than satisfactory CAE ratings by IEG in the prior five fiscal years. 92 Since 1994 ( IDB-8). 93 Ibid, p.6 94 IDB, “Alternatives for a Performance-Based Allocation of FSO Resources and May 2001 Reallocation of Available FSO Resources”, Strategic
Planning and Budget Department, Washington DC, June 27, 2001, p.3 95 Implementation is ‘unsatisfactory’ is most significant components are not in compliance with the original or revised project implementation
and sequencing plan or there is a problem with the quality of the components. A serious delay in implementation of the project may be occurring.
Corrective actions are being taken that may produce results. A project is very unsatisfactory if no feasible corrective action has been identified or
there is no agreement with the executing agency on appropriate corrective actions. 96 The likelihood that the key assumptions will hold true in practice is classified as low based on the latest information. 97 Indicators include: Project has been under disbursement for more than 3 years and is less than 25% disbursed. Project has been under disbursement for more than five years and is less than 75% disbursed. Project took more than 12 months to achieve eligibility from date of
contract validity. Less than 10% of available balances disbursed in previous 12 months. Eleven or more months elapsed between Board approval
and contract validity in countries not requiring legislative ratification. Seventeen or more months elapsed between Board approval and contract validity in countries requiring legislative ratification. More than 24 months in extensions of date of final disbursement. More than 6 months delay
in presentation of audited financial statements. 98 IDB, ‘Proposal for a Performance-Based Allocation of FSO Resources’, Strategic Planning and Budget Department, June 6, 2002